Validation Report: WP5000 Assessment of SAMOSA3 · PDF fileValidation Report: WP5000...
35
Consortium Members ESA Cryosat Plus for Oceans Validation Report: WP5000 Assessment of SAMOSA3 SAR retracker (S3 DPM 2.3.0) Reference: CLS-DOS-NT-14-085 Nomenclature: CP4O-WP5000-VR-07 Issue: 1. 0 Date: May. 20, 14
Transcript of Validation Report: WP5000 Assessment of SAMOSA3 · PDF fileValidation Report: WP5000...

Consortium Members
ESA Cryosat Plus for Oceans
Validation Report: WP5000 Assessment of
SAMOSA3 SAR retracker (S3 DPM 2.3.0)
Reference: CLS-DOS-NT-14-085 Nomenclature: CP4O-WP5000-VR-07
Issue: 1. 0 Date: May. 20, 14

Validation Report: WP5000 Assessment of SAMOSA3 SAR retracker (S3 DPM 2.3.0)
CLS-DOS-NT-13-156 CP4O-PVR-XXX Issue 1.0 Jun. 18, 13 i.1
FORM
-NT-
GB-
7-1
FORM
-NT-
GB-
7-1
Chronology Issues:
Issue: Date: Reason for change: Author
1.0 20/05/14 Creation of Issue 1.0 document M. Raynal
T. Moreau
People involved in this issue:
Written by (*):
M. Raynal (CLS) T. Moreau (CLS)
Date + Initials:( visa or ref)
Checked by (*):
S. Labroue (CLS)
Date + Initial:( visa ou ref)
Approved by (*): F. Boy (CNES) Date + Initial:( visa ou ref)
Application authorized by (*):
(ESA)
N. Picot (CNES)
Date + Initial:( visa ou ref)
*In the opposite box: Last and First name of the person + company if different from CLS
Index Sheet:
Context:
Keywords: [Mots clés ]
Hyperlink:
Distribution:
Company Means of distribution
Names
CLS Notification

Validation Report: WP5000 Assessment of SAMOSA3 SAR retracker (S3 DPM 2.3.0)
CLS-DOS-NT-13-156 CP4O-PVR-XXX Issue 1.0 Jun. 18, 13 i.2
FORM
-NT-
GB-
7-1
FORM
-NT-
GB-
7-1
List of tables and figures
List of tables:
Aucune entrée de table d'illustration n'a été trouvée.
List of figures:
Figure 1: The mode mask, uploaded to CryoSat-2 in July 2012 (left panel) and January 2013 (right panel) (from http://cryosat.mssl.ucl.ac.uk/qa/mode.php) with the selected box areas. 2
Figure 2: Mean misfit curve for CPP (plotted in red) and S3 SAR retracker (plotted in yellow) as function of SWH in July 2012 (left panel) and January 2013 (right panel) over the Pacific + NE Atlantic SAR-mode areas. 5
Figure 3: Mean of waveforms residuals (plotted in blue) with respect to SAR models from the CPP retracking algorithm for various SWH ranges [SWH-0.1m;SWH+0.1m]. The Y axis is the ratio (in percentage) of the residuals compared to the maximum of the mean waveform. The number of averaged waveforms is indicated for each subplot. .............................. 6
Figure 4: Mean SLA spectrum for CPP (plotted in blue) and S3 SAR retracker (plotted in red) in January 2013 over the entire SAR-mode area. The abscissa represents the wavelengths (on the top of the plot) or equivalently the wavenumbers (1/km). ............................................. 8
Figure 5: S3 SAR retracker (in red) and CPP (in blue) SLA profiles in July 2012 over Pacific. .............................................................................. 8
Figure 6: Histogram of 20-Hz SLA for the S3 SAR retracker (in red) and CPP (in blue) in January 2013 (ascending passes). ......................................... 9
Figure 7: Dependencies of 20-Hz range residual with filtered SWH, in July 2012 (ascending passes). Density of points in right panel. .................... 10
Figure 8: Dependencies of 20-Hz range residual range with filtered SWH, in July 2012 (descending passes). Density of points in right panel. ............. 10
Figure 9: Dependencies of 20-Hz range residual with filtered SWH, in January 2013 (ascending passes). Density of points in right panel. .................... 10
Figure 10: Dependencies of 20-Hz range residual with filtered SWH, in January 2013 (descending passes). Density of points in right panel. ................... 11
Figure 11: Dependencies of 20-Hz range residual with filtered SWH and radial velocity in July 2012 (left panel) and January 2013 (right panel). .......... 11
Figure 12: Dependencies of 20-Hz range residual with across-track mispointing angle and filtered SWH in July 2012 (left panel) and January 2013 (right panel). .................................................................................... 12
Figure 13: Dependencies of 20-Hz range residual with along-track mispointing angle and filtered SWH in July 2012 (left panel) and January 2013 (right panel). .................................................................................... 12

Validation Report: WP5000 Assessment of SAMOSA3 SAR retracker (S3 DPM 2.3.0)
CLS-DOS-NT-13-156 CP4O-PVR-XXX Issue 1.0 Jun. 18, 13 i.3
FORM
-NT-
GB-
7-1
FORM
-NT-
GB-
7-1
Figure 14: Difference of range from S3 SAR and CPP retrackers (top panel) and map of SWH in July 2012 (bottom panel) for descending passes. ............ 13
Figure 15: Difference of range from S3 SAR and CPP retrackers (top panel) and map of SWH in January 2013 (bottom panel) for descending passes. ....... 14
Figure 16: SLA profiles from S3 SAR retracker (in red) and CPP (in blue) in July 2012 over the NE Atlantic. Shaded region corresponds to land. .............. 15
Figure 17: SLA statistics (mean, number of points, standard deviation) as function of the distance to the coast by using the S3 SAR (in blue) and CPP (in red) retrackers in ascending (left panel) and descending (right panel) passes. .................................................................................... 15
Figure 18: Mean SWH spectrum for CPP (plotted in blue) and S3 SAR retracker (plotted in red) in January 2013 over the entire SAR-mode area. The abscissa represents the wavelengths (on the top of the plot) or equivalently the wavenumbers (1/km). ............................................ 16
Figure 19: Histogram of 20-Hz SWH from S3 SAR retracker (in red) and CPP (in blue) in July 2012. ..................................................................... 17
Figure 20: Dependencies of 20-Hz SWH residual with filtered SWH, in January 2013. Density of points in right panel. ............................................. 17
Figure 21: Dependencies of 20-Hz SWH residual with filtered SWH and radial velocity in January 2013 for ascending (left panel) and descending (right panel) passes. ........................................................................... 18
Figure 22: Dependencies of 20-Hz SWH residual with across-track (left panel) and along-track (right panel) mispointing angle and filtered SWH in January 2013 for ascending passes. ................................................ 18
Figure 23: Difference of SWH from S3 SAR and CPP retrackers (top panel) and map of SWH in July 2012 (bottom panel) for descending passes. ............ 19
Figure 24: Difference of SWH from S3 SAR and CPP retrackers (top panel) and map of SWH in January 2013 (bottom panel) for ascending passes. ......... 20
Figure 25: Mean sigma0 spectrum for CPP (plotted in blue) and S3 SAR retracker (plotted in red) in January 2013 over the entire SAR-mode area. The abscissa represents the wavelengths (on the top of the plot) or equivalently the wavenumbers (1/km). ............................................ 21
Figure 26: Histogram of 20-Hz Sigma0 from S3 SAR retracker (in red) and CPP (in blue) in January 2013 for ascending (left panel) and descending (right panel) passes. ........................................................................... 21
Figure 27: Dependencies of 20-Hz sigma0 residual with filtered SWH, in July 2012 and January 2013. Density of points in right panel. ..................... 22
Figure 28: Dependencies of 20-Hz SIG0 residual (in dB unit) with filtered SWH and radial velocity in January 2013 for ascending (left panel) and descending (right panel) passes. .................................................... 23
Figure 29: Dependencies of 20-Hz sigma0 residual (in dB unit) with across-track (left panel) and along-track (right panel) mispointing angles and filtered SWH in January 2013 for descending passes. .......................... 23

Validation Report: WP5000 Assessment of SAMOSA3 SAR retracker (S3 DPM 2.3.0)
CLS-DOS-NT-13-156 CP4O-PVR-XXX Issue 1.0 Jun. 18, 13 i.4
FORM
-NT-
GB-
7-1
FORM
-NT-
GB-
7-1
Figure 30: Difference of sigma0 from S3 SAR and CPP retrackers (top panel), and maps of different parameters in the following order: SWH, across-track mispointing angle and radial velocity, in January 2013 for descending passes. ..................................................................... 25
Figure 31: Along-track sigma0 as function of latitude. Sigma0 from CPP SAR retracker is in blue, sigma0 from S3 SAR retracker in green and RDSAR-mode sigma0 in red. ................................................................... 26
Figure 32: Difference between smoothed SAR-mode sigma0 and RDSAR-mode sigma0 as function of SWH, in July 2012 and January 2013. The red curve represents the mean of this difference. ........................................... 27
Applicable documents
Reference documents
RD 1 Manuel du processus Documentation CLS-DOC

Validation Report: WP5000 Assessment of SAMOSA3 SAR retracker (S3 DPM 2.3.0)
CLS-DOS-NT-13-156 CP4O-PVR-XXX Issue 1.0 Jun. 18, 13 i.5
FORM
-NT-
GB-
7-1
FORM
-NT-
GB-
7-1
Acronyms List
CLS Collecte Localisation Satellite
CPP Cryosat Processing Protoype
DDM Delay Doppler Map
DPM Detail Processing Model
ESA European Space Agency
ESRIN European Space Research Institute
LRM Low Resolution Mode
NA Not Applicable
MQE Mean Quadratic Error
PAD Products and Algorithms Definition
PSD Power Spectral Density
PTR Point Target Response
RD Reference Document
RDSAR Reduced Synthetic Aperture radar
SAMOSA SAR Altimetry MOde Studies and Applications
SAR Synthetic Aperture radar
SIRAL Synthetic Aperture Interferometric Radar Altimeter
SLA Sea level Anomalies
SSH Sea Surface Haight
STM Surface Topography Mission
SWH Significant Wave Height

Validation Report: WP5000 Assessment of SAMOSA3 SAR retracker (S3 DPM 2.3.0)
CLS-DOS-NT-13-156 CP4O-PVR-XXX Issue 1.0 Jun. 18, 13 i.6
FORM
-NT-
GB-
7-1
FORM
-NT-
GB-
7-1
List of Contents
1. Introduction ................................................................................ 1
1.1. Purpose and scope .................................................................. 1
1.2. Document structure ................................................................. 1
2. Data and method overview .............................................................. 2
2.1. Data coverage and period .......................................................... 2
2.2. Method description .................................................................. 3
2.2.1. SAMOSA3 SAR retracker model (S3 DPM v2.3.0) .............................................. 3
2.2.2. CPP SAR numerical retracker ..................................................................... 3
2.2.3. Edited data ............................................................................................ 4
3. Validation results and overall assessment ............................................ 4
3.1. Performances of the waveform fitting .......................................... 5
3.1.1. Misfit analysis ......................................................................................... 5
3.1.2. Waveform residuals ................................................................................. 6
3.2. Comparison of range estimates ................................................... 7
3.2.1. Spectral analysis of the SLA ....................................................................... 7
3.2.2. SLA Histogram ........................................................................................ 9
3.2.3. Dependencies between parameters ............................................................. 9
3.2.4. SLA cartography .................................................................................... 12
3.2.5. SLA analysis in coastal ocean ................................................................... 14
3.3. Comparison of significant waveheight estimates ............................. 16
3.3.1. Spectral analysis of the SWH .................................................................... 16
3.3.2. SWH Histogram ..................................................................................... 16
3.3.3. Dependencies between parameters ........................................................... 17
3.3.4. SWH cartography ................................................................................... 19
3.4. Comparison of backscatter coefficient estimates ............................ 20
3.4.1. Spectral analysis of sigma0 ...................................................................... 20
3.4.2. Sigma0 Histogram .................................................................................. 21
3.4.3. Dependencies between parameters ........................................................... 22
3.4.4. Sigma0 cartography ............................................................................... 23
3.4.5. Comparison with RDSAR Sigma0 ................................................................ 26
4. Conclusion ................................................................................. 27
5. References ................................................................................. 28

Validation Report: WP5000 Assessment of SAMOSA3 SAR retracker (S3 DPM 2.3.0)
CLS-DOS-NT-13-156 CP4O-PVR-XXX Issue 1.0 Jun. 18, 13 1
FORM
-NT-
GB-
7-1
FORM
-NT-
GB-
7-1
1. Introduction
1.1. Purpose and scope
This document aims at analysing the SAMOSA3 SAR retracker (which forms the basis of the operational Sentinel-3 STM SAR-mode waveform retracking) for the CryoSat-2 mission, in comparison with the one implemented within the CPP chain that was statistically validated on real data. A set of dedicated diagnoses has been used to evaluate the quality of this retracking algorithm, and see if biases and noise performance computed for different estimated parameters are found to be consistent with those obtained from CPP or even better.
The description and the analysis of all the differences that are reported herein were discussed in a strong scientific collaboration with the algorithm expert/responsible who provides a very useful support to assess the performances of their algorithm, help to identify any unexpected behaviours and finally validate the content of this report.
1.2. Document structure
This document is structured into an introductory chapter followed by three chapters describing:
- the data used and coverage, and a short description of the two retracking algorithm to be compared (section 2),
- the analysis of the SAR L2 products through different diagnoses that are used to establish their performance (quantifying their skills and drawbacks) and their difference (section 3), and
- a discussion about these results (section 4).

Validation Report: WP5000 Assessment of SAMOSA3 SAR retracker (S3 DPM 2.3.0)
CLS-DOS-NT-13-156 CP4O-PVR-XXX Issue 1.0 Jun. 18, 13 2
FORM
-NT-
GB-
7-1
FORM
-NT-
GB-
7-1
2. Data and method overview
2.1. Data coverage and period
The S3 SAR retracker output was cross-compared with the validated CryoSat Processing Protoype (CPP) SAR L2 products over large areas operated in SAR mode: the equatorial Pacific and North East Atlantic oceans, for the following two periods: July 2012 and January 2013, as shown in Figure 1.
The equatorial Pacific area was selected by ESA among those proposed by an expert validation group, considering that the zone met the following criteria required:
1. low ocean variability (so easing the inter-mission calibration with conventional altimetry satellites like Jason 2),
2. few occurrences of rain and sigma-0 blooms events (which could have different impacts on SAR and RDSAR),
3. mean SWH around 2 meters and mean wind around 7 ms-1 (so the sea state is close to the mean conditions).
This site has been used for successfully validating the CPP SAR data, in comparison with the reduced SAR (RDSAR) data.
The North East Atlantic area is an additional pool of useful data with varying sea state conditions (very low wave heights in July and very high wave-heights in January), providing a much wider range of ocean wave heights for undertaking this study.
Figure 1: The mode mask, uploaded to CryoSat-2 in July 2012 (left panel) and January 2013 (right panel) (from
http://cryosat.mssl.ucl.ac.uk/qa/mode.php) with the selected box areas.
The 20-Hz geophysical parameters (range, significant wave height, and sigma-0) retracked by the S3 SAR retracker are obtained from the CPP multilooked echo power. These estimated parameters are thus generated at the same time and along-track location as the ones processed by the SAR CPP numerical retracker, allowing both retrievals to be directly subtracted without the need to apply any
Validation Report: WP5000 Assessment of SAMOSA3 SAR retracker (S3 DPM 2.3.0)
CLS-DOS-NT-13-156 CP4O-PVR-XXX Issue 1.0 Jun. 18, 13 3
FORM
-NT-
GB-
7-1
FORM
-NT-
GB-
7-1
geophysical model (e.g., wet and dry troposphere correction, ionosphere correction, tidal correction, dynamic atmospheric correction) or orbit elements (like the orbital ephemerides to derive a precise altitude) that may contribute to differences and lead to unclear conclusions regarding the comparison between the different processing approaches. This is especially true for the sea level anomaly (SLA) and other altimeter derived products like the wind measurements that account for corrections and/or models.
2.2. Method description
2.2.1. SAMOSA3 SAR retracker model (S3 DPM v2.3.0)
At present the SAMOSA3 model and retracker [Gommenginger et al., 2012] are envisaged to operationally retrack SAR-mode L1b ocean waveforms for the Sentinel-3 Surface Topography Mission (STM).
The SAMOSA3 model and retracker have several features as:
- a physically-based model developed by Starlab from first principles,
- pure analytical (by Bessel Functions) solutions to model the Delay Doppler Maps (DDM) for the full span of Doppler frequencies, having the advantage to be computationally fast and robust,
- a model which depends on epoch, significant wave height, amplitude, surface rms slope, and mispointing angles,
- model independent variables: the Doppler frequency and the time delay,
- a least-square fitting algorithm (Levenberg-Marquard) to retrack the waveforms.
2.2.2. CPP SAR numerical retracker
The CPP SAR numerical retracker [Boy and Moreau, 2013] is a standard least squares estimator (LSE) consisting in fitting a multi-looked SAR waveform with a 3-parameters echo model (range, significant wave height, amplitude), that is pre-computed off-line by an amplitude numerical simulator [Desjonquères et al., 2012].
The amplitude simulator model mimics the Cryosat-2 altimeter response in SAR-mode (taking into account the real elliptical antenna pattern and a real point target response). It is based on a point-by-point radar response simulation on a gridded surface without limitation of resolution (fully adaptive), accounting for the satellite altitude and the altimeter characteristics of the mission. This approach may be considered to be more robust than analytical ones, particularly when faced with atypical observations (e.g., elliptical antenna pattern, off-nadir mispointing angles, point target response) that are difficult to put into equations.
The CPP SAR numerical retracker accounts for varying off-nadir mispointing angles in both axes (along-track and cross-track directions) as input parameters. Those angles are obtained from the star tracker information, roll and pitch angles, and

Validation Report: WP5000 Assessment of SAMOSA3 SAR retracker (S3 DPM 2.3.0)
CLS-DOS-NT-13-156 CP4O-PVR-XXX Issue 1.0 Jun. 18, 13 4
FORM
-NT-
GB-
7-1
FORM
-NT-
GB-
7-1
compensated by pre-computed angular biases corresponding to the angular alignment between the star tracker boresight and the altimeter electromagnetic axis.
This solution is currently implemented in the CPP chain and has been successfully validated in comparison with the RDSAR data that provide a LRM reference over identical sea state [Moreau, 2013], [Labroue, 2014].
2.2.3. Edited data
Data editing is necessary to remove altimeter measurements having lower accuracy. To analyze the consistency between both retracker solutions in open ocean, only valid ocean data are selected (removing data corrupted by sea ice and rain). The following editing criteria are applied:
- a valid flag is used, based on the validation task of CryoSat-2 performed by the CLS Space Oceanography Division, ensuring to eliminate all outliers (that may be related to some spurious observations caused by rain, blooms, or to some specifics events that can occur for instance after an orbit maneuver, or when an anomaly on an instrument impacts the quality of the measurement)
- data points close to the shoreline are edited (distance to coast <10km)
- more specific editing criteria, based on thresholds on different parameters are applied to filter out data points:
o 0.1m<SWH and SWH>10m are removed,
o Only corrected SLA between -2m and +2m are considered
3. Validation results and overall assessment
The overall objective of this validation exercise is to assess the performances of the S3 SAR retracker, highlighting the main features, discrepancies, advantages and drawbacks of this method while comparing to the CPP SAR products.
The assessment task is conducted with robust and standard methods that are classically used in current Cal/Val analyses, to precisely validate and cross-calibrate different algorithms on the same measurement data set (same altimeter mission, same selected areas and time frames).
For this purpose, the validation of the S3 SAR retracker is performed through the following set of diagnoses:
- Estimated parameters cartography to visualize their geographic locations and identify their dependencies on geophysical signals (SWH, calms or sigma-0 blooms or rain areas, but also mispointing angles and vertical velocity);
- Map of reduction of sea surface height (SSH) variance at crossovers (C2/C2 and C2/J2) to determine which algorithm shows the best performances;

Validation Report: WP5000 Assessment of SAMOSA3 SAR retracker (S3 DPM 2.3.0)
CLS-DOS-NT-13-156 CP4O-PVR-XXX Issue 1.0 Jun. 18, 13 5
FORM
-NT-
GB-
7-1
FORM
-NT-
GB-
7-1
- Diagnoses on the performances of the waveform fitting (plot of the misfit and plots of the residuals between the measured waveforms and the fitted model as a function of SWH);
- Plots of the parameters themselves (parameter profiles as a function of time, histograms, dispersions or scatter-plots);
- Spectral analysis of parameters (sea level anomalies, SWH or sigma-0);
- Analysis of the retracking algorithms in the coastal domain.
These diagnoses are performed at higher data set rhythm, 20-Hz.
3.1. Performances of the waveform fitting
3.1.1. Misfit analysis
A first interesting diagnostic for this comparison consists in evaluating the mean quadratic error (MQE), which measures the misfit of the SAR models to the echo waveforms. This indicator allows to evaluate the accuracy of the retracking algorithm to model real echoes, that can impact the quality of the estimates.
Figure 2 represents the mean MQE (i.e. misfit averaged on an SWH interval) of the S3 SAR and CPP retrackers at 20-Hz, over the Pacific SAR box in July 2012. Figure 2 plot the mean MQE over the entire selected area in July 2012 (right panel) and January 2013 (right panel). As expected, these plots show clearly a lower misfit for the CPP from low to high wave height, thanks to a better model-echo fitting. The SAMOSA3 model approximation (i.e., Gaussian approximation for the Point Target Response (PTR)) leads to residual waveform misfit and possible errors of estimates, such as those observed while using the Brown model in the LRM-mode retracking scheme.
Figure 2: Mean misfit curve for CPP (plotted in red) and S3 SAR retracker
(plotted in yellow) as function of SWH in July 2012 (left panel) and January 2013 (right panel) over the Pacific + NE Atlantic SAR-mode areas.
Validation Report: WP5000 Assessment of SAMOSA3 SAR retracker (S3 DPM 2.3.0)
CLS-DOS-NT-13-156 CP4O-PVR-XXX Issue 1.0 Jun. 18, 13 6
FORM
-NT-
GB-
7-1
FORM
-NT-
GB-
7-1
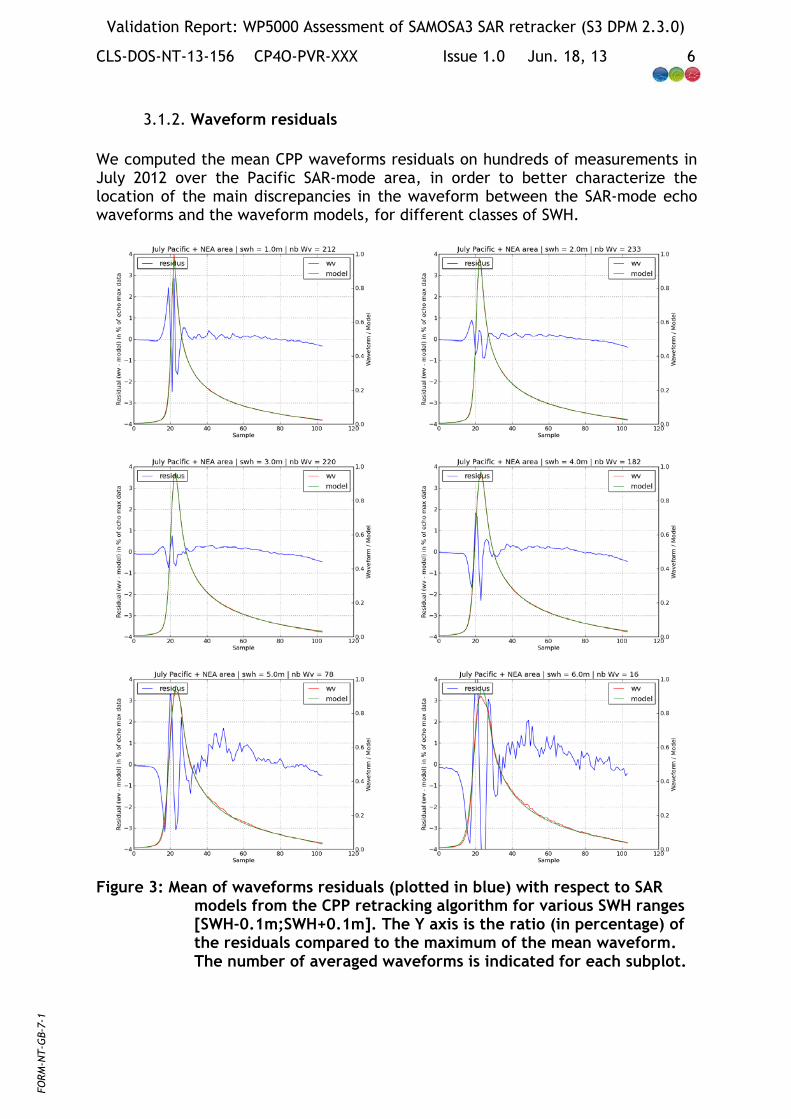
3.1.2. Waveform residuals
We computed the mean CPP waveforms residuals on hundreds of measurements in July 2012 over the Pacific SAR-mode area, in order to better characterize the location of the main discrepancies in the waveform between the SAR-mode echo waveforms and the waveform models, for different classes of SWH.
Figure 3: Mean of waveforms residuals (plotted in blue) with respect to SAR
models from the CPP retracking algorithm for various SWH ranges [SWH-0.1m;SWH+0.1m]. The Y axis is the ratio (in percentage) of the residuals compared to the maximum of the mean waveform. The number of averaged waveforms is indicated for each subplot.

Validation Report: WP5000 Assessment of SAMOSA3 SAR retracker (S3 DPM 2.3.0)
CLS-DOS-NT-13-156 CP4O-PVR-XXX Issue 1.0 Jun. 18, 13 7
FORM
-NT-
GB-
7-1
FORM
-NT-
GB-
7-1
On Figure 3, it can be observed that greatest errors are obtained at the toe and in the leading edge of the waveform, where the amplitude of the signal is high. Also, one can see that residuals in percentage are noticeable in the trailing edge, but with normally lower impact in the fitting scheme, since the amplitude of the waveform in this part is not significant.
In addition, the residuals seem to be most important at very low (1m) and particularly very high wave heights as expected.
3.2. Comparison of range estimates
This section presents the results of the CLS analysis bench obtained with both algorithms (S3 SAR retracker and CPP), to quantify the retracker performances. In the following subsection the range estimates have been compared through several metrics pointing out their similarities and discrepancies.
3.2.1. Spectral analysis of the SLA
On the SLA spectra (Figure 4), we can see that both retrackers measure exactly the same content of the oceanic signal from low to high wavelength. Also, one can notice that the SAR altimeter data is not affected by correlated errors that are seen on LRM-mode spectra (as a spectral hump). From this graph, it appears that the SAR SLA spectrum perfectly follows the slope of the oceanic signal up to 50 km, allowing 1-Hz product users to recover smaller wavelengths (10-80 km) of interest for oceanography, where conventional altimeter mode needs to use complex waveform processing, dedicated retrackers or post-processing (e.g. Singular Value Decomposition algorithm) to edit out spurious data from historical LRM datasets and reduce both the noise level and the spectral hump.
The two spectra are obtained by integration of many elementary spectra computed on continuous data segments, for which an averaged SWH of 2.5m is observed. The computed noise levels of the SLA from both solutions are around 5.7 cm at 20 Hz (the full altimetry resolution).

Validation Report: WP5000 Assessment of SAMOSA3 SAR retracker (S3 DPM 2.3.0)
CLS-DOS-NT-13-156 CP4O-PVR-XXX Issue 1.0 Jun. 18, 13 8
FORM
-NT-
GB-
7-1
FORM
-NT-
GB-
7-1
Figure 4: Mean SLA spectrum for CPP (plotted in blue) and S3 SAR retracker
(plotted in red) in January 2013 over the entire SAR-mode area. The abscissa represents the wavelengths (on the top of the plot) or equivalently the wavenumbers (1/km).
We can see on Figure 5 that SLA signals from both retrackers are in a good agreement (just few mms of difference at maximum).
Figure 5: S3 SAR retracker (in red) and CPP (in blue) SLA profiles in July 2012
over Pacific.

Validation Report: WP5000 Assessment of SAMOSA3 SAR retracker (S3 DPM 2.3.0)
CLS-DOS-NT-13-156 CP4O-PVR-XXX Issue 1.0 Jun. 18, 13 9
FORM
-NT-
GB-
7-1
FORM
-NT-
GB-
7-1
3.2.2. SLA Histogram
The comparison between the S3 SAR retracker output and the CPP products underlines a very low global bias of near 3 mm in range.
Figure 6: Histogram of 20-Hz SLA for the S3 SAR retracker (in red) and CPP (in
blue) in January 2013 (ascending passes).
3.2.3. Dependencies between parameters
The results are presented separating ascending and descending passes since the radial velocity and the mispointing angles come up with different values at the same location that may impact the estimates.
To assess the consistency between 20-Hz range calculated by the S3 SAR retracker and by CPP retracker, their difference (or residual) has been computed as function of the filtered SWH, for ascending and descending passes, in July 2012 and January 2013. The following figures show that the residual is quite lower than 5mm for SWH up to 4m, in ascending and descending passes, and the two selected periods of time.

Validation Report: WP5000 Assessment of SAMOSA3 SAR retracker (S3 DPM 2.3.0)
CLS-DOS-NT-13-156 CP4O-PVR-XXX Issue 1.0 Jun. 18, 13 10
FORM
-NT-
GB-
7-1
FORM
-NT-
GB-
7-1
Figure 7: Dependencies of 20-Hz range residual with filtered SWH, in July 2012 (ascending passes). Density of points in right panel.
Figure 8: Dependencies of 20-Hz range residual range with filtered SWH, in July 2012 (descending passes). Density of points in right panel.
Figure 9: Dependencies of 20-Hz range residual with filtered SWH, in January
2013 (ascending passes). Density of points in right panel.

Validation Report: WP5000 Assessment of SAMOSA3 SAR retracker (S3 DPM 2.3.0)
CLS-DOS-NT-13-156 CP4O-PVR-XXX Issue 1.0 Jun. 18, 13 11
FORM
-NT-
GB-
7-1
FORM
-NT-
GB-
7-1
Figure 10: Dependencies of 20-Hz range residual with filtered SWH, in January
2013 (descending passes). Density of points in right panel.
The following diagnostics aim at identifying possible dependencies of the difference of 20-Hz ranges on the across-track mispointing angle, along-track mispointing angle or radial velocity.
In Figure 11, the residual is plotted versus SWH and the radial velocity. The Figure 12 and Figure 13 plot the same parameter as a function of the radial velocity and the across-track and along-track mispointing angles obtained from the star tracker information. Those results show that the S3 SAR retracker has no apparent impact on the dependencies of the residual measurements with respect to both mispointing angles and the radial velocity.
Figure 11: Dependencies of 20-Hz range residual with filtered SWH and radial
velocity in July 2012 (left panel) and January 2013 (right panel).

Validation Report: WP5000 Assessment of SAMOSA3 SAR retracker (S3 DPM 2.3.0)
CLS-DOS-NT-13-156 CP4O-PVR-XXX Issue 1.0 Jun. 18, 13 12
FORM
-NT-
GB-
7-1
FORM
-NT-
GB-
7-1
Figure 12: Dependencies of 20-Hz range residual with across-track mispointing
angle and filtered SWH in July 2012 (left panel) and January 2013 (right panel).
Figure 13: Dependencies of 20-Hz range residual with along-track mispointing
angle and filtered SWH in July 2012 (left panel) and January 2013 (right panel).
3.2.4. SLA cartography
The along track 20-Hz measurements are used to construct a mean map (averaged values in each 2°x2° grid bins) of the S3 SAR retracker and CPP estimates, but also their differences and others parameters (in particular the radial velocity and the across-track and along-track mispointing angle that may impact the retrievals). In this way, we can easily observe the geographical distribution of those parameters and the mapping biases between retracking algorithms.

Validation Report: WP5000 Assessment of SAMOSA3 SAR retracker (S3 DPM 2.3.0)
CLS-DOS-NT-13-156 CP4O-PVR-XXX Issue 1.0 Jun. 18, 13 13
FORM
-NT-
GB-
7-1
FORM
-NT-
GB-
7-1
A global map of the range difference highlights this dependency (top panels of the Figure 14 and Figure 15) showing a clear correlation of the range difference with wave heights (figures to be compared with bottom panels), though the range difference is low (up to 5mm) for wave heights between 0 and 4m.
Otherwise, it appears no evident dependence between the range difference and other parameters such as the radial velocity and mispointing angles (not shown in this document).
Figure 14: Difference of range from S3 SAR and CPP retrackers (top panel) and
map of SWH in July 2012 (bottom panel) for descending passes.

Validation Report: WP5000 Assessment of SAMOSA3 SAR retracker (S3 DPM 2.3.0)
CLS-DOS-NT-13-156 CP4O-PVR-XXX Issue 1.0 Jun. 18, 13 14
FORM
-NT-
GB-
7-1
FORM
-NT-
GB-
7-1
Figure 15: Difference of range from S3 SAR and CPP retrackers (top panel) and map of SWH in January 2013 (bottom panel) for descending
passes.
3.2.5. SLA analysis in coastal ocean
It is also of importance to evaluate the ability of the retracking algorithms to run near the coasts. We can see on Figure 16 a quite similar behaviour with few non-valid CPP estimates while approaching the coast.

Validation Report: WP5000 Assessment of SAMOSA3 SAR retracker (S3 DPM 2.3.0)
CLS-DOS-NT-13-156 CP4O-PVR-XXX Issue 1.0 Jun. 18, 13 15
FORM
-NT-
GB-
7-1
FORM
-NT-
GB-
7-1
Figure 16: SLA profiles from S3 SAR retracker (in red) and CPP (in blue) in July
2012 over the NE Atlantic. Shaded region corresponds to land.
This analyse is performed statistically over a large number of observations to assess the consistency of the two retracking algorithms in coastal region.
Figure 17: SLA statistics (mean, number of points, standard deviation) as function of the distance to the coast by using the S3 SAR (in blue) and CPP (in red) retrackers in ascending (left panel) and descending (right panel) passes.

Validation Report: WP5000 Assessment of SAMOSA3 SAR retracker (S3 DPM 2.3.0)
CLS-DOS-NT-13-156 CP4O-PVR-XXX Issue 1.0 Jun. 18, 13 16
FORM
-NT-
GB-
7-1
FORM
-NT-
GB-
7-1
Figure 17 shows the mean SLA between 0 and 20km from shoreline and the associated standard deviation. From this figure, it appears no clear differences between retracking estimates, only slight increase of the number of valid measurements near the coast with the S3 SAR retracker that may be slightly more robust.
3.3. Comparison of significant waveheight estimates
The same analysis is done on significant wave height (SWH).
3.3.1. Spectral analysis of the SWH
Figure 18 shows that the SWH PSD spectrums are comparable. The level of energy of the SWH S3 SAR retracker PSD spectrum is however slightly higher than the one observed for the CPP, that would mean the SWH computed by the S3 SAR retracker is a little bit higher in amplitude. We also notice that the SWH noise level is around 42cm at 20 Hz for both retracking algorithms (1cm lower for the CPP retracker).
Figure 18: Mean SWH spectrum for CPP (plotted in blue) and S3 SAR retracker (plotted in red) in January 2013 over the entire SAR-mode area. The abscissa represents the wavelengths (on the top of the plot) or equivalently the wavenumbers (1/km).
3.3.2. SWH Histogram
Figure 19 shows the SWH histograms for the two SAR retracking methods. Statistically significant difference emerges in this figure with a bias of around 20cm. This result needs to be finely evaluated for different classes of wave height.

Validation Report: WP5000 Assessment of SAMOSA3 SAR retracker (S3 DPM 2.3.0)
CLS-DOS-NT-13-156 CP4O-PVR-XXX Issue 1.0 Jun. 18, 13 17
FORM
-NT-
GB-
7-1
FORM
-NT-
GB-
7-1
Figure 19: Histogram of 20-Hz SWH from S3 SAR retracker (in red) and CPP (in
blue) in July 2012.
3.3.3. Dependencies between parameters
Let’s now analyse the sensitivity of the SWH residual to the across-track and along-track mispointing angles, the radial velocity and the wave height.
The Figure 20 shows that the 20-Hz SWH residual depends strongly on wave height. Higher differences are observed at very low wave height (up to 25cm). Then the plot tends to zero for high wave height. The residual may be considered at first guess as the wave height correction to apply to the SWH estimates from the S3 SAR retracker, to correct the errors due to the Gaussian approximation for the PTR in the SAMOSA3 model.
Figure 20: Dependencies of 20-Hz SWH residual with filtered SWH, in January
2013. Density of points in right panel.

Validation Report: WP5000 Assessment of SAMOSA3 SAR retracker (S3 DPM 2.3.0)
CLS-DOS-NT-13-156 CP4O-PVR-XXX Issue 1.0 Jun. 18, 13 18
FORM
-NT-
GB-
7-1
FORM
-NT-
GB-
7-1
In Figure 21 the 20-Hz SWH residual is plotted versus SWH and the radial velocity. Figure 22 plots the same parameter as a function of SWH and across-track mispointing angle and along-track mispointing angle. From these figures, one can observe that the S3 SAR retracker has no impact on the dependencies of the SWH residual measurements with respect to both mispointing angles and the radial velocity. However the SWH difference is strongly correlated to SWH as already pinpointed.
Figure 21: Dependencies of 20-Hz SWH residual with filtered SWH and radial velocity in January 2013 for ascending (left panel) and descending (right panel) passes.
Figure 22: Dependencies of 20-Hz SWH residual with across-track (left panel) and along-track (right panel) mispointing angle and filtered SWH in January 2013 for ascending passes.

Validation Report: WP5000 Assessment of SAMOSA3 SAR retracker (S3 DPM 2.3.0)
CLS-DOS-NT-13-156 CP4O-PVR-XXX Issue 1.0 Jun. 18, 13 19
FORM
-NT-
GB-
7-1
FORM
-NT-
GB-
7-1
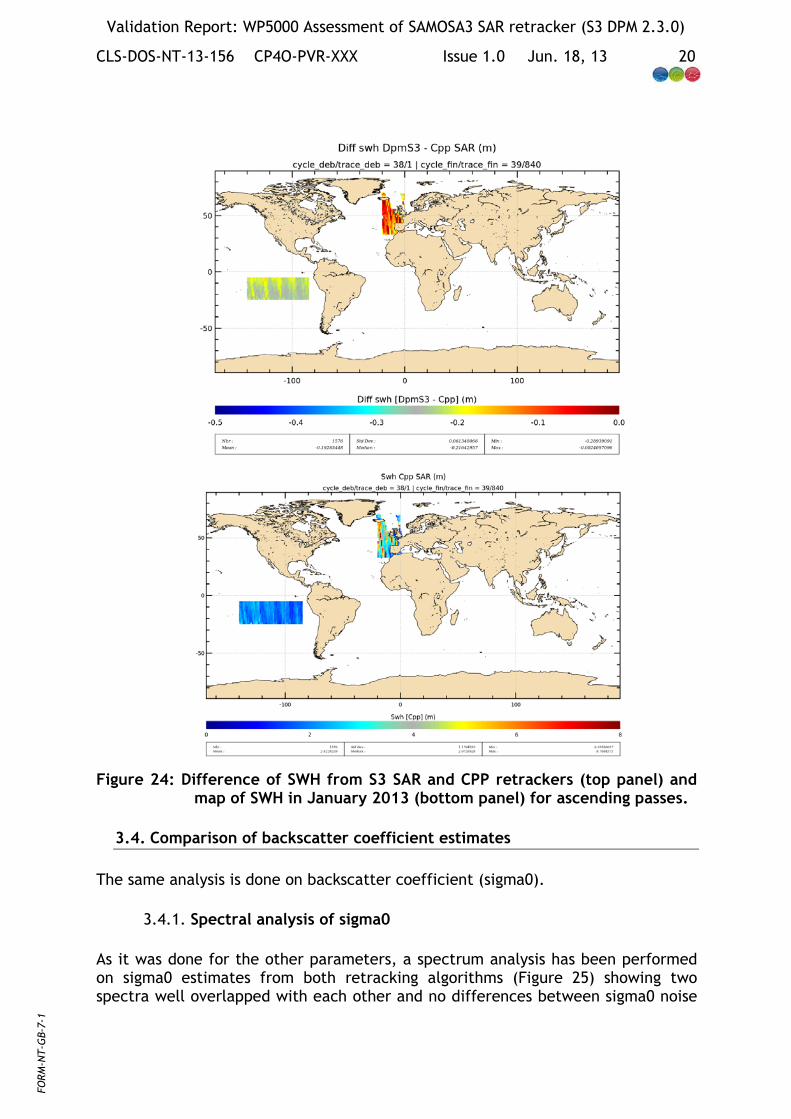
3.3.4. SWH cartography
A global map reveals that the SWH residual is clearly correlated to the wave height (Figure 23 and Figure 24). A maximum of 25cm of SWH difference is observed for low wave height. However, no dependence between the SWH residual and other parameters (such as the radial velocity and mispointing angles) is reported.
Figure 23: Difference of SWH from S3 SAR and CPP retrackers (top panel) and map of SWH in July 2012 (bottom panel) for descending passes.
Validation Report: WP5000 Assessment of SAMOSA3 SAR retracker (S3 DPM 2.3.0)
CLS-DOS-NT-13-156 CP4O-PVR-XXX Issue 1.0 Jun. 18, 13 20
FORM
-NT-
GB-
7-1
FORM
-NT-
GB-
7-1
Figure 24: Difference of SWH from S3 SAR and CPP retrackers (top panel) and
map of SWH in January 2013 (bottom panel) for ascending passes.
3.4. Comparison of backscatter coefficient estimates
The same analysis is done on backscatter coefficient (sigma0).
3.4.1. Spectral analysis of sigma0
As it was done for the other parameters, a spectrum analysis has been performed on sigma0 estimates from both retracking algorithms (Figure 25) showing two spectra well overlapped with each other and no differences between sigma0 noise

Validation Report: WP5000 Assessment of SAMOSA3 SAR retracker (S3 DPM 2.3.0)
CLS-DOS-NT-13-156 CP4O-PVR-XXX Issue 1.0 Jun. 18, 13 21
FORM
-NT-
GB-
7-1
FORM
-NT-
GB-
7-1
levels. This result indicates similar behaviour of the retracking algorithms on geophysical signals from high to low wavelengths with respect to their sigma0 estimates.
Figure 25: Mean sigma0 spectrum for CPP (plotted in blue) and S3 SAR retracker
(plotted in red) in January 2013 over the entire SAR-mode area. The abscissa represents the wavelengths (on the top of the plot) or equivalently the wavenumbers (1/km).
3.4.2. Sigma0 Histogram
Figure 26 shows very similar sigma0 histograms. We also notice that the difference of sigma0 between ascending and descending passes is low, around 0.2dB and 0.1dB for the S3 SAR retracker and the CPP SAR retracker respectively.
Figure 26: Histogram of 20-Hz Sigma0 from S3 SAR retracker (in red) and CPP
(in blue) in January 2013 for ascending (left panel) and descending (right panel) passes.

Validation Report: WP5000 Assessment of SAMOSA3 SAR retracker (S3 DPM 2.3.0)
CLS-DOS-NT-13-156 CP4O-PVR-XXX Issue 1.0 Jun. 18, 13 22
FORM
-NT-
GB-
7-1
FORM
-NT-
GB-
7-1
3.4.3. Dependencies between parameters
In Figure 27, the 20-Hz sigma0 residual is plotted as function of SWH. Their difference, which varies slightly with the wave height, is very small and may be even negligible. This result highlights a very good agreement between sigma0 estimates.
Figure 27: Dependencies of 20-Hz sigma0 residual with filtered SWH, in July
2012 and January 2013. Density of points in right panel.
Figure 28 and Figure 29 plot the same parameter as function of the radial velocity and mispointing angles respectively. The sigma0 residual appears to be correlated to other parameters (roll angle and radial velocity notably and at a lesser extent pitch angle) that cannot be neglected.
It is however not clear to know which parameter is most correlated to the sigma0 residual. The radial velocity may impact the shape of the SAR echo waveform but the SAR retracking models are not taking account of this effect. We would thus expect to have similar impact on the estimates for both retrackers. In the other hand, the SAR retracking models which include the mispointing angles may exhibit some differences due to the way of taking account of this information. This issue would need further investigation extended to a much larger time period in order to draw more reliable conclusions.

Validation Report: WP5000 Assessment of SAMOSA3 SAR retracker (S3 DPM 2.3.0)
CLS-DOS-NT-13-156 CP4O-PVR-XXX Issue 1.0 Jun. 18, 13 23
FORM
-NT-
GB-
7-1
FORM
-NT-
GB-
7-1
Figure 28: Dependencies of 20-Hz SIG0 residual (in dB unit) with filtered SWH and radial velocity in January 2013 for ascending (left panel) and descending (right panel) passes.
Figure 29: Dependencies of 20-Hz sigma0 residual (in dB unit) with across-track (left panel) and along-track (right panel) mispointing angles and filtered SWH in January 2013 for descending passes.
3.4.4. Sigma0 cartography
A map of differences between sigma0 computed by the S3 SAR retracker and by the CPP retracker confirms the preceding results. The sigma0 residual plotted in Figure 30 (top panel) by 2°x2° geographical bins shows slight dependency with wave heights but stronger dependency on the across-track mispointing angle (for notably high roll angles) and possible correlation at a lesser extent with the radial velocity.

Validation Report: WP5000 Assessment of SAMOSA3 SAR retracker (S3 DPM 2.3.0)
CLS-DOS-NT-13-156 CP4O-PVR-XXX Issue 1.0 Jun. 18, 13 24
FORM
-NT-
GB-
7-1
FORM
-NT-
GB-
7-1

Validation Report: WP5000 Assessment of SAMOSA3 SAR retracker (S3 DPM 2.3.0)
CLS-DOS-NT-13-156 CP4O-PVR-XXX Issue 1.0 Jun. 18, 13 25
FORM
-NT-
GB-
7-1
FORM
-NT-
GB-
7-1
Figure 30: Difference of sigma0 from S3 SAR and CPP retrackers (top panel),
and maps of different parameters in the following order: SWH, across-track mispointing angle and radial velocity, in January 2013
for descending passes.

Validation Report: WP5000 Assessment of SAMOSA3 SAR retracker (S3 DPM 2.3.0)
CLS-DOS-NT-13-156 CP4O-PVR-XXX Issue 1.0 Jun. 18, 13 26
FORM
-NT-
GB-
7-1
FORM
-NT-
GB-
7-1
3.4.5. Comparison with RDSAR Sigma0
In Figure 31 (top panel) one can observe that the SAR-mode sigma0 profile has apparent similarity with the RDSAR-mode, capturing same ocean structures. The SAR measurements are even likely to detect smaller scale structures (the heterogeneities within the LRM footprint) that are averaged and thus not seen by the RDSAR-mode measurements (for which sigma0 is like smoothed).
We smoothed the sigma0 retrieved from SAR-mode retracker (applying a 64 20-Hz points flat window function) to artificially make its footprint comparable to the RDSAR one (equivalent to a LRM radar footprint) and see whether the degraded SAR-mode sigma0 is consistent with the RDSAR-mode sigma0 or not. Figure 31 (bottom panel) shows a very good agreement between the smoothed SAR-mode sigma0 and the RDSAR one, ensuring that the accuracy and reliability of the SAR-mode retrieved backscatter coefficient are consistent with the LRM data
By analysing their differences plotted in Figure 32, we can notice that the RDSAR-mode and SAR-mode sigma0 are seemingly biased (as a first tentative, a rough calibration has been performed leading to an imprecise shift to both parameters with respect to the Jason-2 mission reference). But the large cloud of points in the scatter plot also exhibits high differences that may be related to a drop of the SAR-mode sigma0 as it is observed in Figure 31.
Figure 31: Along-track sigma0 as function of latitude. Sigma0 from CPP SAR
retracker is in blue, sigma0 from S3 SAR retracker in green and RDSAR-mode sigma0 in red.

Validation Report: WP5000 Assessment of SAMOSA3 SAR retracker (S3 DPM 2.3.0)
CLS-DOS-NT-13-156 CP4O-PVR-XXX Issue 1.0 Jun. 18, 13 27
FORM
-NT-
GB-
7-1
FORM
-NT-
GB-
7-1
Figure 32: Difference between smoothed SAR-mode sigma0 and RDSAR-mode
sigma0 as function of SWH, in July 2012 and January 2013. The red curve represents the mean of this difference.
4. Conclusion
Results of this study show that the agreement, in term of range and backscatter coefficient parameters, between S3 SAR solution retracker outputs and CPP products is near perfect with close behaviour and very similar performances. Differences of the order of few mms in range and one tenth of dB in sigma0 are reported, and are found to be primarily dependent on the significant waveheight, but also on roll angle (as seen in the sigma0 analysis), and at a lesser extent, on other parameters (such pitch angle and radial velocity) that have to be precisely evaluated.
On the other hand, the SWH computed by the S3 SAR retracker exhibits significant errors due to the Gaussian approximation of the Point Target Response (PTR) in the SAMOSA3 ocean model. These errors might be corrected applying a dedicated correction Lookup Table to the SWH estimates. The wave height look-up correction is dependent on waves (as high as 25cm) as shown in Figure 20.
Also it should be emphasized that the assessment of the ESRIN SAR solution retracker has been performed with data from a restricted (two SAR-mode boxes), and over just a 2-month period of time, which may be critical. A larger set of data would most certainly be significantly more valuable for evaluating the quality of the Sentinel-3 STM SAR retracker.

Validation Report: WP5000 Assessment of SAMOSA3 SAR retracker (S3 DPM 2.3.0)
CLS-DOS-NT-13-156 CP4O-PVR-XXX Issue 1.0 Jun. 18, 13 28
FORM
-NT-
GB-
7-1
FORM
-NT-
GB-
7-1
5. References
[Boy and Moreau, 2013]: F. Boy and T. Moreau, “Algorithm Theoretical Basis Document (ATBD) of the CPP SAR numerical retracker for oceans”, CNES report, S3A-NT-SRAL-00099-CNES, June 15, 2013. [Gommenginger et al., 2012]: C. Gommenginger, P. Cipollini, D. Cotton, S. Dinardo and J. Benveniste, “Finer, better, closer: Advanced capabilities of SAR altimetry in the open ocean and the coastal zone”, presented at the 2012 Ocean Surface Topography Science Team Meting. [Desjonquères et al., 2012]: J.D. Desjonquères, F. Boy and N. Picot, “Altimeter SAR data over ocean – CNES processing strategy and continuity with LRM data”, poster at the 2012 American Geophysical Union Meeting. [Dinardo and Lucas, 2014]: S. Dinardo and B. Lucas, “SAMOSA re-tracker configuration”, presented in CP4O meeting, Copenhagen, Denmark, March 25, 2014. [Labroue et al., 2014]: S. Labroue, M. Raynal and T. Moreau, “Validation report: WP5000 assessment of CPP SAR retracking”, CLS-DOS-NT-14-113, WP5000 CP4O report, May 20, 2014. [Moreau et al., 2013]: T. Moreau, F.Boy and M. Raynal, “Product Validation Report (PVR) of the CPP SAR numerical retracker for oceans”, CLS-DOS-NT-13-156, WP4000 CP4O report, June 24, 2013.


![RISK ASSESSMENT [ASSESSMENT]](https://static.fdocuments.in/doc/165x107/6212412fca52115ed803cf10/risk-assessment-assessment.jpg)