Uncertainty estimates and guidance for road transport emission calculations
Validation of uncertainty in IEC damage calculations
based on measurements from alpha ventus
DeepWind 2016
January 21st, 2016
Kolja Müller, Po Wen Cheng
Stuttgart Wind Energy (SWE), University of Stuttgart, Germany

Content of presentation
„Can assumptions of environmental conditions in the design process
adequately represent real loads?“
→ IEC 61400-03 DLC 1.2, load variation
• Research at alpha ventus, turbine, measurements & simulation model
• Applied procedure
• Measurement selection
• IEC assumptions
• Statistical evaluation
• Conclusions
2
Source: DOTI (www.alpha-ventus.de, 21.12.2015)
Motivation gut, eher
noch ausbauen, was
das Ziel der
Zu ausführlich
Die Motivation auf Folie
3 ist gut, könnte aber
noch ausgebaut werden.
Der eine zentrale Satz
oben ist für deine
Argumentation sehr
wichtig. Vielleicht kannst
du für den Zuhörer
erklären wie das
Standardvorgehen nach
IEC ist. Darauf baut sich
dann dein roter Faden
auf, dass du diese
Annahmen mit
Messdaten/Simulation
überprüfen möchtest.
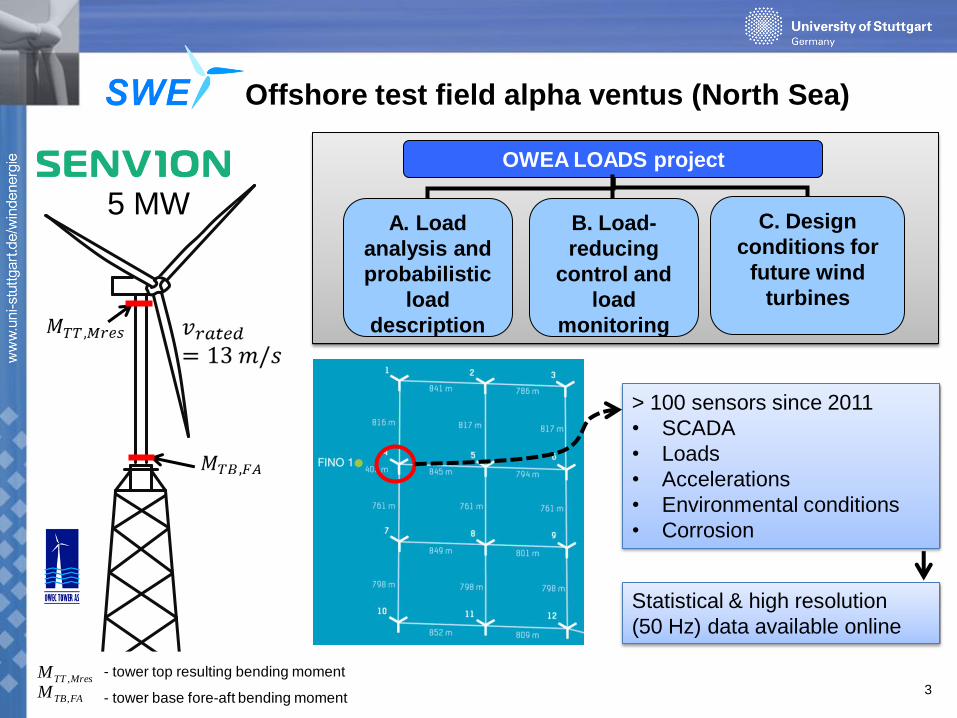
Offshore test field alpha ventus (North Sea)
3
> 100 sensors since 2011
• SCADA
• Loads
• Accelerations
• Environmental conditions
• Corrosion
Statistical & high resolution
(50 Hz) data available online
5 MW
FATB
MresTT
MM
,
,- tower top resulting bending moment
- tower base fore-aft bending moment
B. Load-
reducing
control and
load
monitoring
C. Design
conditions for
future wind
turbines
OWEA LOADS project
A. Load
analysis and
probabilistic
load
description

Applied Simulation Method
4
Wind turbine model:
Tool: Flex5 (28 DOF)
Dynamics: nonlinear elastic multi-body system (MBS)
with modal shape functions
Aero: BEM theory with correction models
Control: pitch and torque
4
[Sourc
e: D
OT
I]
Coupled integrated approach, dynamically linked at tower base
D. K
aufe
r et al. “
Valid
ati
on
of
an
In
teg
rate
d S
imu
lati
on
Meth
od
wit
h H
igh
Reso
luti
on
Lo
ad
Measu
rem
en
ts o
f th
e O
ffsh
ore
Win
d T
urb
ine R
Ep
ow
er
5M
at
Alp
ha
Ven
tus ."
Jo
urn
al o
f O
cean
an
d W
ind
En
erg
y,
Vol. 1
, N
o.
1
Substructure and foundation model
Tool: Poseidon (n DOF)
Dynamics: FE model
Elements: Bernoulli beams and force elements
Hydro: irreg. sea states, Morison equation
Validated for equivalent environmental conditions
Variation of measured loads can be represented with simulations

Applied procedure for validation of fatigue load
variation implied in IEC design assumptions
5
Selected measurements
Environmental parameters (IEC DLC 1.2, Hindcast data)
Selection criteria
DEL & damage over lifetime
simulation
Monte Carlo / Bootstrap
Damage statistics
DEL & damage over lifetime
Damage statistics
Comparison
Monte Carlo / Bootstrap
Simulation results (high resolution)
All measurements
Equal
format of
datasets
Environmental
data (mean
values)
Load measure-
ments (high
resolution)
presented
Comparisons
Sim.
Meas.
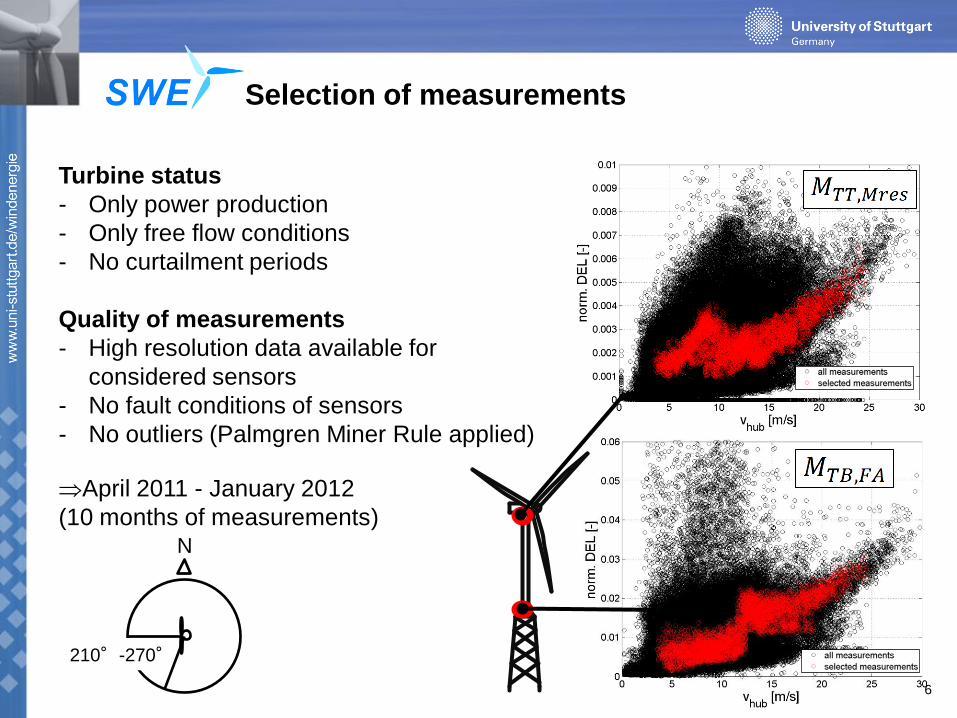
Selection of measurements
Turbine status
- Only power production
- Only free flow conditions
- No curtailment periods
Quality of measurements
- High resolution data available for
considered sensors
- No fault conditions of sensors
- No outliers (Palmgren Miner Rule applied)
April 2011 - January 2012
(10 months of measurements)
N
210°-270°
6

Simulation input: IEC DLC 1.2 environmental
conditions
Applied IEC simplifications (DLC 1.2):
• Environmental conditions with dependence
on wind speed and wind direction
•
• = 90th percentile
• = 50th percentile
• Constant values
•
• Azimuth error
• Water depth
• Marine growth
• Wind-wave-misalignment
• Soil conditions
),(,, vfTHTI Ps
TI
Ps TH ,
14.0
P
s
T
H
TI -Turbulence intensity
- wave height
- wave period
v - wind speed
- wind direction
- wind shear 7
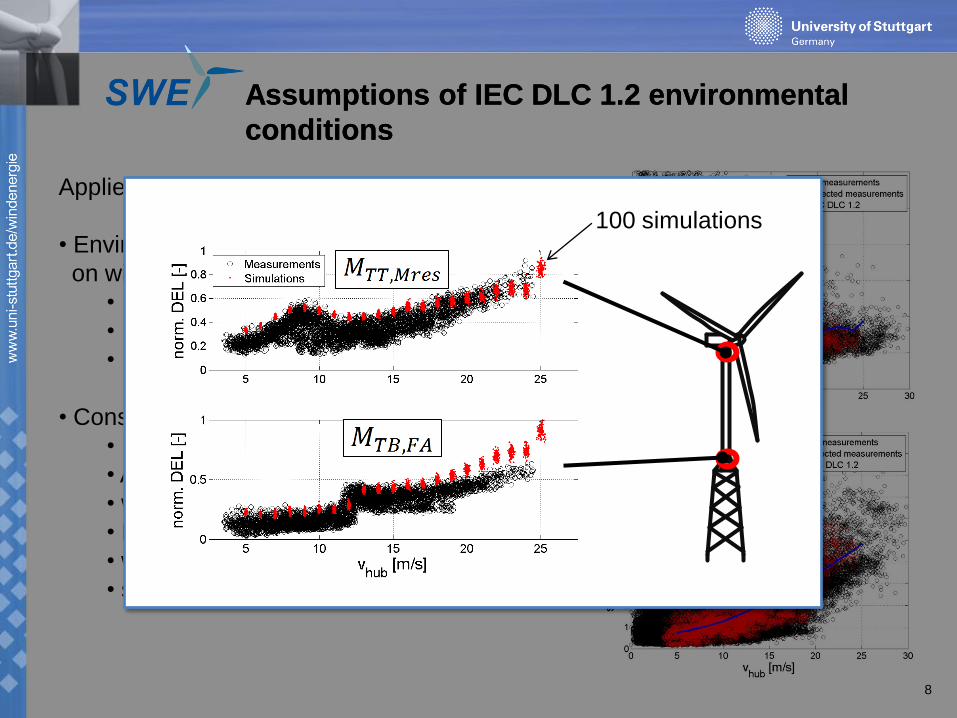
Assumptions of IEC DLC 1.2 environmental
conditions
Assumptions of IEC DLC 1.2 environmental
conditions
8
Applied IEC simplifications (DLC 1.2):
• Environmental conditions with dependence
on wind speed
•
• = 90th percentile
• = 50th percentile
• Constant values
•
• Azimuth error
• water depth
• Marine growth
• wind-wave-misalignment
• soil conditions
),(,, vfTHTI Ps
TI
Ps TH ,
14.0
100 simulations

Applied procedure for validation of fatigue load
variance implied in IEC design assumptions
9
Selected measurements
Environmental parameters (IEC DLC 1.2, Hindcast data)
Selection criteria
DEL & damage over lifetime
simulation
Monte Carlo / Bootstrap
Damage statistics
DEL & damage over lifetime
Damage statistics
Comparison
Monte Carlo / Bootstrap
Simulation results (high resolution)
All measurements
Equal
format of
datasets
Environmental
data (mean
values)
Load measure-
ments (high
resolution)
presented
Comparisons
Sim.
Meas.
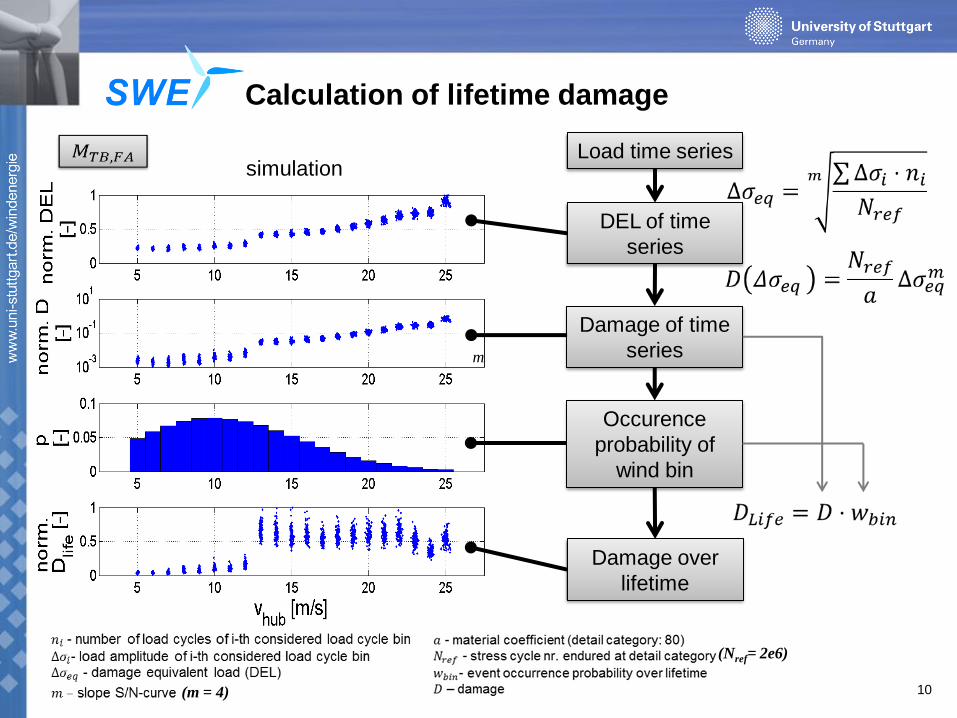
Calculation of lifetime damage
10
DEL of time
series
Damage of time
series
Occurence
probability of
wind bin
Damage over
lifetime
Load time series simulation
m
(m = 4)
(Nref= 2e6)
Wir raten dir nur Formeln
zu zeigen, die du auch
erklärst. Sonst ist der
Zuhörer schnell
abgelenkt.
Formeln in Formelfolie
überführen
… …
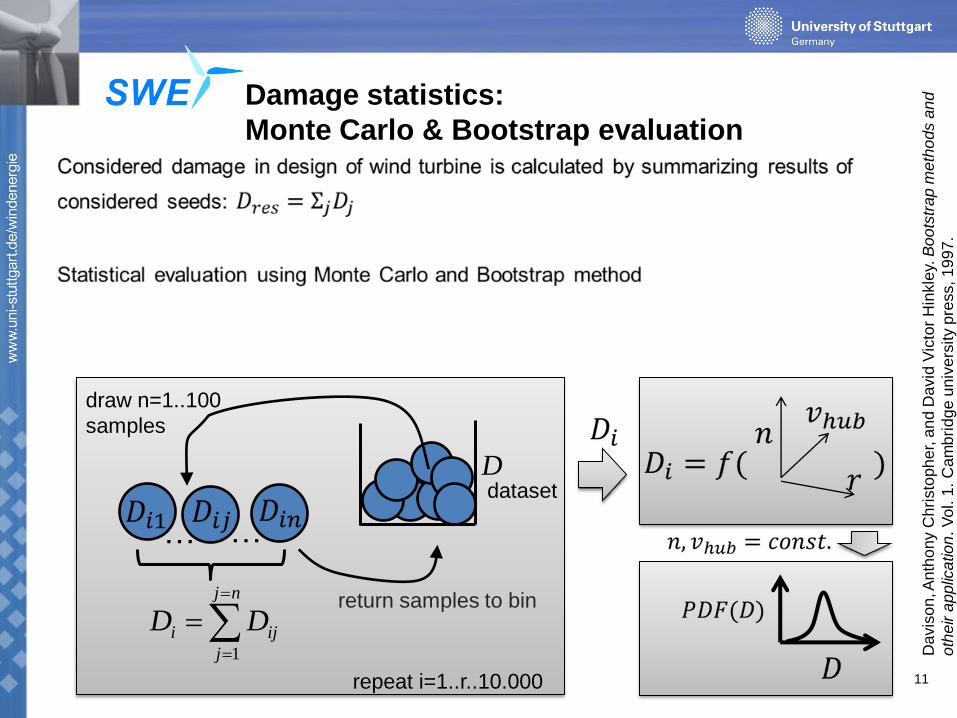
repeat i=1..r..10.000
Damage statistics:
Monte Carlo & Bootstrap evaluation
11
Da
vis
on
, An
tho
ny C
hri
sto
ph
er,
an
d D
avid
Vic
tor
Hin
kle
y. B
oo
tstr
ap
me
tho
ds a
nd
oth
eir a
pp
lica
tio
n. V
ol. 1
. C
am
bri
dg
e u
niv
ers
ity p
ress, 1
99
7.
draw n=1..100
samples
return samples to bin
Ddataset
nj
j
iji DD1

… …
repeat i=1..r..10.000
Damage statistics:
Monte Carlo & Bootstrap evaluation
12
Da
vis
on
, An
tho
ny C
hri
sto
ph
er,
an
d D
avid
Vic
tor
Hin
kle
y. B
oo
tstr
ap
me
tho
ds a
nd
oth
eir a
pp
lica
tio
n. V
ol. 1
. C
am
bri
dg
e u
niv
ers
ity p
ress, 1
99
7.
draw n=1..100
samples
return samples to bin
Ddataset
nj
j
iji DD1

Results (1): variation of damage
13
measure
ments
sim
ula
tions
Boxplo
ts s
how
ing m
edia
n, 1,5
,95 a
nd 9
9 p
erc
entile
s
]/[ smvhub]/[ smvhub
]/[ smvhub ]/[ smvhub
Blue
Error
Legende ist nicht
klar
#16
die Skalierung der
Achsen in den
Plots rechts bei
epsilon
machst, kann man
die Unterschiede
besser sehen.
FATBM , MresTTM ,
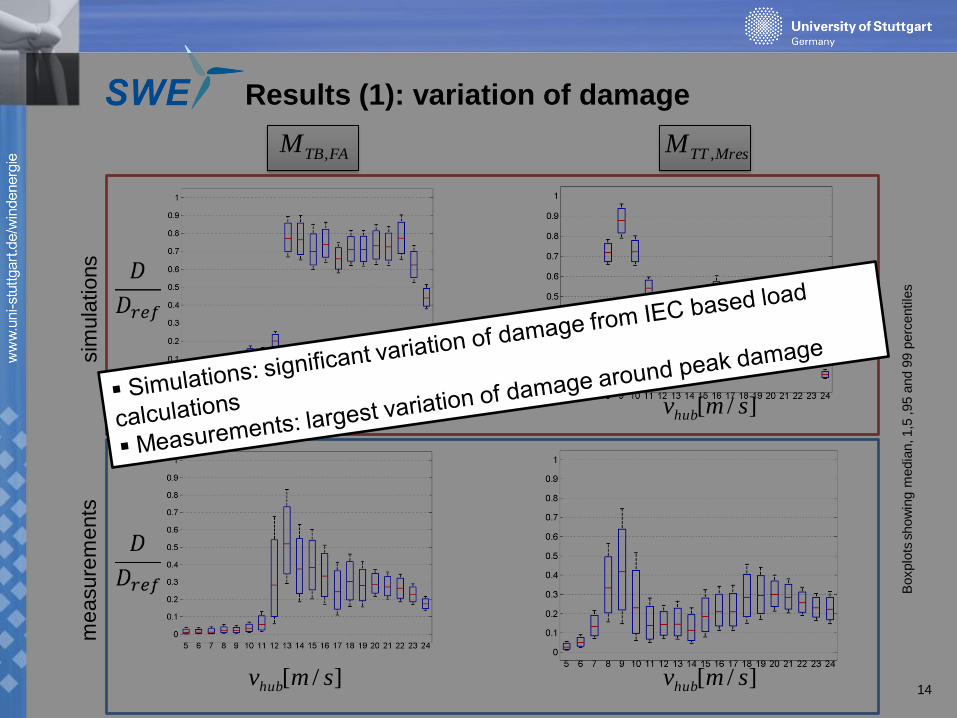
Results (1): variation of damage
14
measure
ments
sim
ula
tions
Boxplo
ts s
how
ing m
edia
n, 1,5
,95 a
nd 9
9 p
erc
entile
s
]/[ smvhub]/[ smvhub
]/[ smvhub ]/[ smvhub
Blue
Error
Legende ist nicht
klar
#16
die Skalierung der
Achsen in den
Plots rechts bei
epsilon
machst, kann man
die Unterschiede
besser sehen.
FATBM , MresTTM ,

Results (2): validation of variation of damage
15
]/[ smvhub
Normalized damage variation from bin median damage
[%],%medD
Legende: „
„
das erkennt man dann
besser
Wir raten dir nur
Formeln zu zeigen, die
du auch erklärst. Sonst
ist der Zuhörer schnell
abgelenkt.
]/[ smvhub
no clear consistency of difference observable
largest differences observable for regions around peak damage
FATBM , MresTTM ,
ref
D
med
D
D
med ,%- median damage
- % deviation of damage from median damage
- reference damage [%]
)()(,%
ref
hubmedhubD
D
vDvDmed

Conclusion & outlook
Methodology for validation of variation of damage by design assumptions
- Measurement selection
- Monte Carlo and Bootstrap methods
- Comparison of percentiles
→ Significant variation of loads from simulations observable
→ Difference between measurements and simulation varies
→ Calculation of probability of exceedence possible and could be relevant
Variation of damage cannot be captured by IEC design assumptions
-> Goals of the IEC fatigue evaluation regarding load variation?
a) Strictly conservative
b) Match variation of loads experienced in real environment
16
Acknowledgement
Thank you for your attention
This research is part of the RAVE projects OWEA -
“Verification of offshore wind turbines” and OWEA
Loads.
It is funded by the Federal Ministry for the Economic
Affairs and Energy (BMWi).
17
[wikipedia.org/wiki/Windmessmast]

Full scale validation of numerical models
18
Load
measurements
Environmental
measurements
plausibility checks
& calibration
Simulation Comparison 1. Time domain (rotor-/nacelle
rotation)
2. Frequency domain (natural
frequencies)
3. Statistics (min, mean, max,
stddev)
Validated simulation model
(equivalent environmental
conditions)
Selected events
1. Obtain
measurements
2. Obtain results 3. Compare results Aerodynamic
loads
Tower
drag
Hydro-
Dyn.
loads
soil-pile
interact
D. K
aufe
r et al.,
ISO
PE
2013
Simulation
Measurements Variation of measured loads can be represented with
simulations when considering variance of environmental
conditions

Validation of load variation
19
Can variance of loads be represented by simulations?
Simulation study considering variation of • Wind speed
• Turbulence intensity
• Wind shear
• Wave height
• Wave period
based on 5 year Fino1 data
Variation of measured loads can be represented with simulations when
considering variance of environmental conditions
Tower base fore aft bending moment
DEL – damage equivalent load

Damage bootstrap evaluation (tower bottom)
20
[%]%,sim
[%]%,mes
s
mvhub 13
s
mvhub 13
][n
][n
)[%]10,6(%
)[%]10,6(%
]/[ smvhub
]/[ smvhub
Boxplo
ts s
how
ing m
edia
n, 1,5
,95 a
nd 9
9 p
erc
entile
s
Bootstrap Rate of change
measure
ments
sim
ula
tio
ns
Du betrachtest
„Variation“ in den Plots,
das ist sehr schwer zu
verstehen. („Validation
of
Was ist
das nicht alles
durchschaut. Vielleicht
musst du da mehr Zeit
investieren, bzw. sehr
klar vorstellen.
Formeln unten in
Formelfolie überführen

Bootstrap evaluation (tower top)
21 21
Bootstrap Rate of change
measure
ments
sim
ula
tio
ns