
VALIDATION OF THE SENSEWEAR PRO 2 ARMBAND TO...
177
VALIDATION OF THE SENSEWEAR PRO 2 ARMBAND TO ASSESS ENERGY EXPENDITURE OF ADOLESCENTS DURING VARIOUS MODES OF ACTIVITY By Kim Crawford BS, Temple University, 1984 MS, Drexel University, 1987 Submitted to the Graduate Faculty of School of Education in partial fulfillment of the requirements for the degree of Doctor of Philosophy University of Pittsburgh 2004
Transcript of VALIDATION OF THE SENSEWEAR PRO 2 ARMBAND TO...
VALIDATION OF THE SENSEWEAR PRO 2 ARMBAND TO ASSESS ENERGY EXPENDITURE OF ADOLESCENTS DURING VARIOUS MODES OF ACTIVITY
By
Kim Crawford
BS, Temple University, 1984
MS, Drexel University, 1987
Submitted to the Graduate Faculty of
School of Education in partial fulfillment
of the requirements for the degree of Doctor of Philosophy
University of Pittsburgh
2004
UNIVERSITY OF PITTSBURGH
FACULTY OF SCHOOL OF EDUCATION
This dissertation was presented
by
Kim Crawford
It was defended on
July 26, 2004
and approved by
Ray G. Burdett, Ph.D.
Frederic L. Goss Ph.D.
John M. Jakicic Ph.D.
Elizabeth Nagle-Stilley, Ph.D.
Robert J. Robertson, Ph.D. Dissertation Director
VALIDATION OF THE SENSEWEAR PRO2 ARMBAND CALORIMETER TO ASSESS ENERGY EXPENDITURE OF ADOLESCENTS DURING VARIOUS MODES OF
ACTIVITY
Kim Crawford, PhD
University of Pittsburgh, 2004
The primary purpose of this investigation was to examine the validity of the SenseWear®
Pro 2 Armband (SAB) to assess energy expenditure during various modes of physical activity in
adolescents. It was hypothesized that measures of energy expenditure during treadmill and cycle
ergometer exercise would not differ between the SAB and the criterion respiratory metabolic
system (RMS) when examined for female and male subjects. Twenty-four healthy adolescents
completed both the cycle ergometer and treadmill exercise protocols.
The primary findings of this investigation were the SAB significantly underestimated
energy expenditure during cycle ergometer exercise at the low (1.53 + 0.60 kcal.min-1; P<0.001)
and moderate (2.48 + 0.95 kcal.min-1; P<0.001) intensities and for total energy expenditure
(19.11 + 7.43 kcal; P<0.001) in both the female and male subjects. In the treadmill exercise,
there were no significant differences between measures of energy expenditure during treadmill
walking at 3.0 mph, 0% incline in female and male subjects. However, the SAB significantly
underestimated measures of energy expenditure at 4.0 mph, 0% grade (0.86 + 0.84 kcal.min-1;
P<0.001); 4.0 mph, 5% grade (2.13 + 1.40 kcal.min-1; P<0.001); 4.5 mph, 5% grade (2.97 + 1.56
kcal.min-1; P<0.001) and for total energy expenditure (23.66 + 14.92 kcal; P<0.001) during
treadmill exercise in female and male subjects.
Possible mechanisms underlying the underestimation of energy expenditure by the SAB
are complex but may include: the use of generalized exercise algorithms to predict all types of
physical activity; possible disproportionate reliance on the two-axis accelerometer during non-
weight bearing and graded exercises; the delay in body heat transfer to the skin; and the inability
to account for variability in walking gait, lean body mass and fat mass. All of these factors
impact on the accuracy of the SAB to accurately estimate energy expenditure. This is the first
study to examine the accuracy of the SAB in adolescent subjects and is an important first step in
validating SAB technology in adolescents.
TABLE OF CONTENTS PREFACE........................................................................................................................................v CHAPTER 1 ................................................................................................................................... 1 INTRODUCTION, PROBLEM, HYPOTHESIS ........................................................................... 1
1.1. INTRODUCTION .......................................................................................................... 1 1.2. BODYMEDIA SENSEWEAR® PRO 2 ARMBAND................................................... 2 1.3. MEASUREMENT PROCEDURES: SENSEWEAR® PRO 2 ARMBAND................. 4 1.4. PHYSICAL ACTIVITY MONITORS ........................................................................... 4 1.5. STATEMENT OF THE PROBLEM .............................................................................. 6 1.6. HYPOTHESES ............................................................................................................... 7
2. CHAPTER 2 ........................................................................................................................... 8 LITERATURE REVIEW ........................................................................................................... 8 2.1. INTRODUCTION .......................................................................................................... 8
2.1.1. PHYSICAL ACTIVITY IN CHILDREN............................................................... 9 2.1.2. Sedentary Activities ................................................................................................ 9 2.1.3. Childhood Overweight Rates ................................................................................ 10 2.1.4. Chronic Positive Energy Balance ......................................................................... 11 2.1.5. Decline in Cardiorespiratory Fitness .................................................................... 12 2.1.6. Cardiovascular Risk Factors in Adolescents......................................................... 13
2.2. PHYSICAL ACTIVITY MONITORS ......................................................................... 15 2.2.1. Overview............................................................................................................... 15 2.2.2. Validation Criterion Measures.............................................................................. 15 2.2.3. Accelerometers...................................................................................................... 16 2.2.4. Heart Rate (HR) Monitoring ................................................................................. 21 2.2.5. Doubly Labeled Water.......................................................................................... 24 2.2.6. Indirect Calorimetry.............................................................................................. 27 2.2.7. Combination Systems ........................................................................................... 30 2.2.8. Body Media SenseWear® Pro 2 Armband ............................................................ 32
2.3. CONCLUSION............................................................................................................. 36 3. CHAPTER 3 ......................................................................................................................... 37 METHODOLOGY........................................................................................................................ 37
3.1. SUBJECTS ................................................................................................................... 37 3.2. EXPERIMENTAL DESIGN ........................................................................................ 38 3.3. ENERGY EXPENDITURE MEASUREMENT .......................................................... 39 3.4. EXPERIMENTAL PROCEDURES ............................................................................. 40
3.4.1. Recruitment ........................................................................................................... 40 3.4.2. Orientation Session............................................................................................... 41 3.4.3. Experimental Testing Session............................................................................... 41
3.5. STATISTICAL ANALYSIS ........................................................................................ 45 4. CHAPTER 4 ......................................................................................................................... 47 RESULTS ..................................................................................................................................... 47
4.1. SUBJECTS ................................................................................................................... 47 4.2. CALCULATION OF ENERGY EXPENDITURE ...................................................... 48
ii
4.3. MEASURES OF ENERGY EXPENDITURE COMPARED SEPARTELY IN FEMALES AND MALES ........................................................................................................ 48
4.3.1. Cycle Ergometer: Female Subjects...................................................................... 48 4.3.2. Cycle Ergometer: Male Subjects.......................................................................... 51 4.3.3. Treadmill Exercise: Female Subjects................................................................... 54 4.3.4. Treadmill Exercise: Male Subjects ...................................................................... 57
4.4. Measures of Energy Expenditure in a Combined Group of Female and Male Subjects 60
4.4.1. Cycle Ergometer ................................................................................................... 60 4.4.2. Treadmill ............................................................................................................... 63
4.5. Total Energy Expenditure ............................................................................................. 66 4.5.1. Cycle Ergometer ................................................................................................... 66 4.5.2. Treadmill ............................................................................................................... 68
4.6. Measure of Resting Energy Expenditure ...................................................................... 71 4.6.1. Female Subjects .................................................................................................... 71 4.6.2. Male Subjects ........................................................................................................ 74 4.6.3. Female & Male Subjects Combined ..................................................................... 76
5. CHAPTER 5 ......................................................................................................................... 80 DISCUSSION, CONCLUSIONS AND RECOMMENDATIONS.............................................. 80
5.1. INTRODUCTION ........................................................................................................ 80 5.2. VALIDITY OF THE SENSEWEAR PRO 2 ARMBAND IN CYCLE ERGOMETER EXERCISE................................................................................................................................ 81
5.2.1. Mechanisms for Underestimation of Energy Expenditure during Cycle Ergometer Exercise 83
5.2.1.1. Generalized Algorithms ................................................................................ 84 5.2.1.2. Accelerometer Technology........................................................................... 85 5.2.1.3. Body Heat Sensor Input ................................................................................ 87
5.3. VALIDITY OF THE SENSEWEAR PRO 2 ARMBAND IN TREADMILL EXERCISE................................................................................................................................ 88
5.3.1. Level Treadmill Walking ...................................................................................... 89 5.3.1.1. Mechanisms for the Underestimation of Energy Expenditure during Level Treadmill Walking ............................................................................................................ 91
5.3.2. Incline Treadmill Walking/Jogging ...................................................................... 94 5.3.2.1. Mechanisms for the Underestimation of Energy Expenditure during Graded Treadmill Walking/Jogging .............................................................................................. 95
5.4. TOTAL ENERGY EXPENDITURE............................................................................ 98 5.4.1. Cycle Ergometer ................................................................................................... 98 5.4.2. Treadmill ............................................................................................................... 99
5.5. RESTING ENERGY EXPENDITURE...................................................................... 100 5.6. APPLICATION ISSUES ............................................................................................ 102 5.7. CONCLUSION........................................................................................................... 103 5.8. LIMITATIONS........................................................................................................... 104 5.9. RECOMMENDATIONS FOR FUTURE RESEARCH............................................. 105
APPENDIX A............................................................................................................................. 107 BODY MASS INDEX FOR BOYS ....................................................................................... 107
APPENDIX A............................................................................................................................. 108
iii
BODY MASS INDEX FOR GIRLS....................................................................................... 108 APPENDIX B............................................................................................................................. 109
PREPARTICIPATION MEDICAL SCREENING & PHSICAL ACTIVITY HISTORY .... 109 APPENDIX C ............................................................................................................................. 111
ONE-WAY ANOVA ORDER EFFECT................................................................................ 111 APPENDIX C (continued).......................................................................................................... 112
ONE-WAY ANOVA ORDER EFFECT................................................................................ 112 APPENDIX D............................................................................................................................. 113
TWO-WAY ANOVA ENERGY EXPENDITURE DURING CYCLE ERGOMETER EXERCISE IN FEMALE SUBJECTS ................................................................................... 113
APPENDIX E ............................................................................................................................. 114 POST HOC COMPARISON FOR CYCLE ERGOMETER RESPONSES IN FEMALE SUBJECTS ............................................................................................................................. 114
Paired Samples Test.................................................................................................................... 114 APPENDIX F.............................................................................................................................. 115
BLAND-ATLMAN PLOTS FOR CYCLE ERGOMETER RESPONSES FOR FEMALE SUBJECTS ............................................................................................................................. 115
APPENDIX G............................................................................................................................. 116 INTRACLASS CORRELATION FOR CYCLE ERGOMETER ENERGY EXPENDITURE IN FEMALE SUBJECTS ....................................................................................................... 116
APPENDIX H............................................................................................................................. 117 TWO-WAY ANOVA ENERGY EXPENDITURE DURING CYCLE ERGOMETER EXERCISE IN MALE SUBJECTS ........................................................................................ 117
APPENDIX I............................................................................................................................... 118 POST HOC COMPARISON FOR CYCLE ERGOMETER RESPONSES IN MALE SUBJECTS ............................................................................................................................. 118
APPENDIX J .............................................................................................................................. 119 BLAND-ALTMAN PLOT CYCLE ERGOMETER RESPONSES FOR MALE SUBJECTS................................................................................................................................................. 119
APPENDIX K............................................................................................................................. 120 INTRACLASS CORRELATION FOR CYCLE ERGOMETER ENERGY EXPENDITURE IN MALE SUBJECTS ............................................................................................................ 120
APPENDIX L ............................................................................................................................. 121 TWO-WAY ANOVA ENERGY EXPENDITURE DURING TREADMILL EXERCISE IN FEMALE SUBJECTS ............................................................................................................ 121
APPENDIX M ............................................................................................................................ 122 POST HOC COMPARISON FOR TREADMILL RESPONSES IN FEMALE SUBJECTS 122
APPENDIX N............................................................................................................................. 123 BLAND-ALTMAN PLOT TREADMILL RESPONSES FOR FEMALE SUBJECTS ........ 123
APPENDIX N (continued) ......................................................................................................... 124 BLAND-ALTMAN PLOT TREADMILL RESPONSES FOR FEMALE SUBJECTS ........ 124
APPENDIX O............................................................................................................................. 125 INTRACLASS CORRELATION FOR TREADMILL ENERGY EXPENDITURE IN FEMALE SUBJECTS ............................................................................................................ 125
APPENDIX P.............................................................................................................................. 126
iv
TWO-WAY ANOVA ENERGY EXPENDITURE DURING TREADMILL EXERCISE IN MALE SUBJECTS ................................................................................................................. 126
APPENDIX Q............................................................................................................................. 127 POST HOC COMPARISON FOR TREADMILL RESPONSES IN FEMALE SUBJECTS 127
APPENDIX R............................................................................................................................. 128 BLAND-ALTMAN PLOT TREADMILL RESPONSES FOR MALE SUBJECTS............. 128
APPENDIX R (continued).......................................................................................................... 129 BLAND-ALTMAN PLOT TREADMILL RESPONSES FOR MALE SUBJECTS............. 129
APPENDIX S.............................................................................................................................. 130 INTRACLASS CORRELATION FOR TREADMILL ENERGY EXPENDITURE IN MALE SUBJECTS ............................................................................................................................. 130
APPENDIX T ............................................................................................................................. 131 TWO-WAY ANOVA ENERGY EXPENDITURE DURING CYCLE ERGOMETER EXERCISE IN THE COMBINED GROUP OF FEMALE AND MALE SUBJECTS ......... 131
APPENDIX U............................................................................................................................. 132 POST HOC COMPARISON FOR CYCLE ERGOMETER RESPONSES IN THE COMBINED GROUP OF FEMALE AND MALE SUBJECTS ........................................... 132
APPENDIX V............................................................................................................................. 133 BLAND-ALTMAN PLOT CYCLE ERGOMETER RESPONSES FOR THE COMBINED GROUP OF FEMALE AND MALE SUBJECTS .................................................................. 133
APPENDIX W ............................................................................................................................ 134 INTRACLASS CORRELATION FOR CYCLE ERGOMETER ENERGY EXPENDITURE IN THE COMBINED GROUP OF FEMALE AND MALE SUBJECTS ............................. 134
APPENDIX X............................................................................................................................. 135 TWO-WAY ANOVA ENERGY EXPENDITURE DURING TREADMILL EXERCISE IN THE COMBINED GROUP OF FEMALE AND MALE SUBJECTS................................... 135
APPENDIX Y............................................................................................................................. 136 POST HOC COMPARISON FOR TREADMILL RESPONSES IN THE COMBINED GROUP OF FEMALE AND MALE SUBJECTS .................................................................. 136
APPENDIX Z ............................................................................................................................. 137 BLAND-ALTMAN PLOT TREADMILL RESPONSES FOR THE COMBINED GROUP OF FEMALE AND MALE SUBJECTS ...................................................................................... 137
APPENDIX Z (continued).......................................................................................................... 138 BLAND-ALTMAN PLOT TREADMILL RESPONSES FOR THE COMBINED GROUP OF FEMALE AND MALE SUBJECTS ...................................................................................... 138
APPENDIX AA .......................................................................................................................... 139 INTRACLASS CORRELATION FOR CYCLE ERGOMETER ENERGY EXPENDITURE IN THE COMBINED GROUP OF FEMALE AND MALE SUBJECTS ............................. 139
APPENDIX BB .......................................................................................................................... 140 DEPENDENT t TEST FOR CYCLE ERGOMETER TOTAL ENERGY EXPENDITURE 140
APPENDIX BB (continued) ....................................................................................................... 141 DEPENDENT t TEST FOR CYCLE ERGOMETER TOTAL ENERGY EXPENDITURE 141
APPENDIX CC .......................................................................................................................... 142 INTRACLASS CORRELATION FOR CYCLE ERGOMETER TOTAL ENERGY EXPENDITURE..................................................................................................................... 142
APPENDIX DD .......................................................................................................................... 143
v
DEPENDENT t TEST FOR CYCLE ERGOMETER TOTAL ENERGY EXPENDITURE 143 APPENDIX DD (continued)....................................................................................................... 144
DEPENDENT t TEST FOR CYCLE ERGOMETER TOTAL ENERGY EXPENDITURE 144 APPENDIX EE........................................................................................................................... 145
INTRACLASS CORRELATION FOR CYCLE ERGOMETER TOTAL ENERGY EXPENDITURE..................................................................................................................... 145
APPENDIX FF ........................................................................................................................... 146 RESTING ENERGY EXPENDITURE (KCALS) IN FEMALE SUBJECTS ....................... 146
APPENDIX GG .......................................................................................................................... 147 DEPENDENT t TEST FOR RESTING ENERGY EXPENDITURE IN FEMALE SUBJECTS................................................................................................................................................. 147
APPENDIX HH .......................................................................................................................... 148 BLAND-ALTMAN PLOT RESTING ENERGY EXPENDITURE RESPONSES PRIOR TO TREADMILL EXERCISE IN FEMALE SUBJECTS ........................................................... 148 INTRACLASS CORRELATION FOR RESTING ENERGY EXPENDITUE IN FEMALE SUBJECTS ............................................................................................................................. 149
APPENDIX JJ............................................................................................................................. 150 RESTING ENERGY EXPENDITURE (KCALS) IN MALE SUBJECTS ........................... 150
APPENDIX KK.......................................................................................................................... 151 DEPENDENT t TEST FOR RESTING ENERGY EXPENDITURE IN MALE SUBJECTS................................................................................................................................................. 151
APPENDIX LL........................................................................................................................... 152 BLAND-ALTMAN PLOT RESTING ENERGY EXPENDITURE RESPONSES PRIOR TO TREADMILL EXERCISE IN MALE SUBJECTS................................................................ 152
APPENDIX MM......................................................................................................................... 153 INTRACLASS CORRELATIONS FOR RESTING ENERGY EXPENDITURE IN MALE SUBJECTS ............................................................................................................................. 153
APPENDIX NN.......................................................................................................................... 154 RESTING ENERGY EXPENDITURE (KCALS) IN THE COMBINED GROUP OF FEMALE AND MALE SUBJECTS ...................................................................................... 154
APPENDIX OO.......................................................................................................................... 155 DEPENDENT t TEST FOR RESTING ENERGY EXPENDITURE IN THE COMBINED GROUP OF FEMALE AND MALE SUBJECTS .................................................................. 155
APPENDIX PP ........................................................................................................................... 156 BLAND-ALTMAN PLOT RESTING ENERGY EXPENDITURE RESPONSES IN FEMALE AND MALE SUBJECTS ........................................................................................................... 156 APPENDIX QQ.......................................................................................................................... 157
INTRACLASS CORRELATION FOR RESTING ENERGY EXPENDITURE IN FEMALE AND MALE SUBJECTS ....................................................................................................... 157
BIBLIOGRAPHY....................................................................................................................... 158
LIST OF TABLES Table 1: Subject's Descriptive Data ............................................................................................. 37 Table 2: Treadmill Test Protocol ................................................................................................. 43 Table 3: Cycle Ergometer Test Protocol..................................................................................... 44 Table 4: Means (+SD) for Heart Rate and MET Responses during Cycle Ergometer and
Treadmill Exercise ................................................................................................................ 47 Table 5: One-Way ANOVA Order Effect Exercise Protocol.................................................... 111 Table 6: One-Way ANOVA Order Effect Resting Period.......................................................... 112 Table 7: ANOVA Energy Expenditure during Cycle Ergometer in Female Subjects............... 113 Table 8: Post hoc Comparison for Cycle Ergometer Responses in Female Subjects ................ 114 Table 9: Intraclass correlations for Cycle Ergometer Exercise in Female Subjects .................. 116 Table 10: Two-Way ANOVA Energy Expenditure during Cycle Ergometer Exercise in Male
Subjects ............................................................................................................................... 117 Table 11: Post hoc Comparison for Cycle Ergometer Responses in Male Subjects ................. 118 Table 12: Intraclass correlation for Cycle Ergometer Exercise in Male Subjects ..................... 120 Table 13: Two-Way ANOVA Energy Expenditure during Treadmill Exercise in Female
Subjects ............................................................................................................................... 121 Table 14: Post hoc Comparison for Treadmill Responses in Female Subjects ......................... 122 Table 15: Intraclass correlation for Treadmill Exercise in Female Subjects ............................. 125 Table 16: Two-Way ANOVA Treadmill Exercise in Male Subjects ........................................ 126 Table 17: Post hoc Comparison for Cycle Ergometer Responses in Female Subjects.............. 127 Table 18: Intraclass correlation for Treadmill Exercise in Male Subjects................................. 130 Table 19: Two-Way ANOVA for Cycle Ergometer Exercise in the Combined Group of Female
and Male Subjects ............................................................................................................... 131 Table 20: Post hoc Comparison for Cycle Ergometer Responses in the Combined Group of
Female and Male Subjects .................................................................................................. 132 Table 21: Intraclass correlation for Cycle Ergometer Exercise in Female and Male Subjects.. 134 Table 22: Two-Way ANOVA for Treadmill Exercise in the Combined Group of Female and
Male Subjects ...................................................................................................................... 135 Table 23: Post hoc Comparison for Treadmill Responses in the Combined Group of Female and
Male Subjects ...................................................................................................................... 136 Table 24: Intraclass correlation for Treadmill Exercise in Female and Male Subjects ............. 139 Table 25: Dependent t Test for Cycle Ergometer Total Energy Expenditure............................ 141 Table 26: Intraclass correlation for Cycle Ergometer Total Energy Expenditure ..................... 142 Table 27: Dependent t Test for Treadmill Total Energy Expenditure ....................................... 144 Table 28: Intraclass correlation for Cycle Ergometer Total Energy Expenditure ..................... 145 Table 29: Dependent t Test for Resting Energy Expenditure in Female Subjects..................... 147 Table 30: Intraclass correlation for Resting Energy Expenditure in Female Subjects .............. 149 Table 31: Dependent t Test for Resting Energy Expenditure in Male Subjects ........................ 151 Table 32: Intraclass correlation for Resting Energy Expenditure in Male Subjects .................. 153 Table 33: Dependent t Test for Resting Energy Expenditure in the Combined Group of Female
and Male Subjects ............................................................................................................... 155

ii
Table 34: Intraclass correlation for Resting Energy Expenditure Prior to Exercise in Female and Male Subjects ...................................................................................................................... 157
iii
LIST OF FIGURES Figure 1 Body Media SenseWear Pro 2 Armband .......................................................................... 2 Figure 2 InnerView Research Software Summary Data Page ........................................................ 3 Figure 3 Schematic Diagram of the Experimental Sequence ....................................................... 39 Figure 4: Energy Expenditure (kcal.min-1) During Cycle Ergometer Exercise in Adolescent
Female Subjects .................................................................................................................... 49 Figure 5: Bland-Altman Plot Stage 1 Cycle Ergometer for Female Subjects.............................. 50 Figure 6: Energy Expenditure (kcal . minute-1) During Cycle Ergometer Exercise in Adolescent
Male Subjects ........................................................................................................................ 52 Figure 7: Bland-Altman Plot Stage 1 Cycle Ergometer for Male Subjects ................................. 53 Figure 8: Energy Expenditure (kcal . minute-1) during Treadmill Exercise in Female Subjects . 55 Figure 9: Bland-Altman Plot Treadmill Stage 1 for Female Subjects ......................................... 56 Figure 10: Energy Expenditure (kcal . minute-1) During Treadmill Exercise in Male Subjects .. 58 Figure 11: Bland-Altman Plot Treadmill Stage 1 for Male Subjects........................................... 59 Figure 12: Energy Expenditure (kcal. minute-1) During Cycle Ergometer Exercise in the
Combined Male & Female Group ......................................................................................... 61 Figure 13: Bland-Altman Plot Cycle Ergometer Stage 1 for the Combined Group of Female and
Male Subjects ........................................................................................................................ 62 Figure 14: Energy Expenditure (kcal.minute-1) During Treadmill Exercise in the Combined
Group of Adolescent Males & Females ................................................................................ 64 Figure 15: Bland-Altman Plot Treadmill Stage 1 for the Combined Group of Female and Male
Subjects ................................................................................................................................. 65 Figure 16: Total Energy Expenditure for Cycle Ergometer Exercise .......................................... 66 Figure 17: Bland-Altman Plot Total Energy Expenditure (total kcals) During Cycle Ergometer
Protocol in the Combined Female and Male Group ............................................................. 67 Figure 18: Total Energy Expenditure for Treadmill Exercise Protocol....................................... 69 Figure 19: Bland-Altman Plot: Total Energy Expenditure During Treadmill Exercise in the
Combined Female & Male Group ......................................................................................... 70 Figure 20: Resting Energy Expenditure Prior Exercise in Female Subjects ............................... 71 Figure 21: Bland-Altman Plot Resting Energy Expenditure Prior Cycle Ergometer Exercise in
Female Subjects .................................................................................................................... 73 Figure 22: Resting Energy Expenditure Prior Exercise in Male Subjects ................................... 75 Figure 23: Bland-Altman Plot Resting Energy Expenditure Prior Cycle Ergometer Exercise in
Male Subjects ........................................................................................................................ 76 Figure 24: Resting Energy Expenditure in a Combined Group of Female and Male Subjects ... 77 Figure 25: Bland-Altman Plot Resting Energy Expenditure Prior Cycle Ergometer Exercise in
the Combined Female and Male Sample .............................................................................. 78 Figure 26: Body Mass Index for Boys ....................................................................................... 107 Figure 27: Body Mass Index Chart for Girls ............................................................................. 108 Figure 28: Bland-Altman Plot Stage 2 Cycle Ergometer Responses for Female Subjects........ 115
iv
Figure 29: Bland-Altman Plot Total Energy Expenditure Cycle Ergometer Responses for Female Subjects ............................................................................................................................... 115
Figure 30: Bland-Altman Plot Stage 2 Cycle Ergometer for Male Subjects ............................. 119 Figure 31: Bland-Altman Plot Total Energy Expenditure Cycle Ergometer for Male Subjects119 Figure 32: Bland-Altman Plot Treadmill Stage 2 for Female Subjects ..................................... 123 Figure 33: Bland-Altman Plot Treadmill Stage 3 for Female Subjects ..................................... 123 Figure 34 :Bland-Altman Plot Treadmill Stage 4 for Female Subjects ...................................... 124 Figure 35: Bland-Altman Plot Treadmill Stage 3 for Female Subjects ..................................... 124 Figure 36: Bland-Altman Plot Treadmill Exercise Stage 2 for Male Subjects .......................... 128 Figure 37: Bland-Altman Plot Treadmill Exercise Stage 3 for Male Subjects .......................... 128 Figure 38: Bland-Altman Plot Treadmill Exercise Stage 4 for Male Subjects .......................... 129 Figure 39: Bland-Altman Plot Treadmill Exercise Total Energy Expenditure for Male Subject
............................................................................................................................................. 129 Figure 40: Bland-Altman Plot Cycle Ergometer Exercise Stage 2 for the Combined Group of
Female and Male Subjects .................................................................................................. 133 Figure 41: Bland-Altman Plot Treadmill Exercise Stage 2 for the Combined Group of Female
and Male Subjects ............................................................................................................... 137 Figure 42: Bland-Altman Plot Treadmill Exercise Stage 3 for the Combined Group of Female
and Male Subjects ............................................................................................................... 137 Figure 43: Bland-Altman Plot Treadmill Exercise Stage 4 for the Combined Group of Female
and Male Subjects ............................................................................................................... 138 Figure 44: Resting Energy Expenditure (Kcals) in Female Subjects ........................................ 146 Figure 45: Bland-Altman Plot Resting Energy Expenditure Responses Prior to Treadmill
Exercise in Female Subjects ............................................................................................... 148 Figure 46: Resting Energy Expenditure (Kcals) in Male Subjects ............................................ 150 Figure 47: Bland-Altman Plot Resting Energy Expenditure Responses Prior to Treadmill
Exercise in Male Subjects................................................................................................... 152 Figure 48: Resting Energy Expenditure (Kcals) in the Combined Group of Female and Male
Subjects ............................................................................................................................... 154 Figure 49: Bland-Altman Plot Resting Energy Expenditure Responses in Female and Male
Subjects ............................................................................................................................... 156
v
PREFACE
Dr. Ray Burdett Dr. Fred Goss
Dr. John Jakicic Dr Betsy Nagel-Stilley
Dr. Bob Robertson Thank you for your support and guidance through the dissertation process.
Danny Crawford Meghan Crawford
Tim Lucas Ann Baker
Debbie and Jim Pingpank Thank you for your patience, support and most of all the sacrifices made over the last year.
1
CHAPTER 1
INTRODUCTION, PROBLEM, HYPOTHESIS
1.1. INTRODUCTION
The purpose of this study was to examine the validity of the SenseWear® Pro 2 Armband
to assess energy expenditure during various modes of physical activity in adolescents. The
instrument was designed to monitor and record continuous physiological data such as heart rate,
energy expenditure, activity level, and sleep/wake states in the free- living environment [1]. A
physical activity measuring device that accurately estimates physical activity and energy
expenditure in children in their free- living environment provides clinicians and researchers with
important information to determine energy balance. In an era where the childhood obesity rate is
rapidly increasing and participation in physical activity is declining, accurate measurements of
physical activity duration, intensity and frequency as well as associated energy expenditure, will
provide critical information upon which to develop dietary and exercise interventions. This
information will help determine the proper physical activity guidelines and exercise prescriptions
for children and adolescents that will optimize growth, health, and well-being.
2
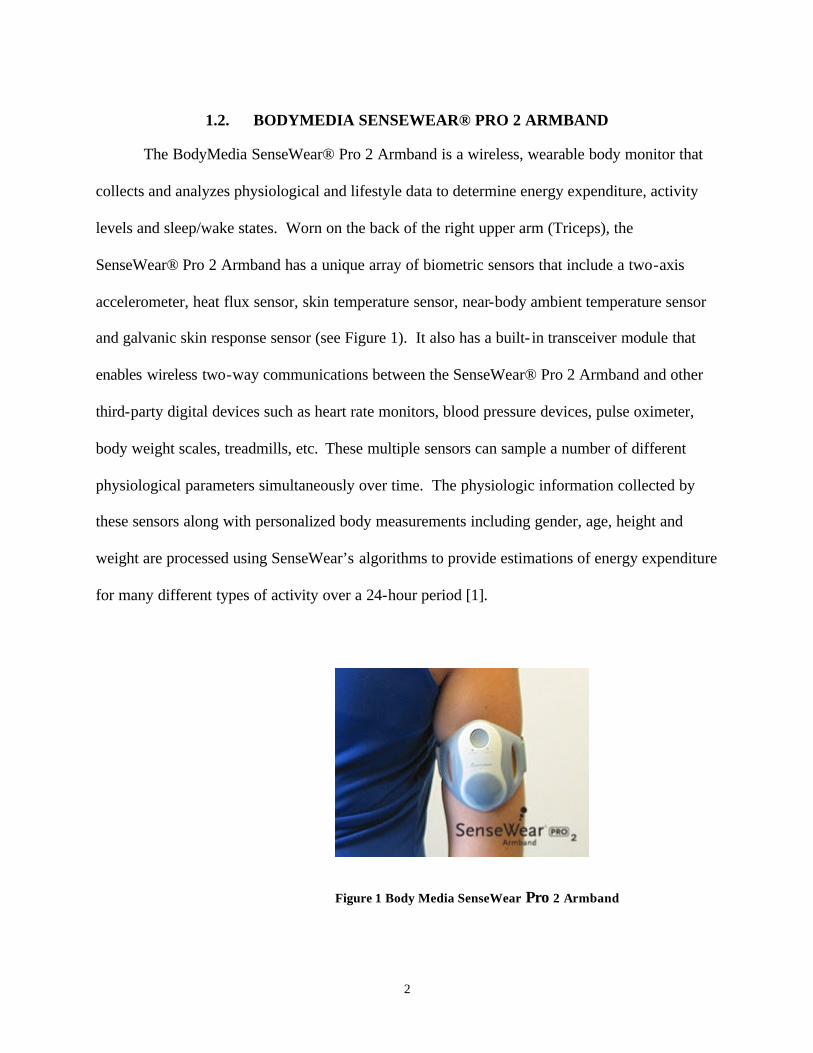
1.2. BODYMEDIA SENSEWEAR® PRO 2 ARMBAND
The BodyMedia SenseWear® Pro 2 Armband is a wireless, wearable body monitor that
collects and analyzes physiological and lifestyle data to determine energy expenditure, activity
levels and sleep/wake states. Worn on the back of the right upper arm (Triceps), the
SenseWear® Pro 2 Armband has a unique array of biometric sensors that include a two-axis
accelerometer, heat flux sensor, skin temperature sensor, near-body ambient temperature sensor
and galvanic skin response sensor (see Figure 1). It also has a built- in transceiver module that
enables wireless two-way communications between the SenseWear® Pro 2 Armband and other
third-party digital devices such as heart rate monitors, blood pressure devices, pulse oximeter,
body weight scales, treadmills, etc. These multiple sensors can sample a number of different
physiological parameters simultaneously over time. The physiologic information collected by
these sensors along with personalized body measurements including gender, age, height and
weight are processed using SenseWear’s algorithms to provide estimations of energy expenditure
for many different types of activity over a 24-hour period [1].
Figure 1 Body Media SenseWear Pro 2 Armband
3
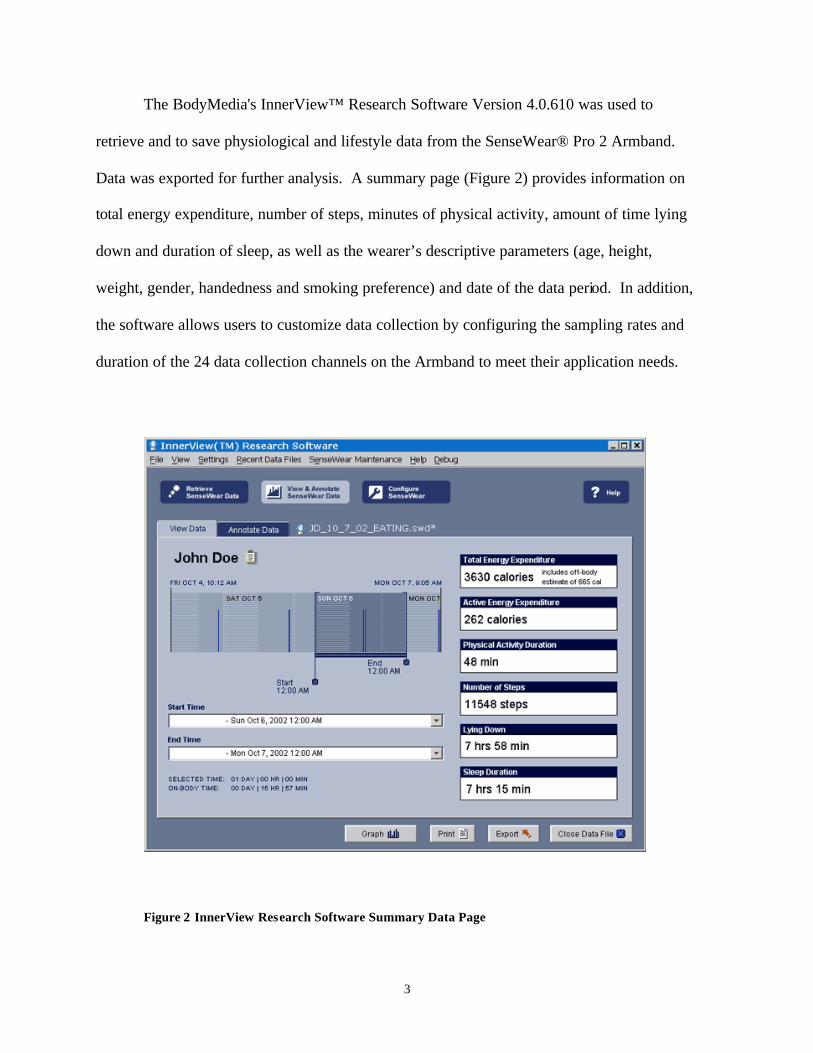
The BodyMedia's InnerView™ Research Software Version 4.0.610 was used to
retrieve and to save physiological and lifestyle data from the SenseWear® Pro 2 Armband.
Data was exported for further analysis. A summary page (Figure 2) provides information on
total energy expenditure, number of steps, minutes of physical activity, amount of time lying
down and duration of sleep, as well as the wearer’s descriptive parameters (age, height,
weight, gender, handedness and smoking preference) and date of the data period. In addition,
the software allows users to customize data collection by configuring the sampling rates and
duration of the 24 data collection channels on the Armband to meet their application needs.
Figure 2 InnerView Research Software Summary Data Page
4
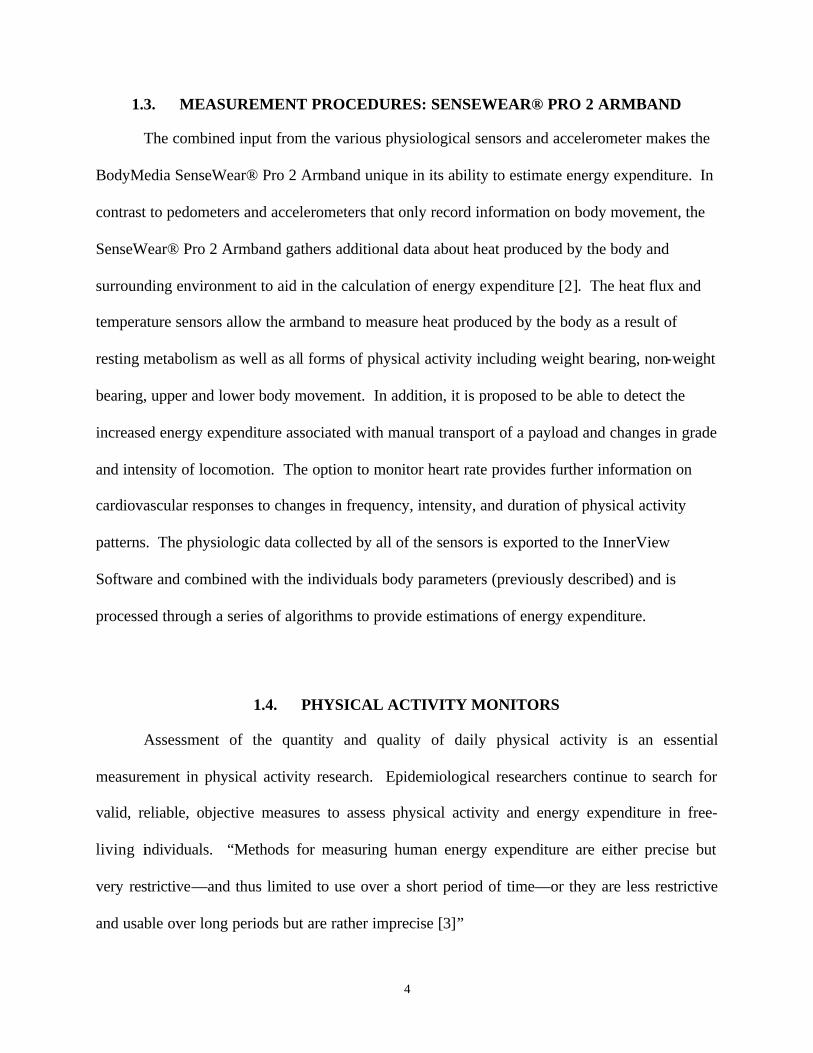
1.3. MEASUREMENT PROCEDURES: SENSEWEAR® PRO 2 ARMBAND
The combined input from the various physiological sensors and accelerometer makes the
BodyMedia SenseWear® Pro 2 Armband unique in its ability to estimate energy expenditure. In
contrast to pedometers and accelerometers that only record information on body movement, the
SenseWear® Pro 2 Armband gathers additional data about heat produced by the body and
surrounding environment to aid in the calculation of energy expenditure [2]. The heat flux and
temperature sensors allow the armband to measure heat produced by the body as a result of
resting metabolism as well as all forms of physical activity including weight bearing, non-weight
bearing, upper and lower body movement. In addition, it is proposed to be able to detect the
increased energy expenditure associated with manual transport of a payload and changes in grade
and intensity of locomotion. The option to monitor heart rate provides further information on
cardiovascular responses to changes in frequency, intensity, and duration of physical activity
patterns. The physiologic data collected by all of the sensors is exported to the InnerView
Software and combined with the individuals body parameters (previously described) and is
processed through a series of algorithms to provide estimations of energy expenditure.
1.4. PHYSICAL ACTIVITY MONITORS
Assessment of the quantity and quality of daily physical activity is an essential
measurement in physical activity research. Epidemiological researchers continue to search for
valid, reliable, objective measures to assess physical activity and energy expenditure in free-
living individuals. “Methods for measuring human energy expenditure are either precise but
very restrictive—and thus limited to use over a short period of time—or they are less restrictive
and usable over long periods but are rather imprecise [3]”
5
To date, a number of physical activity monitors have been validated as tools to measure
physical activity and/or energy expenditure [4-7]. Unfortunately, the accurate assessment of
physical activity energy expenditure, especially in the field setting, has proven problematic.
Investigators have relied on less precise measures, such as self-report methods (i.e. physical
activity interviews, recall surveys and questionnaires), motion assessment devices (i.e.
pedometers, accelerometers), and physiological data (i.e. heart rate and body temperature). The
more precise measures such as indirect calorimetry (IC) and doubly labeled water (DLW) are
considered the criterion variables for assessing energy expenditure in adults and children.
Inherent in all these techniques are limitations that restrict their use in measuring energy
expenditure and physical activity levels especially in the free- living environment.
Devices such as pedometers, accelerometers and heart rate monitors have become
increasingly popular as measurement tools to assess physical activity and estimate energy
expenditure. These devices reduce the subjectivity inherent in survey methods; can be used with
large groups of individuals to assess physical activity patterns; and are relatively inexpensive.
Unfortunately, even though these devices provide fairly accurate measures of body movement, it
has been difficult to validate their accuracy in calculating energy expenditure over a 24-hour
period.
Although IC and DLW are the most accurate methods to determine energy expenditure of
physical activity, these techniques are expensive and require laboratory instruments and analysis,
making them less desirable to use in large population-based free- living studies. In addition,
neither of these methods can differentiate between types and patterns of physical activity. Never
the less, both IC and DLW are accepted as validation tools for assessing the accuracy of other
physical activity monitors to estimate energy expenditure.
6
To improve the accuracy and validity in assessing physical activity energy expenditure, a
number of different measurement systems have been combined. The most frequently employed
is a combination of heart rate monitoring and accelerometry. Preliminarily investigations report
improved precision in measuring physical activity energy expenditure using these combined
measurement systems [3, 8, 9].
The SenseWear® Pro 2 Armband also uses the combination measurement system to calculate
energy expenditure. Preliminary experimental evidence has demonstrated that the SenseWear®
Pro 2 Armband is accurate in predicting physical activity energy expenditure of adults in the
laboratory setting [10]. In addition, it has shown that the instrument is easy to use, capable of
providing information about the energy expenditure of physical activity over time as well as
frequency, duration, and intensity of single exercise bouts [11]. The data generated by the
SenseWear® Pro 2 Armband provide information on total energy expenditure, active energy
expenditure, physical activity duration, resting energy expenditure, steps, lying down duration,
and sleep duration. A noninvasive instrument such as the SenseWear® Pro 2 Armband that can
be used to study the relation between the energy expenditure of physical activity and health in
children could have great value in exercise research and public health intervention programs.
1.5. STATEMENT OF THE PROBLEM
The purpose of this investigation was to:
a. To validate the accuracy of the SenseWear® Pro 2 Armband in measuring energy
expenditure of healthy children ages 12-17 years while walking/running on a
treadmill and pedaling on a cycle ergometer.
7
b. To examine whether the SenseWear® Pro 2 Armband energy expenditure
measurements during treadmill and cycle ergometer exercise are valid for separate
and combined groups of male and female adolescents.
1.6. HYPOTHESES
It was hypothesized that measures of energy expenditure during treadmill and cycle
ergometer exercise would not differ between the SenseWear® Pro 2 Armband and criterion
respiratory-metabolic procedures when compared separately for the female and male sample sub-
sets. It was also hypothesized that measures of energy expenditure during treadmill and cycle
ergometer exercise would not differ between the SenseWear® Pro 2 Armband and respiratory-
metabolic procedures for the combined group of male and female adolescents. These findings
would provide validation of the SenseWear® Pro 2 Armband to estimate energy expenditure and
physical activity levels in normal weight children ages 12-17 years participating in treadmill and
cycle ergometer exercise.
8
2. CHAPTER 2
LITERATURE REVIEW
2.1. INTRODUCTION
The purpose of this study was to examine the validity of the SenseWear® Pro 2 Armband
to assess energy expenditure during various modes of physical activity in adolescents. The
respiratory-metabolic system served as the criterion instrument by which the SenseWear® Pro 2
Armband was evaluated to assess energy expenditure in the laboratory setting. To date, a
number of different physical activity monitors have been validated as tools to measure physical
activity and/or energy expenditure in the laboratory setting [4, 6, 7, 12]. Unfortunately, the
accurate assessment of physical activity energy expenditure, especially in the field setting, has
proven problematic. Investigators have relied on comparatively less precise measures of
physical activity, such as self- report methods (i.e. physical activity interviews, recall surveys and
questionnaires), motion assessment devices (i.e. pedometers, accelerometers), and physiological
data (i.e. heart rate and body temperature). The more precise measures such as indirect
calorimetry (IC) and doubly labeled water (DLW) are considered the criterion variables for
assessing energy expenditure in adults and children. Inherent in all these techniques are
limitations that restrict their use in measuring energy expenditure and physical activity levels in
the free- living environment. The following literature examines the validity of a physical activity
monitor to assess the energy expenditure of adolescents.
9
2.1.1. PHYSICAL ACTIVITY IN CHILDREN
Many children are less physically active than recommended and physical activity
declines rapidly during adolescence. Physical activity is defined as any body movement
produced by the contraction of skeletal muscle that increases energy expenditure above the basal
level [13]. Physical activity can be planned or incidental. The Centers for Disease Control and
Prevention (CDC) reports nearly half of all American youths 12-21 years are not vigorously
active on a regular basis and approximately 14% of young people report no recent physical
activity [14, 15]. Data from national and international surveys suggest an alarming decrease in
the prevalence of physical activity participation in older children [13]. The decline in physical
activity with age may be the most consistent finding in physical activity epidemiology [16]. The
Healthy People 2010 report indicates that participation in all types of physical activity strikingly
declines as age or grade in school increases. In 1991, 42% of students in grades ninth through
twelfth were physically active for 30 minutes or longer on 5 or more days per week. By 1999 the
percentage of physically active high school students had dropped to 27%. Overall, age is
inversely associated with physical activity in studies of children [16], adolescents, US adults
[17], and adults in international studies [16, 18].
2.1.2. Sedentary Activities
Changing lifestyles of American children have decreased their opportunity to be
physically active. Attractive sedentary alternatives such as realty TV shows, interactive video
games and instant conversation and exposure to the world via computers have replaced, in part
the amount of time children spend in physical activity. Results from the Third National Health
and Nutrition Examination Survey (NHANES III) indicate that more than one quarter of children
in the United States spend 4 hours or more per day watching television. More recently the
10
Centers for Disease Control and Prevention Youth Risk Behavior Surveillance 2001 reported that
38.3% of adolescents in grades 9-12th watched 3 or more hours of television during an average
school day. Next to sleeping, television watching occupies the greatest amount of leisure time
during childhood. Researchers have found that television viewing is correlated with an increase
in pediatric obesity, perhaps because it is accompanied by between meal snacking and
consumption of high calorie, high fat foods advertised on television. Such sedentary activities
require minimal energy in excess of resting energy expenditure (REE), reduce time spent in
energy demanding activity, and promote increased dietary energy intake [19].
Another sedentary alternative competing with physical activity is playing on the
computer. Compared to television and video games though, children spend less time per day
using computers. Funk surveyed seventh and eighth grade boys and girls from a middle-class
school to evaluate the impact of video games on leisure time activity in children [20]. The
survey revealed that 29% of boys and 15% of girls play video games between 3 to 6 hours per
week, and 23% of boys and 6% of girls spend more than 6 hours per week playing video games.
In general, the hours adolescents spend in sedentary activities are on the rise, causing
hours spent engaged in physical activity to decline, resulting in lower dietary energy expenditure
and higher body weights. An accurate physical activity monitor that measures energy
expenditure of physical activity in a free- living setting could be used to identify those children
who are physically active. Once identified these children can be stratified and studied to explain
predictors, antecedents, and determinants of this behavior [13].
2.1.3. Childhood Overweight Rates
In correspondence with the increased time spent in sedentary activities is the dramatic
increase in childhood and adolescent overweight rates. There has been a 50% increase in the
11
prevalence of children with a body mass index (BMI) between the 85th and 95th percentiles,
placing them in the category of “at risk for overweight”. More alarming is the increase in
prevalence by 100 % of those children with a BMI >95th percentile, classifying them as
overweight [21, 22] More specifically with regard to age, the National Health and Nutrition
Examination Survey (NHANES) 1999-2000 reported 15% of children aged 6-11 years and 15%
of adolescents aged 12-19 years in the United States were overweight. This means that the
percent of children in the United States that are overweight has nearly doubled, and the percent
of overweight adolescents has almost tripled in the last two decades [23].
2.1.4. Chronic Positive Energy Balance
The increasing prevalence of obesity in American children suggests that they experience
a chronic positive energy balance. This implies poor coupling between dietary energy intake and
energy expenditure. The contribution that each of these two factors plays in the etiology and
development of overweight and obesity remains unclear [24]. Epstein et al. examined the effect
that changing sedentary behavior had on energy intake and/or physical activity level [19].
Results indicated that activity energy expenditure decreased by 21% when sedentary behaviors
were increased.
This decrease in daily active energy expenditure translated into an excess of 350
kilocalories (kcal) per day. Of this excess 350 kcals per day, 250 kcal came from an increase in
dietary energy intake and a 100 kcal came from a decrease in energy expenditure. The positive
energy balance caused by increasing caloric intake and decreasing energy expenditure of 350
calories per day would result in a body weight gain of 0.7 pounds per week or 36.4 pounds per
year. In a similar study, Boreham et al. reported that children expend approximately 600 kcals
less per day than their counterparts did 50 years ago [25]. Without reducing caloric intake, this
12
decrease in energy expenditure would produce a 60-pound increase in body weight over one
year. Fortunately, children are not gaining weight at this high rate. However these findings do
raise more questions about the relative contribution of energy expenditure and energy intake in
the obesity equation. A physical activity monitor that accurately measures energy expenditure in
the free living environment would be very helpful in clarifying the contribution energy
expenditure plays in the energy balance equation.
2.1.5. Decline in Cardiorespiratory Fitness
Not only has spending more time in sedentary activities contributed to increasing body
weight but also to the decline in cardiorespiratory fitness observed in children and adolescents.
Ahmad et al. examined whether the reduced physical activity levels observed in contemporary
white American children resulted in decreased fitness levels and performance on a standardized
exercise test [26]. Investigators tested a cohort of healthy nonobese 15 to 18 year old white
American boys and girls on the treadmill using the Bruce protocol. Current data were compared
to data from a retrospective analysis of Bruce treadmill exercise tests preformed from March
1991 to November 2000, resulting in a total of 347 individual subjects [27]. Exercise endurance
times were lower in all age groups for the contemporary subjects compared with earlier
published data using the Bruce treadmill protocol, despite physiologic evidence of maximal
effort in both groups. These observed decreases in endurance capacity raise the possibility that
cardiovascular conditioning is comparatively lower in contemporary white American children.
Research evidence that children have become less active to the point where these low levels of
daily energy expenditure seriously damages their current and future health has been difficult to
establish.
13
2.1.6. Cardiovascular Risk Factors in Adolescents
It has been hypothesized that the relation between physical fitness and cardiovascular risk
factors in children is similar to that in adults [28]. In studies conducted on adults, regular
physical activity has been shown to have a positive effect in reducing cardiovascular risk factors
such as body fatness (including abdominal fat), blood pressure, lipid and lipoprotein levels and
insulin insensitivity. This relation has been more difficult to identify in children. The effects of
physical activity on cardiovascular risk profile are less clear, and overall the results are not
strong, possibly because the prevalence of abnormality is low and the absolute range of risk
factor is narrow in children.
Current research findings however, are beginning to substantiate the relation between
regular physical activity and physical fitness and health status in children. Investigators are
finding that those children who perform better on standardized fitness tests, and thus in general
are more physically active on a routine basis, have more favorable body composition and lipid
profiles. In a study analyzing the relation between physical activity and antecedent risk factors
for coronary heart disease, Boreham et al. found that higher levels of physical activity were
associated with more favorable risk profiles [29]. More specifically, for boys 12 and 15 years
old, physical activity was significantly related to healthy risk profiles for blood pressure and
cardiorespiratory fitness. For the 15-year-old boys, physical activity was also related to a lower
ratio of total cholesterol to high density lipoprotein cholesterol (TC:HDL). Results were slightly
different for girls. Physical activity was unrelated to any of the biological risk factors for CHD.
On the other hand sports participation was significantly related to cardiorespiratory fitness for
both 12 and 15 year old girls and body fatness for 15-year-old girls.
14
Similarly, DuRant et al. found that higher levels of cardiorespiratory fitness and lower
levels of body fatness were associated with healthier serum lipid and lipoprotein levels in 4 and 5
year old black and white children [30]. In a longitudinal study conducted by Twisk et al.,
physical activity was significantly related to high density lipoprotein (HDL) levels, inversely
related to both TC:HDL ratio and the sum of four skinfold measures [31]. Results from studies
such as these suggest that more active children are leaner and display a healthier cardiovascular
profile. Use of a physical activity monitor that accurately measures energy expenditure and
physical activity duration, intensity, and frequency, will help investigators identify the dose-
response relation between physical activity and health.
The optimal amount and type of exercise for children and adolescents has not been
precisely defined but should be individualized based on maturity level, medical status, skill level,
and prior exercise experiences [14]. Several health organizations encourage all persons 6 years
of age and older to accumulate at least 30 minutes of moderate- intensity physical activity on
most and preferably all days of the week [14]. The Dietary Guidelines for Americans 2000 and
the new Dietary Reference Intakes 2002 recommend that children get at least 60 minutes of
physical activity each day and limit inactive forms of play such as TV watching and computer
games. An accurate physical activity monitor that measures the time and energy expenditure of
physical activity will help scientists to determine the proper physical activity guidelines and
exercise prescriptions for children and adolescents that will optimize growth, health, and well-
being.
15
2.2. PHYSICAL ACTIVITY MONITORS
2.2.1. Overview
Research has relied on various physical activity monitors such as motion sensors, heart
rate monitoring, and doubly labeled water to answer important questions about the relation
between physical activity and health in children. Although doubly labeled water is the most
accurate of the three methods in determining energy expenditure, it is expensive, requires
laboratory analysis, and does not differentiate between types and patterns of physical activity.
Motion sensors and heart rate monitors are problematic because they are inaccurate in estimating
energy expenditure.
The SenseWear® Pro 2 Armband has shown promising results with respect to estimating
the energy expenditure of physical activity in adults [10]. The SenseWear® Pro 2 Armband is
easy to use and is relatively inexpensive. The data generated provide information on total energy
expenditure, active energy expenditure, physical activity duration, resting energy expenditure,
steps, and duration of lying down and sleep. This noninvasive method to study the relation
between physical activity and health could have great potential in health-fitness and public health
research involving children.
2.2.2. Validation Criterion Measures
Investigations have used a variety of criterion measures to examine the validity of
physical activity monitors. The accepted criterion standards, or primary measures for assessing
physical activity in adults and children are direct observation, doubly labeled water and indirect
calorimetry. Doubly labeled water is recognized as the criterion measure for field evaluations of
energy expenditure. Secondary measures include heart rate, pedometers and accelerometers.
Validating a secondary measure by another secondary measure provides little insight to the
16
instruments’ true validity. For this reason only the results from studies that validated a
secondary measure against a primary measure were included in this review [32].
2.2.3. Accelerometers
Accelerometers “use piezoelectric transducers and microprocessors that convert recorded
accelerations to a quantifiable digital signal referred to as counts” [32]. The theoretical basis
underlying the use of an accelerometer to assess the total amount of physical activity is that
acceleration is directly proportional to muscular forces required for movement and therefore, is
related to energy expenditure [5]. The first generation, or uniaxial accelerometers, measure
movement in one plane, the vertical plane. The newer generation, triaxial accelerometers,
measure movement in three dimensions (mediolateral, anteroposterior, and vertical) as well as
the vector magnitude.
Uniaxial Accelerometers. Technological advances in uniaxial accelerometers have made
them a useful device for measuring physical activity. These monitors are small, unobtrusive
instruments with a memory capacity for monitoring and storing temporal patterns of activity, as
well as measuring intensity and quantity of movement. The biggest obstacle involving these
instruments, however is that not all activity is reflected in acceleration and deceleration.
Therefore, the monitors would not be accurate in estimating total daily energy expenditure. Thus
reports on validity of using uniaxial accelerometers to estimate energy expenditure vary greatly.
The Caltrac and The Computer Science and Applications, Inc (CSA) instruments were
two of the first and most widely studied uniaxial accelerometers in the research setting. In
controlled laboratory treadmill experiments, walking counts from the Caltrac have correlated
highly, r=0.82 [33] and r=0.88 [34] with oxygen consumption (VO2). Maliszewski reported no
17
significant differences between measured oxygen consumption and estimated energy expenditure
by Caltrac in children during treadmill walking at speeds ranging from 3.35 to 6.7 km.hr-1.
Trost et al. [35] conducted an experiment to quantify energy expenditure in 10-14 year
old children during walking and running on the treadmill using CSA counts and oxygen
consumption as the criterion measure. The correlation between actual (derived from oxygen
consumption measures) and predicted mean energy expenditure (estimated from a regression
equation based on counts from CSA) at each of three treadmill speeds (3, 4, and 6 mph) was
r=0.85, r=0.62 and r=0.81 respectively.
When treadmill grade is increased or non- locomotor activities such as cycling and weight
lifting are tested, the uniaxial accelerometers have either underestimated or overestimated caloric
expenditure. Bray et al. found the Caltrac underestimated energy expenditure by approximately
30% of an 8-hour daily activity session consisting of sedentary activities (eating, reading,
watching television, and listening to music) and two 20-minute cycle ergometer bouts [36].
They attributed the large estimation error to two factors: 1) energy expenditure during cycle
ergometer exercise was included in walking energy expenditure and this decreased the overall
accuracy and 2) the Caltrac does not reflect excess post-exercise energy expenditure, because
subjects were usually sitting or resting in a lying down position after exercise.
In a study comparing energy expenditure derived from Caltrac counts and daily total
energy expenditure (TEE) derived from doubly labeled water, Johnson et al. concluded that the
Caltrac was not a meaningful predictor of energy expenditure [37]. The caloric estimates (956
kcals per day) of energy expended in physical activity derived from Caltrac were significantly
higher when compared to measured active energy expenditure (469 kcal per day) in children
participating in a free- living setting. Active energy expenditure was calculated by subtracting
18
postprandial resting metabolic rate measured via indirect calorimetry from daily TEE. Since the
uniaxial accelerometers only measure movement in a single plane, this limits their ability to
detect the wide variety of movements typical of children, especially in studies conducted outside
the laboratory setting.
Triaxial Accelerometers. The development of the three-dimensional accelerometer, or
triaxial accelerometer, was intended to improve the accuracy of energy expenditure estimated by
a motion sensor. The triaxial accelerometer measures physical activity counts in three planes
(vertical, horizontal, and mediolateral) as well as vector magnitude over a specified time interval.
The vector magnitude is a summary measure of the accelerations recorded in all three planes. It
is calculated as the square root of the sum squared activity counts in each vector [38]. The
Tritrac is the most commonly used triaxial accelerometer. Total and activity energy expenditure
in kilocalories is determined using a prediction equation to estimate basal metabolic rate
according to age, height, body weight, and gender.
Theoretically, the three-dimensional properties of the Tritrac would make it better suited
to assess more sporadic lifestyle activity. While this argument has strong intuitive appeal, field
and laboratory-based studies testing the relative validity of accelerometers have been equivocal
[39]. Hendelman et al. observed a high correlation (r=0.89) between Tritrac vector magnitude
and measured VO2 for over ground walking [40]. However, when the two methods were
compared for walking and various household and recreational activities, the correlation
decreased to r=0.62. A 32.1-53.1% underestimation of energy expenditure from the Tritrac was
observed over all the activities studied.
In a similar study, Welk et al. examined the validity of three activity monitors under both
laboratory and field conditions [41]. Three different treadmill speeds and six different lifestyle
19
activities (sweeping, vacuuming, stacking, raking, mowing, and shoveling) were examined to
evaluate the validity of the monitors. Oxygen consumption determined by indirect calorimetry
served as the criterion measure. A higher correlation (r=0.86) was found between the monitors
and measured VO2 for the treadmill tests compared to the lifestyle activities (r=0.55).
Very few research studies have been conducted validating triaxial accelerometers using a
primary criterion measure in children. Eston et al. compared the accuracy of heart rate
monitoring, pedometry, triaxial accelerometry, and uniaxial accelerometry for estimating oxygen
consumption during typical children’s activities (playing catch, playing hopscotch, and sitting
coloring) [4]. It was found that the best single measurement of energy expenditure was the
Tritrac vector magnitude with a correlation of r=0.83 between accelerometer counts and
measured scaled oxygen consumption (sVO2). Allometrically scaled oxygen consumption is
defined as oxygen uptake expressed as a ratio of body mass raised to the power of 0.75. In
examining the children’s activities separately however, there was a clear tendency for the Tritrac
to underestimate energy expenditure as exercise intensity increased. When comparing all of the
devices tested though, Tritrac provided the best overall measurement of physical activity.
Welk et al. compared data from the Tritrac and a heart rate monitor to observational data
using the Children’s Activity Record System (CARS) for two time periods (40-minute normal
classroom period and a 30-minute physical education class). The CARS uses five different
activity categories to classify the subjects level of physical activity [42]. The average activity
code over each minute is calculated and represents the activity level for that minute. The
convergent validity of the two monitoring devices was determined independently using
correlational analyses and in combination using multiple regression analyses for each time period
[43]. The Tritrac vector magnitude correlated significantly higher (r=0.70) than heart rate
20
(r=0.49) for the normal classroom time period. However, when the physical education class was
compared, heart rate had a slightly stronger correlation (r=0.79) than the Tritrac vector
magnitude (r=0.77). Overall, investigators determined that the Tritrac provides a valid
assessment of physical activity under both classroom and physical activity conditions, however,
heart rate proved valid only during the active time period.
Overall, the triaxial accelerometers provide a valid measure of physical activity [44], but
their estimations of energy expenditure are less accurate. In general, these monitors overestimate
energy expenditure for activities with a small force:displacement ratio such as jumping, running;
and underestimate energy expenditure for activities with large force:displacement ratio such as
stair climbing, knee bends [3]. Their use in accurately estimating energy expenditure during
physical activity is also limited by the mode of exercise (non-weight bearing activities such as
cycling and static exercises such as weight lifting), by activities involving upper body
movement, by carrying a load, and by changes in surface and terrain [45].
Another problem inherent in this technique is the difficulty converting accelerometer
outputs, or counts, to units of energy expenditure. Algorithms or “count cutoffs” have been
derived to convert accelerometer counts to units of energy expenditure, but the predictive
validity of these equations in field settings has not been determined [32]. These monitors also
lack valid population specific regression equations, which increase error in the calculations.
An additional problem, related to the use of prediction equations, such as used in the
triaxial accelerometers, is tha t they assume steady-state exercise over a one-minute interval.
Consequently, if a child alternates between vigorous physical activity and rest within a given
minute (typical child play), the accumulation of counts for that minute will reflect only the
average activity level during that period [39]. Because this device does not differentiate between
21
intensities of physical activity, it compromises the accuracy of the absolute energy expenditure
estimations.
Despite these limitations, accelerometers have numerous advantages making them a
useful physical activity-measuring device. Accelerometers provide an objective, portable, re-
usable tool for assessing physical activity in large-scale epidemiological studies. They are small,
easy to use, and provide objective measures of activity across the full range of the activity
continuum. Many of these devices have the ability to store movement data for long periods of
time and feature interval based time sampling. These features make them well suited for
objective and detailed records of physical activity for behavioral and epidemiologic research.
2.2.4. Heart Rate (HR) Monitoring
The assumption underpinning HR monitoring as a measure of energy expenditure during
physical activity is that a linear relation exists between heart rate and oxygen consumption
during steady state exercise [5]. This relation, however, is most accurate for moderate intensity
exercise in the heart rate range of 110-150 beats per minute (bpm). It is not as valid at lower
(<110 bpm) and higher (>150 bpm) exercise intensities [4, 46, 47]. Eston et al. examined the
validity of HR monitoring in predicting the energy expenditure of physical activity in children
[4]. Heart rate was monitored and compared to allometrically scaled oxygen consumption
(sVO2) for a variety of exercises (treadmill walking and running) and typical children’s play
activities (hopscotch, catch, and coloring). Across all seven activities, HR was moderately
correlated with sVO2 (r =0.80). The mean error was the highest for sitting and coloring,
followed by catching, and the 8 and 10 km/h treadmill runs respectively. The mean error was the
lowest for hopscotch and the 4 km/h treadmill walk.
22
Similarly Welk et al. validated the use of HR to estimate physical activity energy
expenditure at low and high HR activities [43]. It was concluded that HR monitoring provided a
valid measure of physical activity during periods of increased activity (physical activity class)
but not during periods of relative inactivity (classroom activity). The within subject correlation
between HR and observed physical activity were similar during physical education class (r=0.79)
but were substantially lower during classroom activities (r=0.49).
There are many factors that raise HR while having little effect on the oxygen requirement
of the physical work. These include: emotional stress, fatigue, hydration status, food intake,
ambient temperature, humidity, body position, posture, active muscle group, type of muscle
contraction, gender, cardiorespiratory fitness, body size, and body composition [48]. For
example, high ambient temperatures, high humidity, and emotional stress will cause an increase
in heart rate without a significant rise in oxygen consumption during dynamic exercise. This is
one factor that limits the use of HR to predict energy expenditure of physical activity.
With respect to children, the physical fitness levels are also a limiting factor when HR
monitoring is used to assess physical activity. A higher aerobically fit child has a larger stroke
volume and hence a lower heart rate for any given activity. Mean daily heart rates may
therefore, be more representative of children’s physical fitness than their activity level [4, 7, 39].
Another problem when HR is used to predict energy expenditure is that HR response
tends to lag momentarily behind changes in movement. It is highly unlikely that laboratory
modeled HR-VO2 relations can capture the HR-VO2 dynamics associated with the typically rapid
changes in free- living activity patterns of children. In addition, the return of heart rate to
baseline also lags behind the return of oxygen uptake to baseline during recovery after physical
activity. Therefore, the use of exercise recovery HR results in an overestimation of energy
23
expenditure [5]. Children’s physical activity is highly transitory. The relative delay in heart rate
response to changes in movement suggests that heart rate monitors may mask potential energy
cost information. All of these factors have led investigators to question the validity of HR
monitoring to accurately predict energy expenditure.
Emons et al. reported an overestimation by 10.4% and 12.3% when comparing energy
expenditure derived heart rates to energy expenditure actually measured during a 1 day stay in a
total body calorimeter and a 2-week period of doubly labeled water assessment, respectively
[49]. It was also found that the predicted energy expenditure of less intense activities had higher
overestimations when they followed more intense activities. This is problematic for predicting
energy expenditure in children, as it is typical for them to alternate between periods of rest or
low activity and short bursts of high intensity activity.
Several techniques have been devised to overcome some of the limitations of HR
monitoring to predict energy expenditure of physical activity. One method involves developing
individual HR-VO2 calibration curves over a variety of exercise intensities and modes. An
example of this method is the FLEX HR. FLEX HR is empirically defined as the mean of the
lowest HR during exercise and the highest HR during rest [47]. The FLEX HR is based on the
assumption that above a given intensity threshold there is a linear relation between HR and
oxygen consumption. Below this threshold, the relation is more variable. Another predictor
technique uses the relative HR indices or net HR (work HR - resting HR) [3]. This method
attempts to correct for subject-to-subject variation in resting metabolic rate, individual HR, and
state of training [5].
FLEX HR is the most studied technique devised for overcoming the limitations of HR
monitoring. Ekelund et al. compared TEE estimated by the FLEX HR method (TEE HR) with
24
doubly labeled water (TEE DLW) in eight adolescent male athletes [50]. When comparing
methods at the individual level, a –11 to +24% discrepancy range was observed between TEE
HR and TEE DLW. In another study, Livingstone et al. examined the accuracy of the FLEX HR
method in estimating TEE in 36 free- living children compared to DLW [47]. Individual TEE
HR and TEE DLW discrepancies ranged from –16.9 to +18.8%. When examined on a group
basis, the TEE HR estimate was +10% of the TEE DLW. The investigators concluded, “The
FLEX HR method is a socially acceptable low-interference technique for accurately predicting
group estimates of habitual TEE in healthy, free- living children. However, the precision of
individual estimates of TEE HR is inevitably constrained by the need to apply contrived and
therefore, and most probably, unrepresentative calibration data to complex and spontaneous free-
living patterns of energy expenditure [47]”.
Though HR monitoring is not recommended to estimate individual energy expenditure of
physical activity, it is a valid method for predicting energy expenditure and patterns of physical
activity in large groups of free- living people [32]. Heart rate monitors can record data over time,
which will allow for assessment of physical activity patterns including frequency, intensity, and
duration of activity as well as TEE. Additionally, it is easy to measure, noninvasive, and
relatively inexpensive. Heart rate monitoring to predict energy expenditure can be used in a
variety of laboratory and field settings.
2.2.5. Doubly Labeled Water
DLW is considered the “gold standard” for measuring energy expenditure in the free
living environment [3, 32, 51] This method provides information on total energy expenditure by
a free- living individual over a period of 4-20 days [52]. The individual takes an oral dose of
water containing known amounts of stable (nonradioactive) isotopes of both hydrogen (2H2 or
25
deuterium) and oxygen (18O). Within a few hours following consumption, these isotopes mix
with the hydrogen and oxygen already present in the body water. As the body uses energy,
carbon dioxide (CO2) and water are produced. Carbon dioxide leaves the body via the breath,
while water is lost in breath, urine, sweat, and other evaporations. Since 18O is contained in both
CO2 and water, it is lost from the body more rapidly than 2H2, which is contained in water but
not in CO2. The difference between the two isotope elimination rates therefore, is proportional
to the total CO2 produced during the metabolic period [53]. Energy expenditure is then
calculated from CO2 production using standard equations derived from indirect calorimetry [51].
Since 1982 when the DLW method was initially used in humans to measure energy
expenditure, this procedure has undergone extensive validation studies. The accuracy and
precision of the earlier studies varied depending upon the isotope dose, length of the elimination
period, and frequency of sampling (two-point or multipoint). Calculation techniques, standards
for comparison and assumptions used in the model were also debated issues. In these earlier
studies, the coefficient of variation averaged 5-8%.
In one of the first validation studies, Schoeller et al. compared energy expenditure
derived from the doubly labeled water method against measured dietary intake plus change in
body composition [54]. Energy expenditure was calculated from energy balance by taking the
sum of the dietary intake and the change in body stores (dietary intake balance study). The
difference in energy expenditure between the two methods was within 220 kcals for three of the
four subjects and 307 kcals in the fourth subject. In this small sample, this amounted to 2%
difference in energy expenditure and a coefficient of variation of 6% between the two methods.
In a subsequent study, Schoeller and Webb compared the doubly labeled water method
with a respiratory gas exchange procedure [53]. Five subjects lived in a laboratory apartment for
26
five days. During this time, respiratory gas exchange was measured using a facemask that was
worn for the 5 days except for 20 minutes at breakfast and lunch and 60 minutes at dinner. All
the meals eaten were analyzed for energy content by bomb calorimetry and urine isotope and
nitrogen content were calculated. Energy expenditure measured by the DLW and respiratory gas
exchange methods differed by 6% and the coefficient of variation between methods was 8%. It
was concluded that these differences were not statistically significant [53].
After several years of examining and refining the DLW technique, the coefficient of
variation was reduced to 3-5% for the measurement of energy expenditure compared to a
criterion measure [55]. In 1990, Seale et al. conducted a study to compare estimates of energy
expenditure as determined by the DLW method with measured dietary intake and changes in
body stores [56]. Four adult men resided in a room-sized calorimeter on three alternate days
during one week of the 13-day study. While in the calorimeter, sub jects followed a fixed
schedule that closely resembled their normal daily living and received standardized meals. It
was found that the percent difference between energy expenditure estimated by adjusted (for
weight change) dietary intake and DLW was –1.04+ 0.63%. The investigation concluded that
there were no significant differences between energy expenditure estimated by the DLW method
and dietary intake balance and changes in body stores.
Subsequently, Seale et al. examined the precision and accuracy of the doubly labeled
water method to determine energy expenditure using whole room calorimetry as the criterion
measure [57]. Nine subjects resided in the calorimeter for five to seven consecutive days. Daily
CO2, water production and energy expenditure were averaged from calorimeter data and
compared with 2H218O results for the 5 or 7-day period. No significant differences were
observed between energy expenditure measured by calorimetry (11.0 MJ/day) and doubly
27
labeled water determined using different calculation methods (i.e. 11.17 MJ/day regression 1-
multipoint morning urine, 11.07 MJ/day regression 2-multipoint morning and evening urine and
11.16 MJ/day method 3-two-point urine on day 1 and day 8). The percent difference for energy
expenditure between calorimetry and each of the DLW methods were 1.55+2.57 (mean + SD)
for DLW method 1, 0.98+8.19 for DLW method 2 and 1.59+4.50 for method 3 [57].
The DLW method has several advantages over the other techniques described. It is
nonrestrictive and ideally suited for use with free- living subjects who can engage in normal
activities of daily life during the measurement period. It can be used in a variety of settings and
population sub-sets including premature infants, children, obese people, pregnant and lactating
women [58]. Energy expenditure can be measured over a relatively long period of time, i.e. up
to 3 weeks. The method is safe, painless and unobtrusive [59].
The limiting factor in using the DLW method is the prohibitive cost of the isotope 18O at
approximately $400.00-$600.00 per adult subject and $200.00 for a 30 kg child [3].
Additionally, the analysis of the isotopes requires expensive equipment and highly trained
technicians, thus further increasing the cost of this procedure [60]. Doubly labeled water cannot
be used to differentiate the duration, frequency, intensity of any single episode of physical
activity, or patterns of physical activity over time [61]. Accurate dietary records must be
obtained during the measurement period in order to calculate energy expenditure [59].
2.2.6. Indirect Calorimetry
As DLW is considered the gold standard for measuring energy expenditure in the free-
living environment, indirect calorimetry using respiratory-metabolic measures, is the gold
standard in the laboratory setting [44, 62]. Indirect calorimetry is the method by which energy
production is measured from oxygen consumption (VO2) and carbon dioxide (CO2) production in
28
the body [63]. Air flow and percentage of oxygen and carbon dioxide are precisely measured to
determine VO2 and carbon dioxide consumption (VCO2) and by calculation, the respiratory
exchange ratio (RER) [58]. Assuming that all oxygen is used to oxidize degradable fuels and all
the CO2 evolved is recovered, it is possible to calculate the total amount of energy produced [58].
“It should be clear that “energy production” means conversion of the chemical free-energy of
nutrients into the chemical energy of adenosine triphosphate (ATP) plus loss of some energy
during the oxidative process. Eventually, however, all energy will be converted into heat [63].”
To validate the accuracy of indirect calorimetry in measuring energy production, the
procedure was initially compared to direct calorimetry. Direct calorimetry measures the total
heat loss by the body from which energy expenditure can be estimated. When using the direct
calorimetry method an individual is placed in a thermically isolated chamber and the heat
dissipated by the body (evaporation, radiation, conduction and convection) is collected and
measured. “Under conditions of unchanging temperature and energy store repletion, direct and
indirect calorimetry simply look at the two sides, removal and production, respectively of the
heat balance equation [63].”
Dauncey et al. examined the accuracy of measuring energy expenditure via direct
calorimetry (total heat loss) and indirect calorimetry (heat production calculated from VO2 and
VCO2). Eight subjects lived in a whole-body calorimeter for 28 hours on 3 separate occasions,
separated by at least one month. Subjects were fed low, medium, and high caloric diets.
Subjects were free to perform a variety of sedentary activities such as reading, watching
television, writing and listening to the radio. The mean percent difference between energy
expenditure measured via indirect calorimetry and direct calorimetry was only 1.2+ 0.14% [64].
29
Similarly, Seale et al. found no significant differences in energy expenditure determined
by direct and indirect calorimetry [56]. Four subjects spent three alternate days over one week in
a room-sized calorimeter. Subjects were fed regular meals and followed a fixed schedule that
included sleeping, exercising, eating, and participating in free-activity periods. Direct (heat
emission) and indirect calorimetry (respiratory gas exchange) data were measured
simultaneously and corrected to determine 24-hour energy expenditure. The results indicated
that energy expenditure measured in a controlled environment with direct (2798+25 kcal) and
indirect (2816+31 kcals) calorimetry was equivalent. The mean difference between energy
expenditure measured by indirect calorimetry and direct calorimetry was 0.63+0.44%.
The accuracy and precision of the indirect calorimetry in measuring energy expenditure
has made it the method of choice to validate heart rate monitors, pedometers, accelerometers and
DLW in the laboratory setting [32]. In general indirect calorimetry has been used to determine
the energy cost of specific activities within the laboratory setting.
Although this technique is accurate, there are limitations that restrict its use. Indirect
calorimetry is a costly procedure; metabolic systems are priced from $20,000 to $100,000.
Trained personnel are required to operate and interpret the results. The respiratory metabolic
units, even the portable units, are cumbersome and can alter patterns of physical activity
particularly in the free- living environment because of the limitations they place on the
individual’s movement [32]. In the field, data collection is limited to 8 hours, so 24-hour free-
living energy expenditure would have to be extrapolated and this may not be a valid statistical
assumption. Short-term data collection does not provide information about daily physical
activity patterns under normal living conditions.
30
2.2.7. Combination Systems
Because of the limitations of the practical field methods for assessing the energy
expenditure of physical activity, there have been attempts to combine approaches in an effort to
improve validity. In order to improve the precision of heart rate derived estimates of free-living
energy expenditure, several investigations have used a combination of heart rate with
acclerometry [9]. The principle behind this method is to use a motion sensor as a back-up
measure to verify that elevations in heart rate are representative of responses to physical activity.
This would help to reduce the variability of heart rate as a single predictive measure, due to
intervening factors that increase heart rate and yet do not contribute to energy expenditure [58].
To date several studies have used combined techniques to improve estimates of physical
activity energy expenditure. Moon et al. combined heart rate and movement counts (via a
physical activity vibration sensor, Act I, Mini-mitter). Heart rate and physical activity counts
were monitored in twenty adults for two days while they resided in a room calorimeter and for
three days in a free-living environment. During the time spent in the room calorimeter, HR and
physical activity counts were calibrated to metabolic rate for each subject. During the three days
of free- living, HR and PA were recorded. Using the HR and PA recordings and the
individualized calibration data, regression equations were developed to predict both oxygen
consumption and carbon dioxide production. It was concluded that the precision of VO2 and
VCO2 predictions was improved by combining PA monitoring with electronically recorded HR.
“Physical activity data were most effective when used to assign HR to separate active and
inactive VO2 and VCO2 prediction functions than when entered simultaneously with HR in
nonlinear equations [65].” The range of prediction errors for VO2 and VCO2 were -3.3+3.5%
and -4.6+3% respectively.
31
In another study, Haskell et al. tested the concept of simultaneous recording and analysis
of HR and body motion via movement sensors in 19 adult men. Subjects were evaluated while
performing seven exercise conditions, including walking and running at various speed and grade
combinations, arm cranking, cycling and bench stepping. Heart rate, leg motion, arm motion, and
oxygen uptake were recorded. The results demonstrated that the accuracy of estimating oxygen
consumption during a wide range of activities improved when individualized HR-VO2
regressions were used and HR and body movement were analyzed simultaneously rather than
separately [66].
In a study previously mentioned, Eston et al. tested the accuracy of various physical
activity monitors (HR, pedometry, uniaxial and triaxial accelerometry, and various
combinations) to predict oxygen consumption [4]. Thirty Welsh children completed a protocol
involving walking and running on a treadmill, playing hopscotch, playing catch, and sitting and
coloring. A multiple regression equation that included triaxial accelerometry counts and HR
predicted oxygen consumption better than any single or combination measures, with R2= 0.85.
Conceptually it makes sense that combining techniques would improve the accuracy of
measuring energy expenditure using a physical activity monitor. Additionally, the combination
of measures helps reduce the limitations inherent in each of the single physical activity monitors.
For instance, by combining HR and accelerometry, the measurement of energy expenditure is
more accurate and, the increases in HR can be checked against the accelerometer to verify if the
increases are related to physical activity. Together these two techniques can provide a clearer
picture of patterns of physical activity in the field setting.
32
2.2.8. Body Media SenseWear® Pro 2 Armband
The SenseWear® Pro 2 Armband uses the combination measurement system to calculate
energy expenditure. Preliminary experimental evidence has been equivocal. Fruin conducted a
study to examine the reliability and validity of the SenseWear® Pro 2 Armband during rest and
exercise [67]. Indirect calorimetry served as the criterion measure. Energy expenditure was
measured in thirteen male subjects during two resting and one cycle erogmeter sessions. The
cycle ergometer bout consisted of pedaling for 40 minutes at 60 rpm at a fixed load, which
represented 60% of the subjects predetermined VO2peak. Data was collected over the forty
minutes and reported as three distinct time periods early (1-10 minutes), mid (19-23 minutes)
and late (31-40 minutes). Results of a two factor ANOVA (time x device) with repeated
measures on time indicated a significant time by device interaction as was reflected by an
increase in the SenseWear® Pro 2 Armband estimate of energy expenditure at each time period
contrasted by the steady energy expenditure measurement of the respiratory metabolic system.
The greatest variation in energy expenditure means occurred during the early time period (8.8%
difference, P>0.07), although post hoc analysis did not find any significant differences. The
correlation between measuring devices was low for each time period early (r= 0.11; P>0.72), mid
(r = 0.12; P>0.70), and late (r = 0.03; P>0.92). In addition, the Bland-Altman plots showed wide
limits of agreement between the two devices with larger prediction error seen for individuals
with the highest and lowest energy expenditures. At rest, no significant differences were found
between energy expenditure measurements from the SenseWear® Pro 2 Armband
(1.30+0.03kcal/min) and indirect calorimetry (1.29+0.04 kcal/min) for the individual or the
combined resting periods.
33
In a second experiment, Fruin tested 20 adults on a treadmill for 10 minutes each at 3.0
mph, 0% grade; 4 mph, 0% grade; and 4 mph, 5% grade [67]. Energy expenditure measured by
the SenseWear® Pro 2 Armband increased with treadmill speed, but not with inclination. The
SenseWear® Pro 2 Armband significantly overestimated the energy expenditure of flat walking
(27.4% for 3 mph, p<0.001; 12.6% for 4 mph, p<0.02) and significantly underestimated energy
expenditure of walking on a 5% grade (21.9%, p<0.002).
King et al. examined the accuracy of the SenseWear® Pro 2 Armband to estimate energy
expenditure in adults during treadmill exercise [68]. Nine females and 10 males performed 10-
minute interva l bouts on the treadmill at six different walking and running speeds. The energy
expenditure determined by the SenseWear® Pro 2 Armband increased with increasing treadmill
speed. However, the SenseWear® Pro 2 Armband overestimated energy expenditure at all seven
treadmill speeds compared to indirect calorimetry [mean (SE) difference for all speeds; 2.1 + 0.2
kcal.min-1, P < 0.01]. The SenseWear® Pro 2 Armband was sensitive to changes in energy
expenditure over a wide range of walking and running speeds on the treadmill, however, the
instrument overestimated energy expenditure compared to indirect calorimetry.
Jakicic et al. evaluated the SenseWear® Pro 2 Armbands ability to accurately
estimate energy expenditure during various modes of physical activity [10]. Forty adult subjects
completed protocols on the treadmill (30 minutes at 3.0 mph with 10 minutes stages at grades of
0%, 5%), cycle ergometer (two 10-minute stages at 0.5 kg and 1.5 kg break loads), arm
ergometer (two 10-minute stages of 50 and 75 rpm at a break load of 1.0 kg), and bench step
(two 10-minute stages of 20 steps per minute and 35 steps per minute on an eight inch step).
Indirect calorimetry served as the criterion measure. The SenseWear® Pro 2 Armband
significantly overestimated energy expenditure during level treadmill walking by 1.3 + 0.50
34
kcal.minute-1; (minutes 1-10) and significantly underestimated energy expenditure of walking on
a 5 or 10% treadmill grade by 0.3 + 0.60 kcal.minute-1 (minutes 11-20) and by 2.4 + 0.9
kcal.minute-1 (minutes 21-30) (P< 0.016), respectively. For cycle ergometer exercise, the
SenseWear® Pro 2 Armband significantly underestimated energy expenditure by 0.4 + 0.80
kcal.minute-1 during minutes 1-10 and by 2.9 + 1.1 kcal.minute-1 during minutes 11-20 (P<
0.025). The SenseWear® Pro 2 Armband estimate of the total energy expenditure exercise was
also significantly lower for cycle ergometer exercise (32.4 + 18.8 total kcal; P<0.001) and for
walking on the treadmill (14.9 + 17.5 total kcal; P<0.001) compared to the respiratory metabolic
system.
Conflicting results from these preliminary research studies can best be explained by the
ongoing revising and updating of the algorithms used by the SenseWear® Pro 2 Armband to
calculate energy expenditure. To date there are no published data on the validity of the
SenseWear® Pro 2 Armband in studies that have used this device to measure physical activity in
adolescents.
Function of the BodyMedia SenseWear® Pro 2 Armband. The combination of sensors
makes the BodyMedia SenseWear® Pro 2 Armband unique in its ability to detect and calculate
energy expenditure. Among the biometric sensors, the Armband uses a two-axis accelerometer
for motion detection. Measuring acceleration of body mass may be useful in estimating energy
expenditure [3]. Body movement, muscular activity, and gravity is mapped to forces exerted on
the body, which can in turn, can be mapped to energy expended by the muscles of the body to
generate these forces. The SenseWear® Pro 2 Armband uses the physical energy as part of the
calculation to determine energy expenditure.
35
The remaining biometric sensors contained in the SenseWear® Pro 2 Armband measure
either heat produced by the body or surrounding environment to improve the estimation of
energy expenditure. The body dissipates heat to the environment in many forms: heat
convection through the skin being in contact with the air, heat conduction through the clothing,
evaporation of sweat on the skin, evaporation of exhaled moisture and heat radiation. The
SenseWear’s heat flux sensor measures the amount of heat being exchanged by the body to the
outside environment (heat convection).
The SenseWear® Pro 2 Armband measures skin temperature using a thermistor-based
sensor. Thermistors are resistors that change value with temperature [2]. Continuously
measured skin temperature, although it is several degrees cooler, is linearly reflective of the
body’s core temperature. Under laboratory conditions, core body temperature and energy
expenditure are closely related [3].
The SenseWear’s near-body ambient temperature sensor measures air temperature and
the immediate environmental temperature around the armband. The rate of change in near-
ambient temperature can be used to delineate changes in core temperature due to the changes in
environmental temperature.
Also included in the SenseWear® Pro 2 Armband system are two stainless steel
electrodes which measure galvanic skin response (GSR). Galvanic skin response measures the
electrical conductivity between two points on the skin. A low level electric voltage is applied to
the skin and the skin’s conduction of the current is measured. GSR reflects evaporative heat loss
and can be an indicator for the onset, peak, and recovery of maximal sweat rates [2].
Along with these sensors, the SenseWear® Pro 2 Armband system has the option to
monitor heart rate. Instantaneous heart rate is recorded providing information on frequency,
36
intensity, and duration of physical activity patterns. The physiologic information gathered by all
of the sensors along with knowledge of simple body measurements such as weight, height, age,
gender, etc, are processed using SenseWear’s algorithms to provide estimations of energy
expenditure.
SenseWear® Pro 2 Armband utilizes contextual information in the calculation of energy
expenditure which greatly enhances its reliability and accuracy [2]. The SenseWear® Pro 2
Armband has the ability to accurately detect contexts in free-living situations including
exercising, motoring, watching television, getting into and out of bed [11]. As a result, the
SenseWear® Pro 2 Armband has the capability to filter out erroneous sources of movement such
as driving a car, which might falsely elevate estimates of energy expenditure. This fact has
significant ramifications for the SenseWear® Pro 2 Armband’s ability to accurately detect energy
expenditure in free-living situations and sets the Armband apart from other energy detection
devices.
2.3. CONCLUSION
A physical activity monitor, like the SenseWear® Pro 2 Armband that accurately
estimates physical activity duration, intensity and energy expenditure in the free living
environment could be used to help answer long standing questions about physical activity
patterns, energy imbalance, compliance with physical activity guidelines and the dose-response
relation between physical activity and health. Therefore, the purpose of this study was to
examine the validity of the SenseWear® Pro 2 Armband as a measuring tool for assessing energy
expenditure during various modes of physical activity in children.
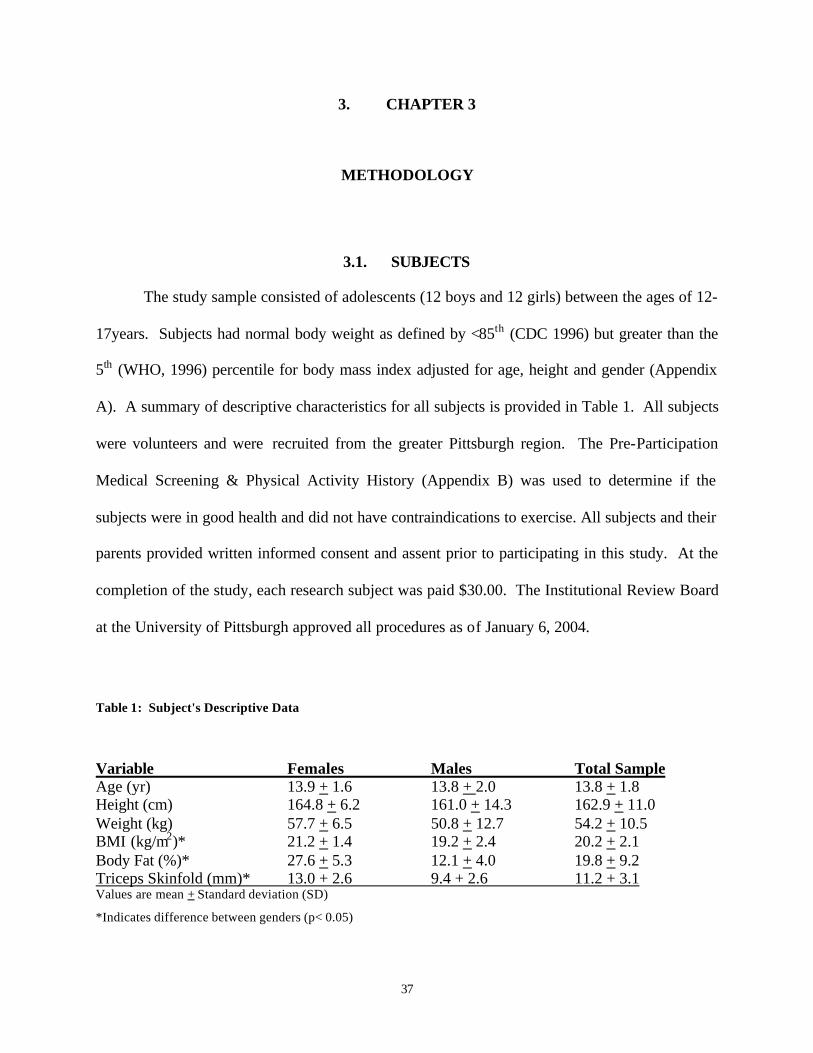
37
3. CHAPTER 3
METHODOLOGY
3.1. SUBJECTS
The study sample consisted of adolescents (12 boys and 12 girls) between the ages of 12-
17years. Subjects had normal body weight as defined by <85th (CDC 1996) but greater than the
5th (WHO, 1996) percentile for body mass index adjusted for age, height and gender (Appendix
A). A summary of descriptive characteristics for all subjects is provided in Table 1. All subjects
were volunteers and were recruited from the greater Pittsburgh region. The Pre-Participation
Medical Screening & Physical Activity History (Appendix B) was used to determine if the
subjects were in good health and did not have contraindications to exercise. All subjects and their
parents provided written informed consent and assent prior to participating in this study. At the
completion of the study, each research subject was paid $30.00. The Institutional Review Board
at the University of Pittsburgh approved all procedures as of January 6, 2004.
Table 1: Subject's Descriptive Data
Variable Females Males Total Sample Age (yr) 13.9 + 1.6 13.8 + 2.0 13.8 + 1.8 Height (cm) 164.8 + 6.2 161.0 + 14.3 162.9 + 11.0 Weight (kg) 57.7 + 6.5 50.8 + 12.7 54.2 + 10.5 BMI (kg/m2)* 21.2 + 1.4 19.2 + 2.4 20.2 + 2.1 Body Fat (%)* 27.6 + 5.3 12.1 + 4.0 19.8 + 9.2 Triceps Skinfold (mm)* 13.0 + 2.6 9.4 + 2.6 11.2 + 3.1 Values are mean + Standard deviation (SD)
*Indicates difference between genders (p< 0.05)
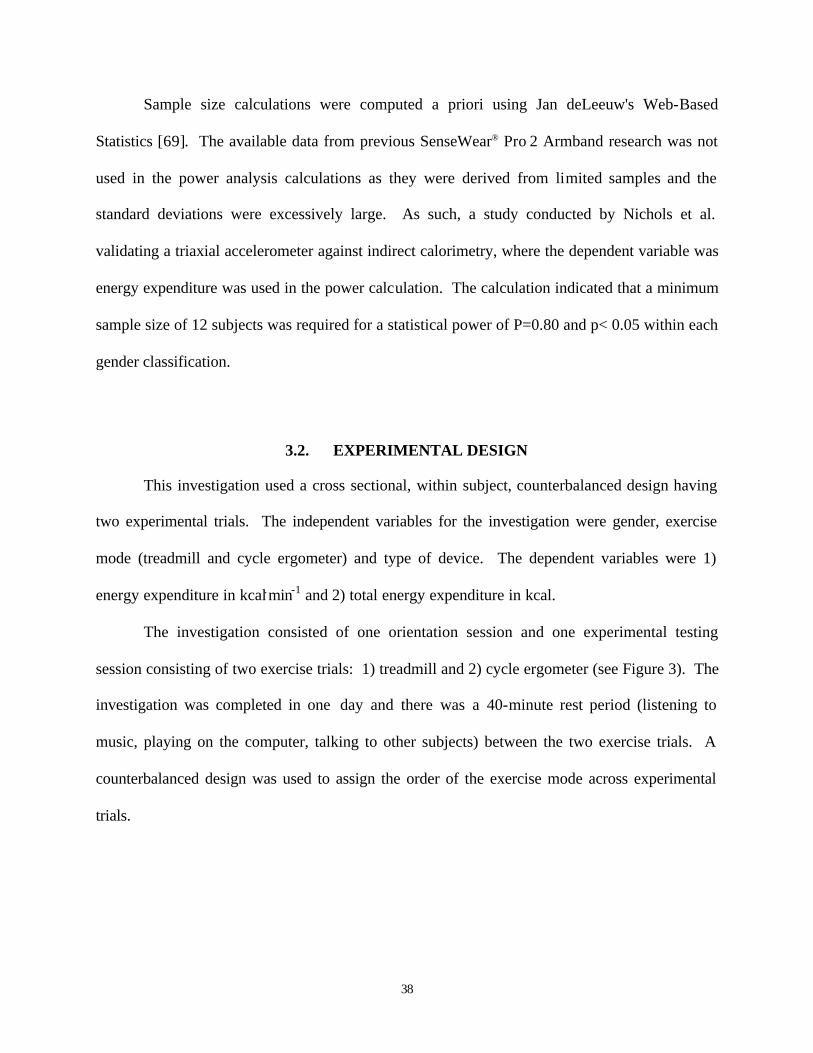
38
Sample size calculations were computed a priori using Jan deLeeuw's Web-Based
Statistics [69]. The available data from previous SenseWear® Pro 2 Armband research was not
used in the power analysis calculations as they were derived from limited samples and the
standard deviations were excessively large. As such, a study conducted by Nichols et al.
validating a triaxial accelerometer against indirect calorimetry, where the dependent variable was
energy expenditure was used in the power calculation. The calculation indicated that a minimum
sample size of 12 subjects was required for a statistical power of P=0.80 and p< 0.05 within each
gender classification.
3.2. EXPERIMENTAL DESIGN
This investigation used a cross sectional, within subject, counterbalanced design having
two experimental trials. The independent variables for the investigation were gender, exercise
mode (treadmill and cycle ergometer) and type of device. The dependent variables were 1)
energy expenditure in kcal.min-1 and 2) total energy expenditure in kcal.
The investigation consisted of one orientation session and one experimental testing
session consisting of two exercise trials: 1) treadmill and 2) cycle ergometer (see Figure 3). The
investigation was completed in one day and there was a 40-minute rest period (listening to
music, playing on the computer, talking to other subjects) between the two exercise trials. A
counterbalanced design was used to assign the order of the exercise mode across experimental
trials.
39
Figure 3 Schematic Diagram of the Experimental Sequence
3.3. ENERGY EXPENDITURE MEASUREMENT
All testing was done in the Center for Exercise and Health Fitness Research in Trees Hall
at the University of Pittsburgh.
Cycle Ergometer: A Monark Cycle Ergometer Model # 818 was used to conduct the
cycle experimental trial.
Treadmill: A Trackmaster TMX425 was used to conduct the treadmill experimental
trial.
Indirect Calorimetry: Energy expenditure measured by indirect calorimetry served as
the dependent variable. Data was collected at one-minute intervals using an open circuit
respiratory-metabolic system (Parvomedics TrueMax 2400 Metabolic Measurement System).
The electronic analyzers were calibrated immediately prior to testing and at the completion of
each exercise bout using standard reference gases. Depending on comfort and ability to make a
tight seal around the mouthpiece with the lips, either a child or an adult respiratory valve and
mouthpiece was used.
1. Signed consent forms 2. Medical screening 3. Explained experimental procedure 4. Familiarization with
equipment TOTAL TIME: 30 MIN
Exercise Trial 1 1. Body Composition 2. 20 minute treadmill or 12 minute cycle ergometer test TOTAL TIME: 30 min treadmill or 20 min cycle
Exercise Trial 2 1. Body Composition 2. 20 minute treadmill or 12 minute cycle ergometer test TOTAL TIME: 30 min treadmill or 20 min cycle
40 min 5 min
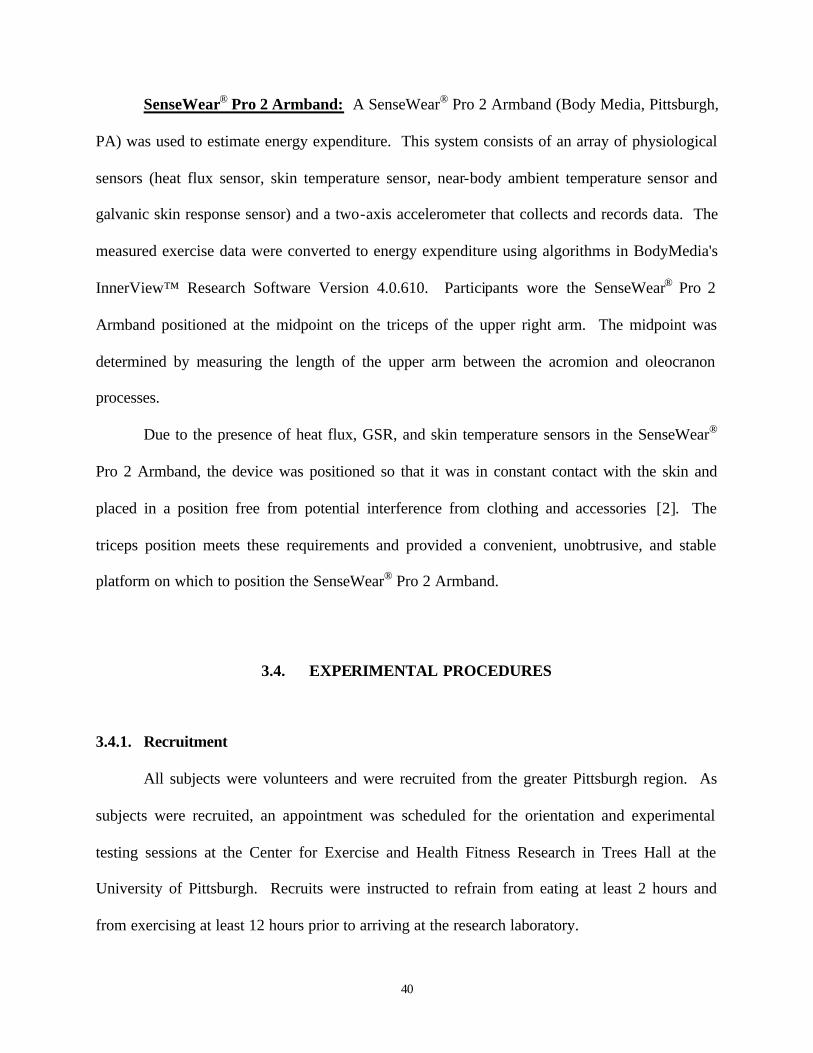
40
SenseWear® Pro 2 Armband: A SenseWear® Pro 2 Armband (Body Media, Pittsburgh,
PA) was used to estimate energy expenditure. This system consists of an array of physiological
sensors (heat flux sensor, skin temperature sensor, near-body ambient temperature sensor and
galvanic skin response sensor) and a two-axis accelerometer that collects and records data. The
measured exercise data were converted to energy expenditure using algorithms in BodyMedia's
InnerView™ Research Software Version 4.0.610. Participants wore the SenseWear® Pro 2
Armband positioned at the midpoint on the triceps of the upper right arm. The midpoint was
determined by measuring the length of the upper arm between the acromion and oleocranon
processes.
Due to the presence of heat flux, GSR, and skin temperature sensors in the SenseWear®
Pro 2 Armband, the device was positioned so that it was in constant contact with the skin and
placed in a position free from potential interference from clothing and accessories [2]. The
triceps position meets these requirements and provided a convenient, unobtrusive, and stable
platform on which to position the SenseWear® Pro 2 Armband.
3.4. EXPERIMENTAL PROCEDURES
3.4.1. Recruitment
All subjects were volunteers and were recruited from the greater Pittsburgh region. As
subjects were recruited, an appointment was scheduled for the orientation and experimental
testing sessions at the Center for Exercise and Health Fitness Research in Trees Hall at the
University of Pittsburgh. Recruits were instructed to refrain from eating at least 2 hours and
from exercising at least 12 hours prior to arriving at the research laboratory.
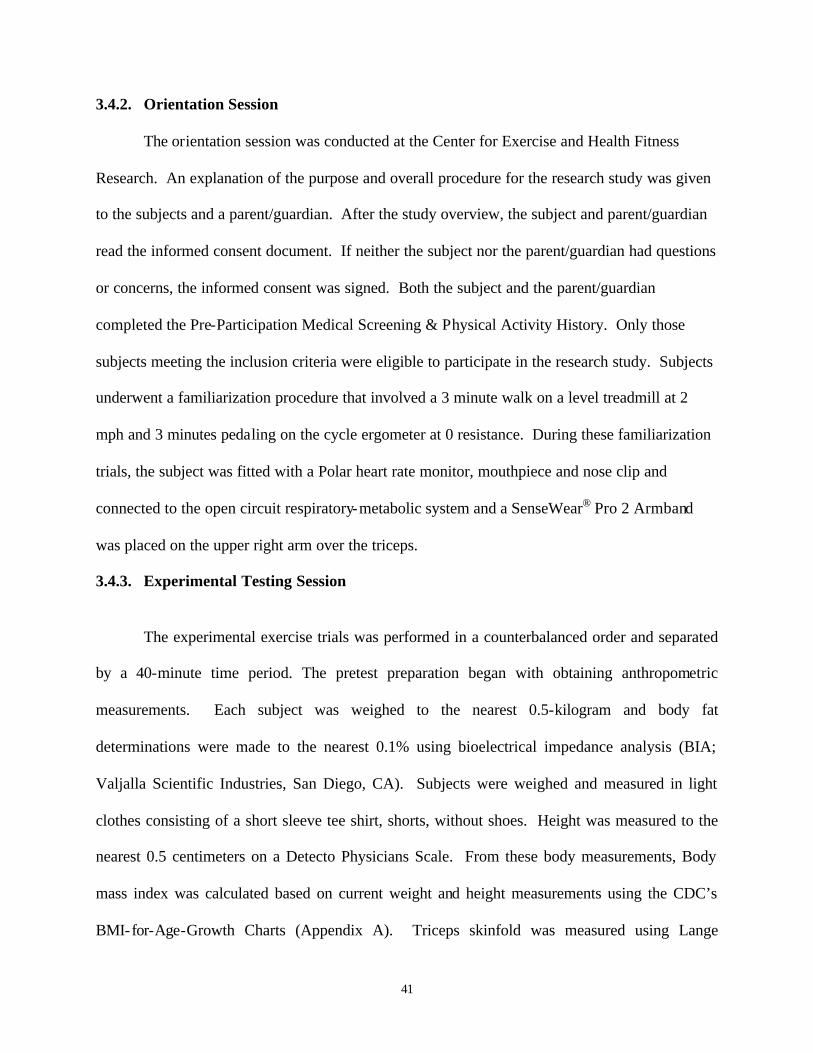
41
3.4.2. Orientation Session
The orientation session was conducted at the Center for Exercise and Health Fitness
Research. An explanation of the purpose and overall procedure for the research study was given
to the subjects and a parent/guardian. After the study overview, the subject and parent/guardian
read the informed consent document. If neither the subject nor the parent/guardian had questions
or concerns, the informed consent was signed. Both the subject and the parent/guardian
completed the Pre-Participation Medical Screening & Physical Activity History. Only those
subjects meeting the inclusion criteria were eligible to participate in the research study. Subjects
underwent a familiarization procedure that involved a 3 minute walk on a level treadmill at 2
mph and 3 minutes pedaling on the cycle ergometer at 0 resistance. During these familiarization
trials, the subject was fitted with a Polar heart rate monitor, mouthpiece and nose clip and
connected to the open circuit respiratory-metabolic system and a SenseWear® Pro 2 Armband
was placed on the upper right arm over the triceps.
3.4.3. Experimental Testing Session
The experimental exercise trials was performed in a counterbalanced order and separated
by a 40-minute time period. The pretest preparation began with obtaining anthropometric
measurements. Each subject was weighed to the nearest 0.5-kilogram and body fat
determinations were made to the nearest 0.1% using bioelectrical impedance analysis (BIA;
Valjalla Scientific Industries, San Diego, CA). Subjects were weighed and measured in light
clothes consisting of a short sleeve tee shirt, shorts, without shoes. Height was measured to the
nearest 0.5 centimeters on a Detecto Physicians Scale. From these body measurements, Body
mass index was calculated based on current weight and height measurements using the CDC’s
BMI-for-Age-Growth Charts (Appendix A). Triceps skinfold was measured using Lange
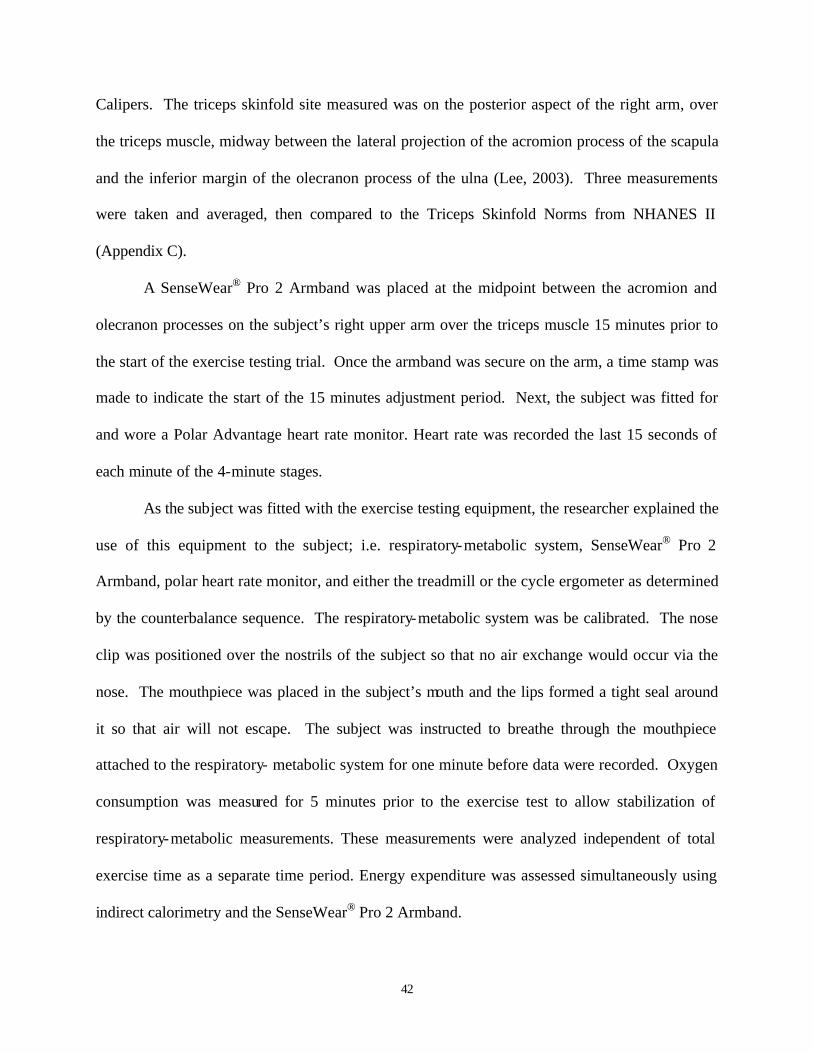
42
Calipers. The triceps skinfold site measured was on the posterior aspect of the right arm, over
the triceps muscle, midway between the lateral projection of the acromion process of the scapula
and the inferior margin of the olecranon process of the ulna (Lee, 2003). Three measurements
were taken and averaged, then compared to the Triceps Skinfold Norms from NHANES II
(Appendix C).
A SenseWear® Pro 2 Armband was placed at the midpoint between the acromion and
olecranon processes on the subject’s right upper arm over the triceps muscle 15 minutes prior to
the start of the exercise testing trial. Once the armband was secure on the arm, a time stamp was
made to indicate the start of the 15 minutes adjustment period. Next, the subject was fitted for
and wore a Polar Advantage heart rate monitor. Heart rate was recorded the last 15 seconds of
each minute of the 4-minute stages.
As the subject was fitted with the exercise testing equipment, the researcher explained the
use of this equipment to the subject; i.e. respiratory-metabolic system, SenseWear® Pro 2
Armband, polar heart rate monitor, and either the treadmill or the cycle ergometer as determined
by the counterbalance sequence. The respiratory-metabolic system was be calibrated. The nose
clip was positioned over the nostrils of the subject so that no air exchange would occur via the
nose. The mouthpiece was placed in the subject’s mouth and the lips formed a tight seal around
it so that air will not escape. The subject was instructed to breathe through the mouthpiece
attached to the respiratory- metabolic system for one minute before data were recorded. Oxygen
consumption was measured for 5 minutes prior to the exercise test to allow stabilization of
respiratory-metabolic measurements. These measurements were analyzed independent of total
exercise time as a separate time period. Energy expenditure was assessed simultaneously using
indirect calorimetry and the SenseWear® Pro 2 Armband.
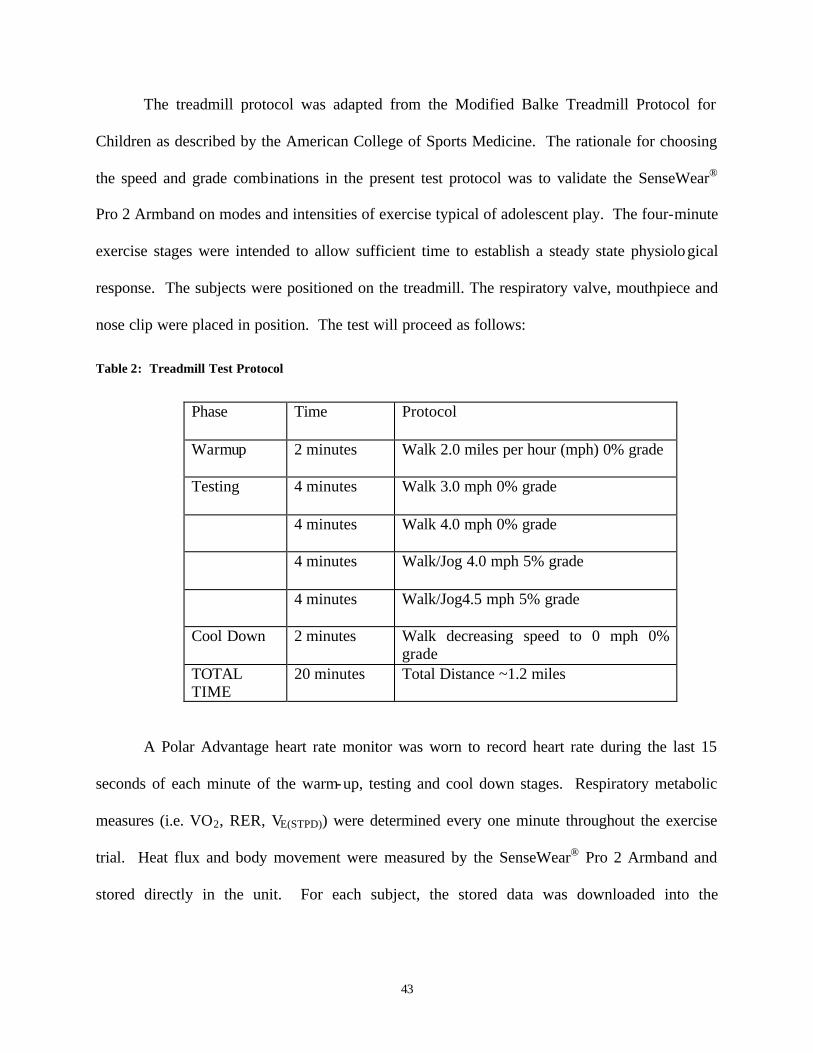
43
The treadmill protocol was adapted from the Modified Balke Treadmill Protocol for
Children as described by the American College of Sports Medicine. The rationale for choosing
the speed and grade combinations in the present test protocol was to validate the SenseWear®
Pro 2 Armband on modes and intensities of exercise typical of adolescent play. The four-minute
exercise stages were intended to allow sufficient time to establish a steady state physiological
response. The subjects were positioned on the treadmill. The respiratory valve, mouthpiece and
nose clip were placed in position. The test will proceed as follows:
Table 2: Treadmill Test Protocol
Phase Time Protocol
Warmup 2 minutes Walk 2.0 miles per hour (mph) 0% grade
Testing 4 minutes Walk 3.0 mph 0% grade
4 minutes Walk 4.0 mph 0% grade
4 minutes Walk/Jog 4.0 mph 5% grade
4 minutes Walk/Jog4.5 mph 5% grade
Cool Down 2 minutes Walk decreasing speed to 0 mph 0% grade
TOTAL TIME
20 minutes Total Distance ~1.2 miles
A Polar Advantage heart rate monitor was worn to record heart rate during the last 15
seconds of each minute of the warm-up, testing and cool down stages. Respiratory metabolic
measures (i.e. VO2, RER, VE(STPD)) were determined every one minute throughout the exercise
trial. Heat flux and body movement were measured by the SenseWear® Pro 2 Armband and
stored directly in the unit. For each subject, the stored data was downloaded into the
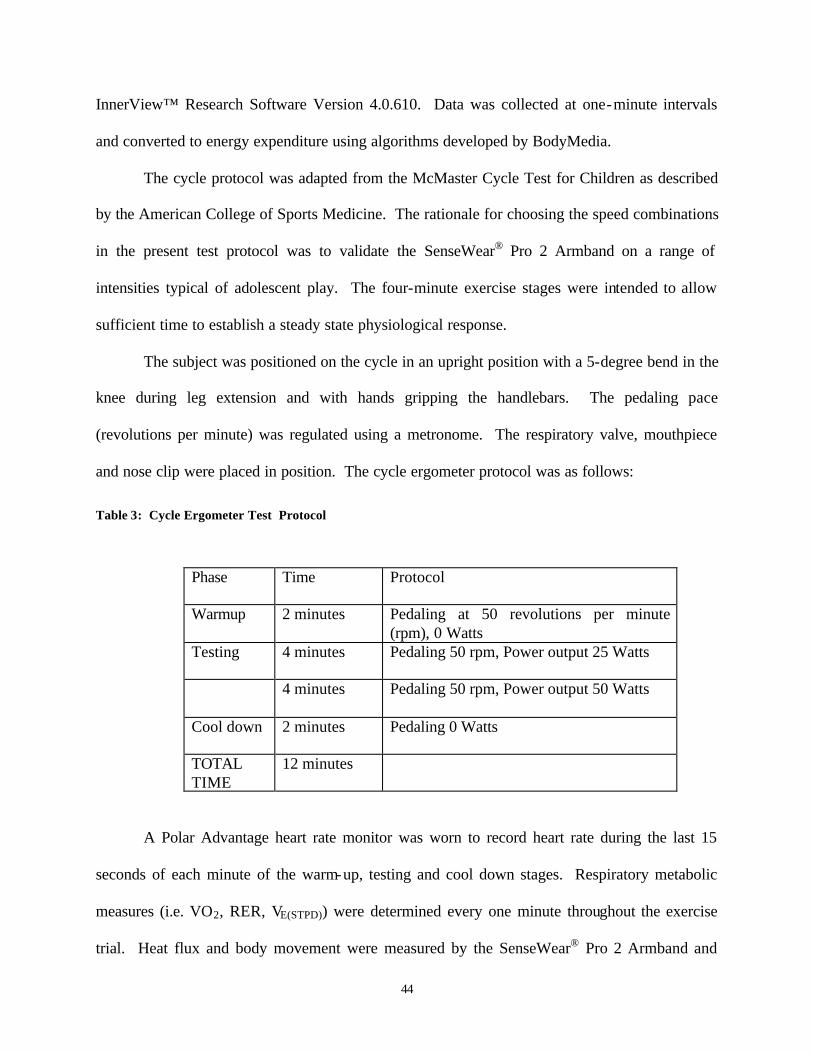
44
InnerView™ Research Software Version 4.0.610. Data was collected at one-minute intervals
and converted to energy expenditure using algorithms developed by BodyMedia.
The cycle protocol was adapted from the McMaster Cycle Test for Children as described
by the American College of Sports Medicine. The rationale for choosing the speed combinations
in the present test protocol was to validate the SenseWear® Pro 2 Armband on a range of
intensities typical of adolescent play. The four-minute exercise stages were intended to allow
sufficient time to establish a steady state physiological response.
The subject was positioned on the cycle in an upright position with a 5-degree bend in the
knee during leg extension and with hands gripping the handlebars. The pedaling pace
(revolutions per minute) was regulated using a metronome. The respiratory valve, mouthpiece
and nose clip were placed in position. The cycle ergometer protocol was as follows:
Table 3: Cycle Ergometer Test Protocol
Phase Time Protocol
Warmup 2 minutes Pedaling at 50 revolutions per minute (rpm), 0 Watts
Testing 4 minutes Pedaling 50 rpm, Power output 25 Watts
4 minutes Pedaling 50 rpm, Power output 50 Watts
Cool down 2 minutes Pedaling 0 Watts
TOTAL TIME
12 minutes
A Polar Advantage heart rate monitor was worn to record heart rate during the last 15
seconds of each minute of the warm-up, testing and cool down stages. Respiratory metabolic
measures (i.e. VO2, RER, VE(STPD)) were determined every one minute throughout the exercise
trial. Heat flux and body movement were measured by the SenseWear® Pro 2 Armband and
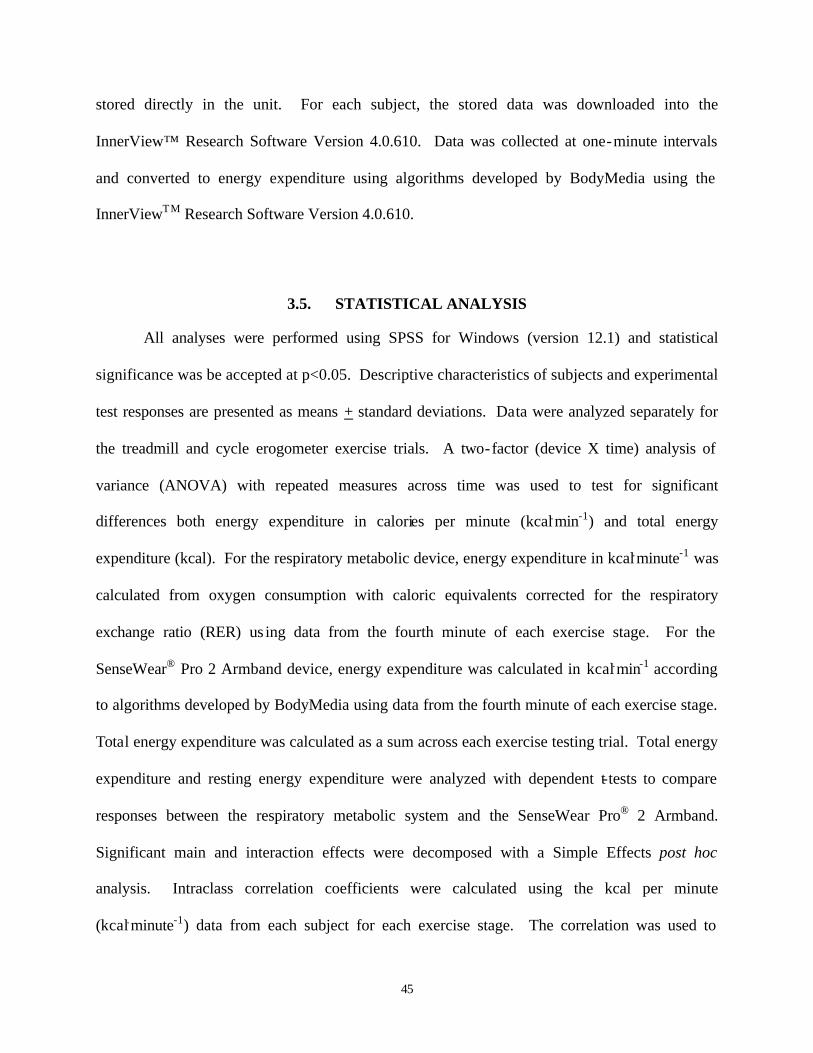
45
stored directly in the unit. For each subject, the stored data was downloaded into the
InnerView™ Research Software Version 4.0.610. Data was collected at one-minute intervals
and converted to energy expenditure using algorithms developed by BodyMedia using the
InnerViewTM Research Software Version 4.0.610.
3.5. STATISTICAL ANALYSIS
All analyses were performed using SPSS for Windows (version 12.1) and statistical
significance was be accepted at p<0.05. Descriptive characteristics of subjects and experimental
test responses are presented as means + standard deviations. Data were analyzed separately for
the treadmill and cycle erogometer exercise trials. A two-factor (device X time) analysis of
variance (ANOVA) with repeated measures across time was used to test for significant
differences both energy expenditure in calories per minute (kcal.min-1) and total energy
expenditure (kcal). For the respiratory metabolic device, energy expenditure in kcal.minute-1 was
calculated from oxygen consumption with caloric equivalents corrected for the respiratory
exchange ratio (RER) us ing data from the fourth minute of each exercise stage. For the
SenseWear® Pro 2 Armband device, energy expenditure was calculated in kcal.min-1 according
to algorithms developed by BodyMedia using data from the fourth minute of each exercise stage.
Total energy expenditure was calculated as a sum across each exercise testing trial. Total energy
expenditure and resting energy expenditure were analyzed with dependent t-tests to compare
responses between the respiratory metabolic system and the SenseWear Pro® 2 Armband.
Significant main and interaction effects were decomposed with a Simple Effects post hoc
analysis. Intraclass correlation coefficients were calculated using the kcal per minute
(kcal.minute-1) data from each subject for each exercise stage. The correlation was used to
46
describe the strength of the relation between these two measuring devices for estimating energy
expenditure. In addition, data were analyzed using the procedure described by Altman and
Bland [70] to assess the differences between energy expenditure measured using the respiratory
metabolic system and estimated using the SenseWear Pro® 2 Armband. A one-way ANOVA
was calculated to determine if there was an effect of testing order (Appendix C). No order effect
was detected.
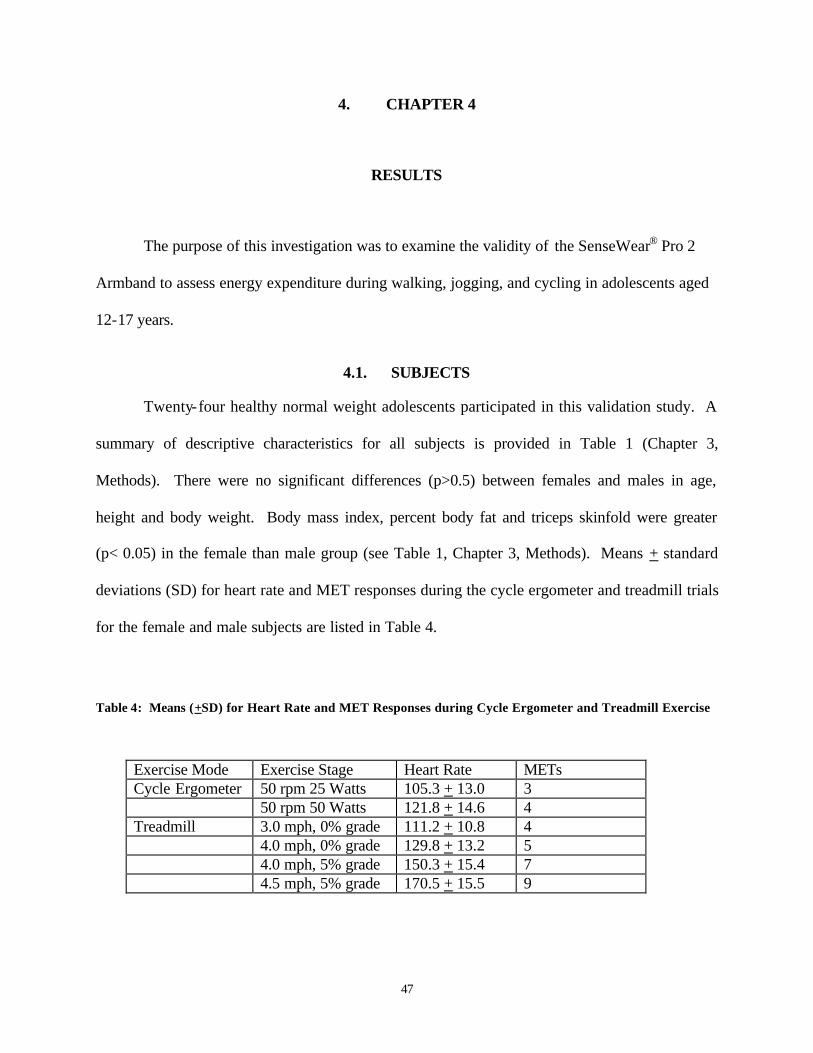
47
4. CHAPTER 4
RESULTS
The purpose of this investigation was to examine the validity of the SenseWear® Pro 2
Armband to assess energy expenditure during walking, jogging, and cycling in adolescents aged
12-17 years.
4.1. SUBJECTS
Twenty-four healthy normal weight adolescents participated in this validation study. A
summary of descriptive characteristics for all subjects is provided in Table 1 (Chapter 3,
Methods). There were no significant differences (p>0.5) between females and males in age,
height and body weight. Body mass index, percent body fat and triceps skinfold were greater
(p< 0.05) in the female than male group (see Table 1, Chapter 3, Methods). Means + standard
deviations (SD) for heart rate and MET responses during the cycle ergometer and treadmill trials
for the female and male subjects are listed in Table 4.
Table 4: Means (+SD) for Heart Rate and MET Responses during Cycle Ergometer and Treadmill Exercise
Exercise Mode Exercise Stage Heart Rate METs Cycle Ergometer 50 rpm 25 Watts 105.3 + 13.0 3 50 rpm 50 Watts 121.8 + 14.6 4 Treadmill 3.0 mph, 0% grade 111.2 + 10.8 4 4.0 mph, 0% grade 129.8 + 13.2 5 4.0 mph, 5% grade 150.3 + 15.4 7 4.5 mph, 5% grade 170.5 + 15.5 9
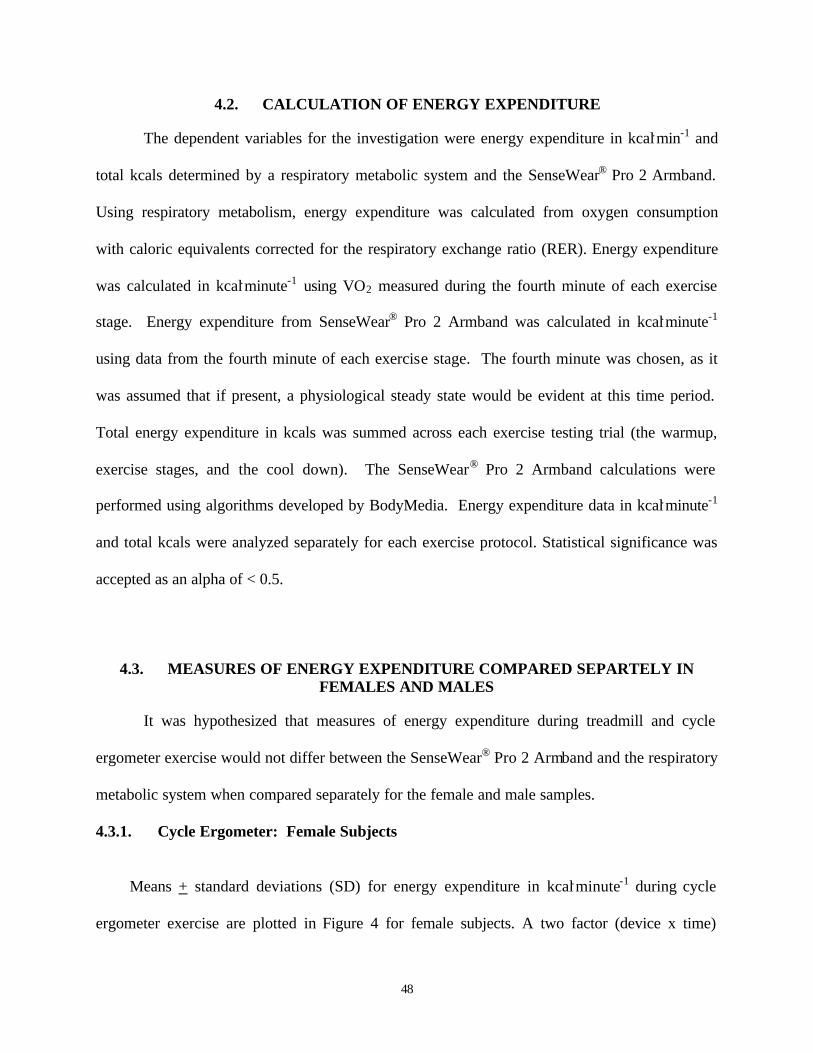
48
4.2. CALCULATION OF ENERGY EXPENDITURE
The dependent variables for the investigation were energy expenditure in kcal.min-1 and
total kcals determined by a respiratory metabolic system and the SenseWear® Pro 2 Armband.
Using respiratory metabolism, energy expenditure was calculated from oxygen consumption
with caloric equivalents corrected for the respiratory exchange ratio (RER). Energy expenditure
was calculated in kcal.minute-1 using VO2 measured during the fourth minute of each exercise
stage. Energy expenditure from SenseWear® Pro 2 Armband was calculated in kcal.minute-1
using data from the fourth minute of each exercise stage. The fourth minute was chosen, as it
was assumed that if present, a physiological steady state would be evident at this time period.
Total energy expenditure in kcals was summed across each exercise testing trial (the warmup,
exercise stages, and the cool down). The SenseWear® Pro 2 Armband calculations were
performed using algorithms developed by BodyMedia. Energy expenditure data in kcal.minute-1
and total kcals were analyzed separately for each exercise protocol. Statistical significance was
accepted as an alpha of < 0.5.
4.3. MEASURES OF ENERGY EXPENDITURE COMPARED SEPARTELY IN FEMALES AND MALES
It was hypothesized that measures of energy expenditure during treadmill and cycle
ergometer exercise would not differ between the SenseWear® Pro 2 Armband and the respiratory
metabolic system when compared separately for the female and male samples.
4.3.1. Cycle Ergometer: Female Subjects
Means + standard deviations (SD) for energy expenditure in kcal.minute-1 during cycle
ergometer exercise are plotted in Figure 4 for female subjects. A two factor (device x time)
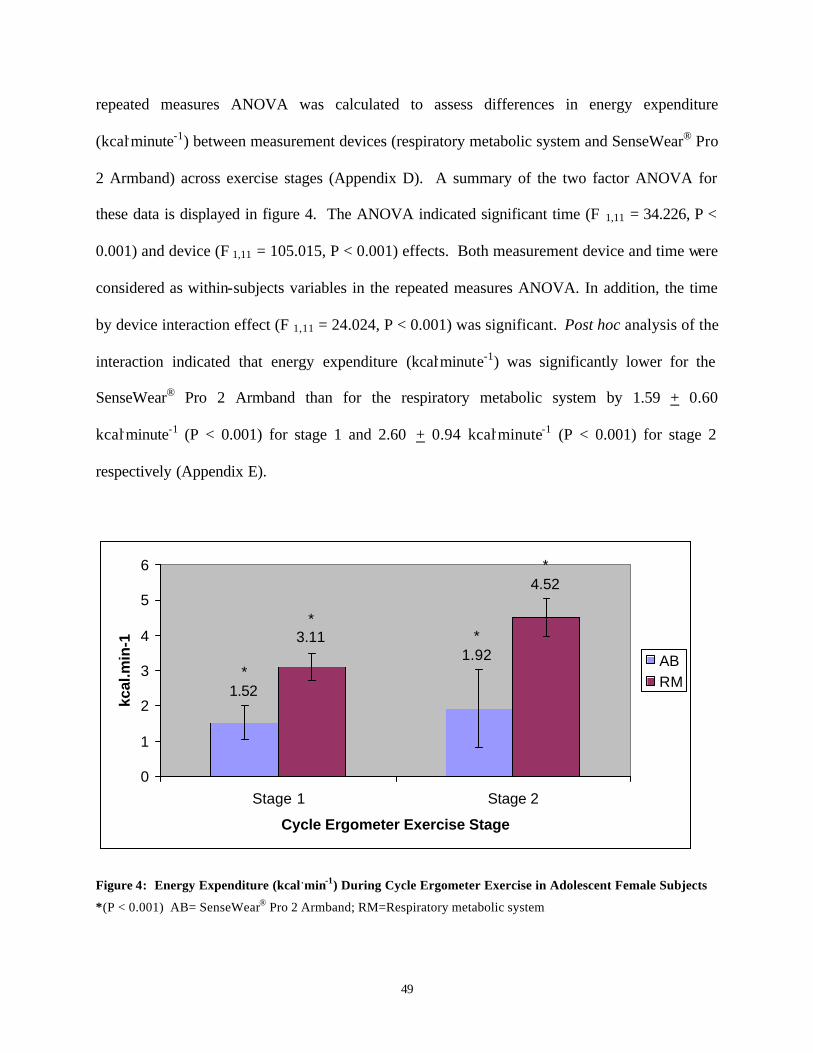
49
repeated measures ANOVA was calculated to assess differences in energy expenditure
(kcal.minute-1) between measurement devices (respiratory metabolic system and SenseWear® Pro
2 Armband) across exercise stages (Appendix D). A summary of the two factor ANOVA for
these data is displayed in figure 4. The ANOVA indicated significant time (F 1,11 = 34.226, P <
0.001) and device (F 1,11 = 105.015, P < 0.001) effects. Both measurement device and time were
considered as within-subjects variables in the repeated measures ANOVA. In addition, the time
by device interaction effect (F 1,11 = 24.024, P < 0.001) was significant. Post hoc analysis of the
interaction indicated that energy expenditure (kcal.minute-1) was significantly lower for the
SenseWear® Pro 2 Armband than for the respiratory metabolic system by 1.59 + 0.60
kcal.minute-1 (P < 0.001) for stage 1 and 2.60 + 0.94 kcal.minute-1 (P < 0.001) for stage 2
respectively (Appendix E).
*1.92
*1.52
*4.52
*3.11
0
1
2
3
4
5
6
Stage 1 Stage 2
Cycle Ergometer Exercise Stage
kcal
.min
-1
ABRM
Figure 4: Energy Expenditure (kcal .min-1) During Cycle Ergometer Exercise in Adolescent Female Subjects
*(P < 0.001) AB= SenseWear® Pro 2 Armband; RM=Respiratory metabolic system
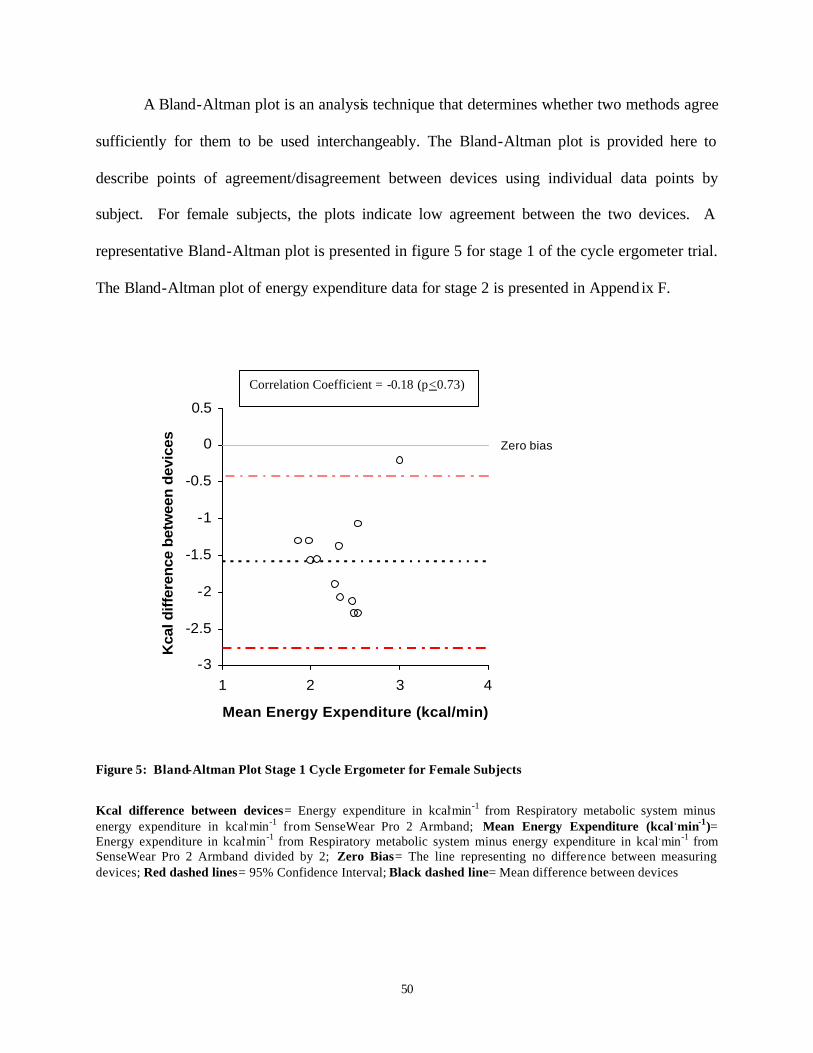
50
A Bland-Altman plot is an analysis technique that determines whether two methods agree
sufficiently for them to be used interchangeably. The Bland-Altman plot is provided here to
describe points of agreement/disagreement between devices using individual data points by
subject. For female subjects, the plots indicate low agreement between the two devices. A
representative Bland-Altman plot is presented in figure 5 for stage 1 of the cycle ergometer trial.
The Bland-Altman plot of energy expenditure data for stage 2 is presented in Append ix F.
Zero bias
-3
-2.5
-2
-1.5
-1
-0.5
0
0.5
1 2 3 4
Mean Energy Expenditure (kcal/min)
Kca
l diff
eren
ce b
etw
een
dev
ices
Figure 5: Bland-Altman Plot Stage 1 Cycle Ergometer for Female Subjects
Kcal difference between devices= Energy expenditure in kcal.min-1 from Respiratory metabolic system minus energy expenditure in kcal.min-1 from SenseWear Pro 2 Armband; Mean Energy Expenditure (kcal .min-1)= Energy expenditure in kcal.min-1 from Respiratory metabolic system minus energy expenditure in kcal.min-1 from SenseWear Pro 2 Armband divided by 2; Zero Bias= The line representing no difference between measuring devices; Red dashed lines= 95% Confidence Interval; Black dashed line= Mean difference between devices
Correlation Coefficient = -0.18 (p<0.73)
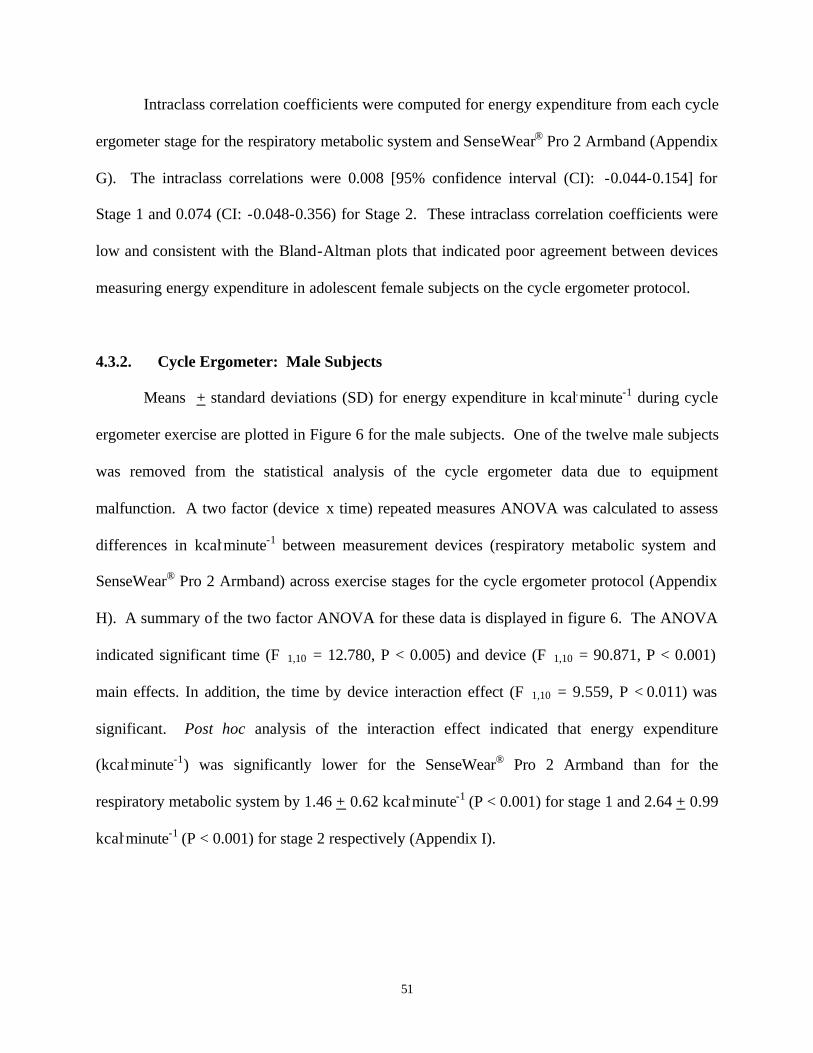
51
Intraclass correlation coefficients were computed for energy expenditure from each cycle
ergometer stage for the respiratory metabolic system and SenseWear® Pro 2 Armband (Appendix
G). The intraclass correlations were 0.008 [95% confidence interval (CI): -0.044-0.154] for
Stage 1 and 0.074 (CI: -0.048-0.356) for Stage 2. These intraclass correlation coefficients were
low and consistent with the Bland-Altman plots that indicated poor agreement between devices
measuring energy expenditure in adolescent female subjects on the cycle ergometer protocol.
4.3.2. Cycle Ergometer: Male Subjects
Means + standard deviations (SD) for energy expenditure in kcal.minute-1 during cycle
ergometer exercise are plotted in Figure 6 for the male subjects. One of the twelve male subjects
was removed from the statistical analysis of the cycle ergometer data due to equipment
malfunction. A two factor (device x time) repeated measures ANOVA was calculated to assess
differences in kcal.minute-1 between measurement devices (respiratory metabolic system and
SenseWear® Pro 2 Armband) across exercise stages for the cycle ergometer protocol (Appendix
H). A summary of the two factor ANOVA for these data is displayed in figure 6. The ANOVA
indicated significant time (F 1,10 = 12.780, P < 0.005) and device (F 1,10 = 90.871, P < 0.001)
main effects. In addition, the time by device interaction effect (F 1,10 = 9.559, P < 0.011) was
significant. Post hoc analysis of the interaction effect indicated that energy expenditure
(kcal.minute-1) was significantly lower for the SenseWear® Pro 2 Armband than for the
respiratory metabolic system by 1.46 + 0.62 kcal.minute-1 (P < 0.001) for stage 1 and 2.64 + 0.99
kcal.minute-1 (P < 0.001) for stage 2 respectively (Appendix I).
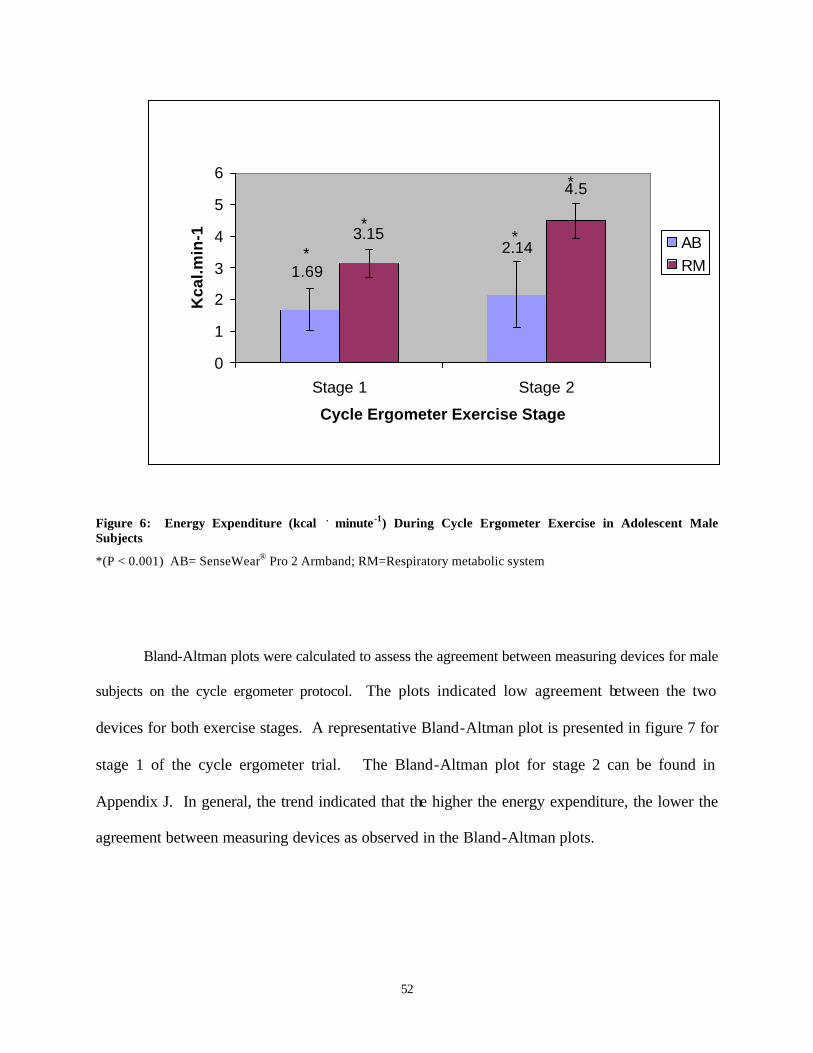
52
2.141.69
4.5
3.15
0
1
2
3
4
5
6
Stage 1 Stage 2
Cycle Ergometer Exercise Stage
Kca
l.min
-1 ABRM
*
*
**
*
*
Figure 6: Energy Expenditure (kcal . minute-1) During Cycle Ergometer Exercise in Adolescent Male Subjects
*(P < 0.001) AB= SenseWear® Pro 2 Armband; RM=Respiratory metabolic system
Bland-Altman plots were calculated to assess the agreement between measuring devices for male
subjects on the cycle ergometer protocol. The plots indicated low agreement between the two
devices for both exercise stages. A representative Bland-Altman plot is presented in figure 7 for
stage 1 of the cycle ergometer trial. The Bland-Altman plot for stage 2 can be found in
Appendix J. In general, the trend indicated that the higher the energy expenditure, the lower the
agreement between measuring devices as observed in the Bland-Altman plots.
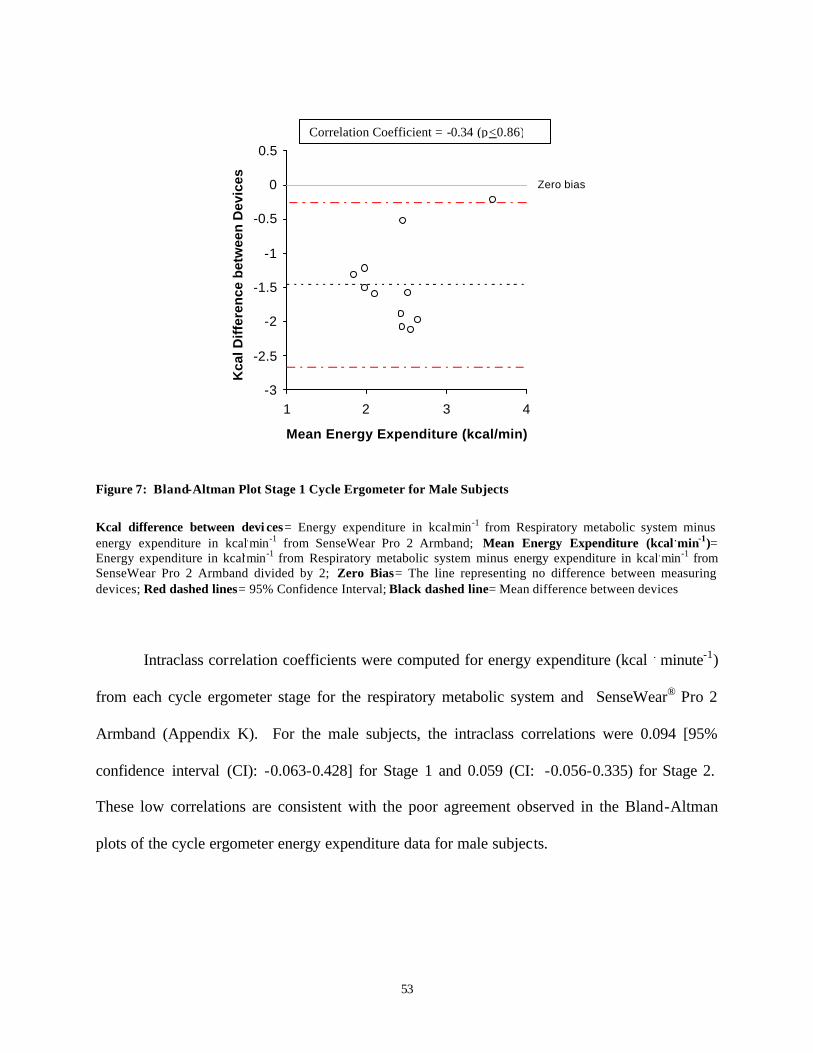
53
Zero bias
-3
-2.5
-2
-1.5
-1
-0.5
0
0.5
1 2 3 4
Mean Energy Expenditure (kcal/min)
Kca
l Dif
fere
nce
bet
wee
n D
evic
es
Figure 7: Bland-Altman Plot Stage 1 Cycle Ergometer for Male Subjects
Kcal difference between devi ces= Energy expenditure in kcal.min-1 from Respiratory metabolic system minus energy expenditure in kcal.min-1 from SenseWear Pro 2 Armband; Mean Energy Expenditure (kcal .min-1)= Energy expenditure in kcal.min-1 from Respiratory metabolic system minus energy expenditure in kcal.min-1 from SenseWear Pro 2 Armband divided by 2; Zero Bias= The line representing no difference between measuring devices; Red dashed lines= 95% Confidence Interval; Black dashed line= Mean difference between devices
Intraclass correlation coefficients were computed for energy expenditure (kcal . minute-1)
from each cycle ergometer stage for the respiratory metabolic system and SenseWear® Pro 2
Armband (Appendix K). For the male subjects, the intraclass correlations were 0.094 [95%
confidence interval (CI): -0.063-0.428] for Stage 1 and 0.059 (CI: -0.056-0.335) for Stage 2.
These low correlations are consistent with the poor agreement observed in the Bland-Altman
plots of the cycle ergometer energy expenditure data for male subjects.
Correlation Coefficient = -0.34 (p<0.86)
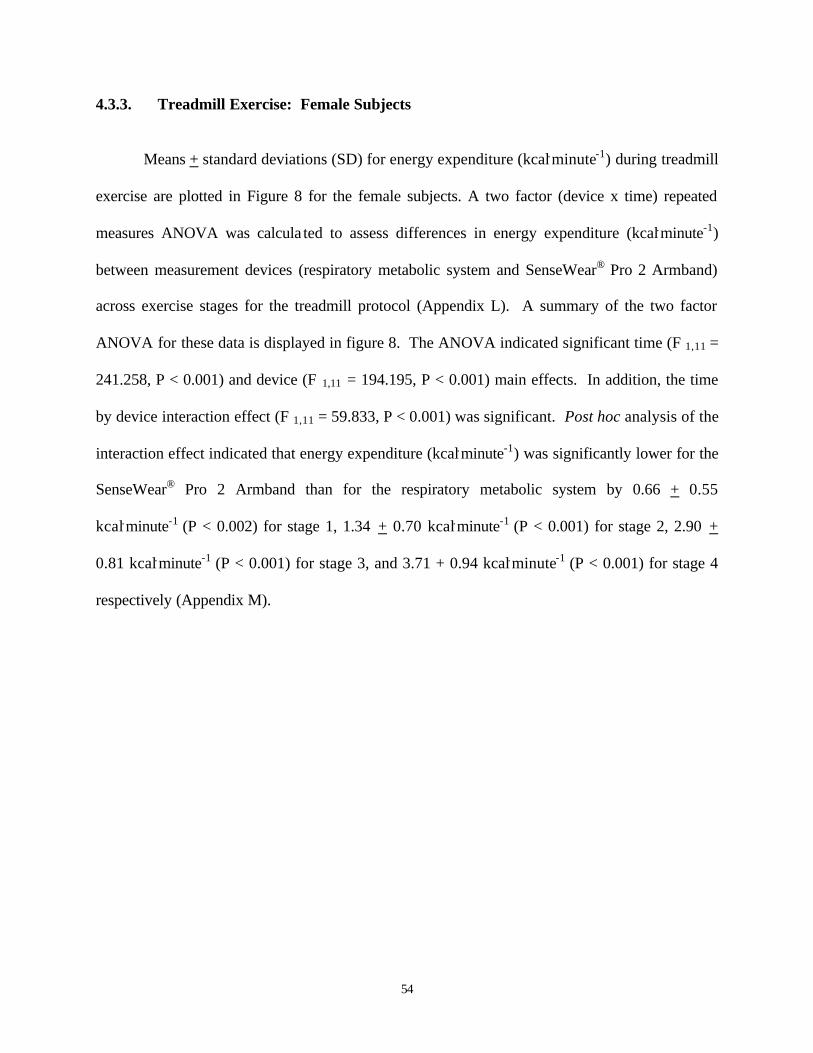
54
4.3.3. Treadmill Exercise: Female Subjects
Means + standard deviations (SD) for energy expenditure (kcal.minute-1) during treadmill
exercise are plotted in Figure 8 for the female subjects. A two factor (device x time) repeated
measures ANOVA was calcula ted to assess differences in energy expenditure (kcal.minute-1)
between measurement devices (respiratory metabolic system and SenseWear® Pro 2 Armband)
across exercise stages for the treadmill protocol (Appendix L). A summary of the two factor
ANOVA for these data is displayed in figure 8. The ANOVA indicated significant time (F 1,11 =
241.258, P < 0.001) and device (F 1,11 = 194.195, P < 0.001) main effects. In addition, the time
by device interaction effect (F 1,11 = 59.833, P < 0.001) was significant. Post hoc analysis of the
interaction effect indicated that energy expenditure (kcal.minute-1) was significantly lower for the
SenseWear® Pro 2 Armband than for the respiratory metabolic system by 0.66 + 0.55
kcal.minute-1 (P < 0.002) for stage 1, 1.34 + 0.70 kcal.minute-1 (P < 0.001) for stage 2, 2.90 +
0.81 kcal.minute-1 (P < 0.001) for stage 3, and 3.71 + 0.94 kcal.minute-1 (P < 0.001) for stage 4
respectively (Appendix M).
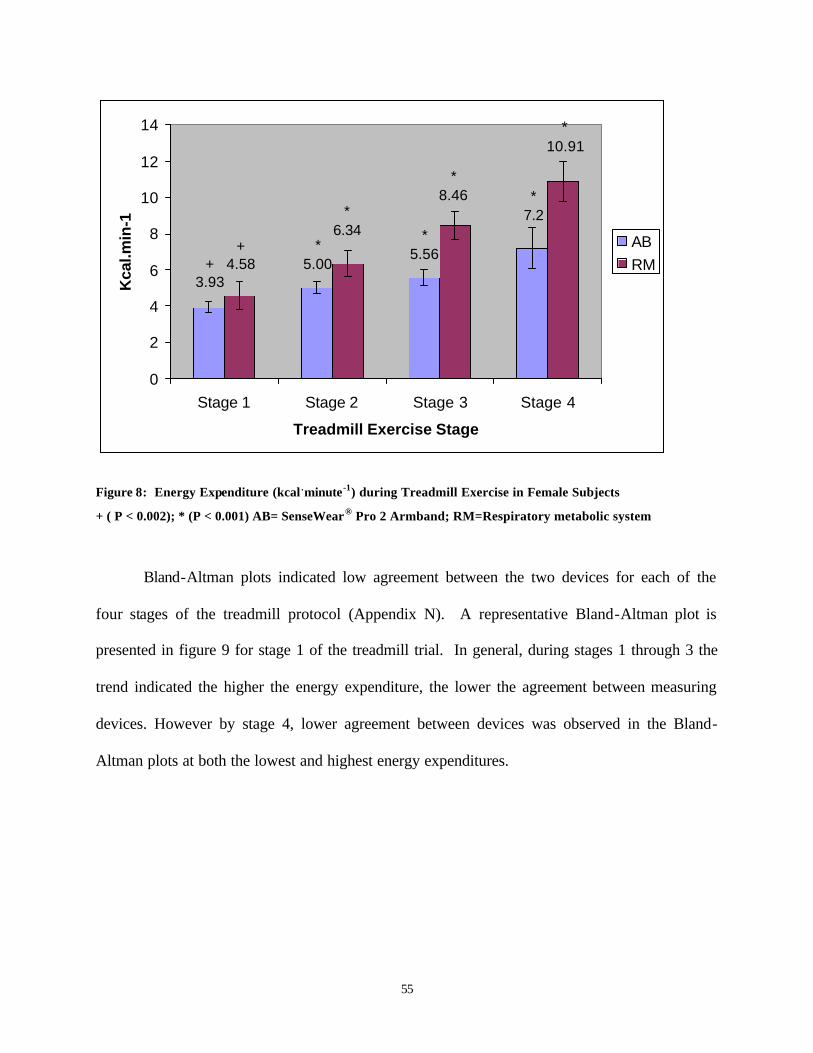
55
+3.93
*5.00
*5.56
*7.2
+4.58
*6.34
*8.46
*10.91
0
2
4
6
8
10
12
14
Stage 1 Stage 2 Stage 3 Stage 4
Treadmill Exercise Stage
Kca
l.min
-1
ABRM
Figure 8: Energy Expenditure (kcal .minute-1) during Treadmill Exercise in Female Subjects
+ ( P < 0.002); * (P < 0.001) AB= SenseWear® Pro 2 Armband; RM=Respiratory metabolic system
Bland-Altman plots indicated low agreement between the two devices for each of the
four stages of the treadmill protocol (Appendix N). A representative Bland-Altman plot is
presented in figure 9 for stage 1 of the treadmill trial. In general, during stages 1 through 3 the
trend indicated the higher the energy expenditure, the lower the agreement between measuring
devices. However by stage 4, lower agreement between devices was observed in the Bland-
Altman plots at both the lowest and highest energy expenditures.
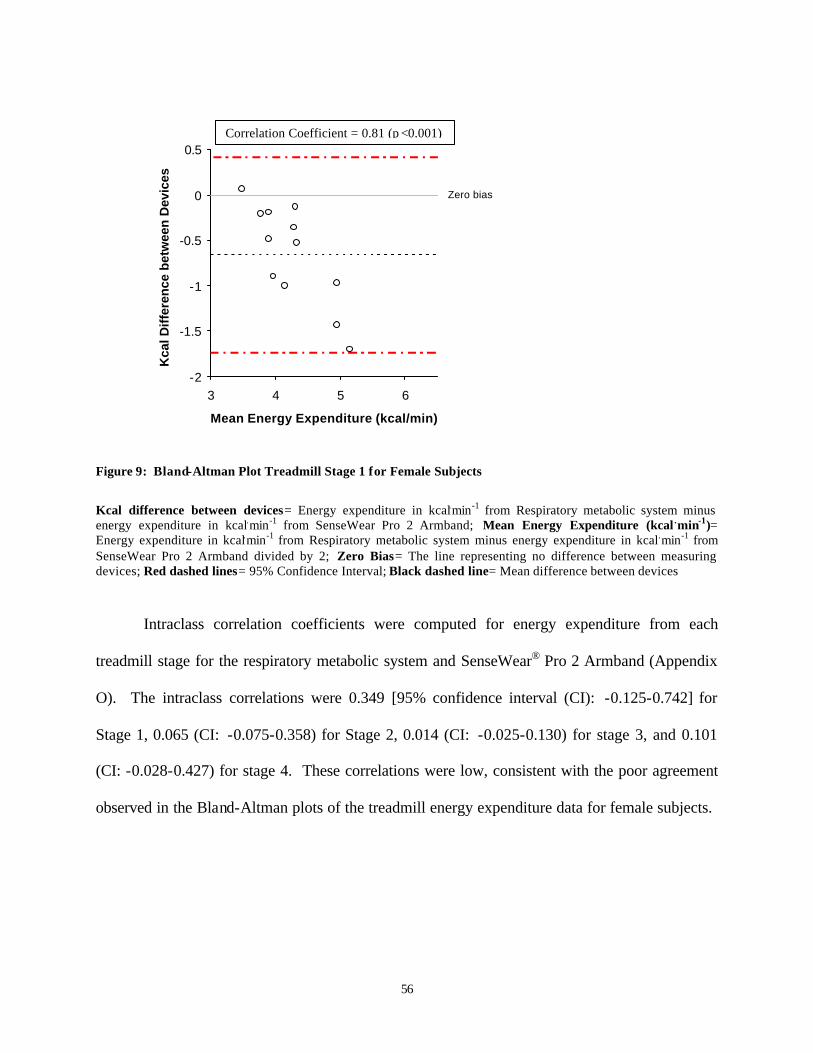
56
Zero bias
-2
-1.5
-1
-0.5
0
0.5
3 4 5 6
Mean Energy Expenditure (kcal/min)
Kca
l Dif
fere
nce
bet
wee
n D
evic
es
Figure 9: Bland-Altman Plot Treadmill Stage 1 for Female Subjects
Kcal difference between devices= Energy expenditure in kcal.min-1 from Respiratory metabolic system minus energy expenditure in kcal.min-1 from SenseWear Pro 2 Armband; Mean Energy Expenditure (kcal .min-1)= Energy expenditure in kcal.min-1 from Respiratory metabolic system minus energy expenditure in kcal.min-1 from SenseWear Pro 2 Armband divided by 2; Zero Bias= The line representing no difference between measuring devices; Red dashed lines= 95% Confidence Interval; Black dashed line= Mean difference between devices
Intraclass correlation coefficients were computed for energy expenditure from each
treadmill stage for the respiratory metabolic system and SenseWear® Pro 2 Armband (Appendix
O). The intraclass correlations were 0.349 [95% confidence interval (CI): -0.125-0.742] for
Stage 1, 0.065 (CI: -0.075-0.358) for Stage 2, 0.014 (CI: -0.025-0.130) for stage 3, and 0.101
(CI: -0.028-0.427) for stage 4. These correlations were low, consistent with the poor agreement
observed in the Bland-Altman plots of the treadmill energy expenditure data for female subjects.
Correlation Coefficient = 0.81 (p <0.001)
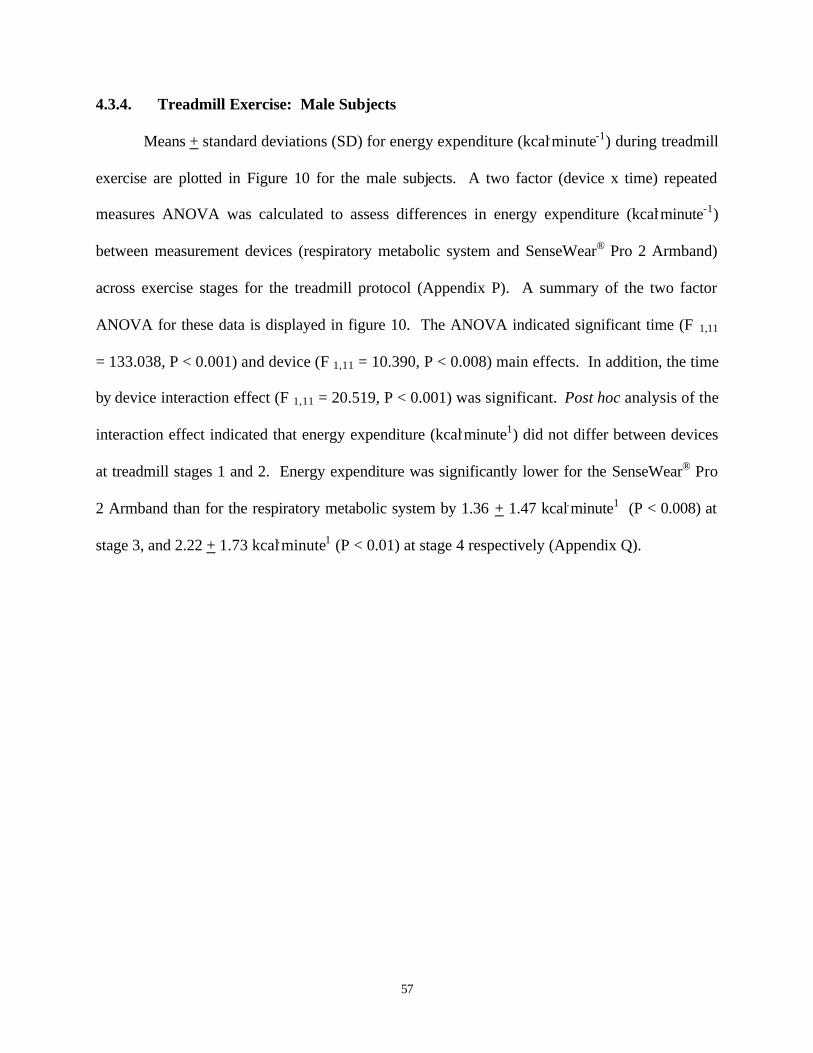
57
4.3.4. Treadmill Exercise: Male Subjects
Means + standard deviations (SD) for energy expenditure (kcal.minute-1) during treadmill
exercise are plotted in Figure 10 for the male subjects. A two factor (device x time) repeated
measures ANOVA was calculated to assess differences in energy expenditure (kcal.minute-1)
between measurement devices (respiratory metabolic system and SenseWear® Pro 2 Armband)
across exercise stages for the treadmill protocol (Appendix P). A summary of the two factor
ANOVA for these data is displayed in figure 10. The ANOVA indicated significant time (F 1,11
= 133.038, P < 0.001) and device (F 1,11 = 10.390, P < 0.008) main effects. In addition, the time
by device interaction effect (F 1,11 = 20.519, P < 0.001) was significant. Post hoc analysis of the
interaction effect indicated that energy expenditure (kcal.minute1) did not differ between devices
at treadmill stages 1 and 2. Energy expenditure was significantly lower for the SenseWear® Pro
2 Armband than for the respiratory metabolic system by 1.36 + 1.47 kcal.minute1 (P < 0.008) at
stage 3, and 2.22 + 1.73 kcal.minute1 (P < 0.01) at stage 4 respectively (Appendix Q).
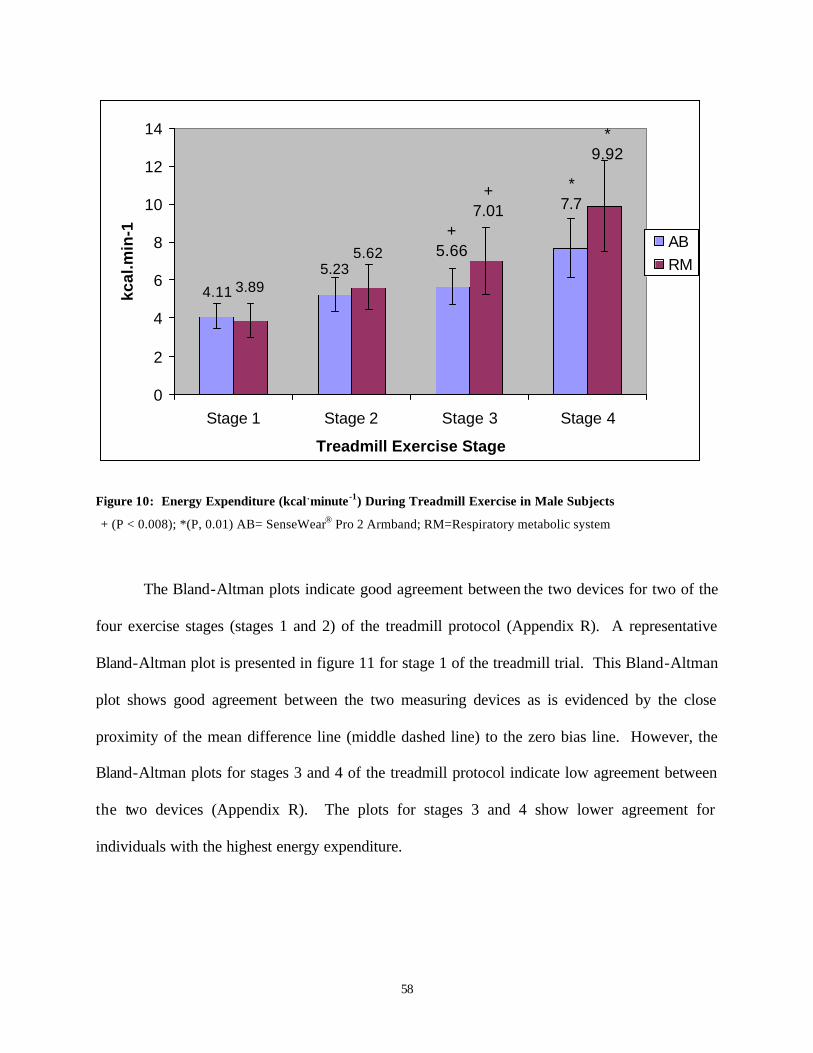
58
*7.7
+5.66
5.23
4.11
*9.92
+7.01
5.62
3.89
0
2
4
6
8
10
12
14
Stage 1 Stage 2 Stage 3 Stage 4
Treadmill Exercise Stage
kcal
.min
-1
ABRM
Figure 10: Energy Expenditure (kcal .minute-1) During Treadmill Exercise in Male Subjects
+ (P < 0.008); *(P, 0.01) AB= SenseWear® Pro 2 Armband; RM=Respiratory metabolic system
The Bland-Altman plots indicate good agreement between the two devices for two of the
four exercise stages (stages 1 and 2) of the treadmill protocol (Appendix R). A representative
Bland-Altman plot is presented in figure 11 for stage 1 of the treadmill trial. This Bland-Altman
plot shows good agreement between the two measuring devices as is evidenced by the close
proximity of the mean difference line (middle dashed line) to the zero bias line. However, the
Bland-Altman plots for stages 3 and 4 of the treadmill protocol indicate low agreement between
the two devices (Appendix R). The plots for stages 3 and 4 show lower agreement for
individuals with the highest energy expenditure.
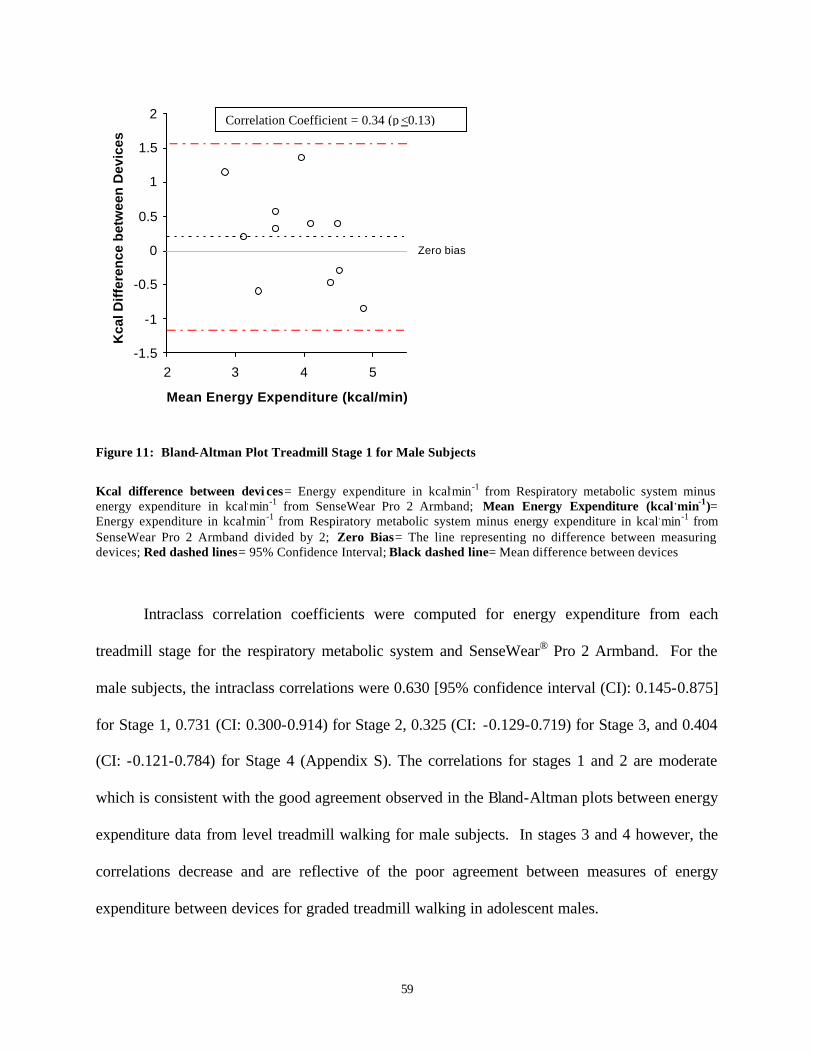
59
Zero bias
-1.5
-1
-0.5
0
0.5
1
1.5
2
2 3 4 5
Mean Energy Expenditure (kcal/min)
Kca
l Dif
fere
nce
bet
wee
n D
evic
es
Figure 11: Bland-Altman Plot Treadmill Stage 1 for Male Subjects
Kcal difference between devi ces= Energy expenditure in kcal.min-1 from Respiratory metabolic system minus energy expenditure in kcal.min-1 from SenseWear Pro 2 Armband; Mean Energy Expenditure (kcal .min-1)= Energy expenditure in kcal.min-1 from Respiratory metabolic system minus energy expenditure in kcal.min-1 from SenseWear Pro 2 Armband divided by 2; Zero Bias= The line representing no difference between measuring devices; Red dashed lines= 95% Confidence Interval; Black dashed line= Mean difference between devices
Intraclass correlation coefficients were computed for energy expenditure from each
treadmill stage for the respiratory metabolic system and SenseWear® Pro 2 Armband. For the
male subjects, the intraclass correlations were 0.630 [95% confidence interval (CI): 0.145-0.875]
for Stage 1, 0.731 (CI: 0.300-0.914) for Stage 2, 0.325 (CI: -0.129-0.719) for Stage 3, and 0.404
(CI: -0.121-0.784) for Stage 4 (Appendix S). The correlations for stages 1 and 2 are moderate
which is consistent with the good agreement observed in the Bland-Altman plots between energy
expenditure data from level treadmill walking for male subjects. In stages 3 and 4 however, the
correlations decrease and are reflective of the poor agreement between measures of energy
expenditure between devices for graded treadmill walking in adolescent males.
Correlation Coefficient = 0.34 (p <0.13)
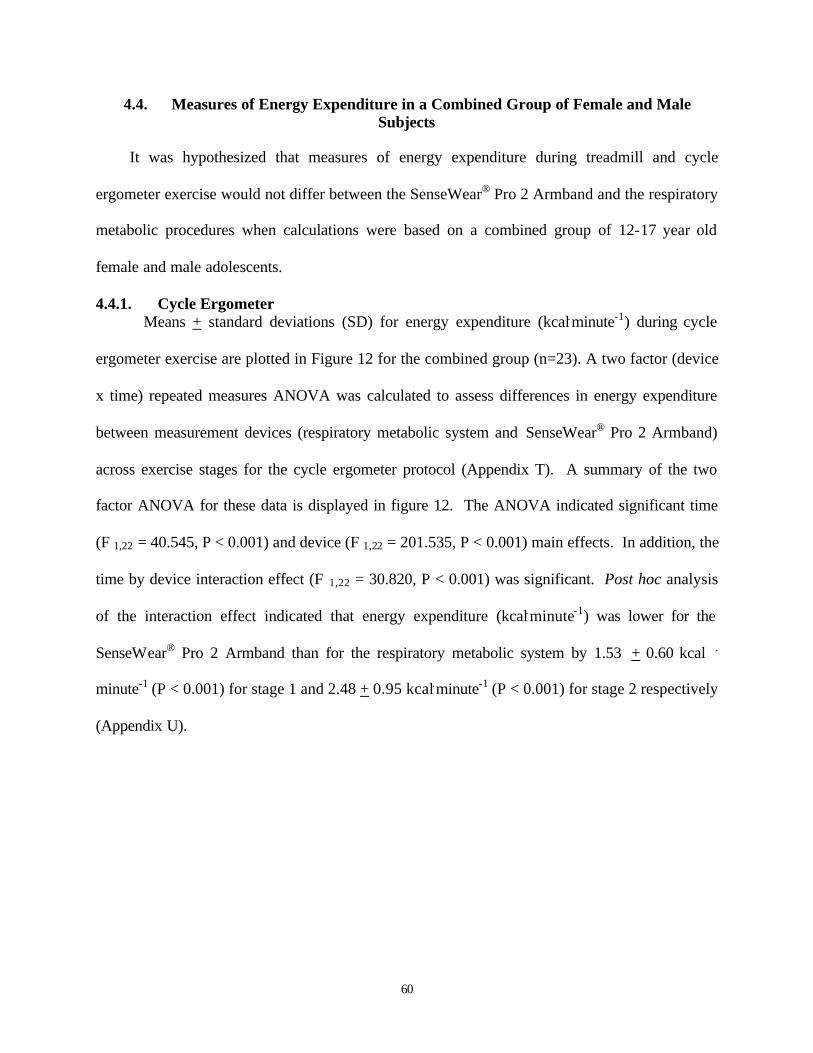
60
4.4. Measures of Energy Expenditure in a Combined Group of Female and Male Subjects
It was hypothesized that measures of energy expenditure during treadmill and cycle
ergometer exercise would not differ between the SenseWear® Pro 2 Armband and the respiratory
metabolic procedures when calculations were based on a combined group of 12-17 year old
female and male adolescents.
4.4.1. Cycle Ergometer Means + standard deviations (SD) for energy expenditure (kcal.minute-1) during cycle
ergometer exercise are plotted in Figure 12 for the combined group (n=23). A two factor (device
x time) repeated measures ANOVA was calculated to assess differences in energy expenditure
between measurement devices (respiratory metabolic system and SenseWear® Pro 2 Armband)
across exercise stages for the cycle ergometer protocol (Appendix T). A summary of the two
factor ANOVA for these data is displayed in figure 12. The ANOVA indicated significant time
(F 1,22 = 40.545, P < 0.001) and device (F 1,22 = 201.535, P < 0.001) main effects. In addition, the
time by device interaction effect (F 1,22 = 30.820, P < 0.001) was significant. Post hoc analysis
of the interaction effect indicated that energy expenditure (kcal.minute-1) was lower for the
SenseWear® Pro 2 Armband than for the respiratory metabolic system by 1.53 + 0.60 kcal .
minute-1 (P < 0.001) for stage 1 and 2.48 + 0.95 kcal.minute-1 (P < 0.001) for stage 2 respectively
(Appendix U).
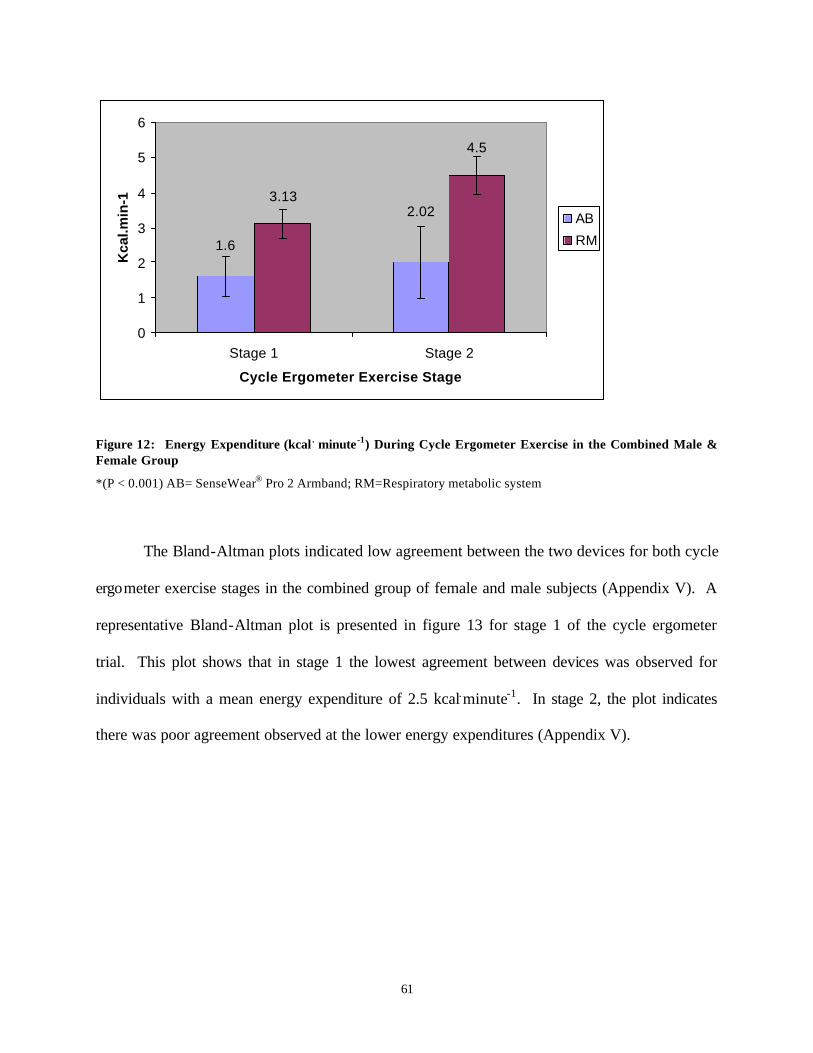
61
2.02
1.6
4.5
3.13
0
1
2
3
4
5
6
Stage 1 Stage 2
Cycle Ergometer Exercise Stage
Kca
l.min
-1
AB
RM
Figure 12: Energy Expenditure (kcal . minute-1) During Cycle Ergometer Exercise in the Combined Male & Female Group
*(P < 0.001) AB= SenseWear® Pro 2 Armband; RM=Respiratory metabolic system
The Bland-Altman plots indicated low agreement between the two devices for both cycle
ergometer exercise stages in the combined group of female and male subjects (Appendix V). A
representative Bland-Altman plot is presented in figure 13 for stage 1 of the cycle ergometer
trial. This plot shows that in stage 1 the lowest agreement between devices was observed for
individuals with a mean energy expenditure of 2.5 kcal.minute-1. In stage 2, the plot indicates
there was poor agreement observed at the lower energy expenditures (Appendix V).
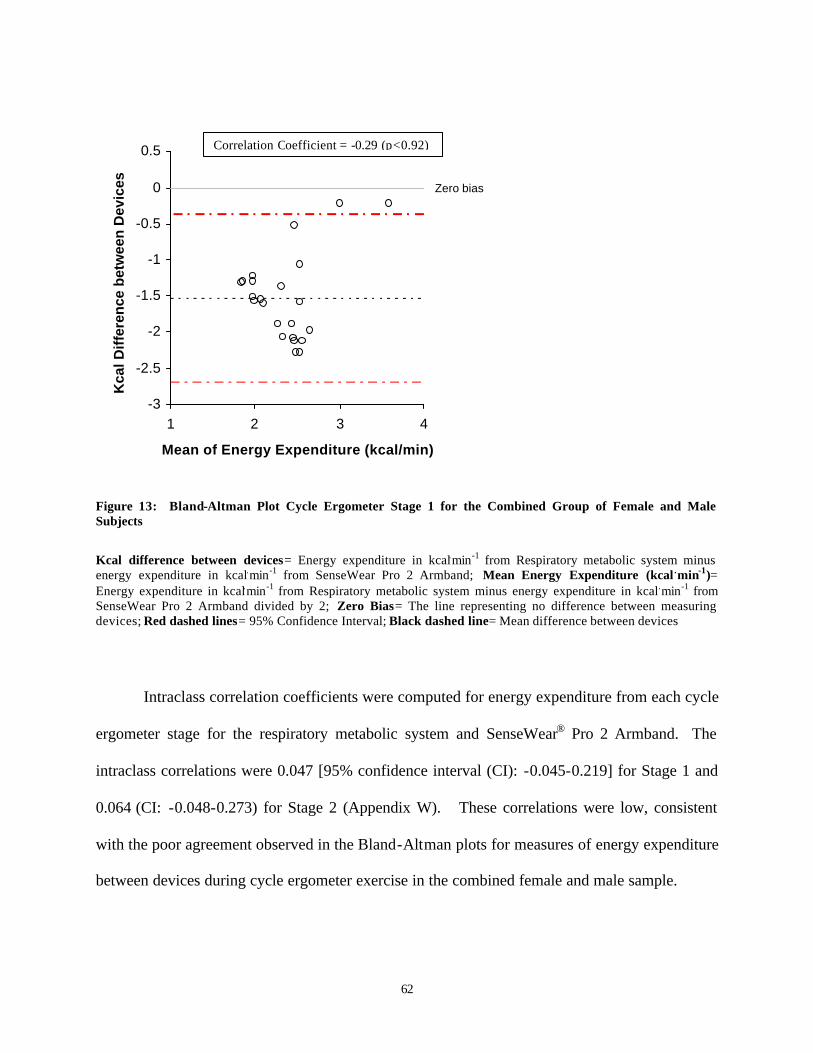
62
Zero bias
-3
-2.5
-2
-1.5
-1
-0.5
0
0.5
1 2 3 4
Mean of Energy Expenditure (kcal/min)
Kca
l Dif
fere
nce
bet
wee
n D
evic
es
Figure 13: Bland-Altman Plot Cycle Ergometer Stage 1 for the Combined Group of Female and Male Subjects
Kcal difference between devices= Energy expenditure in kcal.min-1 from Respiratory metabolic system minus energy expenditure in kcal.min-1 from SenseWear Pro 2 Armband; Mean Energy Expenditure (kcal .min-1)= Energy expenditure in kcal.min-1 from Respiratory metabolic system minus energy expenditure in kcal.min-1 from SenseWear Pro 2 Armband divided by 2; Zero Bias= The line representing no difference between measuring devices; Red dashed lines= 95% Confidence Interval; Black dashed line= Mean difference between devices
Intraclass correlation coefficients were computed for energy expenditure from each cycle
ergometer stage for the respiratory metabolic system and SenseWear® Pro 2 Armband. The
intraclass correlations were 0.047 [95% confidence interval (CI): -0.045-0.219] for Stage 1 and
0.064 (CI: -0.048-0.273) for Stage 2 (Appendix W). These correlations were low, consistent
with the poor agreement observed in the Bland-Altman plots for measures of energy expenditure
between devices during cycle ergometer exercise in the combined female and male sample.
Correlation Coefficient = -0.29 (p<0.92)
63
4.4.2. Treadmill
Means + standard deviations (SD) for energy expenditure in (kcal.minute-1) during
treadmill exercise are plotted in Figure 14 for the combined group of female and male subjects.
A two factor (device x time) repeated measures ANOVA was calculated to assess differences in
energy expenditure between measurement devices (respiratory metabolic system and
SenseWear® Pro 2 Armband) across exercise stages for the treadmill exercise protocol
(Appendix X). A summary of the two factor ANOVA for these data is displayed in figure 14.
The ANOVA indicated significant time (F 1,23 = 344.019, P < 0.001) and device (F 1,23 = 56.888,
P < 0.001) main effects. In addition, the time by device interaction effect (F 1,23 = 67.469, P <
0.001) was significant. Post hoc analysis of the interaction effect indicated that energy
expenditure (kcal.minute-1) did not differ between devices for stage 1 of the treadmill protocol.
Energy expenditure was significantly lower for the SenseWear® Pro 2 Armband than for the
respiratory metabolic system by 0.86 + 0.84 kcal.minute1 (P < 0.001) for stage 2, 2.13 + 1.40
kcal.minute1 (P < 0.001) for stage 3, and 2.97 + 1.56 kcal.minute1 (P < 0.001) for stage 4
respectively (Appendix Y).
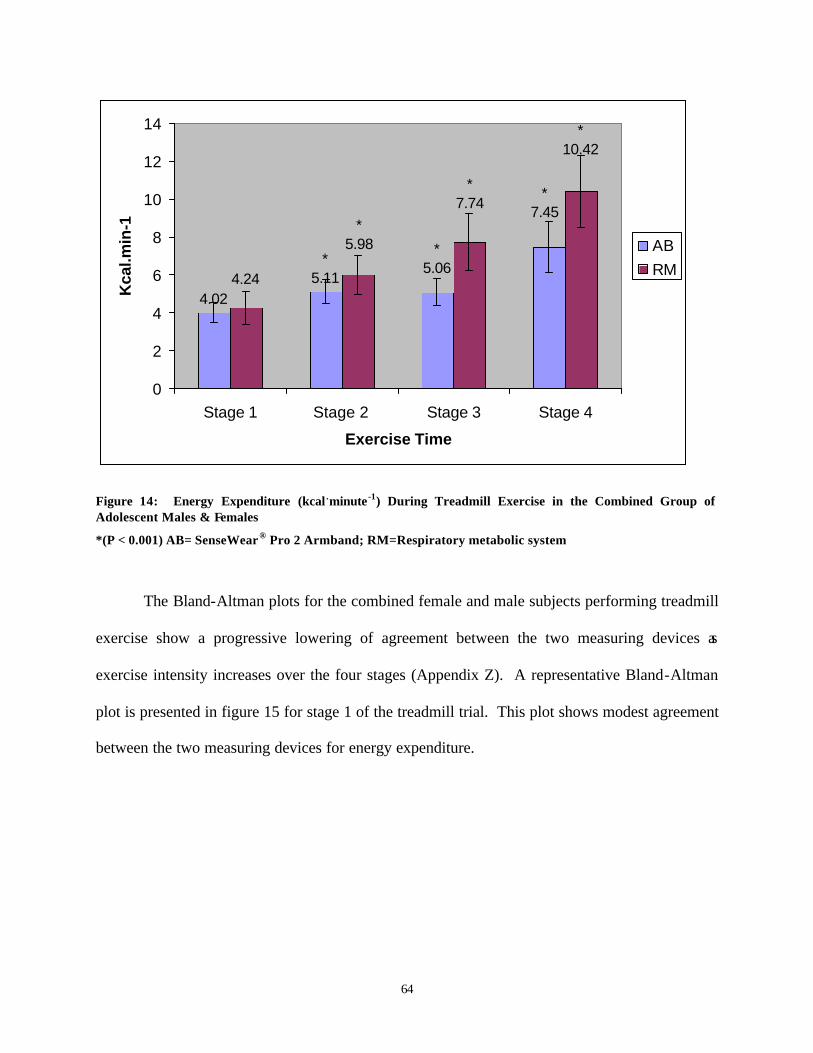
64
*7.45
*5.06*
5.114.02
*10.42
*7.74
*5.98
4.24
0
2
4
6
8
10
12
14
Stage 1 Stage 2 Stage 3 Stage 4
Exercise Time
Kca
l.min
-1
ABRM
Figure 14: Energy Expenditure (kcal .minute-1) During Treadmill Exercise in the Combined Group of Adolescent Males & Females
*(P < 0.001) AB= SenseWear® Pro 2 Armband; RM=Respiratory metabolic system
The Bland-Altman plots for the combined female and male subjects performing treadmill
exercise show a progressive lowering of agreement between the two measuring devices as
exercise intensity increases over the four stages (Appendix Z). A representative Bland-Altman
plot is presented in figure 15 for stage 1 of the treadmill trial. This plot shows modest agreement
between the two measuring devices for energy expenditure.
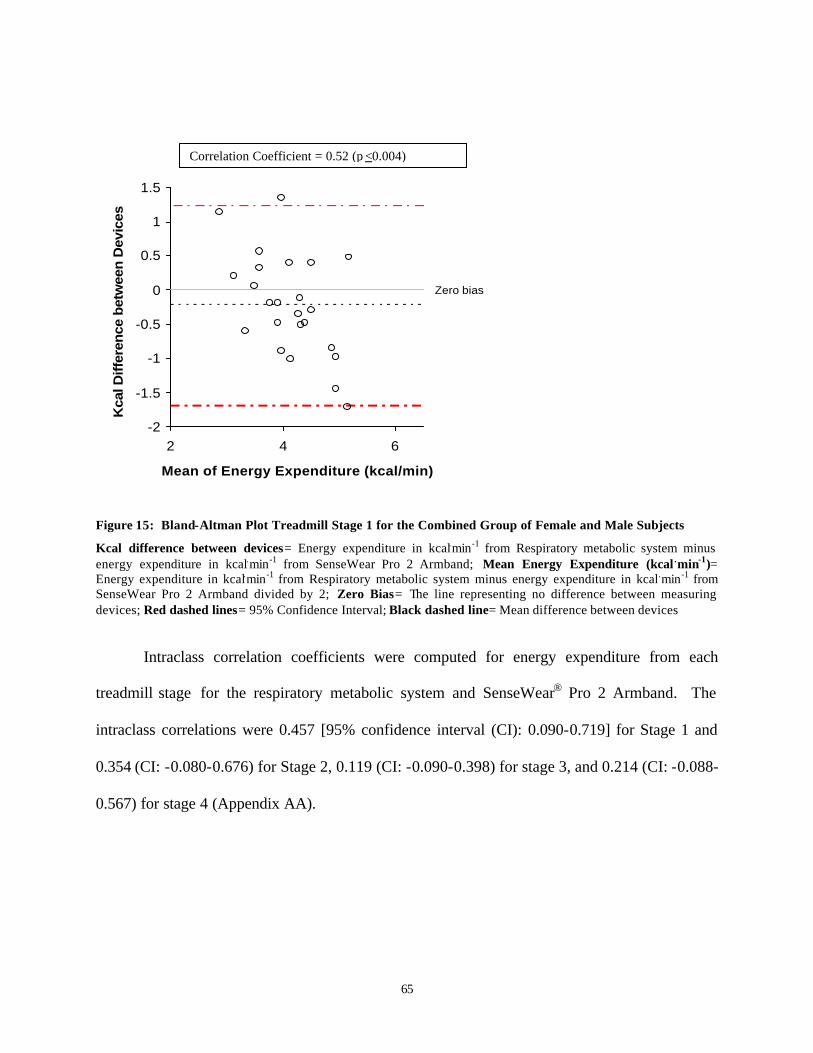
65
Zero bias
-2
-1.5
-1
-0.5
0
0.5
1
1.5
2 4 6
Mean of Energy Expenditure (kcal/min)
Kca
l Diff
eren
ce b
etw
een
Dev
ices
Figure 15: Bland-Altman Plot Treadmill Stage 1 for the Combined Group of Female and Male Subjects
Kcal difference between devices= Energy expenditure in kcal.min-1 from Respiratory metabolic system minus energy expenditure in kcal.min-1 from SenseWear Pro 2 Armband; Mean Energy Expenditure (kcal .min-1)= Energy expenditure in kcal.min-1 from Respiratory metabolic system minus energy expenditure in kcal.min-1 from SenseWear Pro 2 Armband divided by 2; Zero Bias= The line representing no difference between measuring devices; Red dashed lines= 95% Confidence Interval; Black dashed line= Mean difference between devices
Intraclass correlation coefficients were computed for energy expenditure from each
treadmill stage for the respiratory metabolic system and SenseWear® Pro 2 Armband. The
intraclass correlations were 0.457 [95% confidence interval (CI): 0.090-0.719] for Stage 1 and
0.354 (CI: -0.080-0.676) for Stage 2, 0.119 (CI: -0.090-0.398) for stage 3, and 0.214 (CI: -0.088-
0.567) for stage 4 (Appendix AA).
Correlation Coefficient = 0.52 (p <0.004)
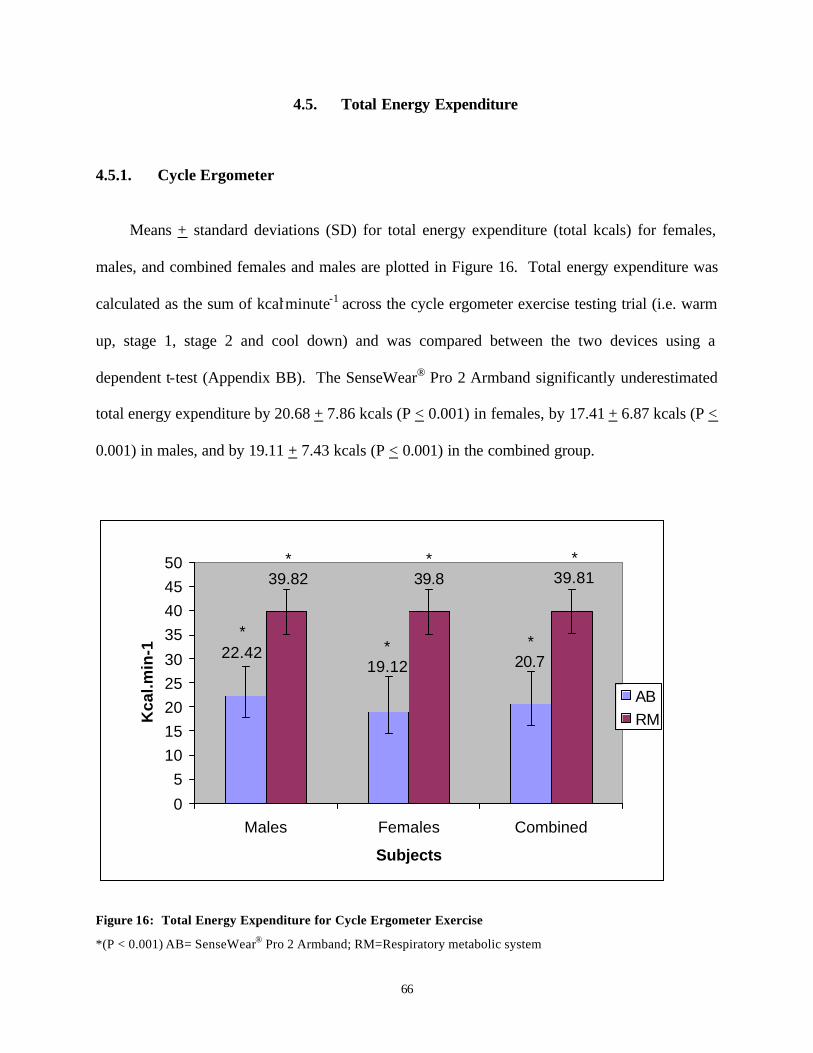
66
4.5. Total Energy Expenditure
4.5.1. Cycle Ergometer
Means + standard deviations (SD) for total energy expenditure (total kcals) for females,
males, and combined females and males are plotted in Figure 16. Total energy expenditure was
calculated as the sum of kcal.minute-1 across the cycle ergometer exercise testing trial (i.e. warm
up, stage 1, stage 2 and cool down) and was compared between the two devices using a
dependent t-test (Appendix BB). The SenseWear® Pro 2 Armband significantly underestimated
total energy expenditure by 20.68 + 7.86 kcals (P < 0.001) in females, by 17.41 + 6.87 kcals (P <
0.001) in males, and by 19.11 + 7.43 kcals (P < 0.001) in the combined group.
*22.42 *
19.12
*20.7
*39.82
*39.8
*39.81
0
51015202530
35404550
Males Females Combined
Subjects
Kca
l.min
-1
ABRM
Figure 16: Total Energy Expenditure for Cycle Ergometer Exercise
*(P < 0.001) AB= SenseWear® Pro 2 Armband; RM=Respiratory metabolic system
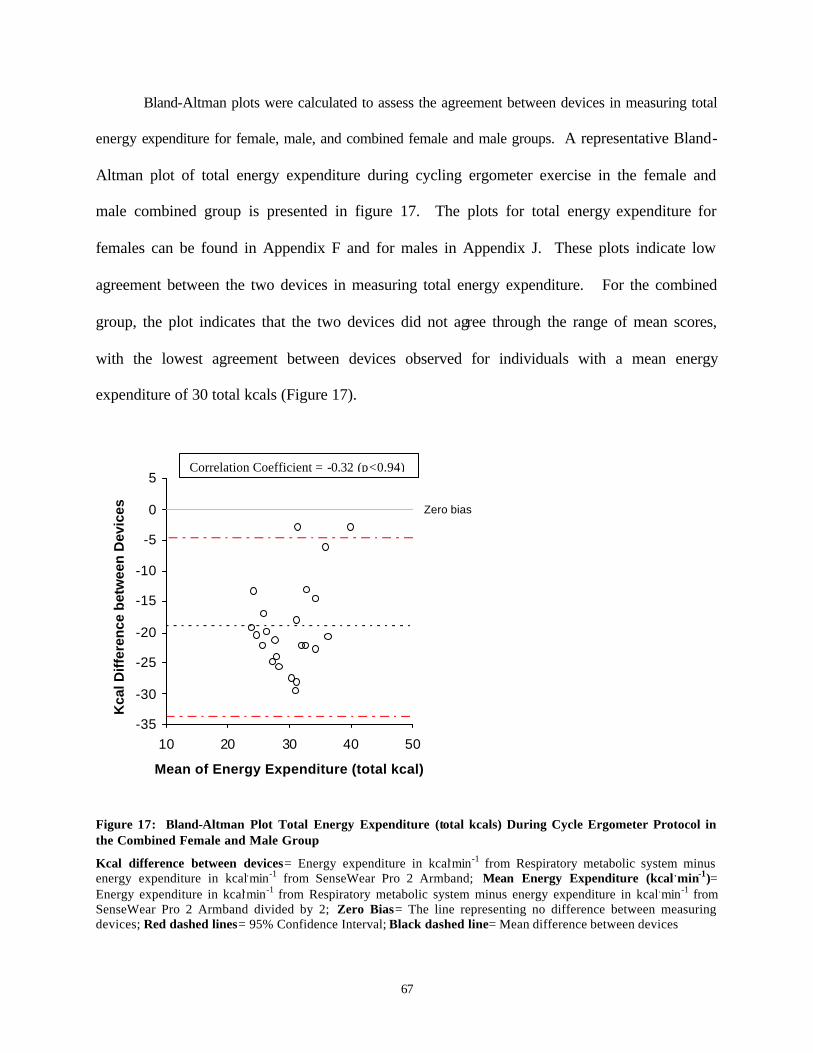
67
Bland-Altman plots were calculated to assess the agreement between devices in measuring total
energy expenditure for female, male, and combined female and male groups. A representative Bland-
Altman plot of total energy expenditure during cycling ergometer exercise in the female and
male combined group is presented in figure 17. The plots for total energy expenditure for
females can be found in Appendix F and for males in Appendix J. These plots indicate low
agreement between the two devices in measuring total energy expenditure. For the combined
group, the plot indicates that the two devices did not agree through the range of mean scores,
with the lowest agreement between devices observed for individuals with a mean energy
expenditure of 30 total kcals (Figure 17).
Zero bias
-35
-30
-25
-20
-15
-10
-5
0
5
10 20 30 40 50
Mean of Energy Expenditure (total kcal)
Kca
l Dif
fere
nce
bet
wee
n D
evic
es
Figure 17: Bland-Altman Plot Total Energy Expenditure (total kcals) During Cycle Ergometer Protocol in the Combined Female and Male Group
Kcal difference between devices= Energy expenditure in kcal.min-1 from Respiratory metabolic system minus energy expenditure in kcal.min-1 from SenseWear Pro 2 Armband; Mean Energy Expenditure (kcal .min-1)= Energy expenditure in kcal.min-1 from Respiratory metabolic system minus energy expenditure in kcal.min-1 from SenseWear Pro 2 Armband divided by 2; Zero Bias= The line representing no difference between measuring devices; Red dashed lines= 95% Confidence Interval; Black dashed line= Mean difference between devices
Correlation Coefficient = -0.32 (p<0.94)
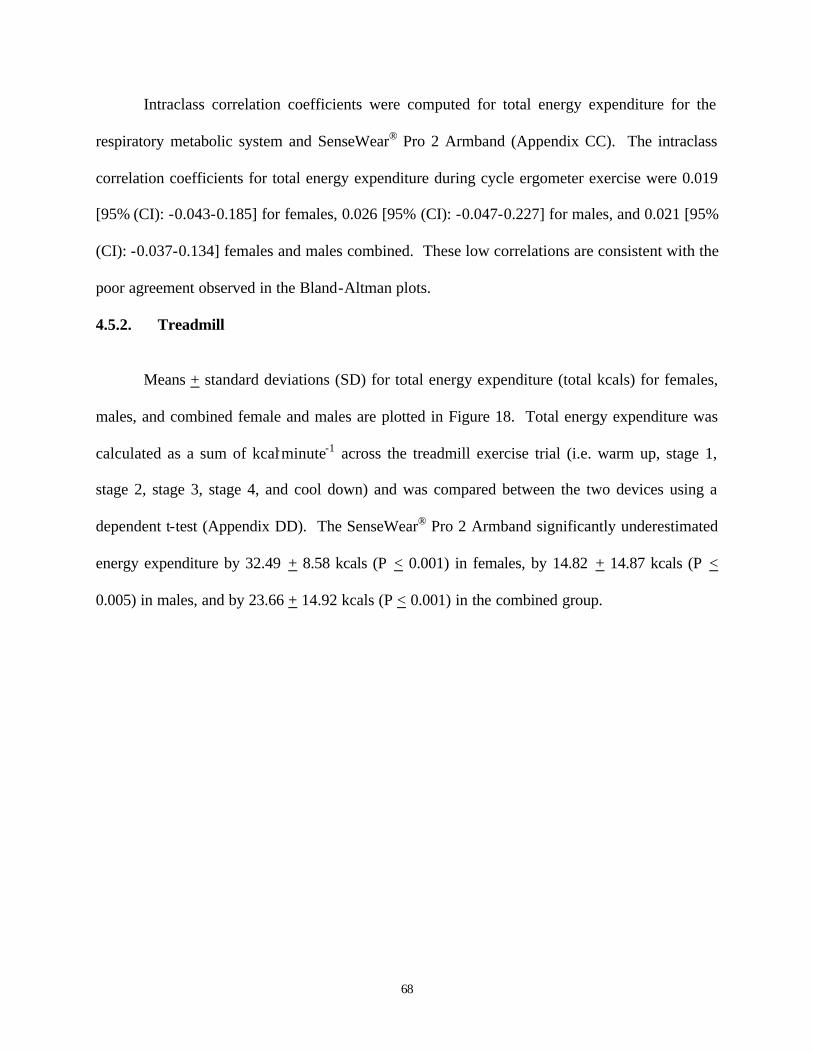
68
Intraclass correlation coefficients were computed for total energy expenditure for the
respiratory metabolic system and SenseWear® Pro 2 Armband (Appendix CC). The intraclass
correlation coefficients for total energy expenditure during cycle ergometer exercise were 0.019
[95% (CI): -0.043-0.185] for females, 0.026 [95% (CI): -0.047-0.227] for males, and 0.021 [95%
(CI): -0.037-0.134] females and males combined. These low correlations are consistent with the
poor agreement observed in the Bland-Altman plots.
4.5.2. Treadmill
Means + standard deviations (SD) for total energy expenditure (total kcals) for females,
males, and combined female and males are plotted in Figure 18. Total energy expenditure was
calculated as a sum of kcal.minute-1 across the treadmill exercise trial (i.e. warm up, stage 1,
stage 2, stage 3, stage 4, and cool down) and was compared between the two devices using a
dependent t-test (Appendix DD). The SenseWear® Pro 2 Armband significantly underestimated
energy expenditure by 32.49 + 8.58 kcals (P < 0.001) in females, by 14.82 + 14.87 kcals (P <
0.005) in males, and by 23.66 + 14.92 kcals (P < 0.001) in the combined group.
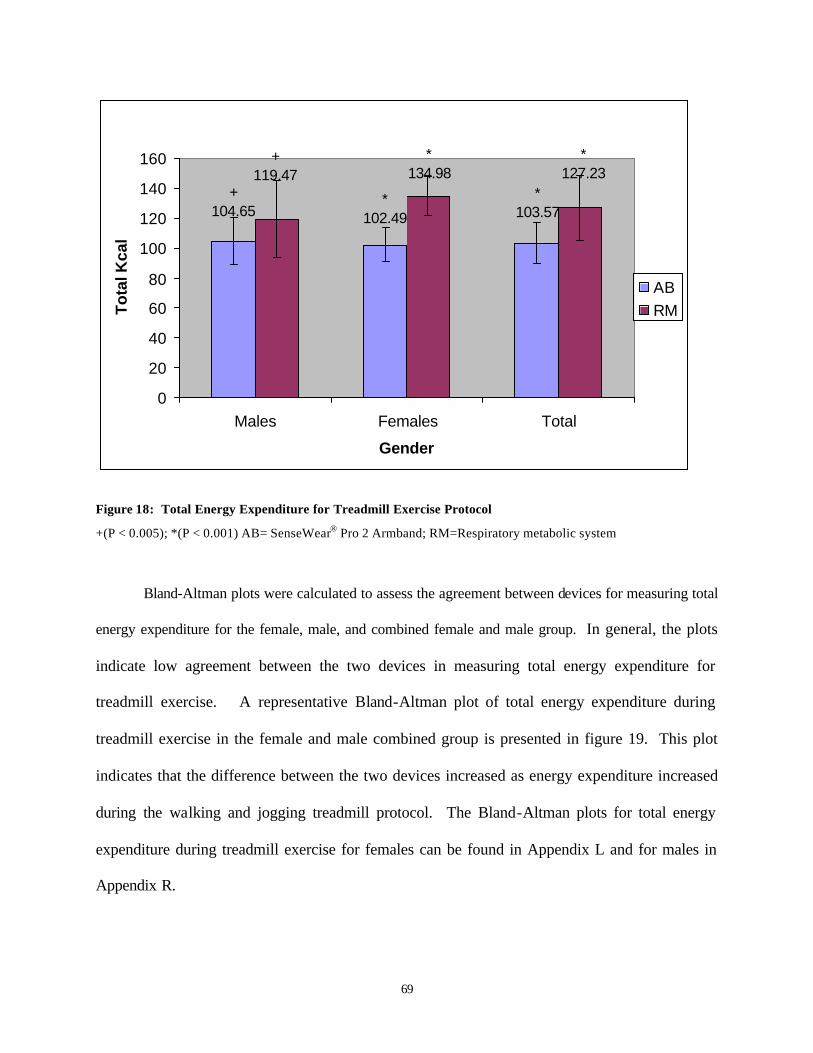
69
+104.65
*102.49
*103.57
*127.23
*134.98
+119.47
0
20
40
60
80
100
120
140
160
Males Females Total
Gender
To
tal K
cal
ABRM
Figure 18: Total Energy Expenditure for Treadmill Exercise Protocol
+(P < 0.005); *(P < 0.001) AB= SenseWear® Pro 2 Armband; RM=Respiratory metabolic system
Bland-Altman plots were calculated to assess the agreement between devices for measuring total
energy expenditure for the female, male, and combined female and male group. In general, the plots
indicate low agreement between the two devices in measuring total energy expenditure for
treadmill exercise. A representative Bland-Altman plot of total energy expenditure during
treadmill exercise in the female and male combined group is presented in figure 19. This plot
indicates that the difference between the two devices increased as energy expenditure increased
during the walking and jogging treadmill protocol. The Bland-Altman plots for total energy
expenditure during treadmill exercise for females can be found in Appendix L and for males in
Appendix R.
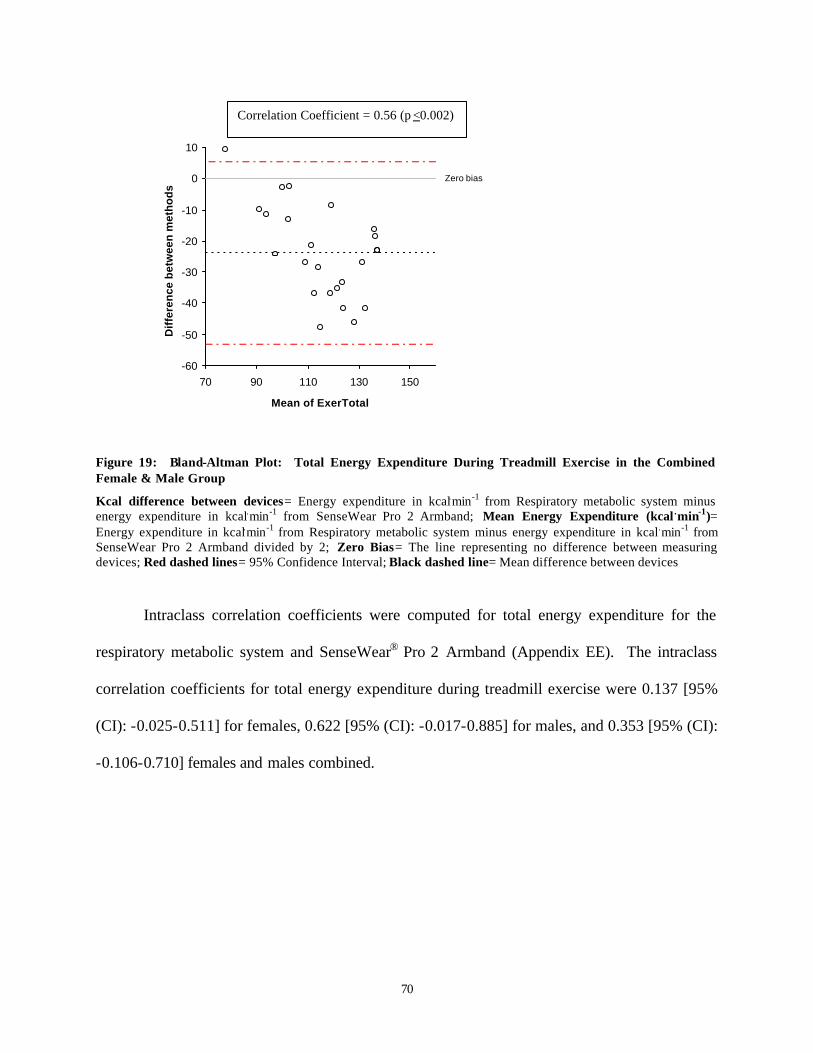
70
Zero bias
-60
-50
-40
-30
-20
-10
0
10
70 90 110 130 150
Mean of ExerTotal
Dif
fere
nce
bet
wee
n m
eth
od
s
Figure 19: Bland-Altman Plot: Total Energy Expenditure During Treadmill Exercise in the Combined Female & Male Group
Kcal difference between devices= Energy expenditure in kcal.min-1 from Respiratory metabolic system minus energy expenditure in kcal.min-1 from SenseWear Pro 2 Armband; Mean Energy Expenditure (kcal .min-1)= Energy expenditure in kcal.min-1 from Respiratory metabolic system minus energy expenditure in kcal.min-1 from SenseWear Pro 2 Armband divided by 2; Zero Bias= The line representing no difference between measuring devices; Red dashed lines= 95% Confidence Interval; Black dashed line= Mean difference between devices
Intraclass correlation coefficients were computed for total energy expenditure for the
respiratory metabolic system and SenseWear® Pro 2 Armband (Appendix EE). The intraclass
correlation coefficients for total energy expenditure during treadmill exercise were 0.137 [95%
(CI): -0.025-0.511] for females, 0.622 [95% (CI): -0.017-0.885] for males, and 0.353 [95% (CI):
-0.106-0.710] females and males combined.
Correlation Coefficient = 0.56 (p <0.002)
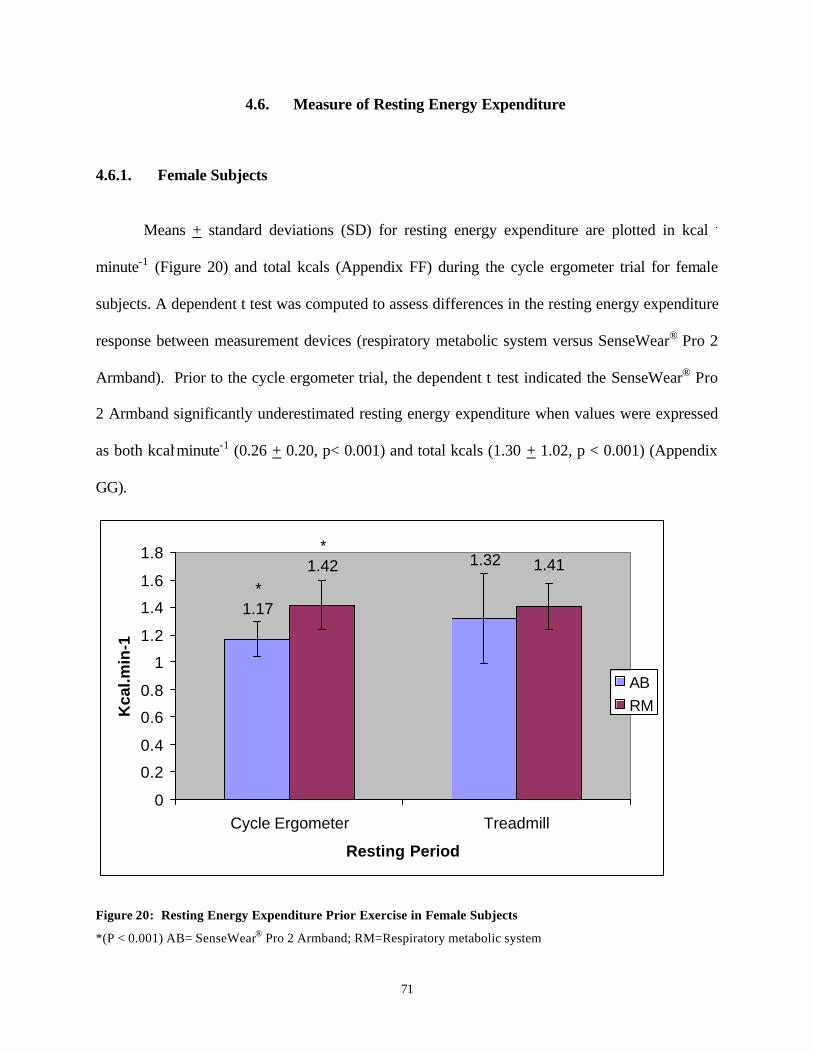
71
4.6. Measure of Resting Energy Expenditure
4.6.1. Female Subjects
Means + standard deviations (SD) for resting energy expenditure are plotted in kcal .
minute-1 (Figure 20) and total kcals (Appendix FF) during the cycle ergometer trial for female
subjects. A dependent t test was computed to assess differences in the resting energy expenditure
response between measurement devices (respiratory metabolic system versus SenseWear® Pro 2
Armband). Prior to the cycle ergometer trial, the dependent t test indicated the SenseWear® Pro
2 Armband significantly underestimated resting energy expenditure when values were expressed
as both kcal.minute-1 (0.26 + 0.20, p< 0.001) and total kcals (1.30 + 1.02, p < 0.001) (Appendix
GG).
*1.17
1.32*
1.42 1.41
0
0.2
0.4
0.6
0.8
1
1.2
1.4
1.6
1.8
Cycle Ergometer Treadmill
Resting Period
Kca
l.min
-1
ABRM
Figure 20: Resting Energy Expenditure Prior Exercise in Female Subjects
*(P < 0.001) AB= SenseWear® Pro 2 Armband; RM=Respiratory metabolic system
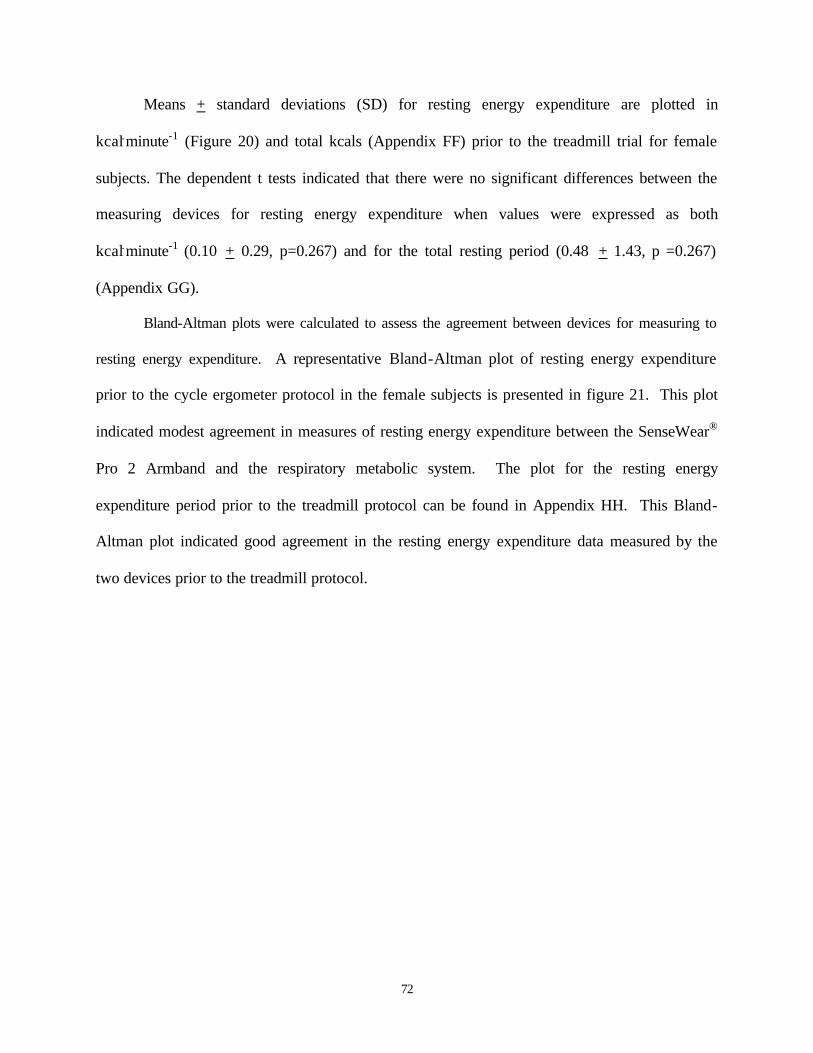
72
Means + standard deviations (SD) for resting energy expenditure are plotted in
kcal.minute-1 (Figure 20) and total kcals (Appendix FF) prior to the treadmill trial for female
subjects. The dependent t tests indicated that there were no significant differences between the
measuring devices for resting energy expenditure when values were expressed as both
kcal.minute-1 (0.10 + 0.29, p=0.267) and for the total resting period (0.48 + 1.43, p =0.267)
(Appendix GG).
Bland-Altman plots were calculated to assess the agreement between devices for measuring to
resting energy expenditure. A representative Bland-Altman plot of resting energy expenditure
prior to the cycle ergometer protocol in the female subjects is presented in figure 21. This plot
indicated modest agreement in measures of resting energy expenditure between the SenseWear®
Pro 2 Armband and the respiratory metabolic system. The plot for the resting energy
expenditure period prior to the treadmill protocol can be found in Appendix HH. This Bland-
Altman plot indicated good agreement in the resting energy expenditure data measured by the
two devices prior to the treadmill protocol.
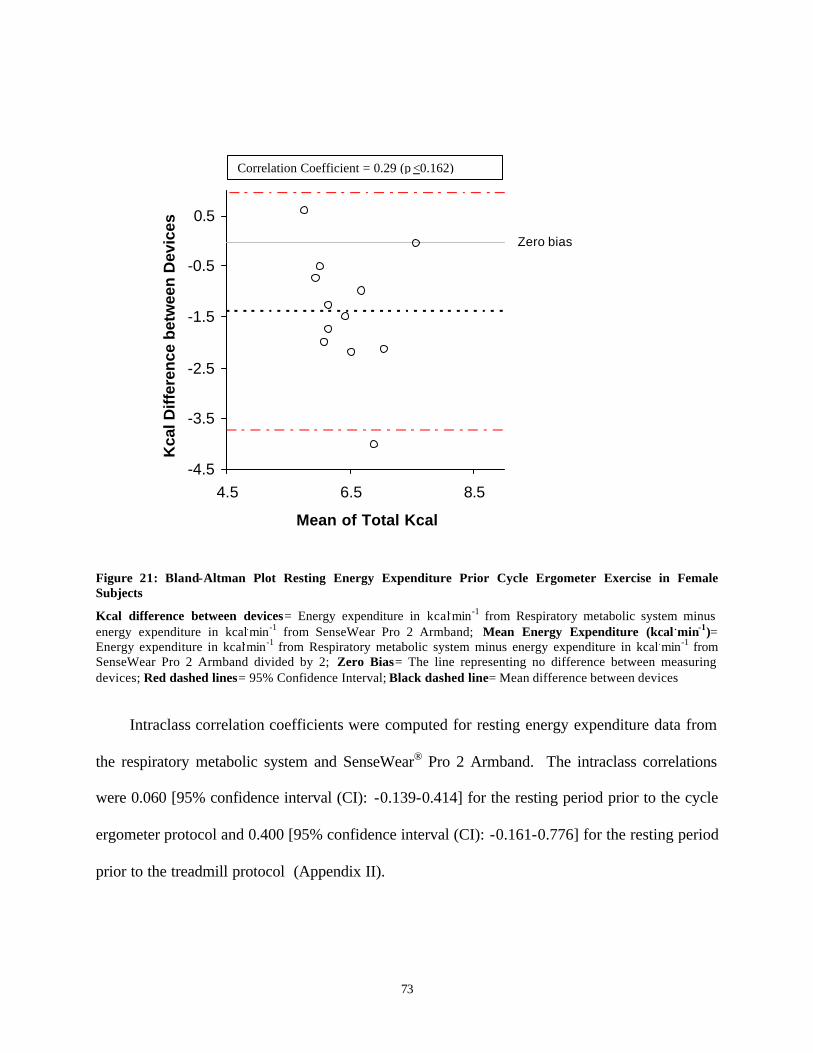
73
Zero bias
-4.5
-3.5
-2.5
-1.5
-0.5
0.5
4.5 6.5 8.5
Mean of Total Kcal
Kca
l Dif
fere
nce
bet
wee
n D
evic
es
Figure 21: Bland-Altman Plot Resting Energy Expenditure Prior Cycle Ergometer Exercise in Female Subjects
Kcal difference between devices= Energy expenditure in kcal.min-1 from Respiratory metabolic system minus energy expenditure in kcal.min-1 from SenseWear Pro 2 Armband; Mean Energy Expenditure (kcal .min-1)= Energy expenditure in kcal.min-1 from Respiratory metabolic system minus energy expenditure in kcal.min-1 from SenseWear Pro 2 Armband divided by 2; Zero Bias= The line representing no difference between measuring devices; Red dashed lines= 95% Confidence Interval; Black dashed line= Mean difference between devices
Intraclass correlation coefficients were computed for resting energy expenditure data from
the respiratory metabolic system and SenseWear® Pro 2 Armband. The intraclass correlations
were 0.060 [95% confidence interval (CI): -0.139-0.414] for the resting period prior to the cycle
ergometer protocol and 0.400 [95% confidence interval (CI): -0.161-0.776] for the resting period
prior to the treadmill protocol (Appendix II).
Correlation Coefficient = 0.29 (p <0.162)
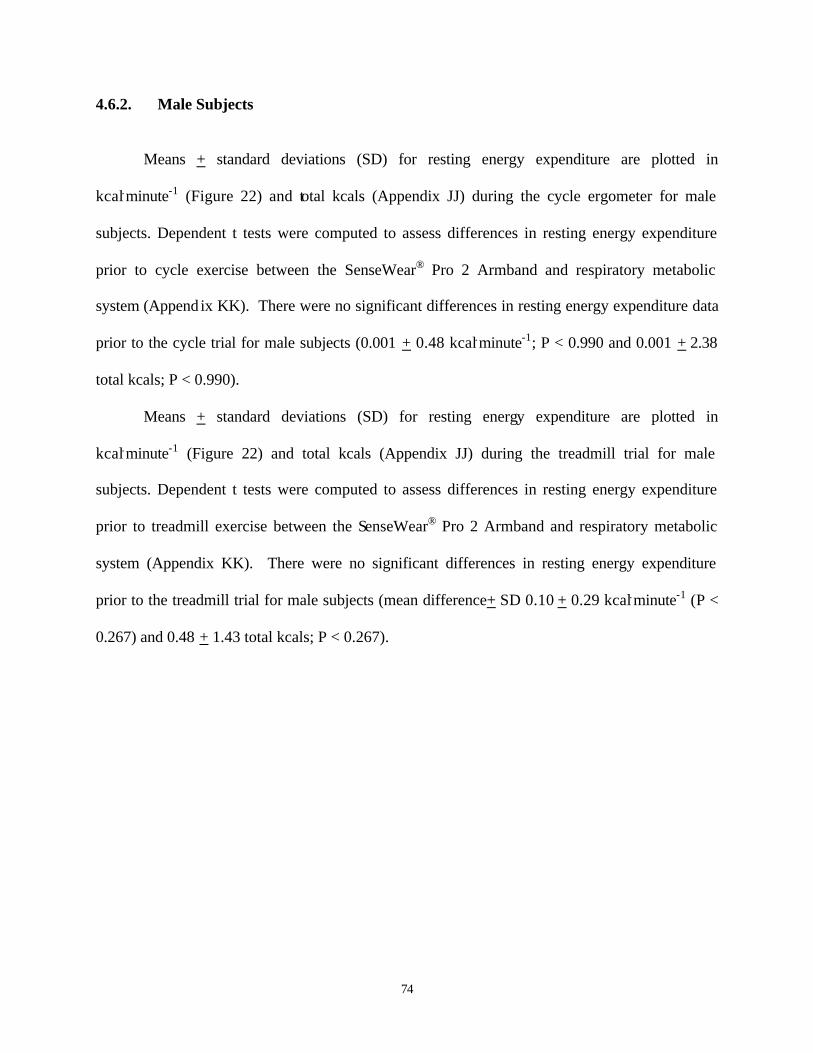
74
4.6.2. Male Subjects
Means + standard deviations (SD) for resting energy expenditure are plotted in
kcal.minute-1 (Figure 22) and total kcals (Appendix JJ) during the cycle ergometer for male
subjects. Dependent t tests were computed to assess differences in resting energy expenditure
prior to cycle exercise between the SenseWear® Pro 2 Armband and respiratory metabolic
system (Append ix KK). There were no significant differences in resting energy expenditure data
prior to the cycle trial for male subjects (0.001 + 0.48 kcal.minute-1; P < 0.990 and 0.001 + 2.38
total kcals; P < 0.990).
Means + standard deviations (SD) for resting energy expenditure are plotted in
kcal.minute-1 (Figure 22) and total kcals (Appendix JJ) during the treadmill trial for male
subjects. Dependent t tests were computed to assess differences in resting energy expenditure
prior to treadmill exercise between the SenseWear® Pro 2 Armband and respiratory metabolic
system (Appendix KK). There were no significant differences in resting energy expenditure
prior to the treadmill trial for male subjects (mean difference+ SD 0.10 + 0.29 kcal.minute-1 (P <
0.267) and 0.48 + 1.43 total kcals; P < 0.267).
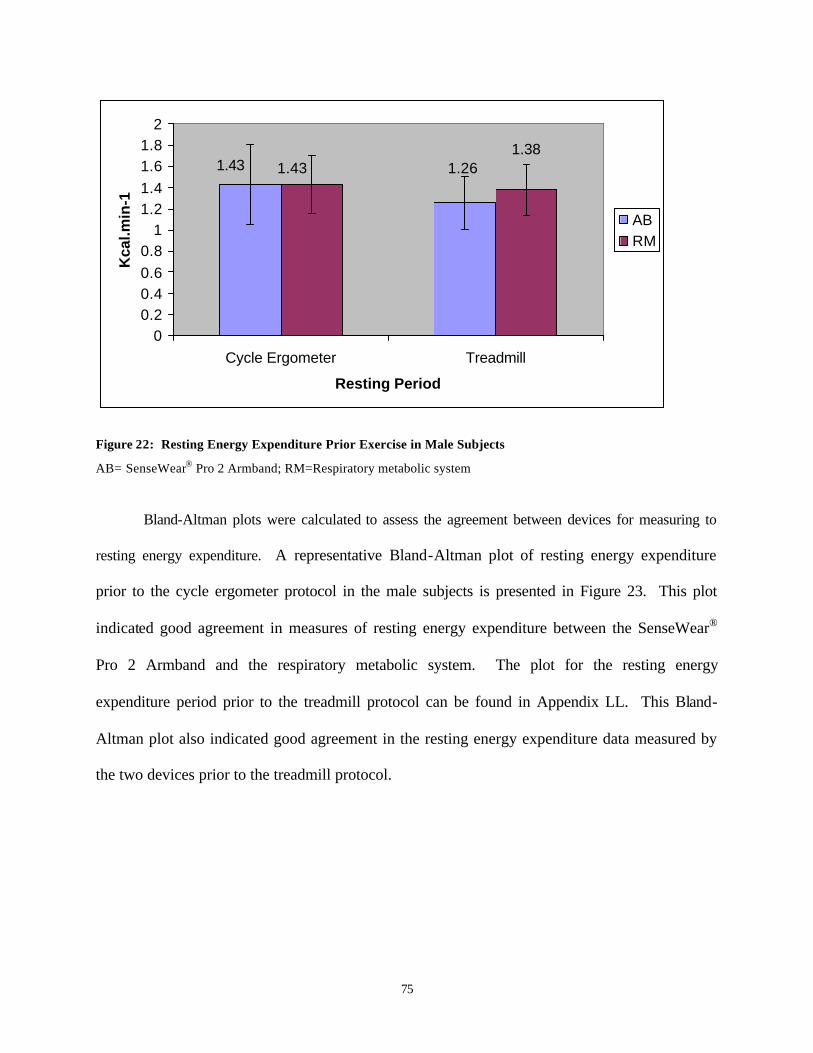
75
1.43 1.261.431.38
00.20.40.60.8
11.21.41.61.8
2
Cycle Ergometer Treadmill
Resting Period
Kca
l.min
-1
ABRM
Figure 22: Resting Energy Expenditure Prior Exercise in Male Subjects
AB= SenseWear® Pro 2 Armband; RM=Respiratory metabolic system
Bland-Altman plots were calculated to assess the agreement between devices for measuring to
resting energy expenditure. A representative Bland-Altman plot of resting energy expenditure
prior to the cycle ergometer protocol in the male subjects is presented in Figure 23. This plot
indicated good agreement in measures of resting energy expenditure between the SenseWear®
Pro 2 Armband and the respiratory metabolic system. The plot for the resting energy
expenditure period prior to the treadmill protocol can be found in Appendix LL. This Bland-
Altman plot also indicated good agreement in the resting energy expenditure data measured by
the two devices prior to the treadmill protocol.
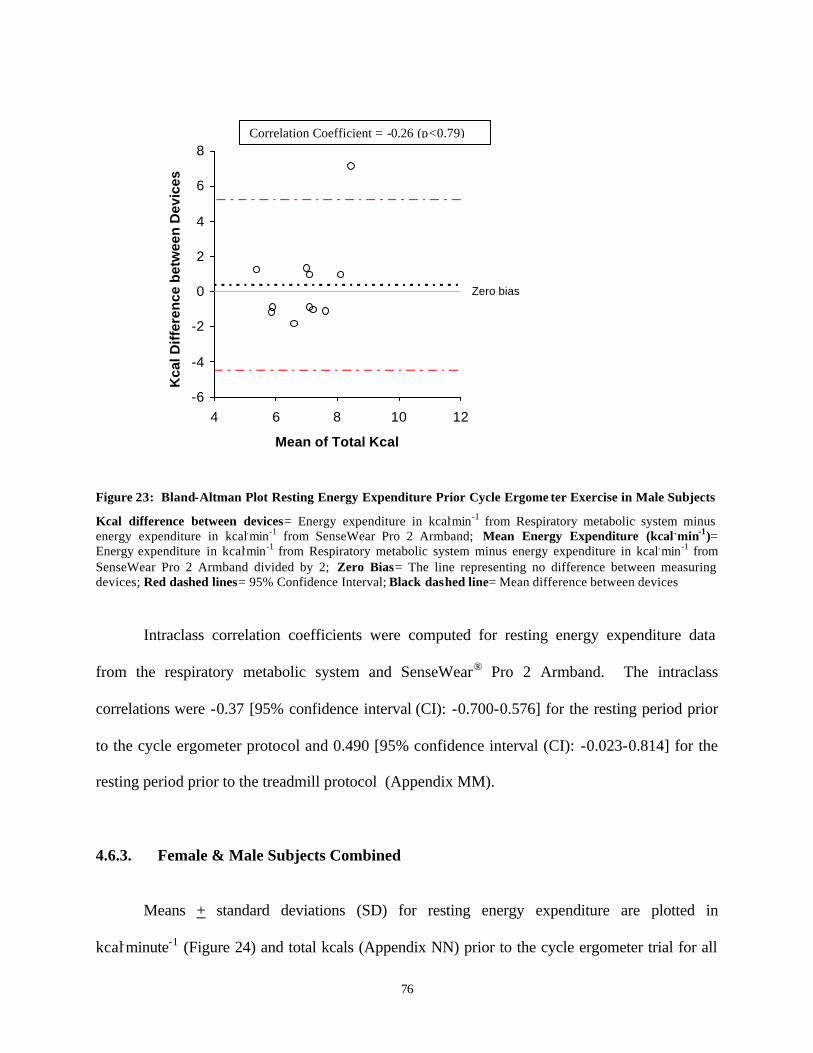
76
Zero bias
-6
-4
-2
0
2
4
6
8
4 6 8 10 12
Mean of Total Kcal
Kca
l Dif
fere
nce
bet
wee
n D
evic
es
Figure 23: Bland-Altman Plot Resting Energy Expenditure Prior Cycle Ergome ter Exercise in Male Subjects
Kcal difference between devices= Energy expenditure in kcal.min-1 from Respiratory metabolic system minus energy expenditure in kcal.min-1 from SenseWear Pro 2 Armband; Mean Energy Expenditure (kcal .min-1)= Energy expenditure in kcal.min-1 from Respiratory metabolic system minus energy expenditure in kcal.min-1 from SenseWear Pro 2 Armband divided by 2; Zero Bias= The line representing no difference between measuring devices; Red dashed lines= 95% Confidence Interval; Black dashed line= Mean difference between devices
Intraclass correlation coefficients were computed for resting energy expenditure data
from the respiratory metabolic system and SenseWear® Pro 2 Armband. The intraclass
correlations were -0.37 [95% confidence interval (CI): -0.700-0.576] for the resting period prior
to the cycle ergometer protocol and 0.490 [95% confidence interval (CI): -0.023-0.814] for the
resting period prior to the treadmill protocol (Appendix MM).
4.6.3. Female & Male Subjects Combined
Means + standard deviations (SD) for resting energy expenditure are plotted in
kcal.minute-1 (Figure 24) and total kcals (Appendix NN) prior to the cycle ergometer trial for all
Correlation Coefficient = -0.26 (p<0.79)
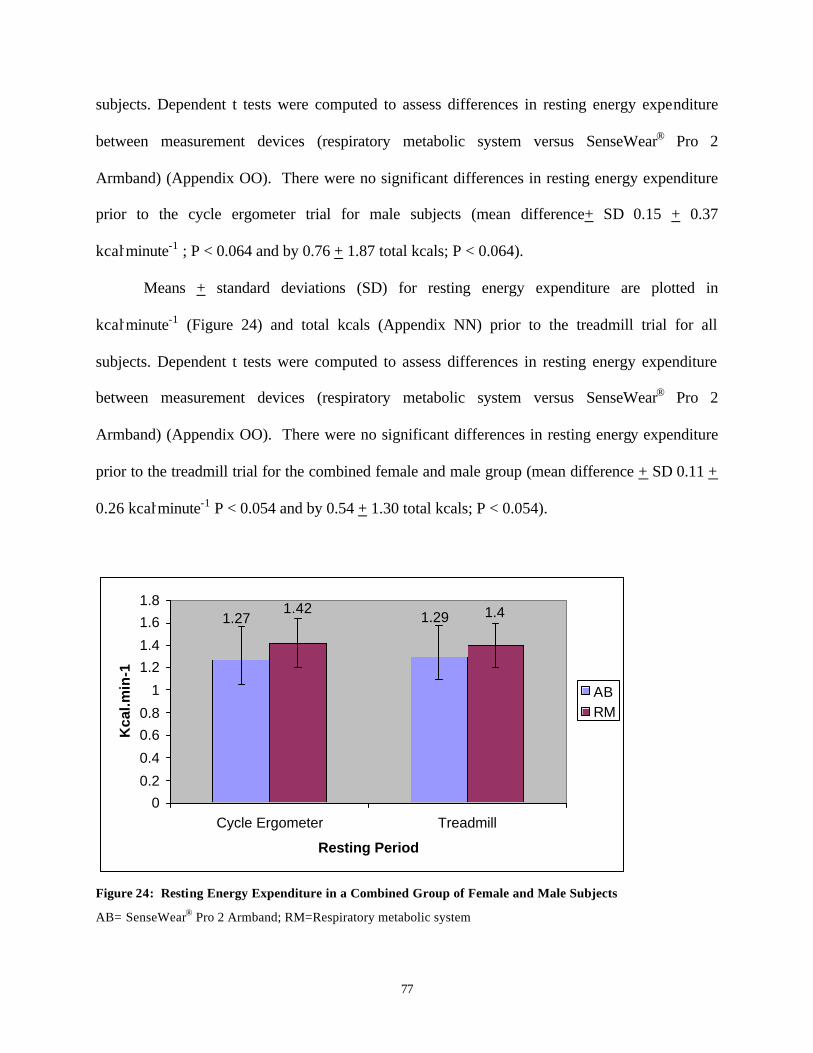
77
subjects. Dependent t tests were computed to assess differences in resting energy expenditure
between measurement devices (respiratory metabolic system versus SenseWear® Pro 2
Armband) (Appendix OO). There were no significant differences in resting energy expenditure
prior to the cycle ergometer trial for male subjects (mean difference+ SD 0.15 + 0.37
kcal.minute-1 ; P < 0.064 and by 0.76 + 1.87 total kcals; P < 0.064).
Means + standard deviations (SD) for resting energy expenditure are plotted in
kcal.minute-1 (Figure 24) and total kcals (Appendix NN) prior to the treadmill trial for all
subjects. Dependent t tests were computed to assess differences in resting energy expenditure
between measurement devices (respiratory metabolic system versus SenseWear® Pro 2
Armband) (Appendix OO). There were no significant differences in resting energy expenditure
prior to the treadmill trial for the combined female and male group (mean difference + SD 0.11 +
0.26 kcal.minute-1 P < 0.054 and by 0.54 + 1.30 total kcals; P < 0.054).
1.27 1.291.42 1.4
0
0.2
0.4
0.6
0.8
1
1.2
1.4
1.6
1.8
Cycle Ergometer Treadmill
Resting Period
Kca
l.min
-1
ABRM
Figure 24: Resting Energy Expenditure in a Combined Group of Female and Male Subjects
AB= SenseWear® Pro 2 Armband; RM=Respiratory metabolic system
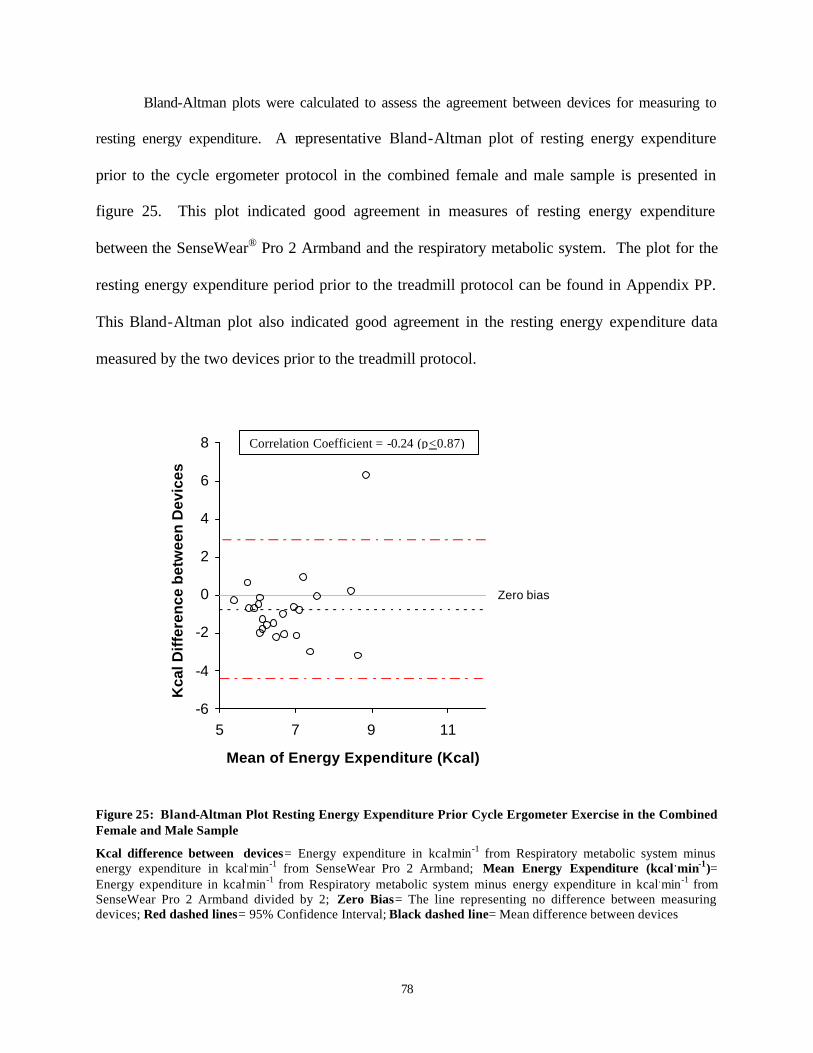
78
Bland-Altman plots were calculated to assess the agreement between devices for measuring to
resting energy expenditure. A representative Bland-Altman plot of resting energy expenditure
prior to the cycle ergometer protocol in the combined female and male sample is presented in
figure 25. This plot indicated good agreement in measures of resting energy expenditure
between the SenseWear® Pro 2 Armband and the respiratory metabolic system. The plot for the
resting energy expenditure period prior to the treadmill protocol can be found in Appendix PP.
This Bland-Altman plot also indicated good agreement in the resting energy expenditure data
measured by the two devices prior to the treadmill protocol.
Zero bias
-6
-4
-2
0
2
4
6
8
5 7 9 11
Mean of Energy Expenditure (Kcal)
Kca
l Dif
fere
nce
bet
wee
n D
evic
es
Figure 25: Bland-Altman Plot Resting Energy Expenditure Prior Cycle Ergometer Exercise in the Combined Female and Male Sample
Kcal difference between devices= Energy expenditure in kcal.min-1 from Respiratory metabolic system minus energy expenditure in kcal.min-1 from SenseWear Pro 2 Armband; Mean Energy Expenditure (kcal .min-1)= Energy expenditure in kcal.min-1 from Respiratory metabolic system minus energy expenditure in kcal.min-1 from SenseWear Pro 2 Armband divided by 2; Zero Bias= The line representing no difference between measuring devices; Red dashed lines= 95% Confidence Interval; Black dashed line= Mean difference between devices
Correlation Coefficient = -0.24 (p<0.87)
79
Intraclass correlation coefficients were computed for resting energy expenditure data
from the respiratory metabolic system and SenseWear® Pro 2 Armband. The intraclass
correlations were -0.006 [95% confidence interval (CI): -0.340-0.382] for the resting period prior
to the cycle ergometer protocol and 0.436 [95% confidence interval (CI): 0.073-0.704] for the
resting period prior to the treadmill protocol (Appendix MM).
80
5. CHAPTER 5
DISCUSSION, CONCLUSIONS AND RECOMMENDATIONS
5.1. INTRODUCTION
The primary purpose of this investigation was to examine the validity of the SenseWear®
Pro 2 Armband to assess energy expenditure during various modes of physical activity in
adolescent subjects. It was hypothesized that measures of energy expenditure during treadmill
and cycle ergometer exercise would not differ between the SenseWear® Pro 2 Armband and the
criterion respiratory metabolic system when compared for female and male subjects, separately
and when combined as a group.
The present study is the first to examine the validity of the SenseWear® Pro 2 Armband to
measure energy expenditure in adolescent females and males. Three previous studies have
examined the validity of the SenseWear® Pro 2 Armband to measure energy expenditure in adults
in the laboratory setting. These studies indicate both consistencies and inconsistencies in the
research findings when compared to the present investigation.
The primary finding of this investigation is that the SenseWear® Pro 2 Armband generally
underestimated energy expenditure during cycle ergometer and treadmill exercise in adolescent
females and males. There are several mechanisms that may explain the underestimation of
energy expenditure across the modes of exercise tested. First, the SenseWear® Pro 2 Armband
employed generalized algorithms for both resting and physical activity energy expenditure that
were developed using adult formulas for estimating energy expenditure. These algorithms were
evaluated and revised based on testing exclusively with adult subjects. Using these adult based
81
formulas and algorithms to predict energy expenditure in adolescents may increase the likelihood
of error in energy expenditure estimations. Another mechanism to examine is the use of a two-
axis accelerometer to provide movement signals to the energy prediction model employed by the
SenseWear® Pro 2 Armband. In the literature, it has been well documented that the
accelerometers underestimate energy expenditure during non-weight bearing exercise and when
exercise is performed on an inclined surface. In addition, the armband does not detect the
beginning, end and type of physical activity being performed and this lack of contextual
identification decreases the accuracy of the energy expenditure calculation. These and other
mechanisms will be examined more closely as they relate to the underestimation of energy
expenditure during the specific exercise mode tested.
5.2. VALIDITY OF THE SENSEWEAR PRO 2 ARMBAND IN CYCLE ERGOMETER EXERCISE
One of the primary findings of this investigation was that the SenseWear® Pro 2 Armband
significantly underestimated energy expenditure during cycle ergometer exercise compared to
the respiratory metabolic system in both female and male adolescent subjects. Significant lower
energy expenditure was found for the separate groups of females and males at both cycle
ergometer exercise stages when measurements were made with the SenseWear® Pro 2 Armband.
In addition, the SenseWear® Pro 2 Armband significantly underestimated energy expenditure
when male and female subjects were combined. Intraclass correlations relating energy
expenditure (kcal.min-1) from the two devices for the cycle ergometer exercise stages were low
for females, males, and females and males combined. These low correlations are consistent with
the poor agreement between measuring devices observed in the Bland-Altman plots for cycle
ergometer exercise.
82
The present findings do not support the research hypothesis that measures of energy
expenditure would not differ between the SenseWear® Pro 2 Armband and respiratory metabolic
system when compared separately for female and male subjects. In addition, for the cycle
ergometer protocol, these findings do not support the research hypothesis that measures of
energy expenditure would not differ between the SenseWear® Pro 2 Armband and respiratory
metabolic system when a combined sample of female and male adolescents were examined.
Since energy expenditure was consistently lower when measured by the SenseWear® Pro 2
Armband for females, males, and the combined group for the cycle ergometer protocol, the
results will be discussed collectively across gender.
The cycle ergometer exercise findings from this study are consistent with the results from
a previous study involving adults that compared energy expenditure between the SenseWear®
Pro 2 Armband and a respiratory metabolic system. In a study by Jakicic et al., the SenseWear®
Pro 2 Armband significantly underestimated energy expenditure during cycle ergometer exercise
for both low and moderate intensity exercise [71]. The Bland-Altman plot for cycle ergometer
exercise confirmed the low agreement between measuring devices and indicated that the greatest
difference occurred as energy expenditure increased. It was concluded that the generalized
algorithms that are standard in the commercial version of the armband might be less accurate
exercise specific algorithms [71].
In another study, Fruin et al. found no significant differences between the SenseWear®
Pro 2 Armband and indirect calorimetry measurements of energy expenditure at three different
time periods (early, mid, and late) and for total energy expenditure during a 40 minute cycle
ergometer trial [72]. The greatest variation in energy expenditure occurred during the early time
period (8.8% difference, P>0.07). Although the differences in energy expenditure between
83
devices were not statistically significant, the Bland-Altman plots showed low limits of agreement
between the two devices with larger prediction error seen for individuals with the highest and
lowest energy expenditures. It was concluded that the SenseWear® Pro 2 Armband provided a
close estimate of cycling exercise energy expenditure in groups but may not be suitable for an
individual estimate.
Comparing these two adult studies with the present investigation in adolescent subjects,
all three studies showed poor agreement in measures of energy expenditure between the
SenseWear® Pro 2 Armband and the respiratory metabolic system as observed by the Bland-
Altman plots. However, the SenseWear® Pro 2 Armband significantly underestimated energy
expenditure responses during cycle ergometer exercise in only one of the adult and the present
investigation with adolescents. In the second adult study, there were no significant differences in
measures of energy expenditure between devices for adult female and male subjects in cycle
ergometer exercise. Therefore, the findings from this investigation are consistent and
inconsistent with the results from the previous adult studies using the SenseWear® Pro 2
Armband.
5.2.1. Mechanisms for Underestimation of Energy Expenditure during Cycle Ergometer Exercise
When the present findings are examined in conjunction with previous reports, in general the
SenseWear® Pro 2 Armband underestimates energy expenditure for both adolescents and adults
performing cycle ergometer exercise. There are several mechanisms that may explain the lower
energy expenditure estimates derived from the SenseWear® Pro 2 Armband.
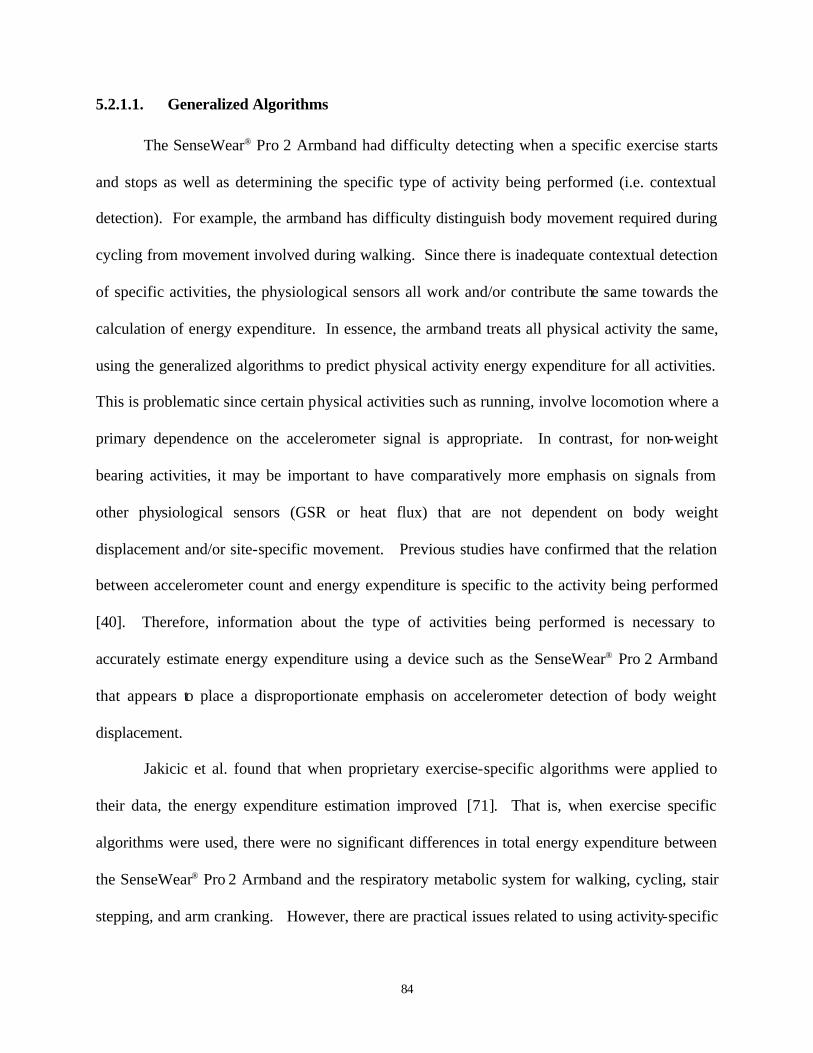
84
5.2.1.1. Generalized Algorithms
The SenseWear® Pro 2 Armband had difficulty detecting when a specific exercise starts
and stops as well as determining the specific type of activity being performed (i.e. contextual
detection). For example, the armband has difficulty distinguish body movement required during
cycling from movement involved during walking. Since there is inadequate contextual detection
of specific activities, the physiological sensors all work and/or contribute the same towards the
calculation of energy expenditure. In essence, the armband treats all physical activity the same,
using the generalized algorithms to predict physical activity energy expenditure for all activities.
This is problematic since certain physical activities such as running, involve locomotion where a
primary dependence on the accelerometer signal is appropriate. In contrast, for non-weight
bearing activities, it may be important to have comparatively more emphasis on signals from
other physiological sensors (GSR or heat flux) that are not dependent on body weight
displacement and/or site-specific movement. Previous studies have confirmed that the relation
between accelerometer count and energy expenditure is specific to the activity being performed
[40]. Therefore, information about the type of activities being performed is necessary to
accurately estimate energy expenditure using a device such as the SenseWear® Pro 2 Armband
that appears to place a disproportionate emphasis on accelerometer detection of body weight
displacement.
Jakicic et al. found that when proprietary exercise-specific algorithms were applied to
their data, the energy expenditure estimation improved [71]. That is, when exercise specific
algorithms were used, there were no significant differences in total energy expenditure between
the SenseWear® Pro 2 Armband and the respiratory metabolic system for walking, cycling, stair
stepping, and arm cranking. However, there are practical issues related to using activity-specific
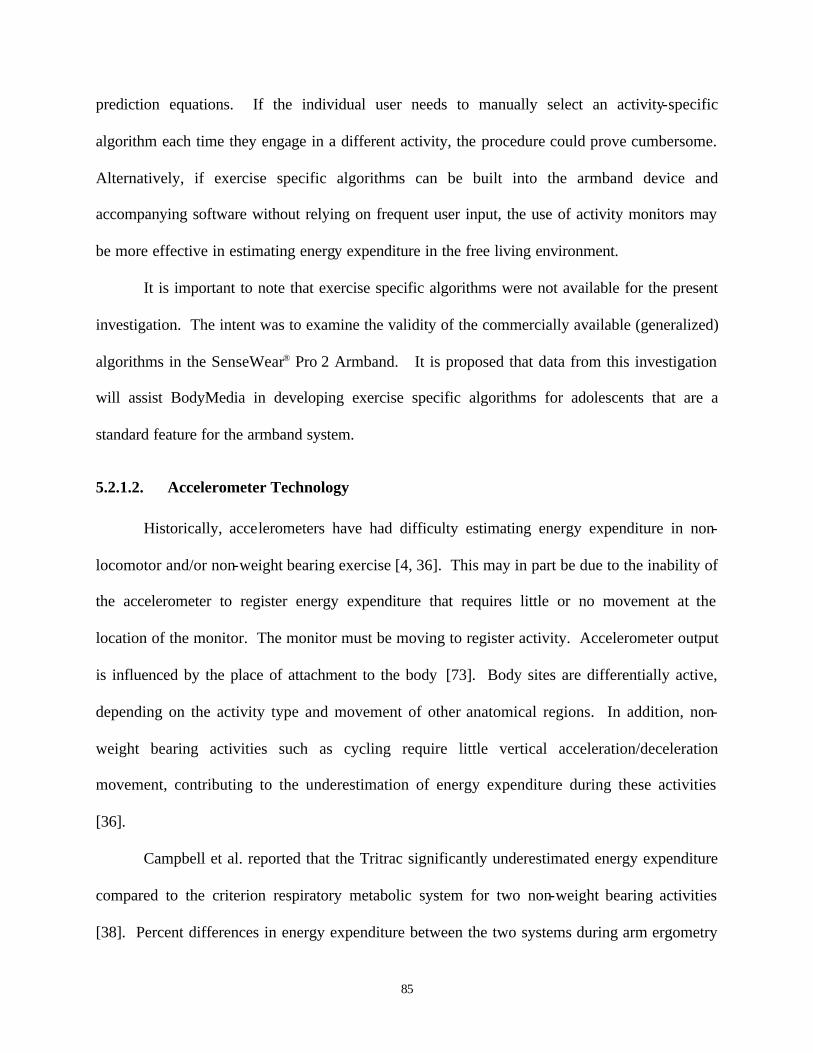
85
prediction equations. If the individual user needs to manually select an activity-specific
algorithm each time they engage in a different activity, the procedure could prove cumbersome.
Alternatively, if exercise specific algorithms can be built into the armband device and
accompanying software without relying on frequent user input, the use of activity monitors may
be more effective in estimating energy expenditure in the free living environment.
It is important to note that exercise specific algorithms were not available for the present
investigation. The intent was to examine the validity of the commercially available (generalized)
algorithms in the SenseWear® Pro 2 Armband. It is proposed that data from this investigation
will assist BodyMedia in developing exercise specific algorithms for adolescents that are a
standard feature for the armband system.
5.2.1.2. Accelerometer Technology
Historically, accelerometers have had difficulty estimating energy expenditure in non-
locomotor and/or non-weight bearing exercise [4, 36]. This may in part be due to the inability of
the accelerometer to register energy expenditure that requires little or no movement at the
location of the monitor. The monitor must be moving to register activity. Accelerometer output
is influenced by the place of attachment to the body [73]. Body sites are differentially active,
depending on the activity type and movement of other anatomical regions. In addition, non-
weight bearing activities such as cycling require little vertical acceleration/deceleration
movement, contributing to the underestimation of energy expenditure during these activities
[36].
Campbell et al. reported that the Tritrac significantly underestimated energy expenditure
compared to the criterion respiratory metabolic system for two non-weight bearing activities
[38]. Percent differences in energy expenditure between the two systems during arm ergometry
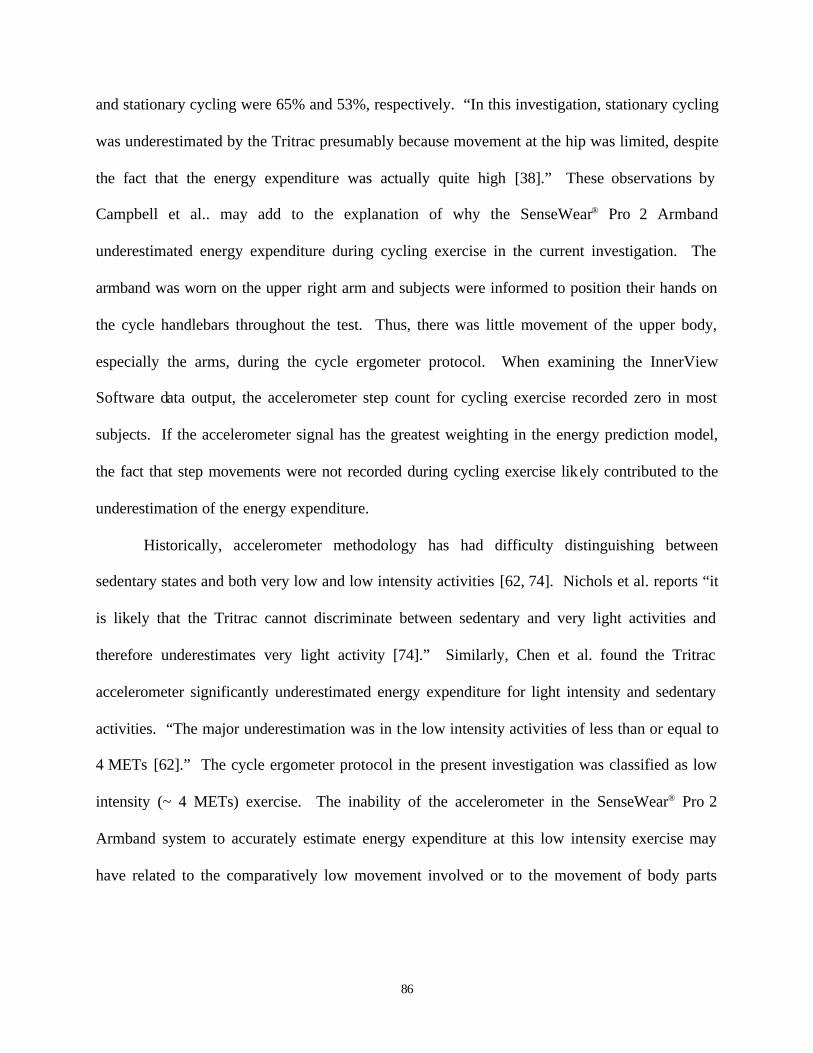
86
and stationary cycling were 65% and 53%, respectively. “In this investigation, stationary cycling
was underestimated by the Tritrac presumably because movement at the hip was limited, despite
the fact that the energy expenditure was actually quite high [38].” These observations by
Campbell et al.. may add to the explanation of why the SenseWear® Pro 2 Armband
underestimated energy expenditure during cycling exercise in the current investigation. The
armband was worn on the upper right arm and subjects were informed to position their hands on
the cycle handlebars throughout the test. Thus, there was little movement of the upper body,
especially the arms, during the cycle ergometer protocol. When examining the InnerView
Software data output, the accelerometer step count for cycling exercise recorded zero in most
subjects. If the accelerometer signal has the greatest weighting in the energy prediction model,
the fact that step movements were not recorded during cycling exercise likely contributed to the
underestimation of the energy expenditure.
Historically, accelerometer methodology has had difficulty distinguishing between
sedentary states and both very low and low intensity activities [62, 74]. Nichols et al. reports “it
is likely that the Tritrac cannot discriminate between sedentary and very light activities and
therefore underestimates very light activity [74].” Similarly, Chen et al. found the Tritrac
accelerometer significantly underestimated energy expenditure for light intensity and sedentary
activities. “The major underestimation was in the low intensity activities of less than or equal to
4 METs [62].” The cycle ergometer protocol in the present investigation was classified as low
intensity (~ 4 METs) exercise. The inability of the accelerometer in the SenseWear® Pro 2
Armband system to accurately estimate energy expenditure at this low intensity exercise may
have related to the comparatively low movement involved or to the movement of body parts
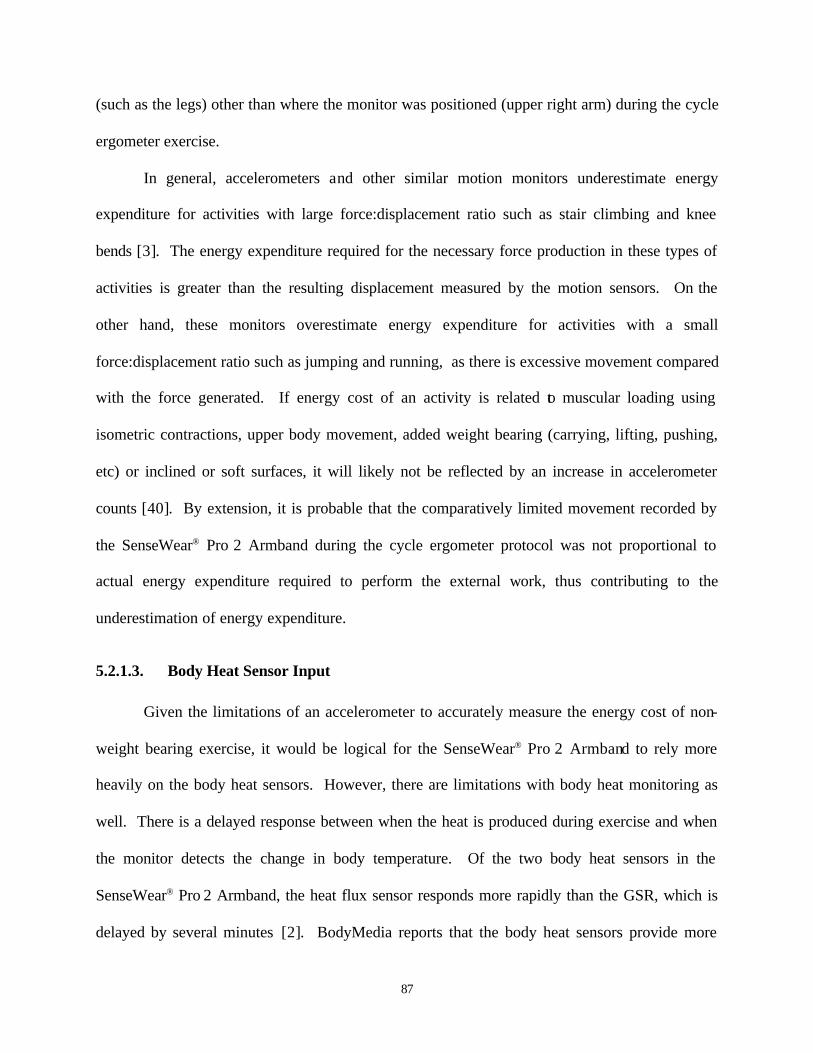
87
(such as the legs) other than where the monitor was positioned (upper right arm) during the cycle
ergometer exercise.
In general, accelerometers and other similar motion monitors underestimate energy
expenditure for activities with large force:displacement ratio such as stair climbing and knee
bends [3]. The energy expenditure required for the necessary force production in these types of
activities is greater than the resulting displacement measured by the motion sensors. On the
other hand, these monitors overestimate energy expenditure for activities with a small
force:displacement ratio such as jumping and running, as there is excessive movement compared
with the force generated. If energy cost of an activity is related to muscular loading using
isometric contractions, upper body movement, added weight bearing (carrying, lifting, pushing,
etc) or inclined or soft surfaces, it will likely not be reflected by an increase in accelerometer
counts [40]. By extension, it is probable that the comparatively limited movement recorded by
the SenseWear® Pro 2 Armband during the cycle ergometer protocol was not proportional to
actual energy expenditure required to perform the external work, thus contributing to the
underestimation of energy expenditure.
5.2.1.3. Body Heat Sensor Input
Given the limitations of an accelerometer to accurately measure the energy cost of non-
weight bearing exercise, it would be logical for the SenseWear® Pro 2 Armband to rely more
heavily on the body heat sensors. However, there are limitations with body heat monitoring as
well. There is a delayed response between when the heat is produced during exercise and when
the monitor detects the change in body temperature. Of the two body heat sensors in the
SenseWear® Pro 2 Armband, the heat flux sensor responds more rapidly than the GSR, which is
delayed by several minutes [2]. BodyMedia reports that the body heat sensors provide more
88
appropriate data in protocols lasting eight minutes or longer [2]. Since the protocol in the current
study used four minutes exercise stages, this may not have given the body heat sensors enough
time to provide data indicative of metabolic heat production by muscle. In addition, the cycle
ergometer protocol was classified as a low intensity exercise. Less body heat is generated during
lower intensity exercise. Given the delay in response to the body heat sensors and the lower
body heat generated during low intensity exercise, input from the body heat sensors may not
have reflected the actual energy cost associated with the cycle ergometer exercise.
For cycle ergometer exercise, the SenseWear® Pro 2 Armband clearly underestimates
energy expenditure when comparisons are made for adolescent females and males. Developing
algorithms customized for adolescents along with exercise specific algorithms that are initiated at
the onset of exercise, may prove beneficial in reducing the estimation error observed in the
SenseWear® Pro 2 Armband’s measures of energy expenditure during cyc ling exercise.
5.3. VALIDITY OF THE SENSEWEAR PRO 2 ARMBAND IN TREADMILL EXERCISE
Another primary finding of this investigation was that the SenseWear® Pro 2 Armband
significantly underestimated energy expenditure compared to the respiratory metabolic system
during most of the treadmill exercise stages in adolescent female and male subjects. Significant
differences in energy expenditure were found in females during all four stages of the treadmill
protocol. For male subjects, measures of energy expenditure from the SenseWear® Pro 2
Armband and respiratory metabolic system were not significantly different during stage 1 and 2
of the treadmill protocol. However, energy expenditure measures for SenseWear® Pro 2
Armband were significantly lower during stage 3 and 4. When male and female subjects were
89
combined, the SenseWear® Pro 2 Armband significantly underestimated energy expenditure
during stages 2, 3, and 4.
These findings do not support the research hypothesis that measures of energy
expenditure would not differ between the SenseWear® Pro 2 Armband and respiratory metabolic
system when compared separately for adolescent female and male subjects. In addition, these
findings do not support the research hypothesis that measures of energy expenditure would not
differ between the SenseWear® Pro 2 Armband and respiratory metabolic system when a
combined sample of female and male adolescents was examined. Since the pattern of energy
expenditure differences between measuring devices was not consistent for females and males
during the treadmill protocol, mechanisms explaining these differences will be discussed
according to gender.
5.3.1. Level Treadmill Walking
In female subjects, there were significant differences in the measures of energy
expenditure (kcal.min-1) between the SenseWear® Pro 2 Armband and the respiratory metabolic
system during level treadmill walking at both the 3.0 mph, 0% grade (stage 1) and 4.0 mph, 0%
grade (stage 2) stages. The SenseWear® Pro 2 Armband underestimated energy expenditure by
13% during stage 1. The percent difference increased to 20% during stage 2. The Bland-Altman
plots indicate low agreement between devices for estimating energy expenditure, with larger
prediction error found for individuals with the highest energy expenditure.
On the other hand, there were no significant differences in energy expenditure (kcal.min-
1) measures between the SenseWear® Pro 2 Armband and the respiratory metabolic system for
the two level treadmill walking stages in adolescent male subjects. That is, during stages 1 and
2, the armband differed only by 7% and 5% respectively from the respiratory metabolic system.
90
The Bland-Altman plots confirm the good agreement for measures of energy expenditure
between devices.
When males and females were combined (n=24), the differences observed separately in
female and male adolescents were divided. The SenseWear® Pro Armband measures of energy
expenditure were significantly different from the respiratory metabolic system during stage 2,
but not for stage 1. Energy expenditure measures differed between measuring devices by only
2% in stage 1 and 13% in stage 2. As observed in the Bland-Altman plots, there was modest
agreement in energy expenditure measures between the SenseWear® Pro 2 Armband and the
respiratory metabolic system.
The present study involving adolescents is not consistent with those of the three previous
adult studies where energy expenditure was measured with the SenseWear® Pro Armband during
treadmill exercise. Jakicic et al. reported that the armband overestimated energy expenditure of
level treadmill walking at 3.0 mph (1.3 + 0.5 kcal.min-1) in 40 adult men and women combined
[71]. Fruin et al. found similar results. The SenseWear® Pro Armband overestimated level
walking on the treadmill by 38% at 3.0 mph and by 14% at 4.0 mph [72]. In the third study, King
et al. examined the validity of the SenseWear® Pro Armband to measure energy expenditure in
19 adults (9 males and 10 females) while walking/running at seven different speeds on the
treadmill [75]. Investigators found that each subsequently faster speed elicited a significant
increase in mean energy expenditure for the SenseWear® Pro Armband and the respiratory
metabolic system. However, the SenseWear® Pro Armband systematically overestimated energy
expenditure at all seven speeds.
91
5.3.1.1. Mechanisms for the Underestimation of Energy Expenditure during Level Treadmill Walking
The direction of differences in energy expenditure measures between the SenseWear®
Pro 2 Armband and the respiratory metabolic system for level treadmill walking varied among
adolescent females and males examined presently and adult subjects used in previous
investigations. In all three studies using adult subjects, the SenseWear® Pro 2 Armband
overestimated the energy expenditure of level treadmill walking. In adolescent males, the
armband measures of energy expenditure were not significantly different from the respiratory
metabolic system. In adolescent females, however, the SenseWear® Pro 2 Armband significantly
underestimated energy expenditure compared to the respiratory metabolic system. The
mechanisms related to the underestimation of energy expenditure by the SenseWear® Pro 2
Armband in females during level treadmill walking are discussed below.
Accelerometer Technology: In general, accelerometry methods do not account for stride length
changes as walking speed varies, leading to underestimation of energy expenditure, especially at
higher speeds [4]. Stride length and stride frequency are the primary components of
walking/running velocity [76]. As speed increases, there is a corresponding increase either in
stride length, in stride frequency or in a combination of both [77]. Accelerometers count step
(or stride) frequency. Thus if an individual increases walking speed by predominantly increasing
stride length, the accelerometer will not be able to accurately detect the increased energy
expenditure associated with the increase in speed [78]. This will lead to underestimation of
energy expenditure.
Yngve et al. suggested that because activity counts are a function of vertical acceleration
and the frequency of this acceleration, a possible difference in gait might produce differences in
92
accelerometer output [73]. Kerrigan reported that when normalized for height, females tend to
have the same or slightly greater stride lengths than males [79]. If the accelerometer signal has
the greatest weighting in the SenseWear® Pro 2 Armband energy prediction model, then changes
in stride length and the associated increase in energy expenditure may not be accounted for due
to the limitation in accelerometry technology. This may have contributed to the underestimation
of energy expenditure by the SenseWear® Pro 2 Armband during level treadmill walking in
female adolescents.
There are anatomical factors related to movement during walking that may impact the
accuracy of the accelerometer to record body acceleration and thus estimate energy expenditure.
“When walking, women exhibit comparatively more motion of the pelvis in the coronal plane
(from the nose to the back of the head) and less vertical center of mass motion displacement. It
is possible that women use greater pelvic motion in the coronal plane to reduce their vertical
center of mass displacement” [80]. Chen et al. confirmed that when walking, females have a
“smaller parameter in the vertical plane in accelerometers (than males)” [62]. In part, this may
be attributable to the fact that females have wider hips than males, which makes the femur more
pronounced and lowers the center of gravity [81]. A reduction in the vertical movement during
walking may reduce the body movement in the vertical plane that is detected by the
accelerometer, thus decreasing the accelerometer output count. Reduced accelerometer counts
lead to lower predictions of energy expenditure. If the signal in the two-axis accelerometer of
the SenseWear® Pro 2 Armband carries the greatest weight in the energy prediction model, then
reduced movement detected in the vertical plane will contribute to an underestimate of energy
expenditure.
93
Body Composition: Lean body mass, fat mass and total body weight influence total energy
expenditure especially during locomotor activities [82]. Therefore, it can be assumed that these
variables will also influence physical activity monitors that predict energy expenditure. In
general, both adolescent and adult males have a higher percentage of lean body mass and less
body fat than females [81]. In the present investigation, the adolescent males averaged 12 %
body fat whereas, adolescent females averaged 28% body fat. The greater body fat in females
may have delayed the release of body heat during exercise [81]. When body heat transfer to the
skin is delayed, the skin temperature will not reflect the metabolic heat production of the
exercising muscle. As a result, the signal from the heat flux and temperature sensors in the
SenseWear® Pro 2 Armband may not have accurately reflected the heat production (energetic
cost) of the working muscle(s), and thus underestimated the true energy expended by the body.
In addition, females have comparatively more adipose tissue in the upper arms [83]. The
female subjects in this investigation had significantly higher triceps skinfold measures compared
to male subjects (see Table 1, Chapter 3, Methods). The SenseWear® Pro 2 Armband is worn on
the upper right arm. The presence of more fat in the upper arm, may make it harder to dissipate
heat from the subcutaneous level to the skin level. This too may have lowered the signal from
the SenseWear® Pro 2 Armband’s skin temperature and GSR sensors resulting in an
underestimation of physical activity energy expenditure.
Activity induced energy expenditure is a function of the body acceleration and the mass
of the body displaced [84]. A greater body mass corresponds to a net higher energy cost of work
during weight bearing activity [81]. In this investigation, the average weight of female subjects
was seven kilograms higher than the average weight of male subjects. The energy cost of
walking is proportional to body weight [82]. Since the SenseWear® Pro 2 Armband’s algorithms
94
are proprietary, it is unclear how body weight is used as a determinant in the model to estimate
energy expenditure during weight-bearing physical activity.
5.3.2. Incline Treadmill Walking/Jogging
Unlike level treadmill walking, the pattern of energy expenditure differences between the
SenseWear® Pro 2 Armband and the respiratory metabolic system were consistent for adolescent
males, females, and adults during graded treadmill walking/jogging. In female subjects, there
were significant differences in the measures of energy expenditure between devices during
graded treadmill walking/jogging at both the 4.0 mph, 5% grade (stage 3) and the 4.5 mph, 5%
grade (stage 4) stages. The SenseWear® Pro 2 Armband underestimated energy expenditure by
34% during stages 3 and 4. The Bland-Altman plots indicated a low agreement in measures of
energy expenditure between the SenseWear® Pro 2 Armband and the respiratory metabolic
system during graded treadmill walking/jogging in adolescent females. In general, the
magnitude of difference increased as energy expenditure increased.
For male subjects, there were significant differences in the measures of energy
expenditure between devices during graded treadmill walking/jogging at both the 4.0 mph, 5%
grade (stage 3) and the 4.5 mph, 5% grade (stage 4) stages. The SenseWear® Pro 2 Armband
underestimated energy expenditure by 16% during stage 3 and 21% during stage 4. Using the
Bland-Altman plots it was noted that the magnitude of difference between measures of energy
expenditure for the two devices increased as energy expenditure increased during graded
treadmill walking/jogging in the adolescent male subjects.
When males and females were combined (n=24), the SenseWear® Pro Armband
underestimated energy expenditure by 25% during stage 3 and 27% during stage 4. Bland-
Altman plots indicated the low agreement for measures of energy expenditure between the
95
SenseWear® Pro 2 Armband and the respiratory metabolic system during graded treadmill
walking/jogging. The magnitude of this difference increased as energy expenditure increased.
The observation that the measures of energy expenditure were significantly different
between the SenseWear® Pro 2 Armband and the respiratory metabolic system when treadmill
grade increased, is consistent with the three previous adult studies. Jakicic et al. examined the
accuracy of the SenseWear® Pro Armband in estimating energy expenditure in adults (females
and males) during treadmill walking/jogging [71]. The armband significantly underestimated
energy expenditure during treadmill walking on a 5% (0.3 + 0.6 kcal.min-1, p< 0.016) and 10%
grade (2.4 + 0.9 kcal.min-1, p<0.016) when compared to respiratory metabolic measures. Fruin
et al. used the SenseWear® Pro Armband to measure energy expenditure in 20 adult (10 male and
10 female) subjects during inclined treadmill walking [72]. Results indicated that the
SenseWear® Pro Armband estimate of energy expenditure increased with increasing treadmill
speed but not inclination. The SenseWear® Pro Armband significantly underestimated (22%,
p<0,001) energy expenditure required to walk at a 5% treadmill grade.
5.3.2.1. Mechanisms for the Underestimation of Energy Expenditure during Graded Treadmill Walking/Jogging
When the present findings are examined in conjunction with previous reports, it appears
that the SenseWear® Pro 2 Armband underestimates energy expenditure for both adolescents and
adults performing graded treadmill walking/jogging. There are several mechanisms that may
explain the lower energy expenditure estimates derived from the SenseWear® Pro 2 Armband.
Accelerometer Input: While it cannot be directly determined, it is possible that during treadmill
exercise the primary signal to the energy expenditure model of the SenseWear® Pro 2 Armband
is derived from the two-axis accelerometer. Historically, accelerometers have had difficulty
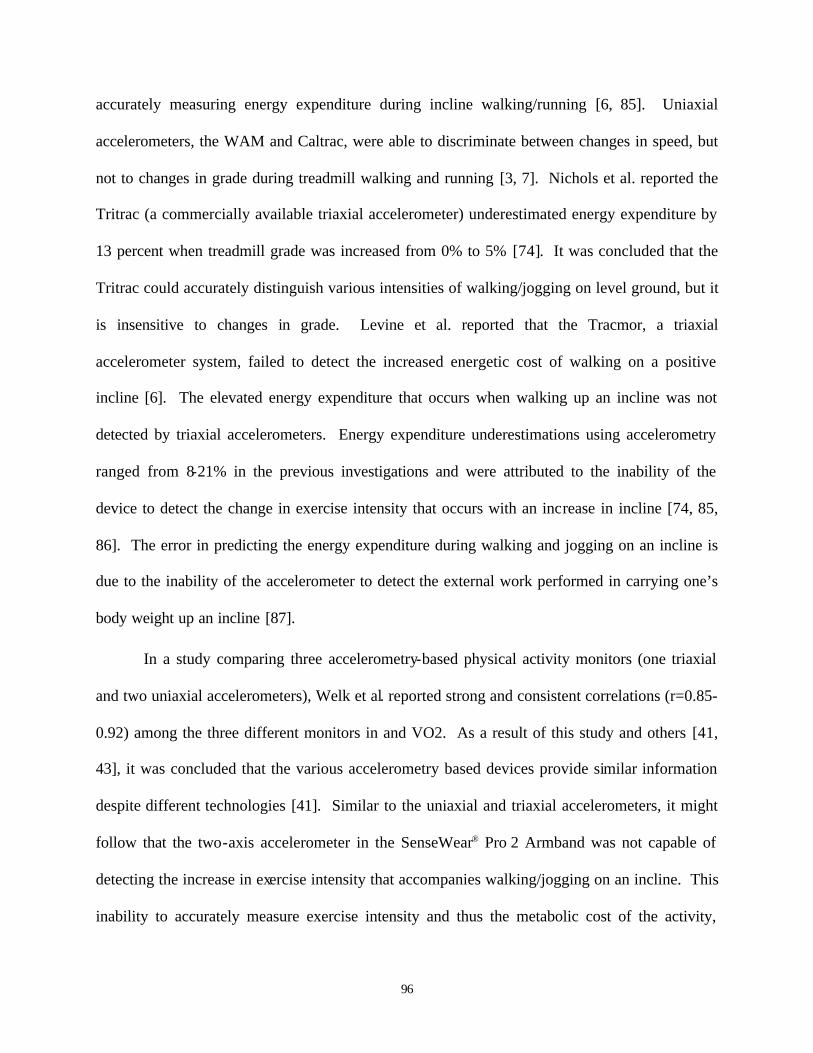
96
accurately measuring energy expenditure during incline walking/running [6, 85]. Uniaxial
accelerometers, the WAM and Caltrac, were able to discriminate between changes in speed, but
not to changes in grade during treadmill walking and running [3, 7]. Nichols et al. reported the
Tritrac (a commercially available triaxial accelerometer) underestimated energy expenditure by
13 percent when treadmill grade was increased from 0% to 5% [74]. It was concluded that the
Tritrac could accurately distinguish various intensities of walking/jogging on level ground, but it
is insensitive to changes in grade. Levine et al. reported that the Tracmor, a triaxial
accelerometer system, failed to detect the increased energetic cost of walking on a positive
incline [6]. The elevated energy expenditure that occurs when walking up an incline was not
detected by triaxial accelerometers. Energy expenditure underestimations using accelerometry
ranged from 8-21% in the previous investigations and were attributed to the inability of the
device to detect the change in exercise intensity that occurs with an increase in incline [74, 85,
86]. The error in predicting the energy expenditure during walking and jogging on an incline is
due to the inability of the accelerometer to detect the external work performed in carrying one’s
body weight up an incline [87].
In a study comparing three accelerometry-based physical activity monitors (one triaxial
and two uniaxial accelerometers), Welk et al. reported strong and consistent correlations (r=0.85-
0.92) among the three different monitors in and VO2. As a result of this study and others [41,
43], it was concluded that the various accelerometry based devices provide similar information
despite different technologies [41]. Similar to the uniaxial and triaxial accelerometers, it might
follow that the two-axis accelerometer in the SenseWear® Pro 2 Armband was not capable of
detecting the increase in exercise intensity that accompanies walking/jogging on an incline. This
inability to accurately measure exercise intensity and thus the metabolic cost of the activity,
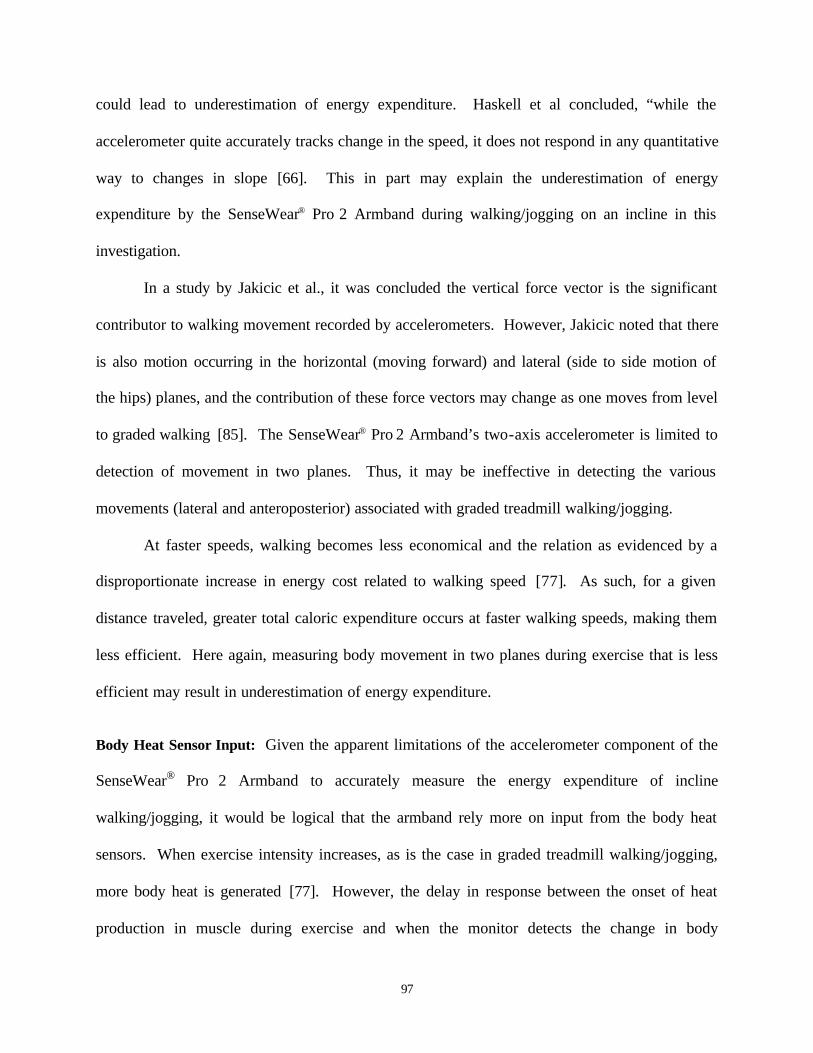
97
could lead to underestimation of energy expenditure. Haskell et al concluded, “while the
accelerometer quite accurately tracks change in the speed, it does not respond in any quantitative
way to changes in slope [66]. This in part may explain the underestimation of energy
expenditure by the SenseWear® Pro 2 Armband during walking/jogging on an incline in this
investigation.
In a study by Jakicic et al., it was concluded the vertical force vector is the significant
contributor to walking movement recorded by accelerometers. However, Jakicic noted that there
is also motion occurring in the horizontal (moving forward) and lateral (side to side motion of
the hips) planes, and the contribution of these force vectors may change as one moves from level
to graded walking [85]. The SenseWear® Pro 2 Armband’s two-axis accelerometer is limited to
detection of movement in two planes. Thus, it may be ineffective in detecting the various
movements (lateral and anteroposterior) associated with graded treadmill walking/jogging.
At faster speeds, walking becomes less economical and the relation as evidenced by a
disproportionate increase in energy cost related to walking speed [77]. As such, for a given
distance traveled, greater total caloric expenditure occurs at faster walking speeds, making them
less efficient. Here again, measuring body movement in two planes during exercise that is less
efficient may result in underestimation of energy expenditure.
Body Heat Sensor Input: Given the apparent limitations of the accelerometer component of the
SenseWear® Pro 2 Armband to accurately measure the energy expenditure of incline
walking/jogging, it would be logical that the armband rely more on input from the body heat
sensors. When exercise intensity increases, as is the case in graded treadmill walking/jogging,
more body heat is generated [77]. However, the delay in response between the onset of heat
production in muscle during exercise and when the monitor detects the change in body
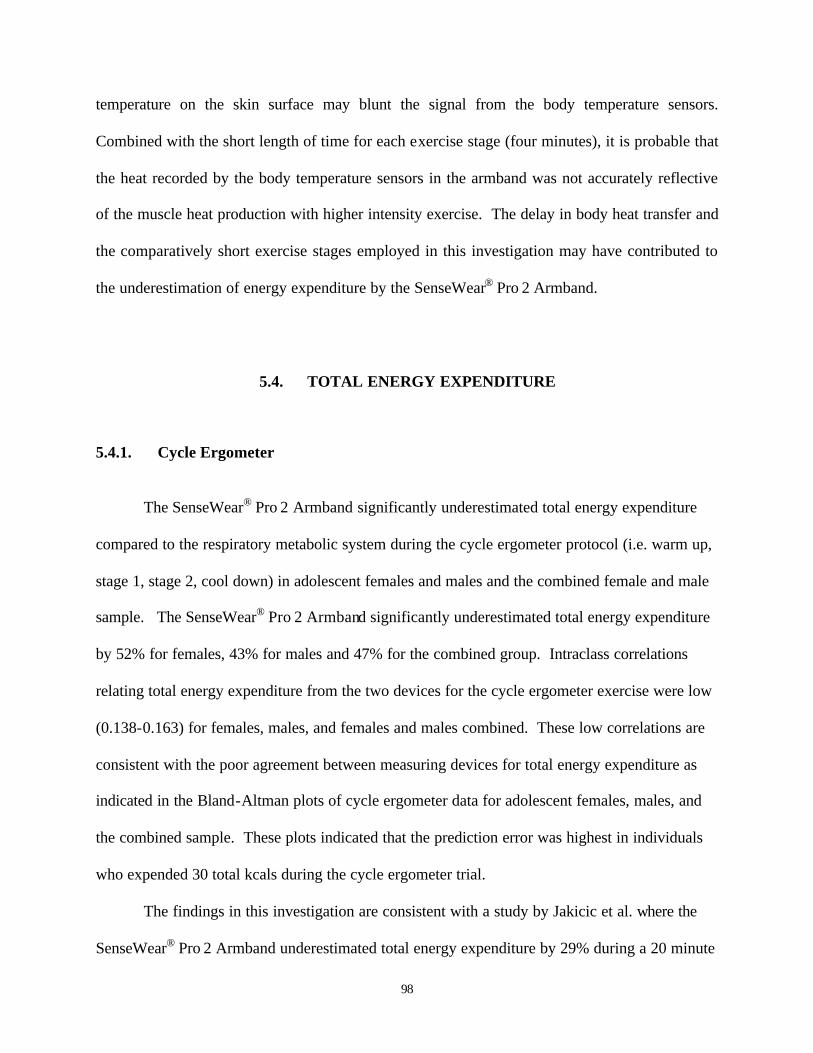
98
temperature on the skin surface may blunt the signal from the body temperature sensors.
Combined with the short length of time for each exercise stage (four minutes), it is probable that
the heat recorded by the body temperature sensors in the armband was not accurately reflective
of the muscle heat production with higher intensity exercise. The delay in body heat transfer and
the comparatively short exercise stages employed in this investigation may have contributed to
the underestimation of energy expenditure by the SenseWear® Pro 2 Armband.
5.4. TOTAL ENERGY EXPENDITURE
5.4.1. Cycle Ergometer
The SenseWear® Pro 2 Armband significantly underestimated total energy expenditure
compared to the respiratory metabolic system during the cycle ergometer protocol (i.e. warm up,
stage 1, stage 2, cool down) in adolescent females and males and the combined female and male
sample. The SenseWear® Pro 2 Armband significantly underestimated total energy expenditure
by 52% for females, 43% for males and 47% for the combined group. Intraclass correlations
relating total energy expenditure from the two devices for the cycle ergometer exercise were low
(0.138-0.163) for females, males, and females and males combined. These low correlations are
consistent with the poor agreement between measuring devices for total energy expenditure as
indicated in the Bland-Altman plots of cycle ergometer data for adolescent females, males, and
the combined sample. These plots indicated that the prediction error was highest in individuals
who expended 30 total kcals during the cycle ergometer trial.
The findings in this investigation are consistent with a study by Jakicic et al. where the
SenseWear® Pro 2 Armband underestimated total energy expenditure by 29% during a 20 minute
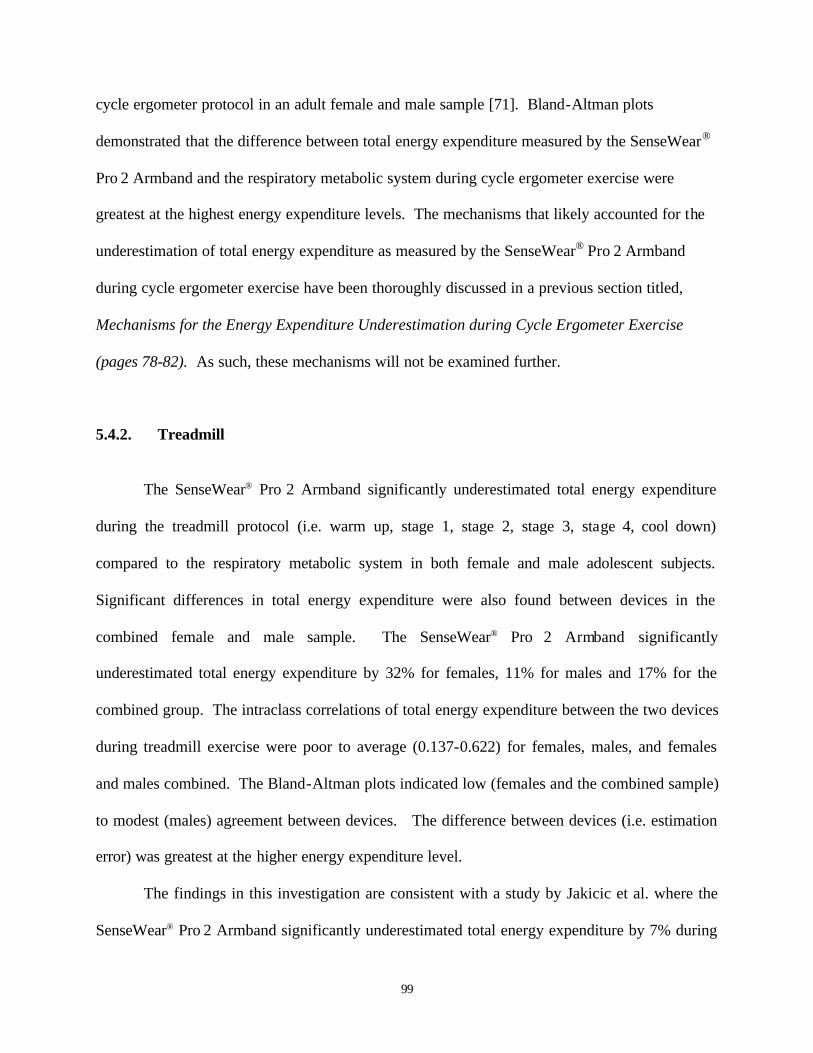
99
cycle ergometer protocol in an adult female and male sample [71]. Bland-Altman plots
demonstrated that the difference between total energy expenditure measured by the SenseWear®
Pro 2 Armband and the respiratory metabolic system during cycle ergometer exercise were
greatest at the highest energy expenditure levels. The mechanisms that likely accounted for the
underestimation of total energy expenditure as measured by the SenseWear® Pro 2 Armband
during cycle ergometer exercise have been thoroughly discussed in a previous section titled,
Mechanisms for the Energy Expenditure Underestimation during Cycle Ergometer Exercise
(pages 78-82). As such, these mechanisms will not be examined further.
5.4.2. Treadmill
The SenseWear® Pro 2 Armband significantly underestimated total energy expenditure
during the treadmill protocol (i.e. warm up, stage 1, stage 2, stage 3, stage 4, cool down)
compared to the respiratory metabolic system in both female and male adolescent subjects.
Significant differences in total energy expenditure were also found between devices in the
combined female and male sample. The SenseWear® Pro 2 Armband significantly
underestimated total energy expenditure by 32% for females, 11% for males and 17% for the
combined group. The intraclass correlations of total energy expenditure between the two devices
during treadmill exercise were poor to average (0.137-0.622) for females, males, and females
and males combined. The Bland-Altman plots indicated low (females and the combined sample)
to modest (males) agreement between devices. The difference between devices (i.e. estimation
error) was greatest at the higher energy expenditure level.
The findings in this investigation are consistent with a study by Jakicic et al. where the
SenseWear® Pro 2 Armband significantly underestimated total energy expenditure by 7% during
100
a 30 minute treadmill protocol in an adult female and male sample [71]. Similar to this
investigation, the Bland-Altman plots displayed a greater magnitude of difference for total
energy expenditure between the two devices as energy expenditure increased. The mechanisms
that accounted for the underestimation of total energy expenditure as measured by the
SenseWear® Pro 2 Armband during treadmill exercise have been thoroughly discussed in a
previous sections titled Mechanisms for the Energy Expenditure Underestimation during Level
Treadmill Walking (pages 85-88) and Mechanisms for the Energy Expenditure Underestimation
during Graded Treadmill Walking (pages 89-92). As such, these mechanisms will not be
examined further.
5.5. RESTING ENERGY EXPENDITURE
The validity of SenseWear® Pro 2 Armband to estimate resting energy expenditure varied
somewhat depending on whether the measures were taken prior to the cycle or treadmill trials.
In female subjects, measures of resting energy expenditure were significant lower from the
SenseWear® Pro 2 Armband than from the respiratory metabolic system prior to the cycle
ergometer. Prior to the treadmill exercise trial measures of resting energy expenditure were not
significantly different between devices for adolescent female subjects. On average, the two
resting energy expenditure trials differed by 17% (prior to the cycle ergometer) and by 7% (prior
to the treadmill).
In male subjects, there were no significant differences in measures of resting energy
expenditure between devices prior to both the cycle ergometer and treadmill exercise trials. On
average, the two resting energy expenditure trials differed by 7% (prior to the cycle ergometer)
and by 7% (prior to the treadmill).
101
When males and females were combined, there were no significant differences in
measures of resting energy expenditure between devices prior to both the cycle ergometer and
treadmill exercise trials. On average, the two resting energy expenditure trials differed by 8%
(prior to the cycle ergometer) and by 7% (prior to the treadmill).
Only one of the previously published adult studies used the SenseWear® Pro 2 Armband
to measure resting energy expenditure compared to indirect calorimetry. Fruin et al. concluded
that the SenseWear® Pro 2 Armband’s measures of resting energy expenditure were valid when
compared to indirect calorimetry based upon the observation that there were no significant
differences between devices [72].
The SenseWear® Pro 2 Armband’s algorithm’s to predict energy expenditure are
proprietary, but the formulas use both sensor data and personal characteristics of the individual
(weight, height, age, gender). It is unknown how the physiological data from the sensors factor
into the estimation of resting energy expenditure.
In general, the SenseWear® Pro 2 Armband’s estimates of resting energy expenditure
were valid when compared to measures from the respiratory metabolic system. In three of the
four resting energy expenditure trials (2 female, 2 male), there were no significant differences
between measuring devices. The difference in resting energy expenditure observed for females
prior to cycle ergometer cannot readily be explained. A one-way ANOVA was calculated to
determine if there was an effect of testing order that might influence these results. No order
effect was detected.
102
5.6. APPLICATION ISSUES
This was the first validation study conducted using the SenseWear® Pro 2 Armband to
estimated energy expenditure during cycling, walking, and jogging in adolescent female and
male subjects. The results of this study indicate that for cycle ergometer exercise, the
SenseWear® Pro 2 Armband significantly underestimates energy expenditure for both adolescent
males and females. This raises questions regarding the use of the armband with its reliance on
the two-axis accelerometer to accurately predict energy expenditure during cycling, a non-weight
bearing exercise.
For level treadmill walking, the SenseWear® Pro 2 Armband proved to be accurate in
estimating energy expenditure in adolescent males. For females, however significant differences
in level treadmill walking were found which might be associated with differences in walking
movement and body composition specific to adolescent females.
During graded treadmill walking/jogging, the SenseWear® Pro 2 Armband systematically
underestimated energy expenditure in adolescent females and males. If there is primary reliance
on the two-axis accelerometer to estimate the increased energy expenditure associated with
walking/jogging on an incline, then this technology may lead to lower energy expenditure
values. These findings impose limitations on the use of the SenseWear® Pro 2 Armband during
locomotor activities involving an inclined surface.
In general, the SenseWear® Pro 2 Armband was valid in estimating resting energy
expenditure in adolescent males and females. It appears that the SenseWear® Pro 2 Armband’s
use is limited to estimating resting energy expenditure in adolescents and to estimating physical
activity energy expenditure in males dur ing level walking. Further research and refinement on
the SenseWear® Pro 2 Armband’s algorithms are needed before the device can be used to
estimate energy expenditure in other modes of exercise and during a free- living setting. A valid
103
physical activity monitor, such as SenseWear® Pro 2 Armband, that is able to accurately measure
physical activity energy expenditure could be used to answer long standing questions about
physical activity patterns, energy imbalance, compliance with physical activity guidelines and
the dose-response relation between activity and health.
5.7. CONCLUSION
The result of this investigation indicate that the SenseWear® Pro 2 Armband was not a
valid instrument to measure energy expenditure of healthy adolescent females and males dur ing
most of the cycling and walking/jogging exercise conditions that were examined. The
SenseWear® Pro 2 Armband significantly underestimated energy expenditure during cycle
ergometer and graded treadmill walking in both adolescent female and male subjects. For level
treadmill walking, the SenseWear® Pro 2 Armband was accurate in estimating energy
expenditure in adolescent males, but not females. However, when the error in energy
expenditure estimations from the SenseWear® Pro 2 Armband are compared to error estimations
of triaxial accelerometers, in general the error is reduced. Triaxial accelerometer estimates of
energy expenditure during level walking typically overestimate by 12-49%, during walking up
an incline they underestimate by 8-21% and during cycling they underestimate by 53-68%
compared to indirect calorimetry [72, 74, 85]. Error estimations from the SenseWear® Pro 2
Armband in this study ranged during level treadmill walking from 6-21%, during
walking/jogging on an incline from 19-34%, and during cycling from 46-53% when compared to
the respiratory metabolic system.
This was the first study to examine the accuracy of the SenseWear® Pro 2 Armband to
measure energy expenditure in adolescent females and males during various physical activities.
104
The present findings suggest that the possible mechanisms underlying the underestimation of
energy expenditure are complex but may include: the use of generalized exercise algorithms to
predict all types of physical activity; the disproportionate reliance on the two-axis accelerometer
during non-weight bearing and graded exercises; the delay in detecting body heat transfer to the
skin; and the inability to account for variability in walking gait, lean body mass and fat mass.
All of these factors impact the accuracy of the SenseWear® Pro 2 Armband to accurately measure
energy expenditure. These findings are an important first step in validating SenseWear® Pro 2
Armband technology in adolescents.
5.8. LIMITATIONS
• In the present investigation there were several methodological limitations that need to be
considered.
o Only cycling, walking and jogging exercise modes were tested. Future studies
could examine these as well as many other modes of physical activity typical of
adolescents.
o The exercise stages were four minutes in duration. Since the body heat transfer is
delayed and the SenseWear® Pro 2 Armband heat sensors work better in protocols
lasting longer than eight minutes, various exercise durations could be examined.
o At the recommendation of the manufacturer, BodyMedia, the SenseWear® Pro 2
Armband was placed on the upper right arm of the subject 30 minutes prior to the
start of the study protocol to allow the armband to adjus t to body temperature. In
most cases, the 30-minute adjustment period was followed. However, due to
unforeseen methodological circumstances, the armband adjustment time was
longer in a few subjects but never exceeded 35 minutes. It could not be
105
determined if this variability in the temperature adjustment period influenced the
measures of resting energy expenditure, creating measurement bias. In future
studies, a standardized adjustment period should be implemented in the protocol.
o The fourth minute of each exercise stage was used as the kcal.min-1 value in
statistical analysis to represent energy expenditure from the entire exercise stage.
This fourth minute value was used, as it was expected that a steady physiological
response, if present would have occurred at this time point. However, this fourth
minute kcal.min-1 response may not have been the most representative response
for all subjects. Other calculations that could be used are averaging the third and
fourth minute responses.
5.9. RECOMMENDATIONS FOR FUTURE RESEARCH
Based on the findings of this investigation, future research on the validation of the SenseWear®
Pro 2 Armband to measure energy expenditure could consider the following:
• The present investigation used the most current available algorithms (generalized
algorithms) for the SenseWear® Pro 2 Armband. Activity-specific algorithms, as they
become available for use in adolescents, could be evaluated to determine if there is an
improvement in accuracy of energy expenditure estimates.
• The SenseWear® Pro 2 Armband algorithms for estimating resting and physical activity
energy expenditures were developed for adult subjects and prior to this investigation,
have been exclusively tested in adult subjects. Algorithms based on adolescent energy
expenditure data, may provide more accurate energy expenditure estimations.
106
• This investigation was conducted on healthy normal weight adolescents. It is unclear
whether similar results would be found in children/adolescents of different ages, body
weights and body composition.
• The SenseWear® Pro 2 Armband was developed to measure energy expenditure in the
free- living environment. It would be interesting to compare total energy expenditure
from the armband to energy expenditure derived using doubly labeled water as the
criterion measure of energy expenditure in free living.
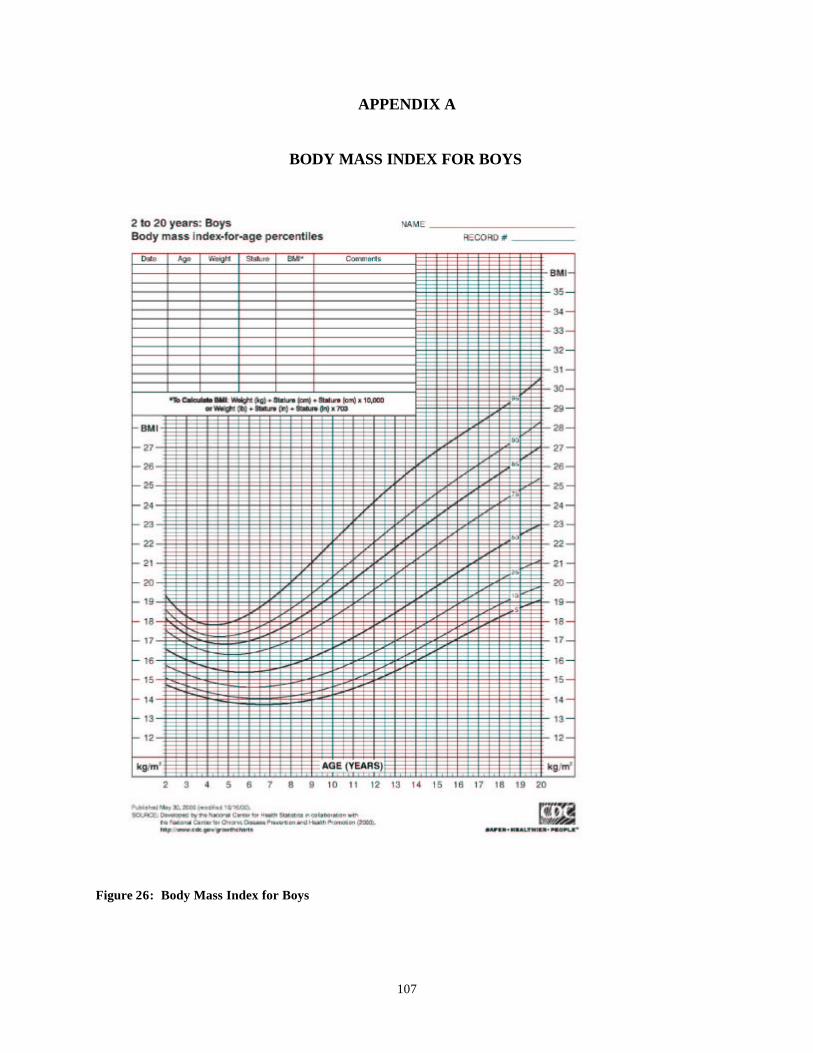
107
APPENDIX A
BODY MASS INDEX FOR BOYS
Figure 26: Body Mass Index for Boys
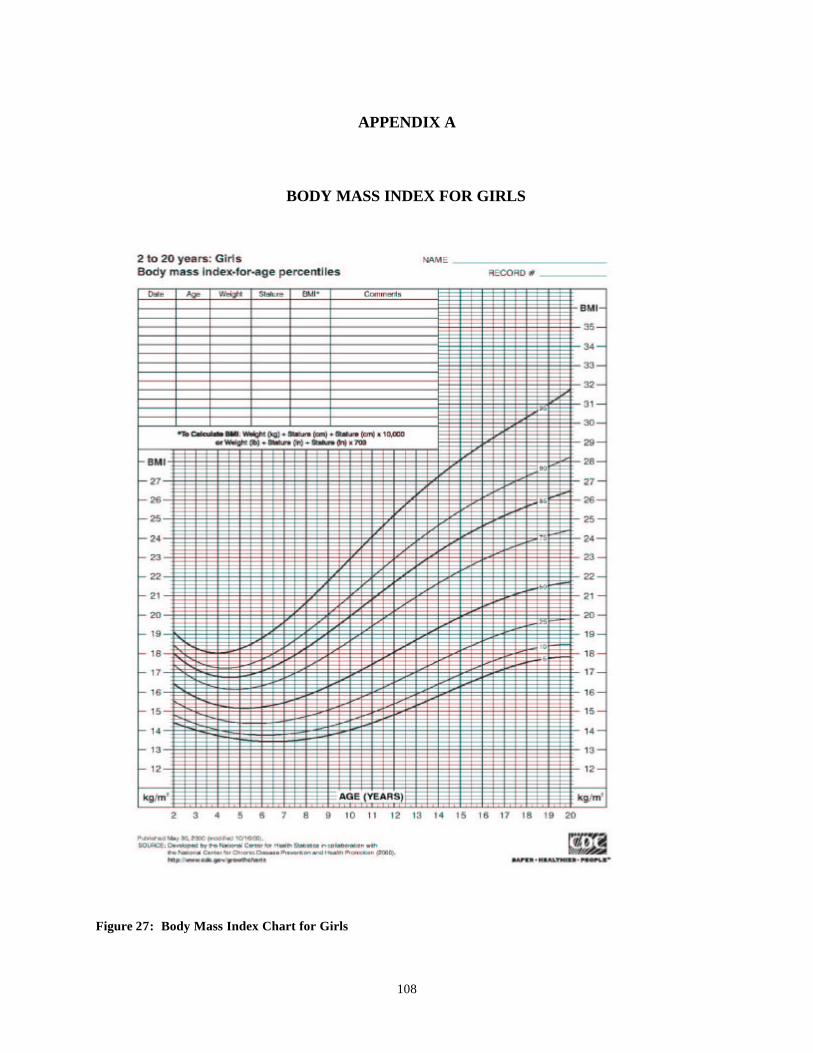
108
APPENDIX A
BODY MASS INDEX FOR GIRLS
Figure 27: Body Mass Index Chart for Girls
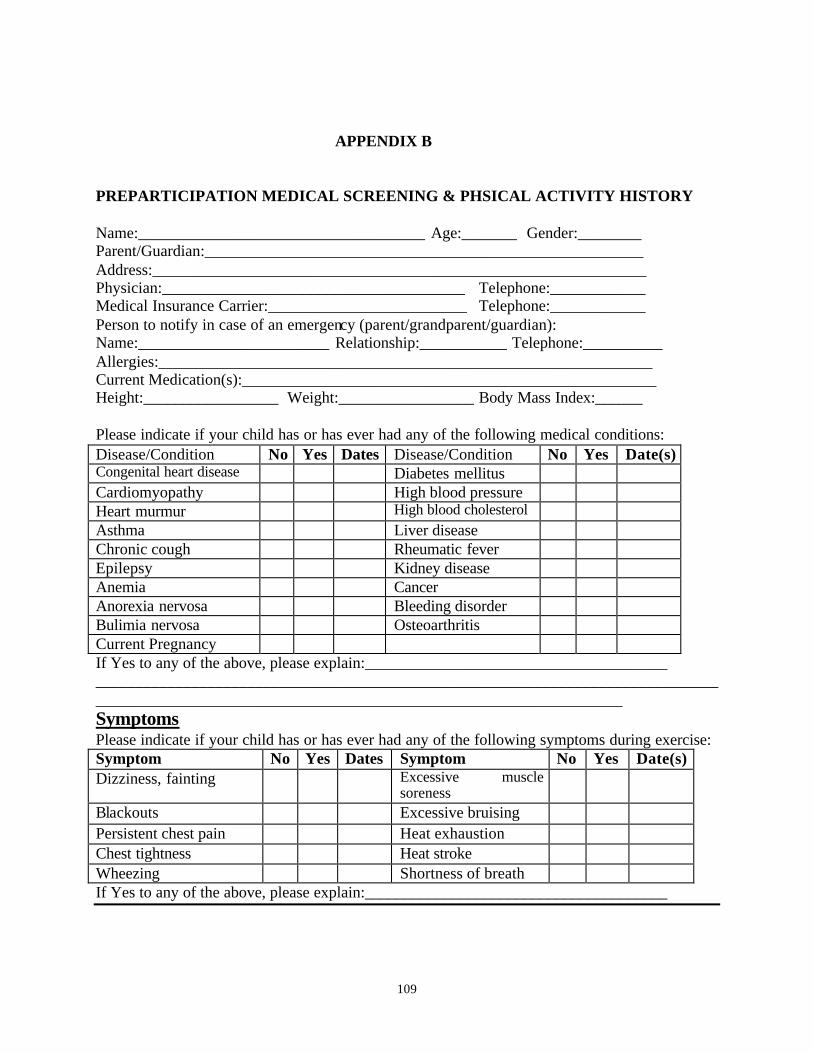
109
APPENDIX B
PREPARTICIPATION MEDICAL SCREENING & PHSICAL ACTIVITY HISTORY Name:____________________________________ Age:_______ Gender:________ Parent/Guardian:_______________________________________________________ Address:______________________________________________________________ Physician:______________________________________ Telephone:____________ Medical Insurance Carrier:_________________________ Telephone:____________ Person to notify in case of an emergency (parent/grandparent/guardian): Name:________________________ Relationship:___________ Telephone:__________ Allergies:______________________________________________________________ Current Medication(s):____________________________________________________ Height:_________________ Weight:_________________ Body Mass Index:______ Please indicate if your child has or has ever had any of the following medical conditions: Disease/Condition No Yes Dates Disease/Condition No Yes Date(s) Congenital heart disease Diabetes mellitus Cardiomyopathy High blood pressure Heart murmur High blood cholesterol Asthma Liver disease Chronic cough Rheumatic fever Epilepsy Kidney disease Anemia Cancer Anorexia nervosa Bleeding disorder Bulimia nervosa Osteoarthritis Current Pregnancy If Yes to any of the above, please explain:______________________________________ ________________________________________________________________________________________________________________________________________________ Symptoms Please indicate if your child has or has ever had any of the following symptoms during exercise: Symptom No Yes Dates Symptom No Yes Date(s) Dizziness, fainting Excessive muscle
soreness
Blackouts Excessive bruising Persistent chest pain Heat exhaustion Chest tightness Heat stroke Wheezing Shortness of breath If Yes to any of the above, please explain:______________________________________
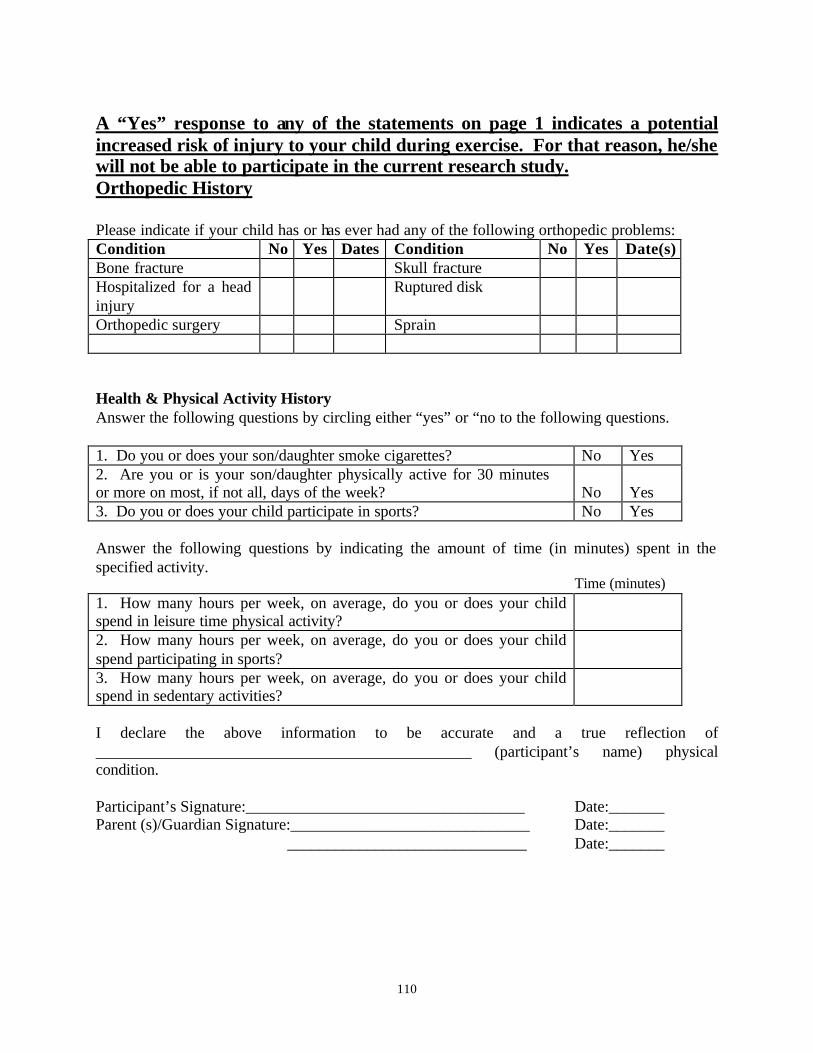
110
A “Yes” response to any of the statements on page 1 indicates a potential increased risk of injury to your child during exercise. For that reason, he/she will not be able to participate in the current research study. Orthopedic History Please indicate if your child has or has ever had any of the following orthopedic problems: Condition No Yes Dates Condition No Yes Date(s) Bone fracture Skull fracture Hospitalized for a head injury
Ruptured disk
Orthopedic surgery Sprain Health & Physical Activity History Answer the following questions by circling either “yes” or “no to the following questions. 1. Do you or does your son/daughter smoke cigarettes? No Yes 2. Are you or is your son/daughter physically active for 30 minutes or more on most, if not all, days of the week?
No
Yes
3. Do you or does your child participate in sports? No Yes Answer the following questions by indicating the amount of time (in minutes) spent in the specified activity. Time (minutes) 1. How many hours per week, on average, do you or does your child spend in leisure time physical activity?
2. How many hours per week, on average, do you or does your child spend participating in sports?
3. How many hours per week, on average, do you or does your child spend in sedentary activities?
I declare the above information to be accurate and a true reflection of _______________________________________________ (participant’s name) physical condition. Participant’s Signature:___________________________________ Date:_______ Parent (s)/Guardian Signature:______________________________ Date:_______ ______________________________ Date:_______
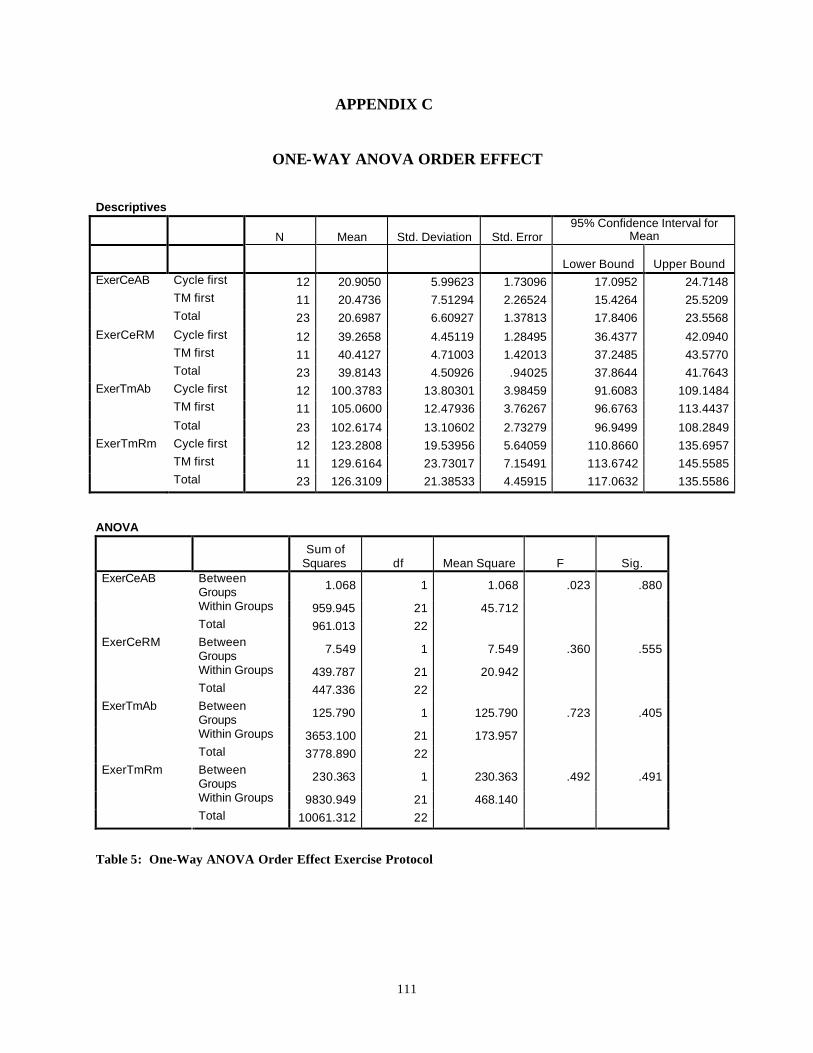
111
APPENDIX C
ONE-WAY ANOVA ORDER EFFECT
Descriptives
N Mean Std. Deviation Std. Error 95% Confidence Interval for
Mean
Lower Bound Upper Bound ExerCeAB Cycle first 12 20.9050 5.99623 1.73096 17.0952 24.7148 TM first 11 20.4736 7.51294 2.26524 15.4264 25.5209 Total 23 20.6987 6.60927 1.37813 17.8406 23.5568 ExerCeRM Cycle first 12 39.2658 4.45119 1.28495 36.4377 42.0940 TM first 11 40.4127 4.71003 1.42013 37.2485 43.5770 Total 23 39.8143 4.50926 .94025 37.8644 41.7643 ExerTmAb Cycle first 12 100.3783 13.80301 3.98459 91.6083 109.1484 TM first 11 105.0600 12.47936 3.76267 96.6763 113.4437 Total 23 102.6174 13.10602 2.73279 96.9499 108.2849 ExerTmRm Cycle first 12 123.2808 19.53956 5.64059 110.8660 135.6957 TM first 11 129.6164 23.73017 7.15491 113.6742 145.5585 Total 23 126.3109 21.38533 4.45915 117.0632 135.5586 ANOVA
Sum of
Squares df Mean Square F Sig. Between Groups 1.068 1 1.068 .023 .880
Within Groups 959.945 21 45.712
ExerCeAB
Total 961.013 22 Between Groups 7.549 1 7.549 .360 .555
Within Groups 439.787 21 20.942
ExerCeRM
Total 447.336 22 Between Groups 125.790 1 125.790 .723 .405
Within Groups 3653.100 21 173.957
ExerTmAb
Total 3778.890 22 Between Groups 230.363 1 230.363 .492 .491
Within Groups 9830.949 21 468.140
ExerTmRm
Total 10061.312 22
Table 5: One-Way ANOVA Order Effect Exercise Protocol
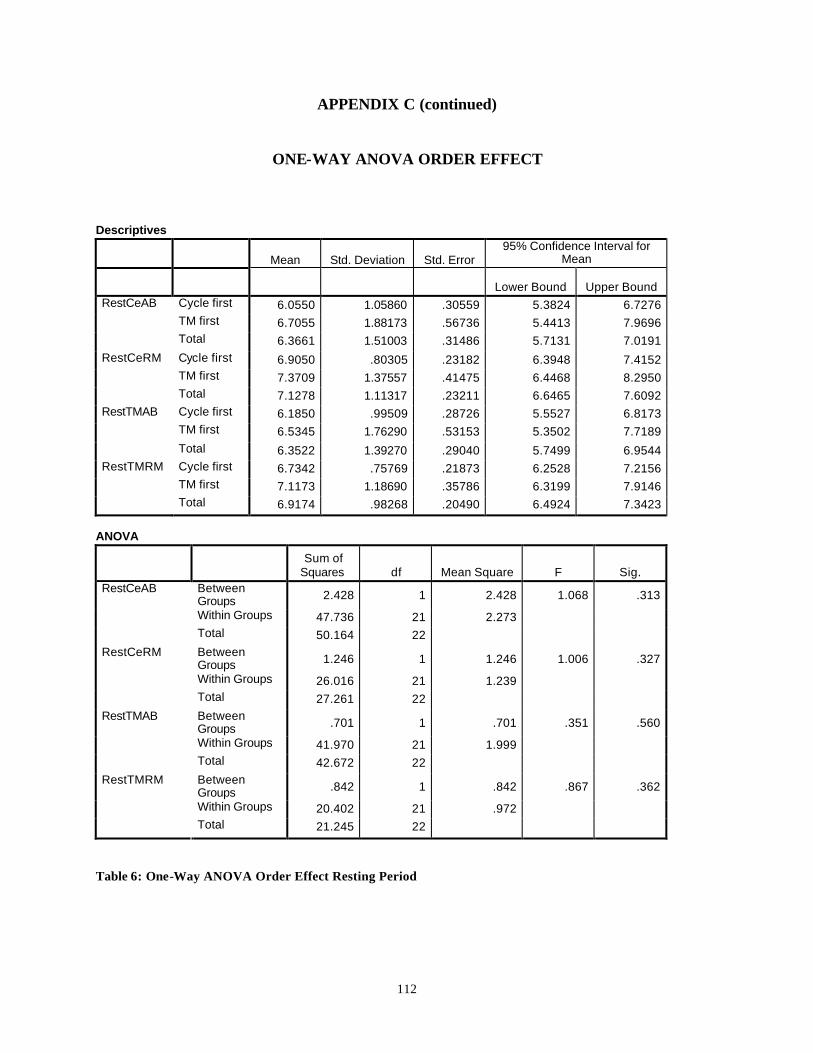
112
APPENDIX C (continued)
ONE-WAY ANOVA ORDER EFFECT
Descriptives
Mean Std. Deviation Std. Error 95% Confidence Interval for
Mean
Lower Bound Upper Bound RestCeAB Cycle first 6.0550 1.05860 .30559 5.3824 6.7276 TM first 6.7055 1.88173 .56736 5.4413 7.9696 Total 6.3661 1.51003 .31486 5.7131 7.0191 RestCeRM Cycle first 6.9050 .80305 .23182 6.3948 7.4152 TM first 7.3709 1.37557 .41475 6.4468 8.2950 Total 7.1278 1.11317 .23211 6.6465 7.6092 RestTMAB Cycle first 6.1850 .99509 .28726 5.5527 6.8173 TM first 6.5345 1.76290 .53153 5.3502 7.7189 Total 6.3522 1.39270 .29040 5.7499 6.9544 RestTMRM Cycle first 6.7342 .75769 .21873 6.2528 7.2156 TM first 7.1173 1.18690 .35786 6.3199 7.9146 Total 6.9174 .98268 .20490 6.4924 7.3423
ANOVA
Sum of
Squares df Mean Square F Sig. Between Groups 2.428 1 2.428 1.068 .313
Within Groups 47.736 21 2.273
RestCeAB
Total 50.164 22 Between Groups 1.246 1 1.246 1.006 .327
Within Groups 26.016 21 1.239
RestCeRM
Total 27.261 22 Between Groups .701 1 .701 .351 .560
Within Groups 41.970 21 1.999
RestTMAB
Total 42.672 22 Between Groups .842 1 .842 .867 .362
Within Groups 20.402 21 .972
RestTMRM
Total 21.245 22
Table 6: One-Way ANOVA Order Effect Resting Period
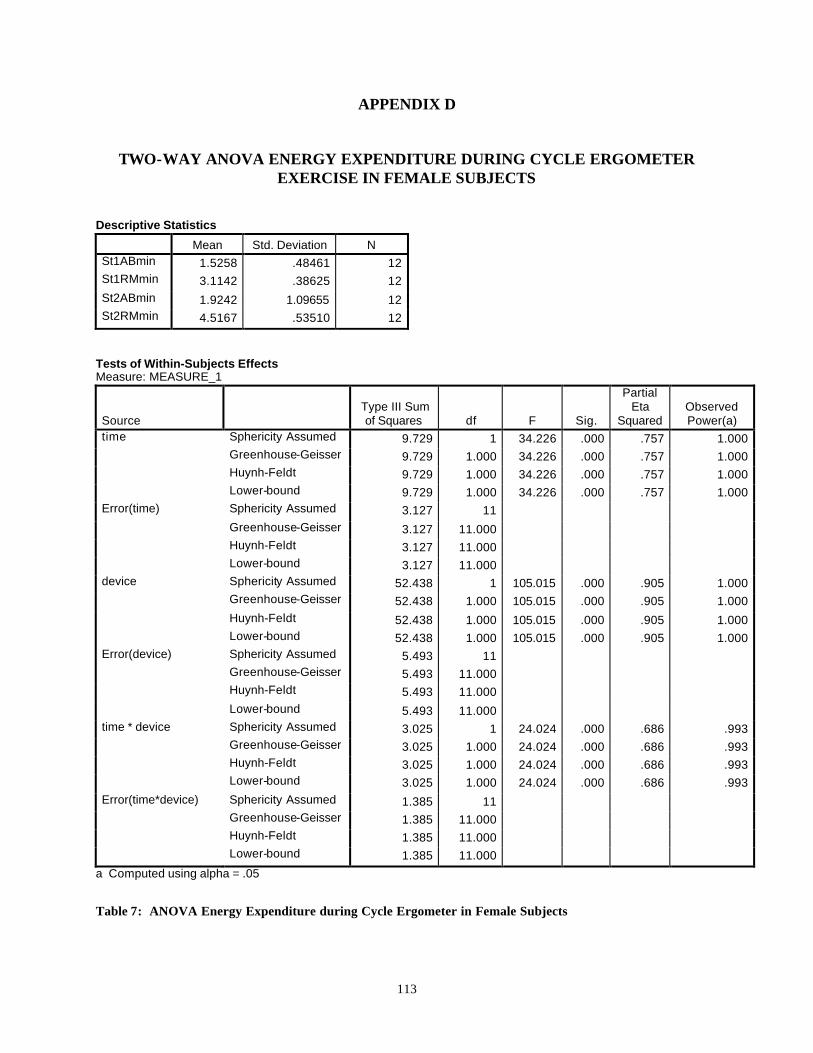
113
APPENDIX D
TWO-WAY ANOVA ENERGY EXPENDITURE DURING CYCLE ERGOMETER EXERCISE IN FEMALE SUBJECTS
Descriptive Statistics
Mean Std. Deviation N St1ABmin 1.5258 .48461 12 St1RMmin 3.1142 .38625 12 St2ABmin 1.9242 1.09655 12 St2RMmin 4.5167 .53510 12
Tests of Within-Subjects Effects Measure: MEASURE_1
Source Type III Sum of Squares df F Sig.
Partial Eta
Squared Observed Power(a)
time Sphericity Assumed 9.729 1 34.226 .000 .757 1.000 Greenhouse-Geisser 9.729 1.000 34.226 .000 .757 1.000 Huynh-Feldt 9.729 1.000 34.226 .000 .757 1.000 Lower-bound 9.729 1.000 34.226 .000 .757 1.000 Error(time) Sphericity Assumed 3.127 11 Greenhouse-Geisser 3.127 11.000 Huynh-Feldt 3.127 11.000 Lower-bound 3.127 11.000 device Sphericity Assumed 52.438 1 105.015 .000 .905 1.000 Greenhouse-Geisser 52.438 1.000 105.015 .000 .905 1.000 Huynh-Feldt 52.438 1.000 105.015 .000 .905 1.000 Lower-bound 52.438 1.000 105.015 .000 .905 1.000 Error(device) Sphericity Assumed 5.493 11 Greenhouse-Geisser 5.493 11.000 Huynh-Feldt 5.493 11.000 Lower-bound 5.493 11.000 time * device Sphericity Assumed 3.025 1 24.024 .000 .686 .993 Greenhouse-Geisser 3.025 1.000 24.024 .000 .686 .993 Huynh-Feldt 3.025 1.000 24.024 .000 .686 .993 Lower-bound 3.025 1.000 24.024 .000 .686 .993 Error(time*device) Sphericity Assumed 1.385 11 Greenhouse-Geisser 1.385 11.000 Huynh-Feldt 1.385 11.000 Lower-bound 1.385 11.000
a Computed using alpha = .05
Table 7: ANOVA Energy Expenditure during Cycle Ergometer in Female Subjects
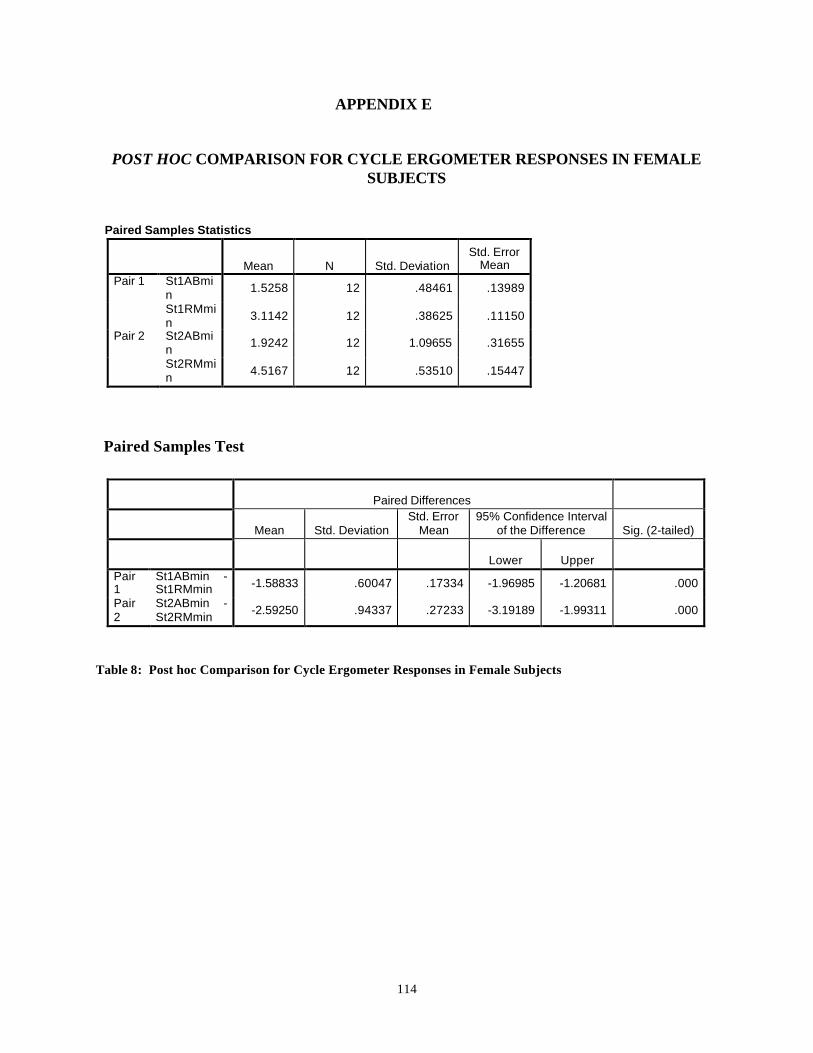
114
APPENDIX E
POST HOC COMPARISON FOR CYCLE ERGOMETER RESPONSES IN FEMALE
SUBJECTS Paired Samples Statistics
Mean N Std. Deviation Std. Error
Mean Pair 1 St1ABmi
n 1.5258 12 .48461 .13989
St1RMmin 3.1142 12 .38625 .11150
Pair 2 St2ABmin 1.9242 12 1.09655 .31655
St2RMmin 4.5167 12 .53510 .15447
Paired Samples Test
Table 8: Post hoc Comparison for Cycle Ergometer Responses in Female Subjects
Paired Differences
Mean Std. Deviation Std. Error
Mean 95% Confidence Interval
of the Difference Sig. (2-tailed)
Lower Upper Pair 1
St1ABmin - St1RMmin -1.58833 .60047 .17334 -1.96985 -1.20681 .000
Pair 2
St2ABmin - St2RMmin -2.59250 .94337 .27233 -3.19189 -1.99311 .000
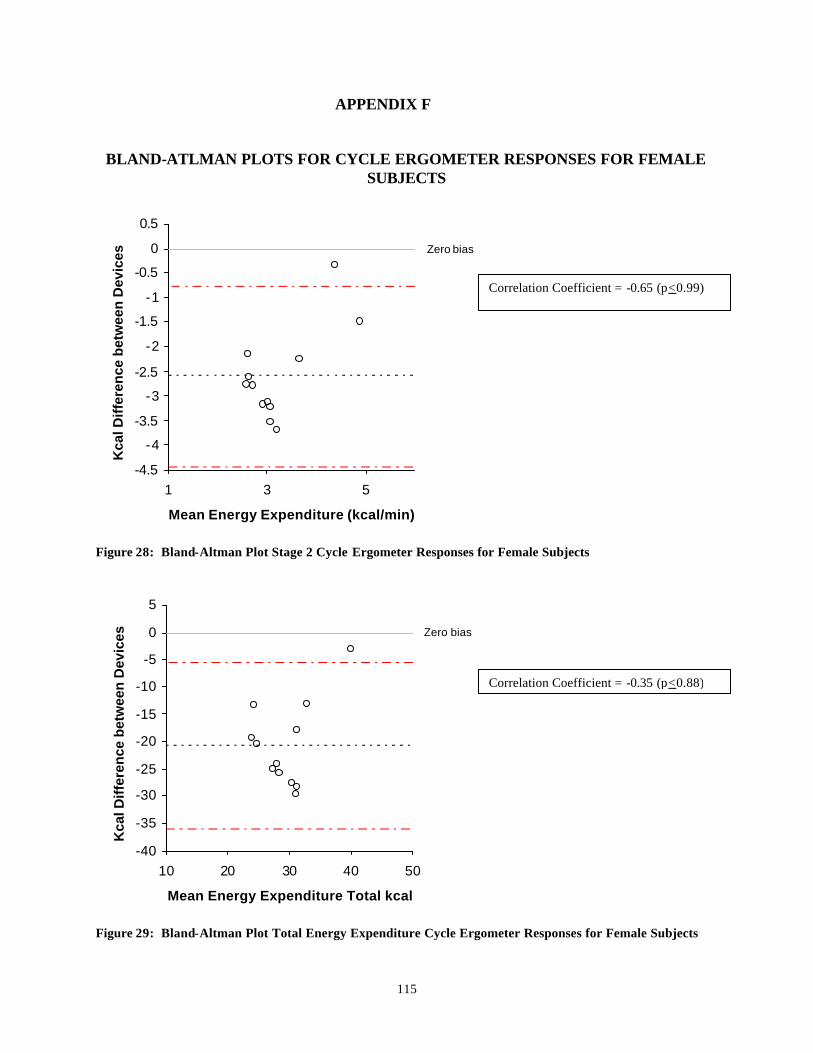
115
APPENDIX F
BLAND-ATLMAN PLOTS FOR CYCLE ERGOMETER RESPONSES FOR FEMALE
SUBJECTS
Zero bias
-4.5
-4
-3.5
-3
-2.5
-2
-1.5
-1
-0.5
0
0.5
1 3 5
Mean Energy Expenditure (kcal/min)
Kca
l Dif
fere
nce
bet
wee
n D
evic
es
Figure 28: Bland-Altman Plot Stage 2 Cycle Ergometer Responses for Female Subjects
Zero bias
-40
-35
-30
-25
-20
-15
-10
-5
0
5
10 20 30 40 50
Mean Energy Expenditure Total kcal
Kca
l Dif
fere
nce
bet
wee
n D
evic
es
Figure 29: Bland-Altman Plot Total Energy Expenditure Cycle Ergometer Responses for Female Subjects
Correlation Coefficient = -0.65 (p<0.99)
Correlation Coefficient = -0.35 (p<0.88)
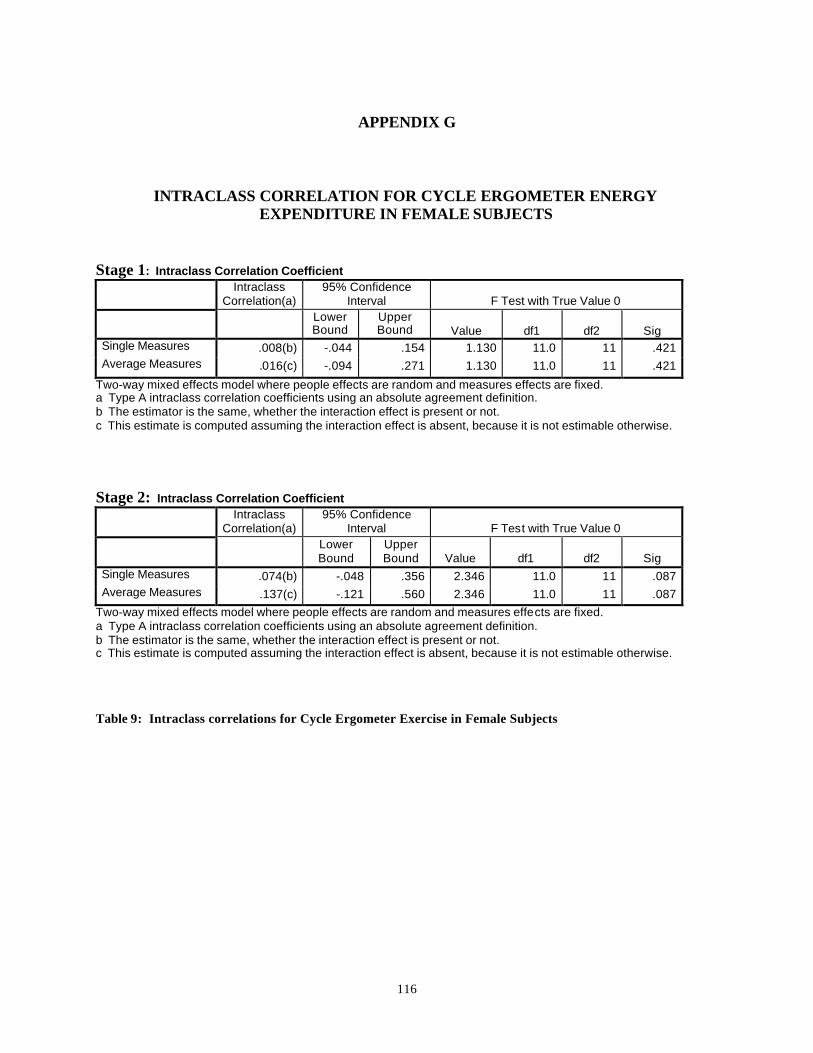
116
APPENDIX G
INTRACLASS CORRELATION FOR CYCLE ERGOMETER ENERGY
EXPENDITURE IN FEMALE SUBJECTS Stage 1: Intraclass Correlation Coefficient
Intraclass
Correlation(a) 95% Confidence
Interval F Test with True Value 0
Lower Bound
Upper Bound Value df1 df2 Sig
Single Measures .008(b) -.044 .154 1.130 11.0 11 .421 Average Measures .016(c) -.094 .271 1.130 11.0 11 .421
Two-way mixed effects model where people effects are random and measures effects are fixed. a Type A intraclass correlation coefficients using an absolute agreement definition. b The estimator is the same, whether the interaction effect is present or not. c This estimate is computed assuming the interaction effect is absent, because it is not estimable otherwise. Stage 2: Intraclass Correlation Coefficient
Intraclass
Correlation(a) 95% Confidence
Interval F Test with True Value 0
Lower Bound
Upper Bound Value df1 df2 Sig
Single Measures .074(b) -.048 .356 2.346 11.0 11 .087 Average Measures .137(c) -.121 .560 2.346 11.0 11 .087
Two-way mixed effects model where people effects are random and measures effects are fixed. a Type A intraclass correlation coefficients using an absolute agreement definition. b The estimator is the same, whether the interaction effect is present or not. c This estimate is computed assuming the interaction effect is absent, because it is not estimable otherwise.
Table 9: Intraclass correlations for Cycle Ergometer Exercise in Female Subjects
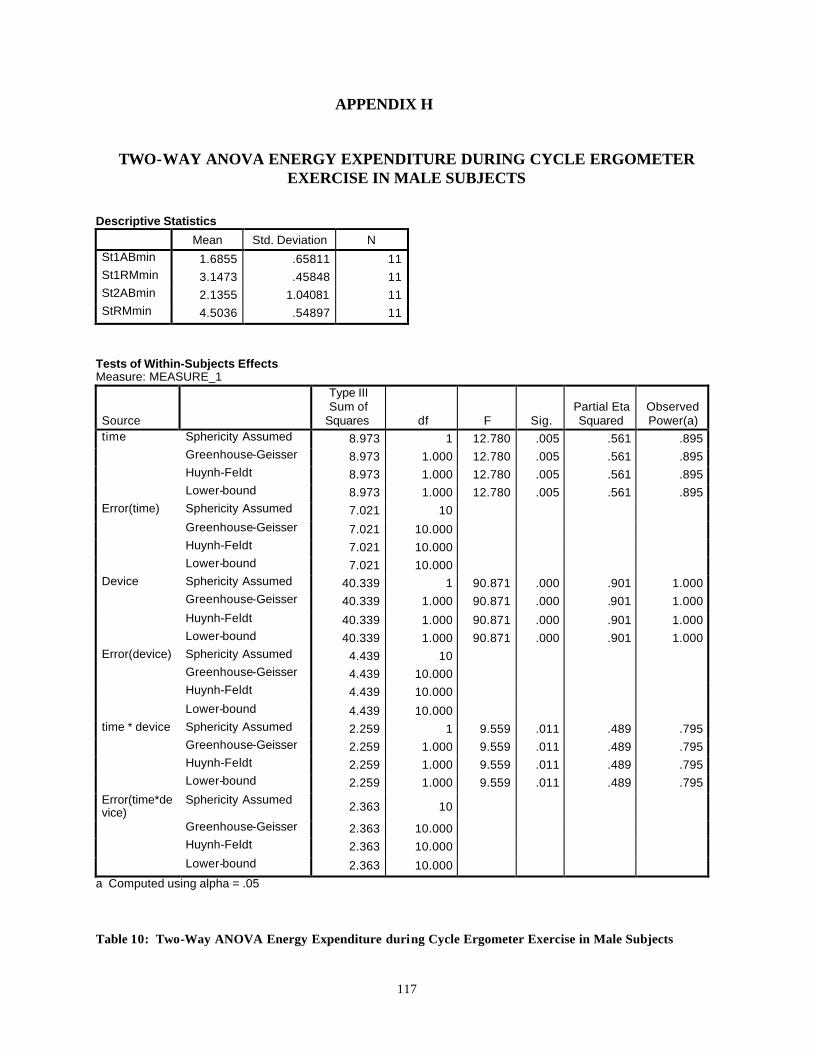
117
APPENDIX H
TWO-WAY ANOVA ENERGY EXPENDITURE DURING CYCLE ERGOMETER
EXERCISE IN MALE SUBJECTS Descriptive Statistics
Mean Std. Deviation N St1ABmin 1.6855 .65811 11 St1RMmin 3.1473 .45848 11 St2ABmin 2.1355 1.04081 11 StRMmin 4.5036 .54897 11
Tests of Within-Subjects Effects Measure: MEASURE_1
Source
Type III Sum of
Squares df F Sig. Partial Eta Squared
Observed Power(a)
time Sphericity Assumed 8.973 1 12.780 .005 .561 .895 Greenhouse-Geisser 8.973 1.000 12.780 .005 .561 .895 Huynh-Feldt 8.973 1.000 12.780 .005 .561 .895 Lower-bound 8.973 1.000 12.780 .005 .561 .895 Error(time) Sphericity Assumed 7.021 10 Greenhouse-Geisser 7.021 10.000 Huynh-Feldt 7.021 10.000 Lower-bound 7.021 10.000 Device Sphericity Assumed 40.339 1 90.871 .000 .901 1.000 Greenhouse-Geisser 40.339 1.000 90.871 .000 .901 1.000 Huynh-Feldt 40.339 1.000 90.871 .000 .901 1.000 Lower-bound 40.339 1.000 90.871 .000 .901 1.000 Error(device) Sphericity Assumed 4.439 10 Greenhouse-Geisser 4.439 10.000 Huynh-Feldt 4.439 10.000 Lower-bound 4.439 10.000 time * device Sphericity Assumed 2.259 1 9.559 .011 .489 .795 Greenhouse-Geisser 2.259 1.000 9.559 .011 .489 .795 Huynh-Feldt 2.259 1.000 9.559 .011 .489 .795 Lower-bound 2.259 1.000 9.559 .011 .489 .795 Error(time*device)
Sphericity Assumed 2.363 10
Greenhouse-Geisser 2.363 10.000 Huynh-Feldt 2.363 10.000 Lower-bound 2.363 10.000
a Computed using alpha = .05
Table 10: Two-Way ANOVA Energy Expenditure during Cycle Ergometer Exercise in Male Subjects
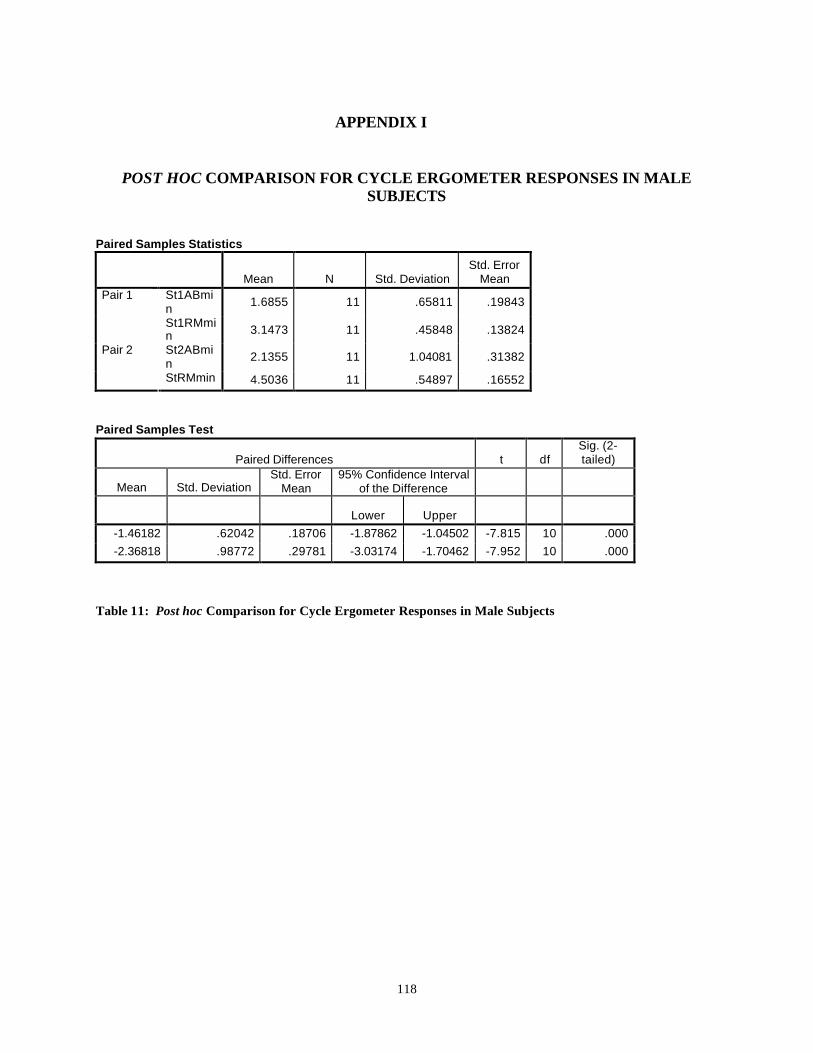
118
APPENDIX I
POST HOC COMPARISON FOR CYCLE ERGOMETER RESPONSES IN MALE SUBJECTS
Paired Samples Statistics
Mean N Std. Deviation Std. Error
Mean St1ABmin 1.6855 11 .65811 .19843 Pair 1
St1RMmin 3.1473 11 .45848 .13824
St2ABmin 2.1355 11 1.04081 .31382 Pair 2
StRMmin 4.5036 11 .54897 .16552 Paired Samples Test
Paired Differences t df Sig. (2-tailed)
Mean Std. Deviation Std. Error
Mean 95% Confidence Interval
of the Difference
Lower Upper -1.46182 .62042 .18706 -1.87862 -1.04502 -7.815 10 .000 -2.36818 .98772 .29781 -3.03174 -1.70462 -7.952 10 .000
Table 11: Post hoc Comparison for Cycle Ergometer Responses in Male Subjects
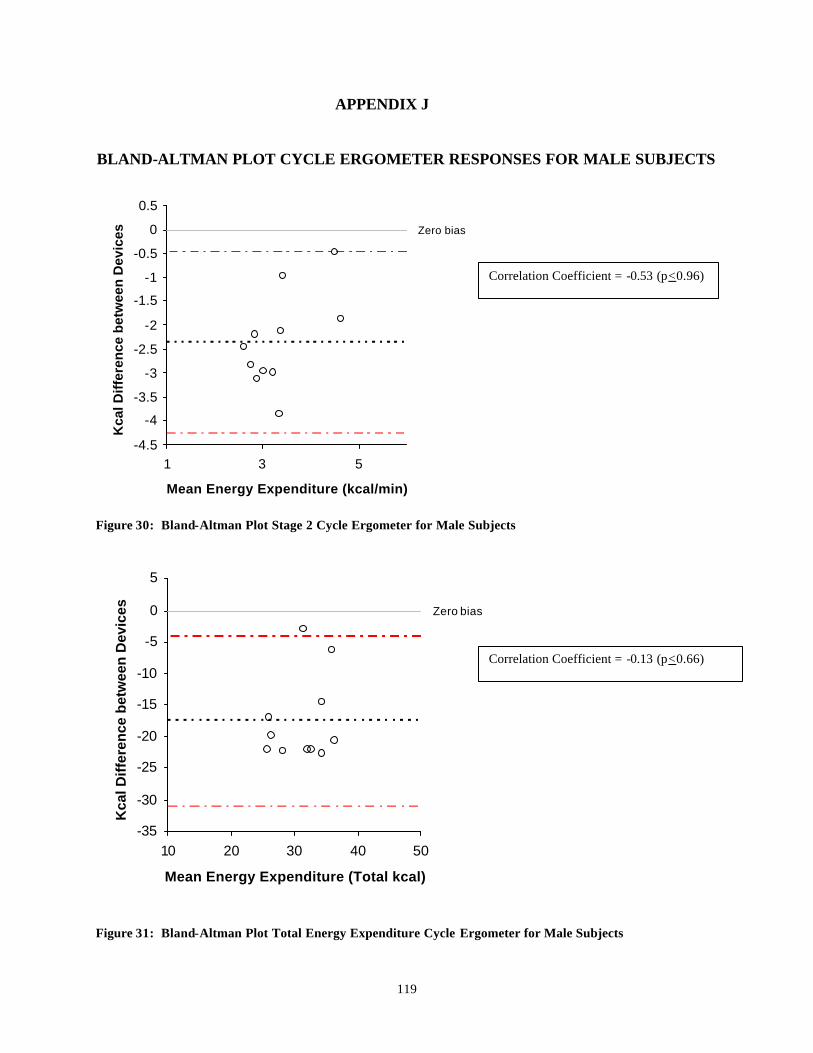
119
APPENDIX J
BLAND-ALTMAN PLOT CYCLE ERGOMETER RESPONSES FOR MALE SUBJECTS
Zero bias
-4.5
-4
-3.5
-3
-2.5
-2
-1.5
-1
-0.5
0
0.5
1 3 5
Mean Energy Expenditure (kcal/min)
Kca
l Dif
fere
nce
bet
wee
n D
evic
es
Figure 30: Bland-Altman Plot Stage 2 Cycle Ergometer for Male Subjects
Zero bias
-35
-30
-25
-20
-15
-10
-5
0
5
10 20 30 40 50
Mean Energy Expenditure (Total kcal)
Kca
l Dif
fere
nce
bet
wee
n D
evic
es
Figure 31: Bland-Altman Plot Total Energy Expenditure Cycle Ergometer for Male Subjects
Correlation Coefficient = -0.53 (p<0.96)
Correlation Coefficient = -0.13 (p<0.66)
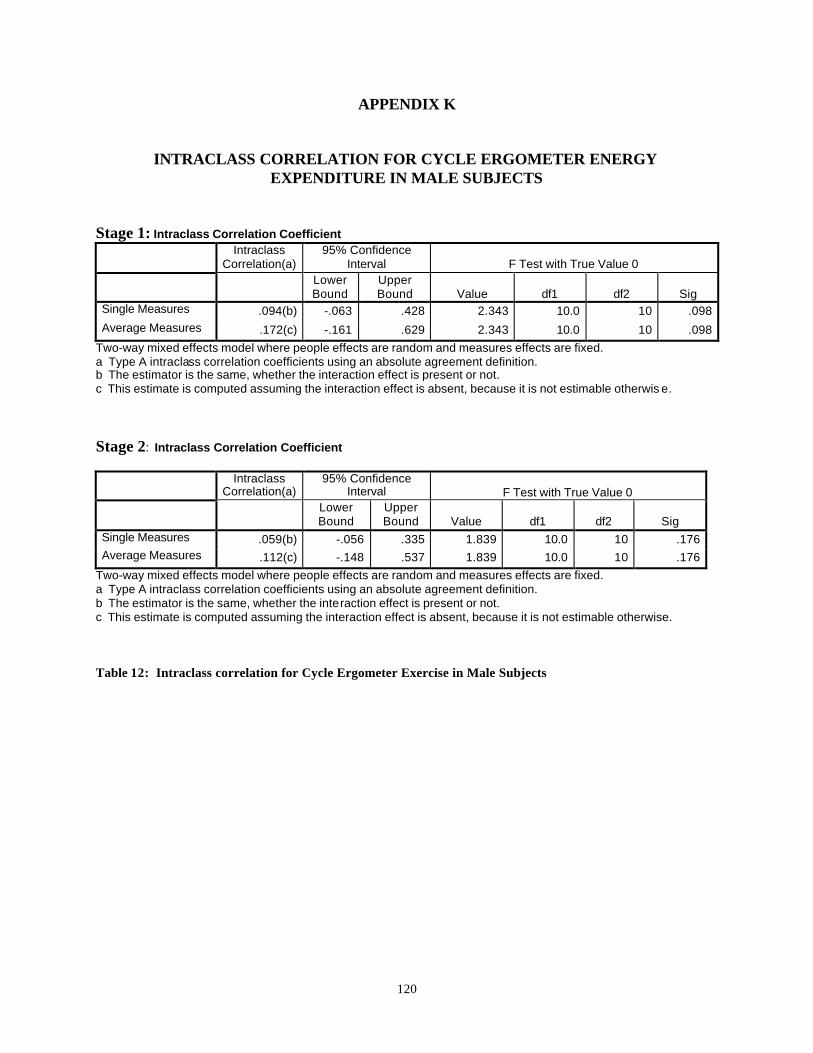
120
APPENDIX K
INTRACLASS CORRELATION FOR CYCLE ERGOMETER ENERGY EXPENDITURE IN MALE SUBJECTS
Stage 1: Intraclass Correlation Coefficient
Intraclass
Correlation(a) 95% Confidence
Interval F Test with True Value 0
Lower Bound
Upper Bound Value df1 df2 Sig
Single Measures .094(b) -.063 .428 2.343 10.0 10 .098 Average Measures .172(c) -.161 .629 2.343 10.0 10 .098
Two-way mixed effects model where people effects are random and measures effects are fixed. a Type A intraclass correlation coefficients using an absolute agreement definition. b The estimator is the same, whether the interaction effect is present or not. c This estimate is computed assuming the interaction effect is absent, because it is not estimable otherwis e. Stage 2: Intraclass Correlation Coefficient
Intraclass
Correlation(a) 95% Confidence
Interval F Test with True Value 0
Lower Bound
Upper Bound Value df1 df2 Sig
Single Measures .059(b) -.056 .335 1.839 10.0 10 .176 Average Measures .112(c) -.148 .537 1.839 10.0 10 .176
Two-way mixed effects model where people effects are random and measures effects are fixed. a Type A intraclass correlation coefficients using an absolute agreement definition. b The estimator is the same, whether the interaction effect is present or not. c This estimate is computed assuming the interaction effect is absent, because it is not estimable otherwise.
Table 12: Intraclass correlation for Cycle Ergometer Exercise in Male Subjects
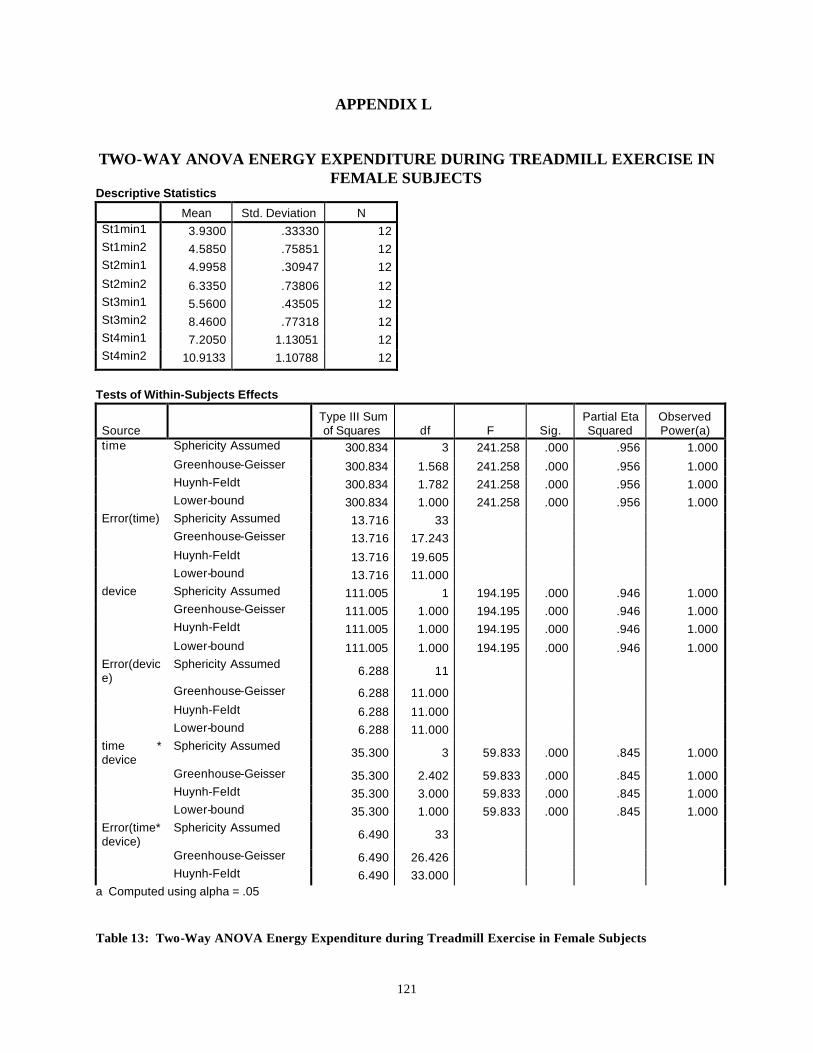
121
APPENDIX L
TWO-WAY ANOVA ENERGY EXPENDITURE DURING TREADMILL EXERCISE IN FEMALE SUBJECTS
Descriptive Statistics
Mean Std. Deviation N St1min1 3.9300 .33330 12 St1min2 4.5850 .75851 12 St2min1 4.9958 .30947 12 St2min2 6.3350 .73806 12 St3min1 5.5600 .43505 12 St3min2 8.4600 .77318 12 St4min1 7.2050 1.13051 12 St4min2 10.9133 1.10788 12
Tests of Within-Subjects Effects
Source Type III Sum of Squares df F Sig.
Partial Eta Squared
Observed Power(a)
time Sphericity Assumed 300.834 3 241.258 .000 .956 1.000 Greenhouse-Geisser 300.834 1.568 241.258 .000 .956 1.000 Huynh-Feldt 300.834 1.782 241.258 .000 .956 1.000 Lower-bound 300.834 1.000 241.258 .000 .956 1.000 Error(time) Sphericity Assumed 13.716 33 Greenhouse-Geisser 13.716 17.243 Huynh-Feldt 13.716 19.605 Lower-bound 13.716 11.000 device Sphericity Assumed 111.005 1 194.195 .000 .946 1.000 Greenhouse-Geisser 111.005 1.000 194.195 .000 .946 1.000 Huynh-Feldt 111.005 1.000 194.195 .000 .946 1.000 Lower-bound 111.005 1.000 194.195 .000 .946 1.000 Error(device)
Sphericity Assumed 6.288 11
Greenhouse-Geisser 6.288 11.000 Huynh-Feldt 6.288 11.000 Lower-bound 6.288 11.000 time * device
Sphericity Assumed 35.300 3 59.833 .000 .845 1.000
Greenhouse-Geisser 35.300 2.402 59.833 .000 .845 1.000 Huynh-Feldt 35.300 3.000 59.833 .000 .845 1.000 Lower-bound 35.300 1.000 59.833 .000 .845 1.000 Error(time*device)
Sphericity Assumed 6.490 33
Greenhouse-Geisser 6.490 26.426 Huynh-Feldt 6.490 33.000
a Computed using alpha = .05
Table 13: Two-Way ANOVA Energy Expenditure during Treadmill Exercise in Female Subjects
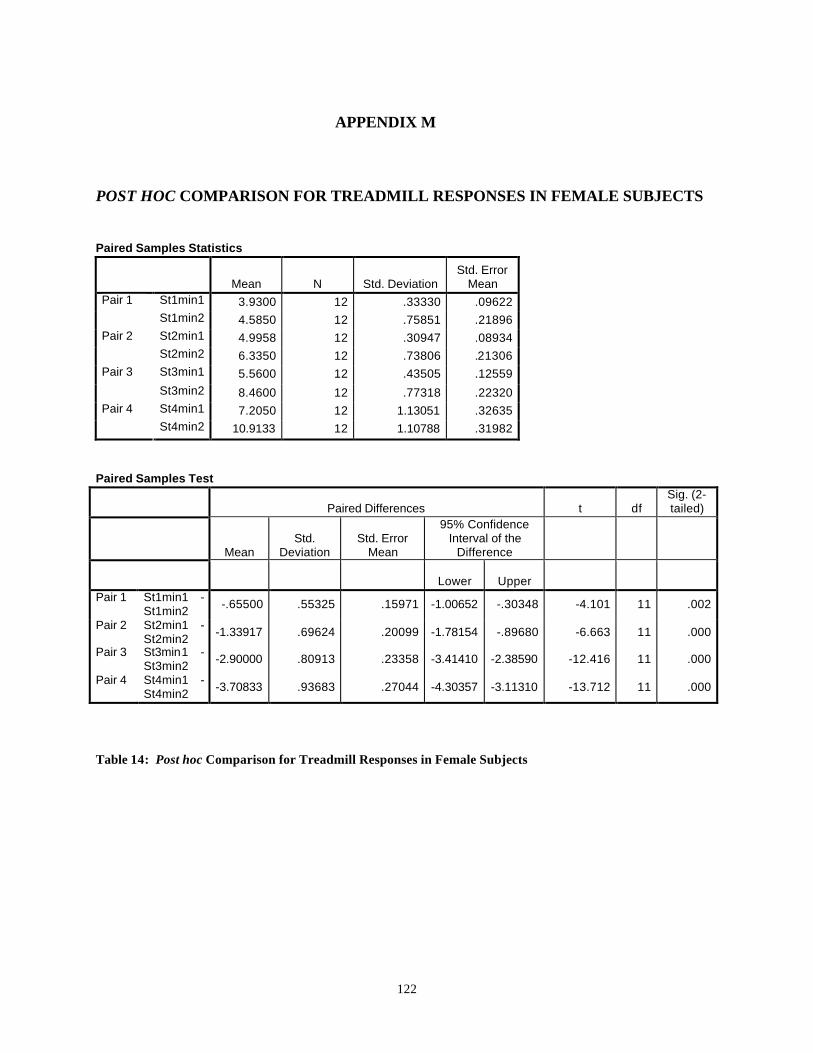
122
APPENDIX M
POST HOC COMPARISON FOR TREADMILL RESPONSES IN FEMALE SUBJECTS Paired Samples Statistics
Mean N Std. Deviation Std. Error
Mean St1min1 3.9300 12 .33330 .09622 Pair 1 St1min2 4.5850 12 .75851 .21896 St2min1 4.9958 12 .30947 .08934 Pair 2 St2min2 6.3350 12 .73806 .21306 St3min1 5.5600 12 .43505 .12559 Pair 3
St3min2 8.4600 12 .77318 .22320 St4min1 7.2050 12 1.13051 .32635 Pair 4 St4min2 10.9133 12 1.10788 .31982
Paired Samples Test
Paired Differences t df Sig. (2-tailed)
Mean Std.
Deviation Std. Error
Mean
95% Confidence Interval of the
Difference
Lower Upper Pair 1 St1min1 -
St1min2 -.65500 .55325 .15971 -1.00652 -.30348 -4.101 11 .002
Pair 2 St2min1 - St2min2 -1.33917 .69624 .20099 -1.78154 -.89680 -6.663 11 .000
Pair 3 St3min1 - St3min2 -2.90000 .80913 .23358 -3.41410 -2.38590 -12.416 11 .000
Pair 4 St4min1 - St4min2 -3.70833 .93683 .27044 -4.30357 -3.11310 -13.712 11 .000
Table 14: Post hoc Comparison for Treadmill Responses in Female Subjects
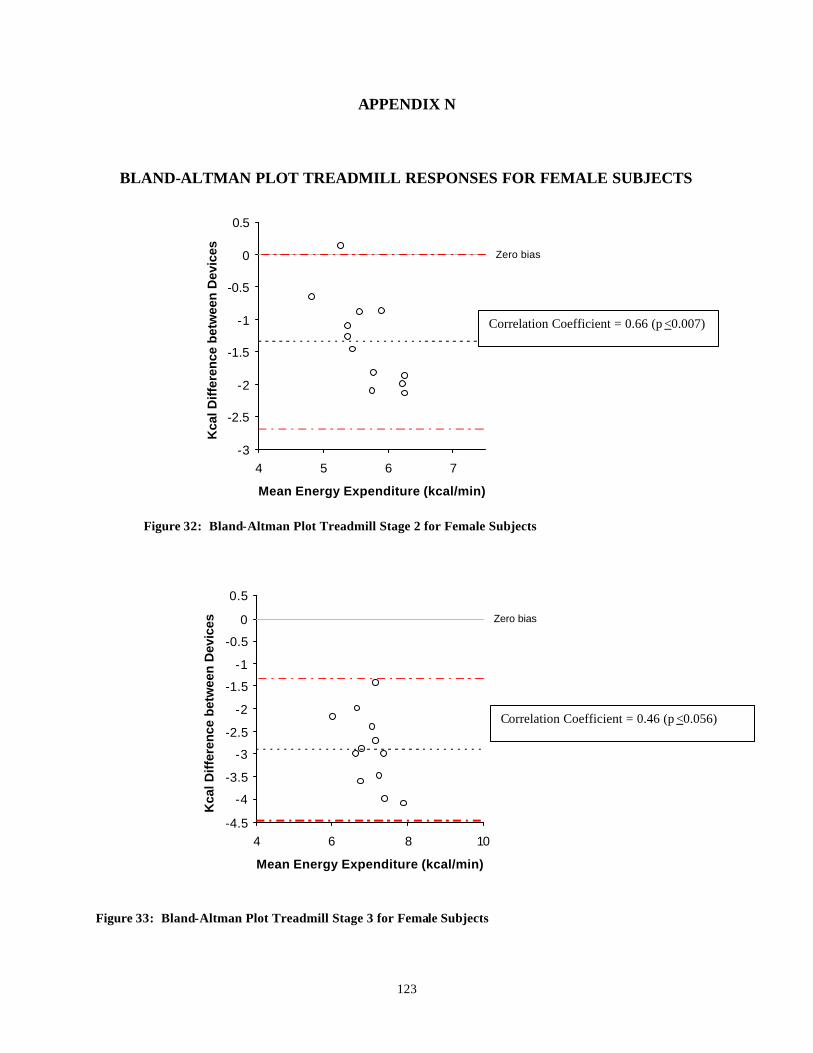
123
APPENDIX N
BLAND-ALTMAN PLOT TREADMILL RESPONSES FOR FEMALE SUBJECTS
Zero bias
-3
-2.5
-2
-1.5
-1
-0.5
0
0.5
4 5 6 7
Mean Energy Expenditure (kcal/min)
Kca
l Dif
fere
nce
bet
wee
n D
evic
es
Figure 32: Bland-Altman Plot Treadmill Stage 2 for Female Subjects
Zero bias
-4.5
-4
-3.5
-3
-2.5
-2
-1.5
-1
-0.5
0
0.5
4 6 8 10
Mean Energy Expenditure (kcal/min)
Kca
l Dif
fere
nce
bet
wee
n D
evic
es
Figure 33: Bland-Altman Plot Treadmill Stage 3 for Female Subjects
Correlation Coefficient = 0.66 (p <0.007)
Correlation Coefficient = 0.46 (p <0.056)
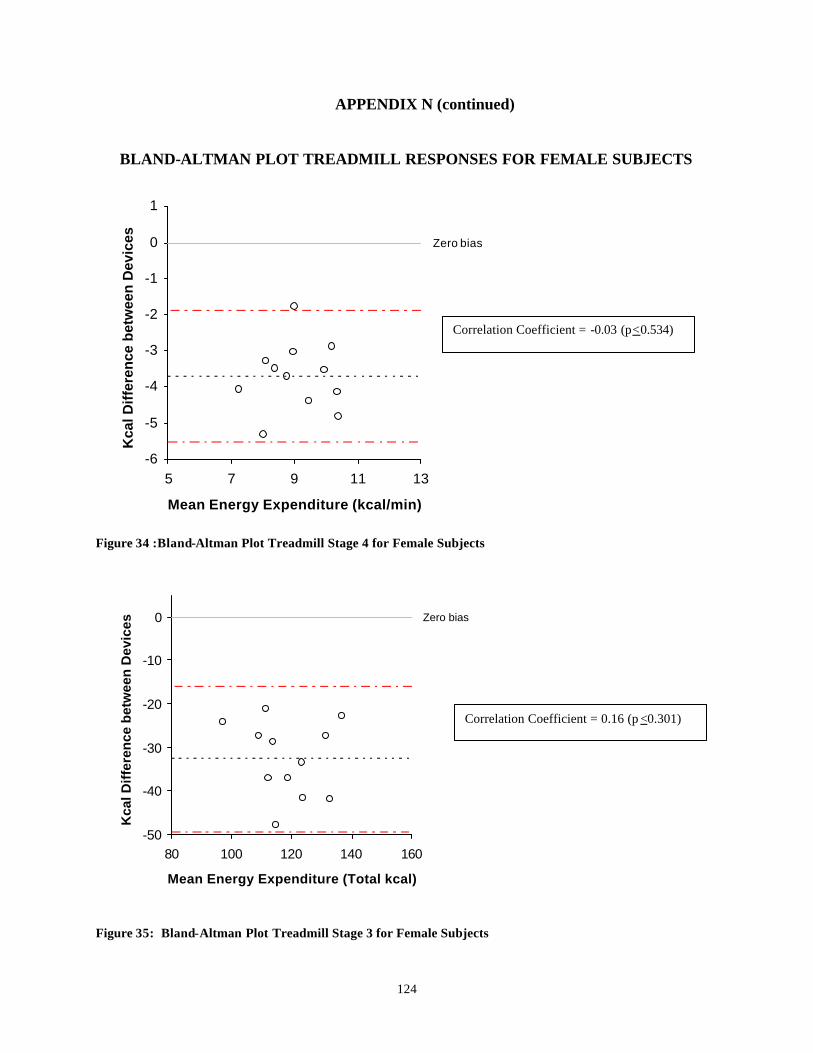
124
APPENDIX N (continued)
BLAND-ALTMAN PLOT TREADMILL RESPONSES FOR FEMALE SUBJECTS
Zero bias
-6
-5
-4
-3
-2
-1
0
1
5 7 9 11 13
Mean Energy Expenditure (kcal/min)
Kca
l Dif
fere
nce
bet
wee
n D
evic
es
Figure 34 :Bland-Altman Plot Treadmill Stage 4 for Female Subjects
Zero bias
-50
-40
-30
-20
-10
0
80 100 120 140 160
Mean Energy Expenditure (Total kcal)
Kca
l Dif
fere
nce
bet
wee
n D
evic
es
Figure 35: Bland-Altman Plot Treadmill Stage 3 for Female Subjects
Correlation Coefficient = -0.03 (p<0.534)
Correlation Coefficient = 0.16 (p <0.301)
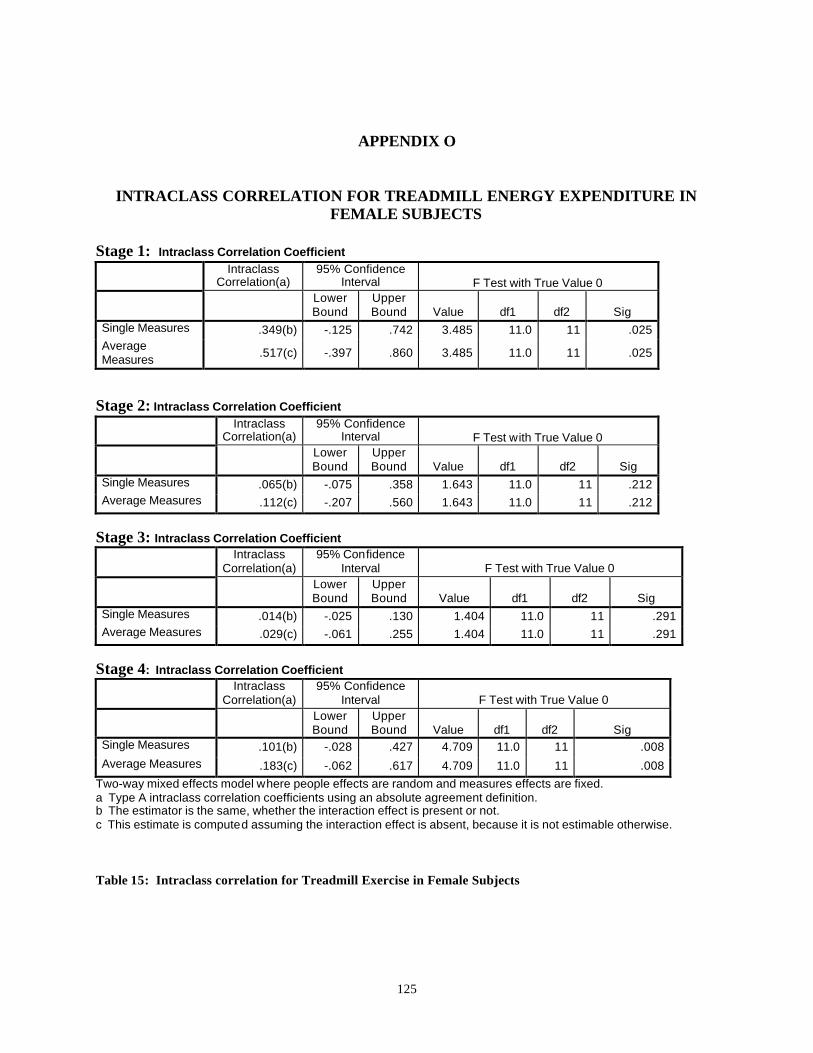
125
APPENDIX O
INTRACLASS CORRELATION FOR TREADMILL ENERGY EXPENDITURE IN FEMALE SUBJECTS
Stage 1: Intraclass Correlation Coefficient
Intraclass
Correlation(a) 95% Confidence
Interval F Test with True Value 0
Lower Bound
Upper Bound Value df1 df2 Sig
Single Measures .349(b) -.125 .742 3.485 11.0 11 .025 Average Measures .517(c) -.397 .860 3.485 11.0 11 .025
Stage 2: Intraclass Correlation Coefficient
Intraclass
Correlation(a) 95% Confidence
Interval F Test with True Value 0
Lower Bound
Upper Bound Value df1 df2 Sig
Single Measures .065(b) -.075 .358 1.643 11.0 11 .212 Average Measures .112(c) -.207 .560 1.643 11.0 11 .212
Stage 3: Intraclass Correlation Coefficient
Intraclass
Correlation(a) 95% Confidence
Interval F Test with True Value 0
Lower Bound
Upper Bound Value df1 df2 Sig
Single Measures .014(b) -.025 .130 1.404 11.0 11 .291 Average Measures .029(c) -.061 .255 1.404 11.0 11 .291
Stage 4: Intraclass Correlation Coefficient
Intraclass
Correlation(a) 95% Confidence
Interval F Test with True Value 0
Lower Bound
Upper Bound Value df1 df2 Sig
Single Measures .101(b) -.028 .427 4.709 11.0 11 .008 Average Measures .183(c) -.062 .617 4.709 11.0 11 .008
Two-way mixed effects model where people effects are random and measures effects are fixed. a Type A intraclass correlation coefficients using an absolute agreement definition. b The estimator is the same, whether the interaction effect is present or not. c This estimate is computed assuming the interaction effect is absent, because it is not estimable otherwise. Table 15: Intraclass correlation for Treadmill Exercise in Female Subjects
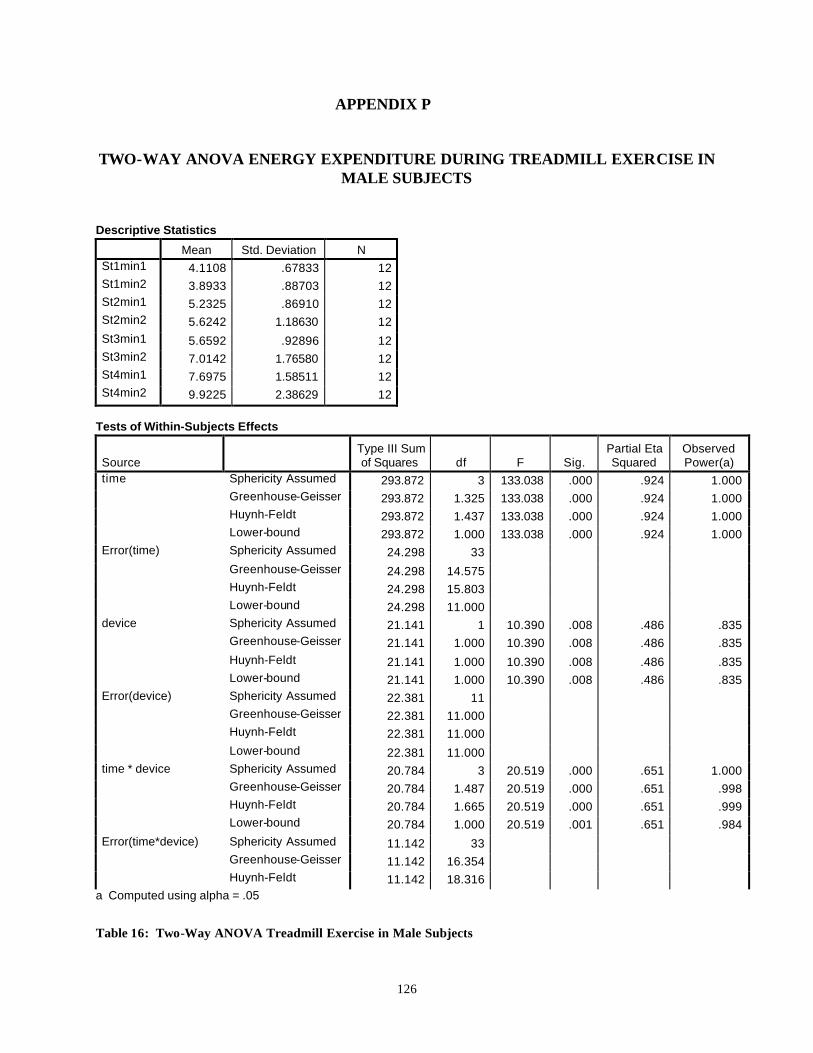
126
APPENDIX P
TWO-WAY ANOVA ENERGY EXPENDITURE DURING TREADMILL EXERCISE IN MALE SUBJECTS
Descriptive Statistics
Mean Std. Deviation N St1min1 4.1108 .67833 12 St1min2 3.8933 .88703 12 St2min1 5.2325 .86910 12 St2min2 5.6242 1.18630 12 St3min1 5.6592 .92896 12 St3min2 7.0142 1.76580 12 St4min1 7.6975 1.58511 12 St4min2 9.9225 2.38629 12
Tests of Within-Subjects Effects
Source Type III Sum of Squares df F Sig.
Partial Eta Squared
Observed Power(a)
time Sphericity Assumed 293.872 3 133.038 .000 .924 1.000 Greenhouse-Geisser 293.872 1.325 133.038 .000 .924 1.000 Huynh-Feldt 293.872 1.437 133.038 .000 .924 1.000 Lower-bound 293.872 1.000 133.038 .000 .924 1.000 Error(time) Sphericity Assumed 24.298 33 Greenhouse-Geisser 24.298 14.575 Huynh-Feldt 24.298 15.803 Lower-bound 24.298 11.000 device Sphericity Assumed 21.141 1 10.390 .008 .486 .835 Greenhouse-Geisser 21.141 1.000 10.390 .008 .486 .835 Huynh-Feldt 21.141 1.000 10.390 .008 .486 .835 Lower-bound 21.141 1.000 10.390 .008 .486 .835 Error(device) Sphericity Assumed 22.381 11 Greenhouse-Geisser 22.381 11.000 Huynh-Feldt 22.381 11.000 Lower-bound 22.381 11.000 time * device Sphericity Assumed 20.784 3 20.519 .000 .651 1.000 Greenhouse-Geisser 20.784 1.487 20.519 .000 .651 .998 Huynh-Feldt 20.784 1.665 20.519 .000 .651 .999 Lower-bound 20.784 1.000 20.519 .001 .651 .984 Error(time*device) Sphericity Assumed 11.142 33 Greenhouse-Geisser 11.142 16.354 Huynh-Feldt 11.142 18.316
a Computed using alpha = .05
Table 16: Two-Way ANOVA Treadmill Exercise in Male Subjects
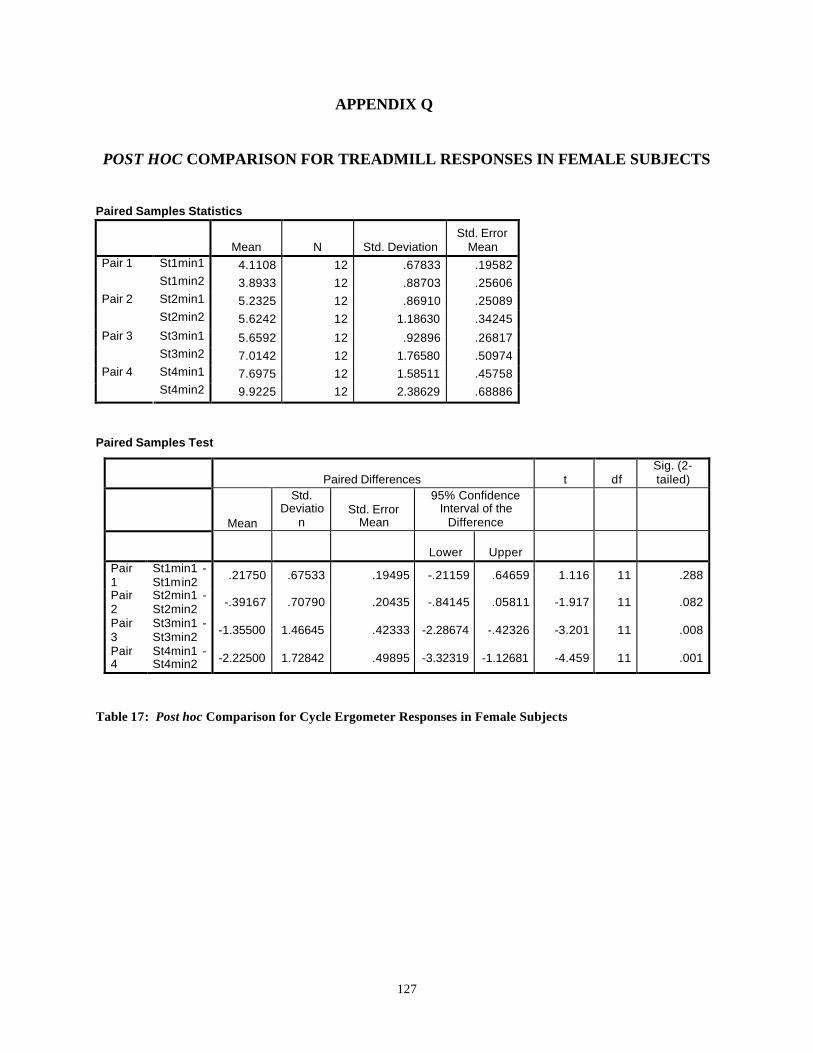
127
APPENDIX Q
POST HOC COMPARISON FOR TREADMILL RESPONSES IN FEMALE SUBJECTS Paired Samples Statistics
Mean N Std. Deviation Std. Error
Mean St1min1 4.1108 12 .67833 .19582 Pair 1 St1min2 3.8933 12 .88703 .25606 St2min1 5.2325 12 .86910 .25089 Pair 2 St2min2 5.6242 12 1.18630 .34245 St3min1 5.6592 12 .92896 .26817 Pair 3 St3min2 7.0142 12 1.76580 .50974 St4min1 7.6975 12 1.58511 .45758 Pair 4 St4min2 9.9225 12 2.38629 .68886
Paired Samples Test
Table 17: Post hoc Comparison for Cycle Ergometer Responses in Female Subjects
Paired Differences t df Sig. (2-tailed)
Mean
Std. Deviatio
n Std. Error
Mean
95% Confidence Interval of the
Difference
Lower Upper Pair 1
St1min1 - St1min2 .21750 .67533 .19495 -.21159 .64659 1.116 11 .288
Pair 2
St2min1 - St2min2 -.39167 .70790 .20435 -.84145 .05811 -1.917 11 .082
Pair 3
St3min1 - St3min2 -1.35500 1.46645 .42333 -2.28674 -.42326 -3.201 11 .008
Pair 4
St4min1 - St4min2 -2.22500 1.72842 .49895 -3.32319 -1.12681 -4.459 11 .001
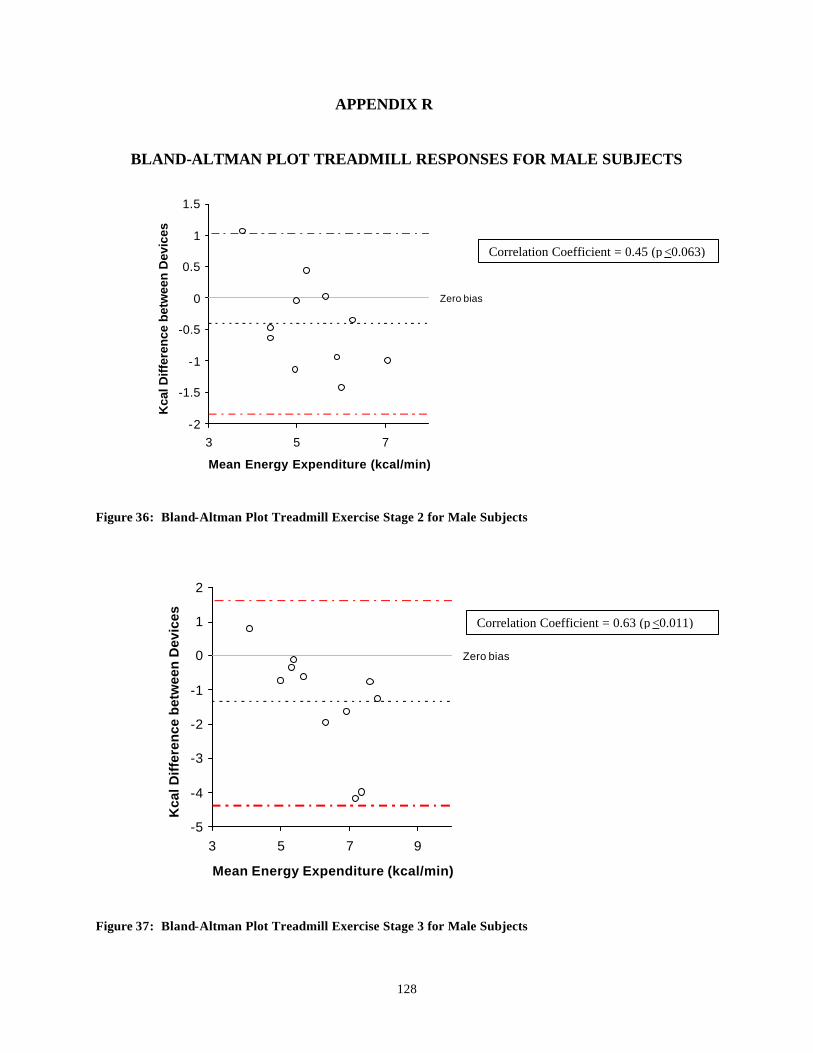
128
APPENDIX R
BLAND-ALTMAN PLOT TREADMILL RESPONSES FOR MALE SUBJECTS
Zero bias
-2
-1.5
-1
-0.5
0
0.5
1
1.5
3 5 7
Mean Energy Expenditure (kcal/min)
Kca
l Diff
eren
ce b
etw
een
Dev
ices
Figure 36: Bland-Altman Plot Treadmill Exercise Stage 2 for Male Subjects
Zero bias
-5
-4
-3
-2
-1
0
1
2
3 5 7 9
Mean Energy Expenditure (kcal/min)
Kca
l Dif
fere
nce
bet
wee
n D
evic
es
Figure 37: Bland-Altman Plot Treadmill Exercise Stage 3 for Male Subjects
Correlation Coefficient = 0.45 (p <0.063)
Correlation Coefficient = 0.63 (p <0.011)
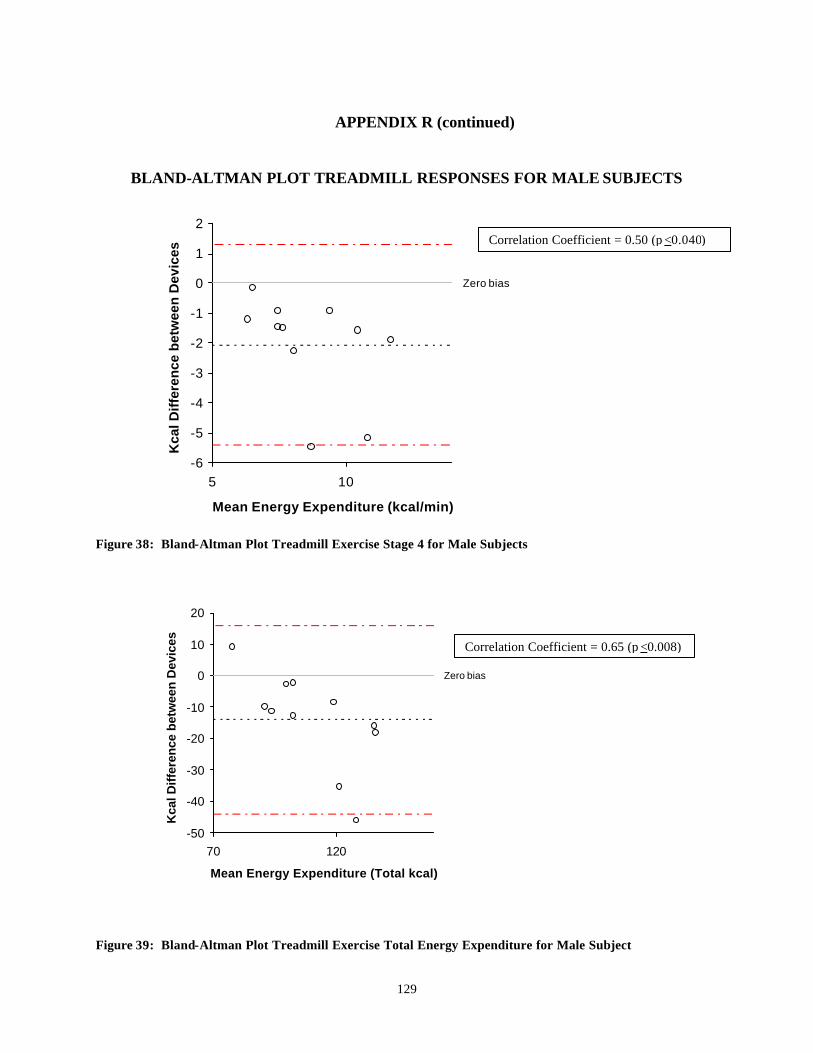
129
APPENDIX R (continued)
BLAND-ALTMAN PLOT TREADMILL RESPONSES FOR MALE SUBJECTS
Zero bias
-6
-5
-4
-3
-2
-1
0
1
2
5 10
Mean Energy Expenditure (kcal/min)
Kca
l Dif
fere
nce
bet
wee
n D
evic
es
Figure 38: Bland-Altman Plot Treadmill Exercise Stage 4 for Male Subjects
Zero bias
-50
-40
-30
-20
-10
0
10
20
70 120
Mean Energy Expenditure (Total kcal)
Kca
l Diff
eren
ce b
etw
een
Dev
ices
Figure 39: Bland-Altman Plot Treadmill Exercise Total Energy Expenditure for Male Subject
Correlation Coefficient = 0.50 (p <0.040)
Correlation Coefficient = 0.65 (p <0.008)
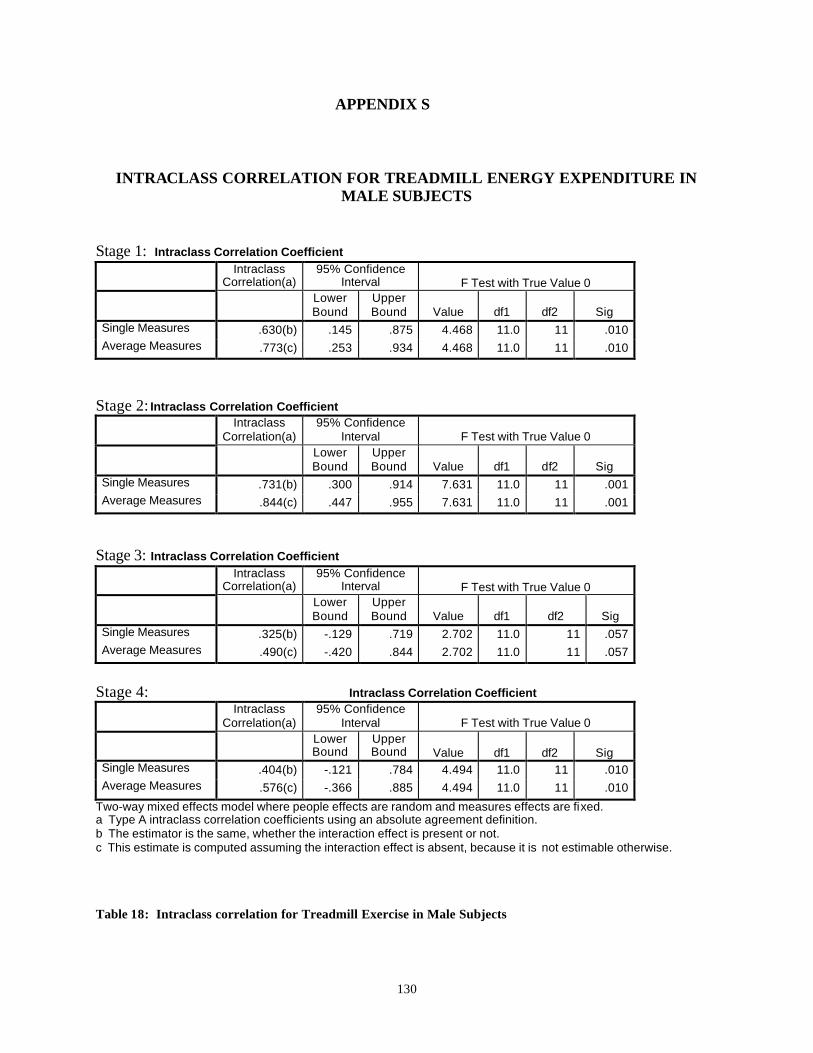
130
APPENDIX S
INTRACLASS CORRELATION FOR TREADMILL ENERGY EXPENDITURE IN MALE SUBJECTS
Stage 1: Intraclass Correlation Coefficient
Intraclass
Correlation(a) 95% Confidence
Interval F Test with True Value 0
Lower Bound
Upper Bound Value df1 df2 Sig
Single Measures .630(b) .145 .875 4.468 11.0 11 .010 Average Measures .773(c) .253 .934 4.468 11.0 11 .010
Stage 2: Intraclass Correlation Coefficient
Intraclass
Correlation(a) 95% Confidence
Interval F Test with True Value 0
Lower Bound
Upper Bound Value df1 df2 Sig
Single Measures .731(b) .300 .914 7.631 11.0 11 .001 Average Measures .844(c) .447 .955 7.631 11.0 11 .001
Stage 3: Intraclass Correlation Coefficient
Intraclass
Correlation(a) 95% Confidence
Interval F Test with True Value 0
Lower Bound
Upper Bound Value df1 df2 Sig
Single Measures .325(b) -.129 .719 2.702 11.0 11 .057 Average Measures .490(c) -.420 .844 2.702 11.0 11 .057
Stage 4: Intraclass Correlation Coefficient
Intraclass
Correlation(a) 95% Confidence
Interval F Test with True Value 0
Lower Bound
Upper Bound Value df1 df2 Sig
Single Measures .404(b) -.121 .784 4.494 11.0 11 .010 Average Measures .576(c) -.366 .885 4.494 11.0 11 .010
Two-way mixed effects model where people effects are random and measures effects are fixed. a Type A intraclass correlation coefficients using an absolute agreement definition. b The estimator is the same, whether the interaction effect is present or not. c This estimate is computed assuming the interaction effect is absent, because it is not estimable otherwise.
Table 18: Intraclass correlation for Treadmill Exercise in Male Subjects
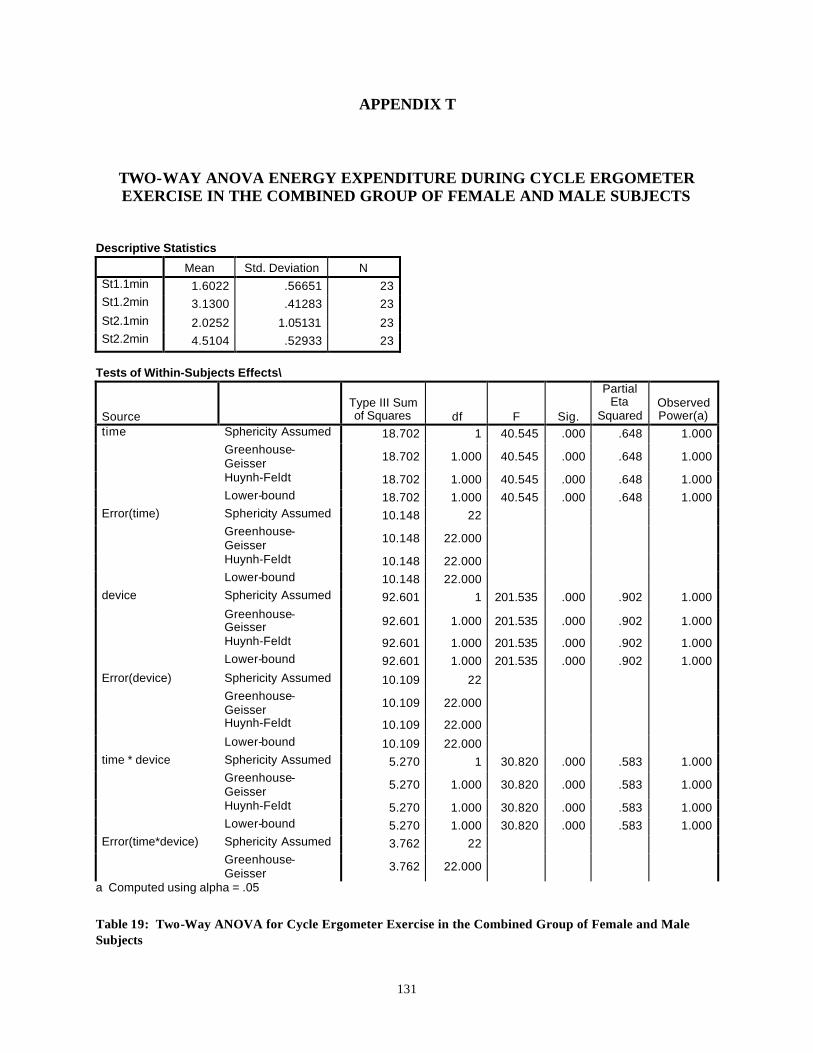
131
APPENDIX T
TWO-WAY ANOVA ENERGY EXPENDITURE DURING CYCLE ERGOMETER EXERCISE IN THE COMBINED GROUP OF FEMALE AND MALE SUBJECTS
Descriptive Statistics
Mean Std. Deviation N St1.1min 1.6022 .56651 23 St1.2min 3.1300 .41283 23 St2.1min 2.0252 1.05131 23 St2.2min 4.5104 .52933 23
Tests of Within-Subjects Effects\
Source Type III Sum of Squares df F Sig.
Partial Eta
Squared Observed Power(a)
time Sphericity Assumed 18.702 1 40.545 .000 .648 1.000 Greenhouse-
Geisser 18.702 1.000 40.545 .000 .648 1.000
Huynh-Feldt 18.702 1.000 40.545 .000 .648 1.000 Lower-bound 18.702 1.000 40.545 .000 .648 1.000 Error(time) Sphericity Assumed 10.148 22 Greenhouse-
Geisser 10.148 22.000
Huynh-Feldt 10.148 22.000 Lower-bound 10.148 22.000 device Sphericity Assumed 92.601 1 201.535 .000 .902 1.000 Greenhouse-
Geisser 92.601 1.000 201.535 .000 .902 1.000
Huynh-Feldt 92.601 1.000 201.535 .000 .902 1.000 Lower-bound 92.601 1.000 201.535 .000 .902 1.000 Error(device) Sphericity Assumed 10.109 22 Greenhouse-
Geisser 10.109 22.000
Huynh-Feldt 10.109 22.000 Lower-bound 10.109 22.000 time * device Sphericity Assumed 5.270 1 30.820 .000 .583 1.000 Greenhouse-
Geisser 5.270 1.000 30.820 .000 .583 1.000
Huynh-Feldt 5.270 1.000 30.820 .000 .583 1.000 Lower-bound 5.270 1.000 30.820 .000 .583 1.000 Error(time*device) Sphericity Assumed 3.762 22 Greenhouse-
Geisser 3.762 22.000
a Computed using alpha = .05
Table 19: Two-Way ANOVA for Cycle Ergometer Exercise in the Combined Group of Female and Male Subjects
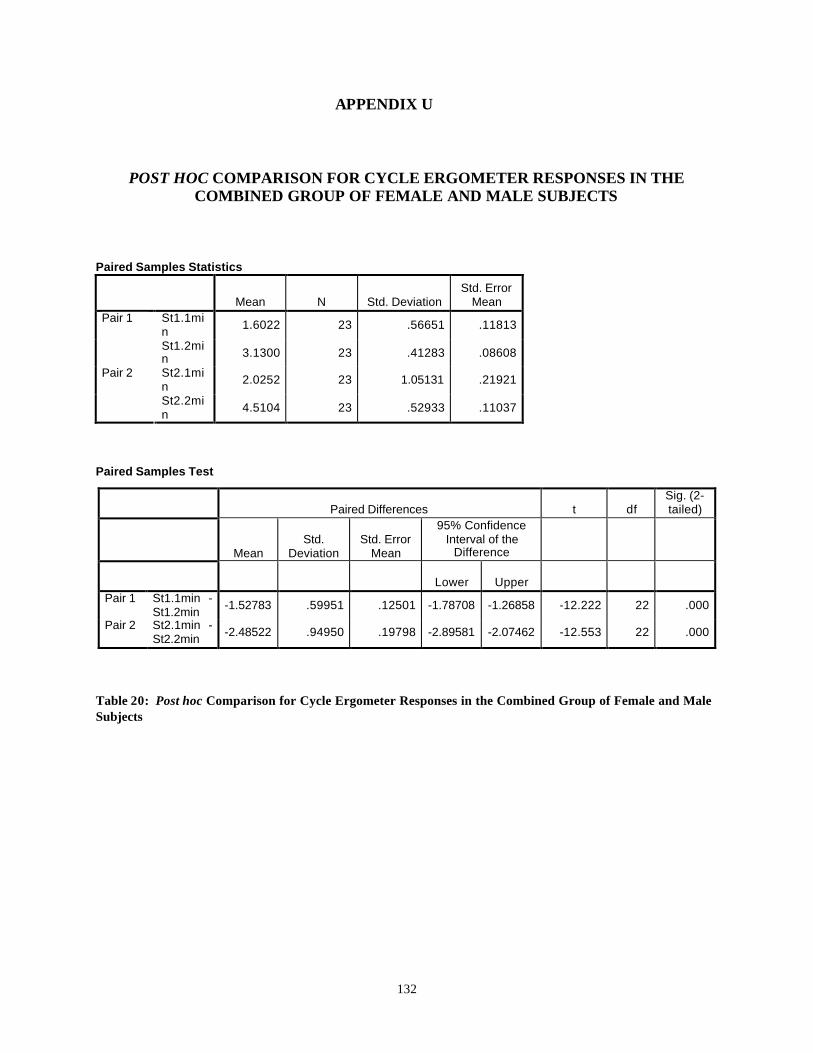
132
APPENDIX U
POST HOC COMPARISON FOR CYCLE ERGOMETER RESPONSES IN THE
COMBINED GROUP OF FEMALE AND MALE SUBJECTS Paired Samples Statistics
Mean N Std. Deviation Std. Error
Mean St1.1min 1.6022 23 .56651 .11813 Pair 1
St1.2min 3.1300 23 .41283 .08608
St2.1min 2.0252 23 1.05131 .21921 Pair 2
St2.2min 4.5104 23 .52933 .11037
Paired Samples Test
Table 20: Post hoc Comparison for Cycle Ergometer Responses in the Combined Group of Female and Male Subjects
Paired Differences t df Sig. (2-tailed)
Mean Std.
Deviation Std. Error
Mean
95% Confidence Interval of the
Difference
Lower Upper Pair 1 St1.1min -
St1.2min -1.52783 .59951 .12501 -1.78708 -1.26858 -12.222 22 .000
Pair 2 St2.1min - St2.2min -2.48522 .94950 .19798 -2.89581 -2.07462 -12.553 22 .000
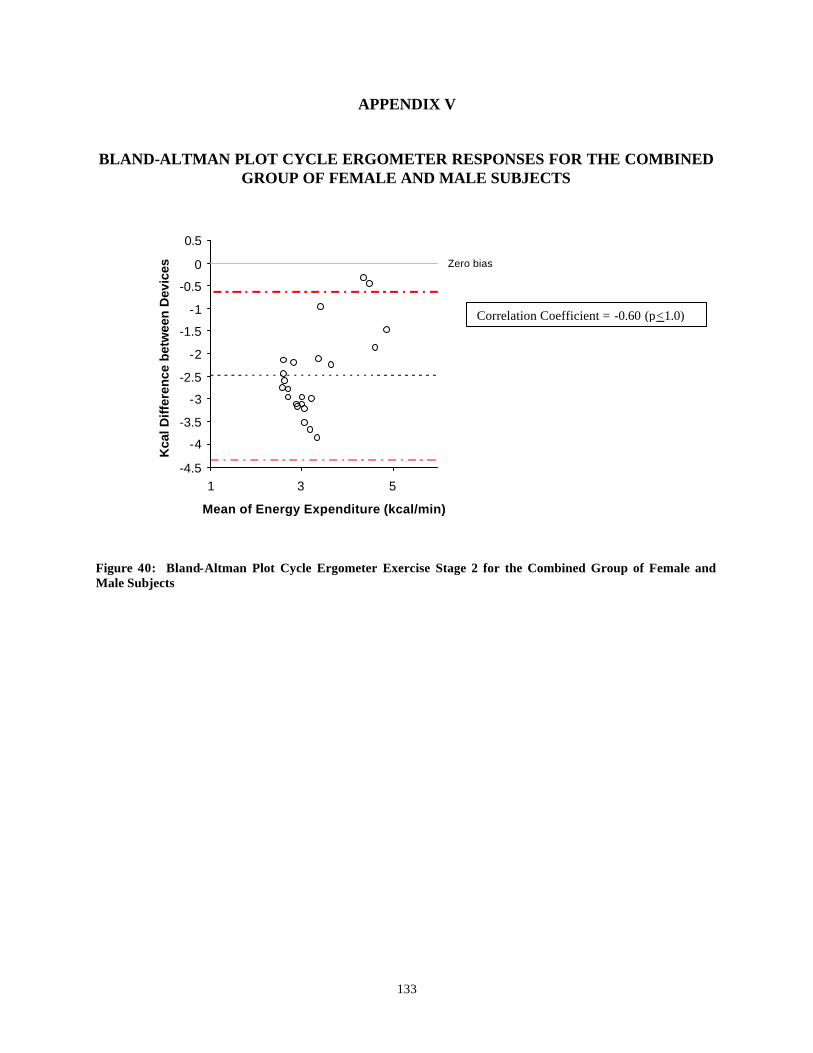
133
APPENDIX V
BLAND-ALTMAN PLOT CYCLE ERGOMETER RESPONSES FOR THE COMBINED
GROUP OF FEMALE AND MALE SUBJECTS
Zero bias
-4.5
-4
-3.5
-3
-2.5
-2
-1.5
-1
-0.5
0
0.5
1 3 5
Mean of Energy Expenditure (kcal/min)
Kca
l Dif
fere
nce
bet
wee
n D
evic
es
Figure 40: Bland-Altman Plot Cycle Ergometer Exercise Stage 2 for the Combined Group of Female and Male Subjects
Correlation Coefficient = -0.60 (p<1.0)
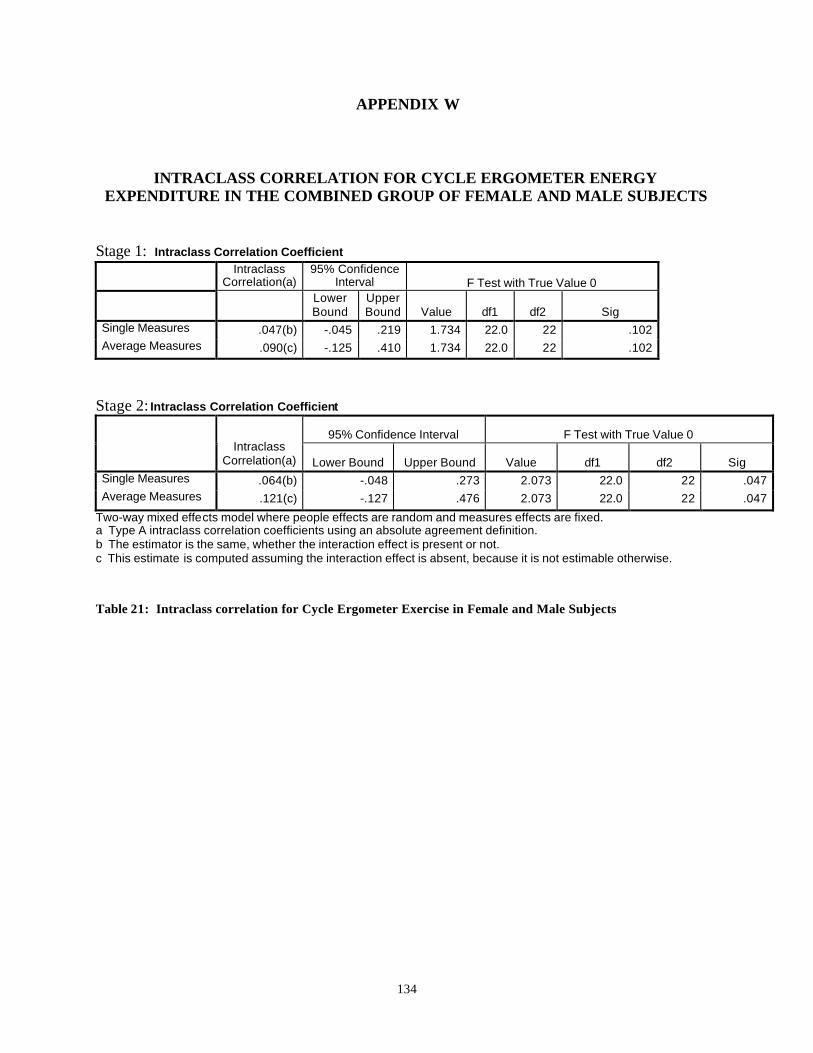
134
APPENDIX W
INTRACLASS CORRELATION FOR CYCLE ERGOMETER ENERGY
EXPENDITURE IN THE COMBINED GROUP OF FEMALE AND MALE SUBJECTS
Stage 1: Intraclass Correlation Coefficient
Intraclass
Correlation(a) 95% Confidence
Interval F Test with True Value 0
Lower Bound
Upper Bound Value df1 df2 Sig
Single Measures .047(b) -.045 .219 1.734 22.0 22 .102 Average Measures .090(c) -.125 .410 1.734 22.0 22 .102
Stage 2: Intraclass Correlation Coefficient
95% Confidence Interval F Test with True Value 0
Intraclass
Correlation(a) Lower Bound Upper Bound Value df1 df2 Sig Single Measures .064(b) -.048 .273 2.073 22.0 22 .047 Average Measures .121(c) -.127 .476 2.073 22.0 22 .047
Two-way mixed effects model where people effects are random and measures effects are fixed. a Type A intraclass correlation coefficients using an absolute agreement definition. b The estimator is the same, whether the interaction effect is present or not. c This estimate is computed assuming the interaction effect is absent, because it is not estimable otherwise.
Table 21: Intraclass correlation for Cycle Ergometer Exercise in Female and Male Subjects
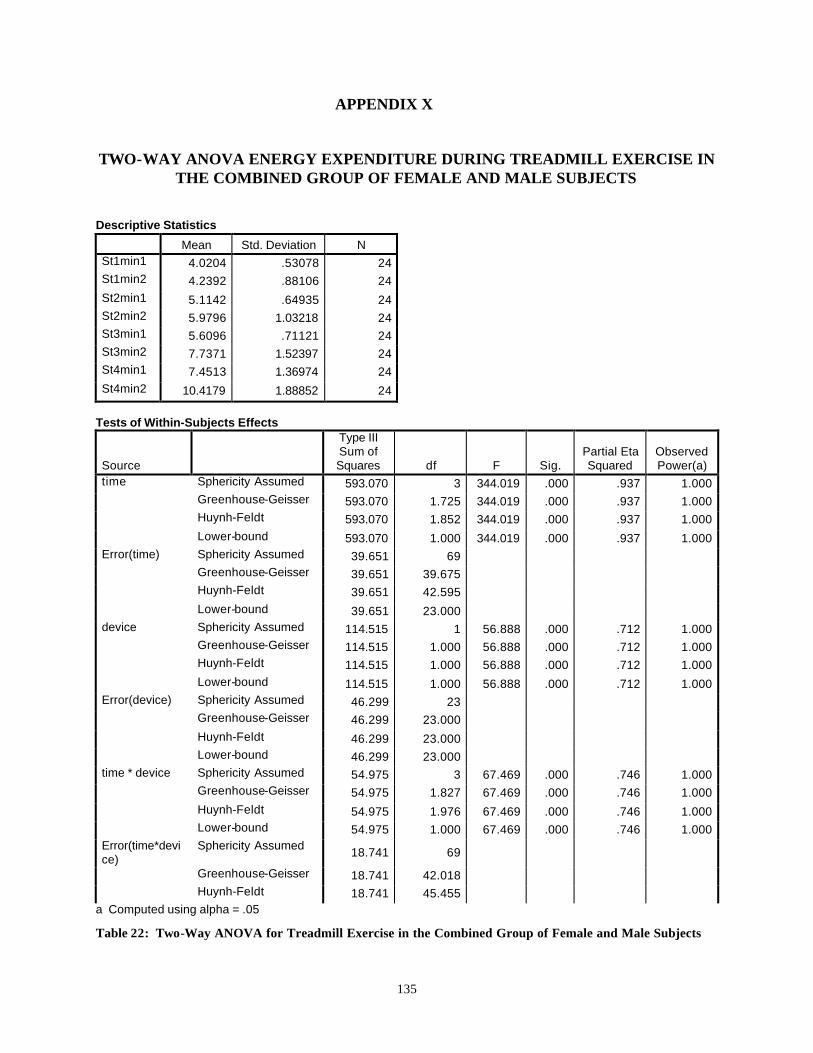
135
APPENDIX X
TWO-WAY ANOVA ENERGY EXPENDITURE DURING TREADMILL EXERCISE IN THE COMBINED GROUP OF FEMALE AND MALE SUBJECTS
Descriptive Statistics
Mean Std. Deviation N St1min1 4.0204 .53078 24 St1min2 4.2392 .88106 24 St2min1 5.1142 .64935 24 St2min2 5.9796 1.03218 24 St3min1 5.6096 .71121 24 St3min2 7.7371 1.52397 24 St4min1 7.4513 1.36974 24 St4min2 10.4179 1.88852 24
Tests of Within-Subjects Effects
Source
Type III Sum of Squares df F Sig.
Partial Eta Squared
Observed Power(a)
time Sphericity Assumed 593.070 3 344.019 .000 .937 1.000 Greenhouse-Geisser 593.070 1.725 344.019 .000 .937 1.000 Huynh-Feldt 593.070 1.852 344.019 .000 .937 1.000 Lower-bound 593.070 1.000 344.019 .000 .937 1.000 Error(time) Sphericity Assumed 39.651 69 Greenhouse-Geisser 39.651 39.675 Huynh-Feldt 39.651 42.595 Lower-bound 39.651 23.000 device Sphericity Assumed 114.515 1 56.888 .000 .712 1.000 Greenhouse-Geisser 114.515 1.000 56.888 .000 .712 1.000 Huynh-Feldt 114.515 1.000 56.888 .000 .712 1.000 Lower-bound 114.515 1.000 56.888 .000 .712 1.000 Error(device) Sphericity Assumed 46.299 23 Greenhouse-Geisser 46.299 23.000 Huynh-Feldt 46.299 23.000 Lower-bound 46.299 23.000 time * device Sphericity Assumed 54.975 3 67.469 .000 .746 1.000 Greenhouse-Geisser 54.975 1.827 67.469 .000 .746 1.000 Huynh-Feldt 54.975 1.976 67.469 .000 .746 1.000 Lower-bound 54.975 1.000 67.469 .000 .746 1.000 Error(time*device)
Sphericity Assumed 18.741 69
Greenhouse-Geisser 18.741 42.018 Huynh-Feldt 18.741 45.455
a Computed using alpha = .05
Table 22: Two-Way ANOVA for Treadmill Exercise in the Combined Group of Female and Male Subjects
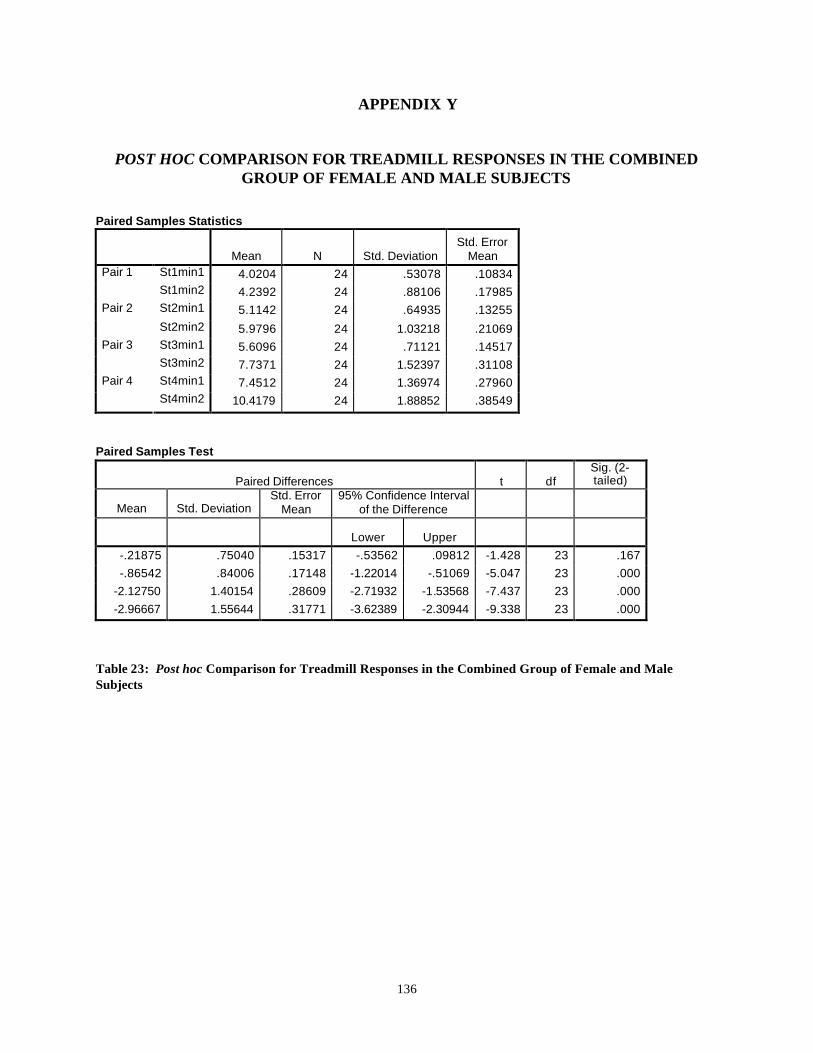
136
APPENDIX Y
POST HOC COMPARISON FOR TREADMILL RESPONSES IN THE COMBINED
GROUP OF FEMALE AND MALE SUBJECTS Paired Samples Statistics
Mean N Std. Deviation Std. Error
Mean St1min1 4.0204 24 .53078 .10834 Pair 1 St1min2 4.2392 24 .88106 .17985 St2min1 5.1142 24 .64935 .13255 Pair 2
St2min2 5.9796 24 1.03218 .21069 St3min1 5.6096 24 .71121 .14517 Pair 3 St3min2 7.7371 24 1.52397 .31108 St4min1 7.4512 24 1.36974 .27960 Pair 4 St4min2 10.4179 24 1.88852 .38549
Paired Samples Test
Paired Differences t df Sig. (2-tailed)
Mean Std. Deviation Std. Error
Mean 95% Confidence Interval
of the Difference
Lower Upper -.21875 .75040 .15317 -.53562 .09812 -1.428 23 .167 -.86542 .84006 .17148 -1.22014 -.51069 -5.047 23 .000
-2.12750 1.40154 .28609 -2.71932 -1.53568 -7.437 23 .000 -2.96667 1.55644 .31771 -3.62389 -2.30944 -9.338 23 .000
Table 23: Post hoc Comparison for Treadmill Responses in the Combined Group of Female and Male Subjects
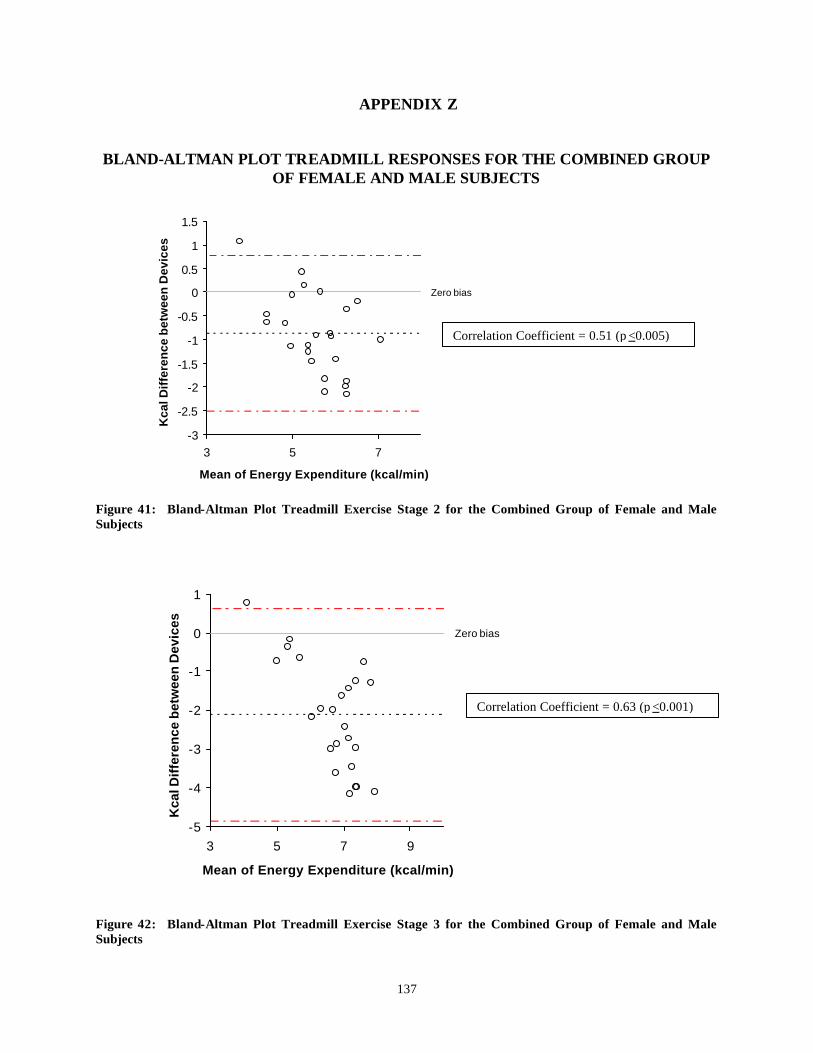
137
APPENDIX Z
BLAND-ALTMAN PLOT TREADMILL RESPONSES FOR THE COMBINED GROUP
OF FEMALE AND MALE SUBJECTS
Zero bias
-3
-2.5
-2
-1.5
-1
-0.5
0
0.5
1
1.5
3 5 7
Mean of Energy Expenditure (kcal/min)
Kca
l Dif
fere
nce
bet
wee
n D
evic
es
Figure 41: Bland-Altman Plot Treadmill Exercise Stage 2 for the Combined Group of Female and Male Subjects
Zero bias
-5
-4
-3
-2
-1
0
1
3 5 7 9
Mean of Energy Expenditure (kcal/min)
Kca
l Dif
fere
nce
bet
wee
n D
evic
es
Figure 42: Bland-Altman Plot Treadmill Exercise Stage 3 for the Combined Group of Female and Male Subjects
Correlation Coefficient = 0.51 (p <0.005)
Correlation Coefficient = 0.63 (p <0.001)
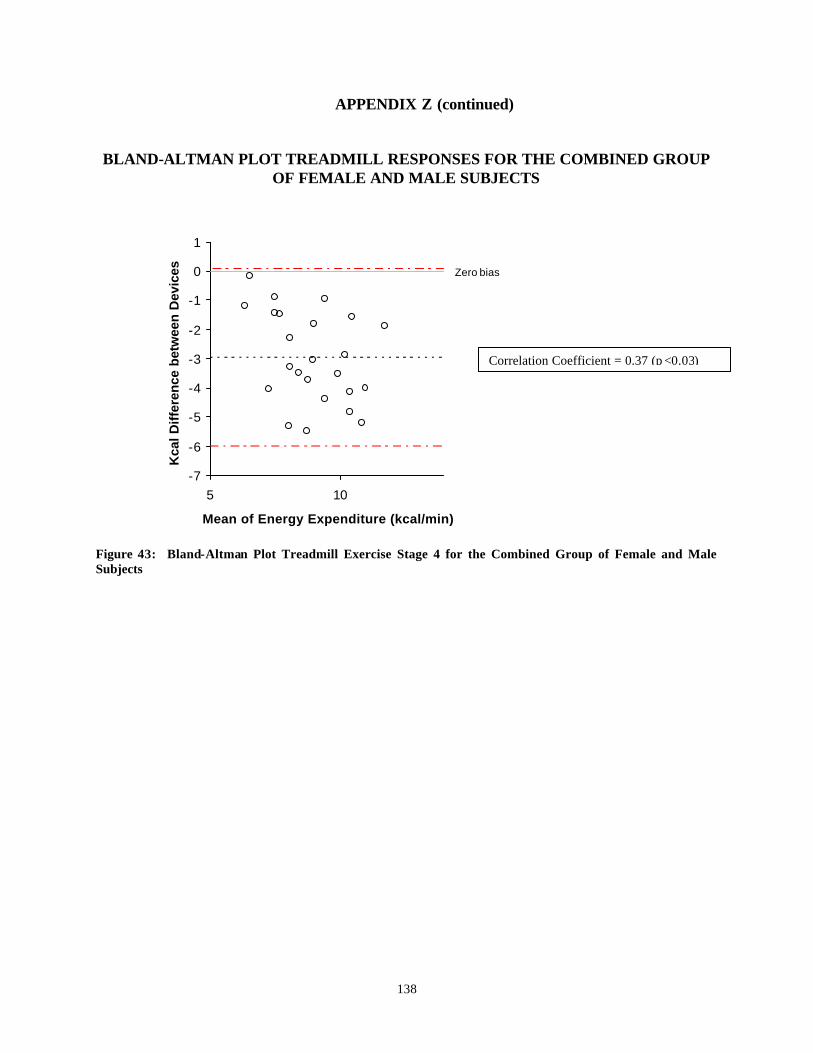
138
APPENDIX Z (continued)
BLAND-ALTMAN PLOT TREADMILL RESPONSES FOR THE COMBINED GROUP OF FEMALE AND MALE SUBJECTS
Zero bias
-7
-6
-5
-4
-3
-2
-1
0
1
5 10
Mean of Energy Expenditure (kcal/min)
Kca
l Diff
eren
ce b
etw
een
Dev
ices
Figure 43: Bland-Altman Plot Treadmill Exercise Stage 4 for the Combined Group of Female and Male Subjects
Correlation Coefficient = 0.37 (p <0.03)
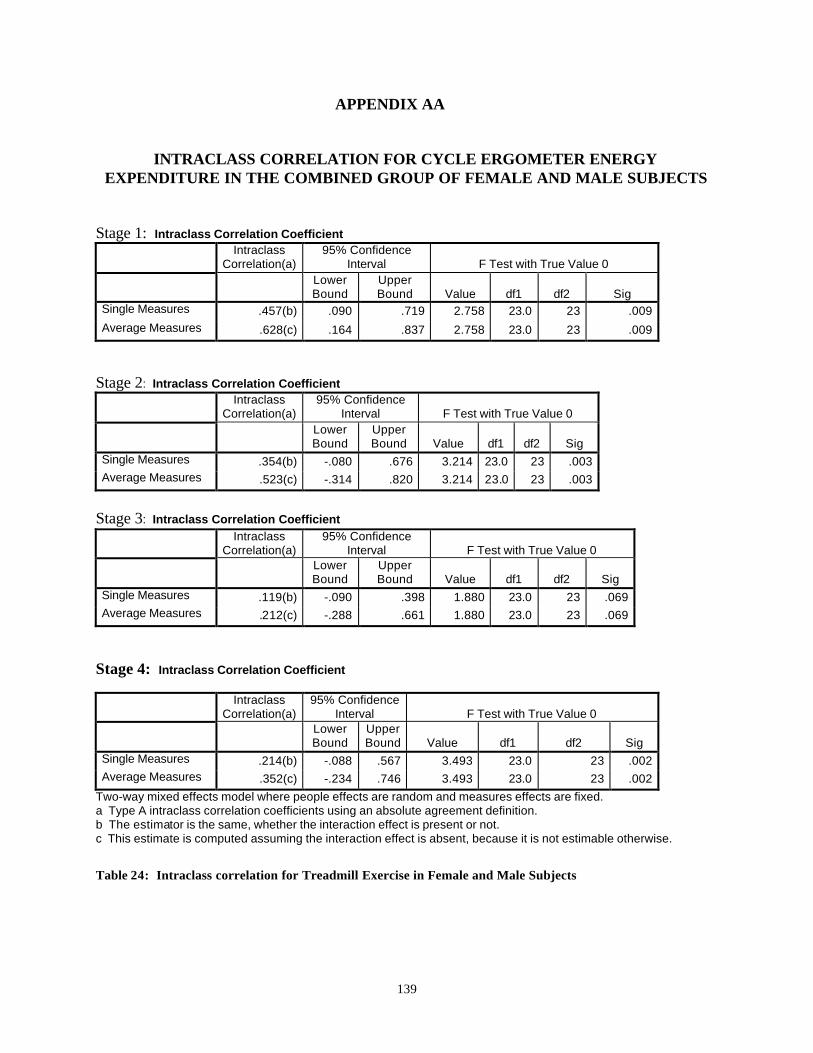
139
APPENDIX AA
INTRACLASS CORRELATION FOR CYCLE ERGOMETER ENERGY EXPENDITURE IN THE COMBINED GROUP OF FEMALE AND MALE SUBJECTS
Stage 1: Intraclass Correlation Coefficient
Intraclass
Correlation(a) 95% Confidence
Interval F Test with True Value 0
Lower Bound
Upper Bound Value df1 df2 Sig
Single Measures .457(b) .090 .719 2.758 23.0 23 .009 Average Measures .628(c) .164 .837 2.758 23.0 23 .009
Stage 2: Intraclass Correlation Coefficient
Intraclass
Correlation(a) 95% Confidence
Interval F Test with True Value 0
Lower Bound
Upper Bound Value df1 df2 Sig
Single Measures .354(b) -.080 .676 3.214 23.0 23 .003 Average Measures .523(c) -.314 .820 3.214 23.0 23 .003
Stage 3: Intraclass Correlation Coefficient
Intraclass
Correlation(a) 95% Confidence
Interval F Test with True Value 0
Lower Bound
Upper Bound Value df1 df2 Sig
Single Measures .119(b) -.090 .398 1.880 23.0 23 .069 Average Measures .212(c) -.288 .661 1.880 23.0 23 .069
Stage 4: Intraclass Correlation Coefficient
Intraclass
Correlation(a) 95% Confidence
Interval F Test with True Value 0
Lower Bound
Upper Bound Value df1 df2 Sig
Single Measures .214(b) -.088 .567 3.493 23.0 23 .002 Average Measures .352(c) -.234 .746 3.493 23.0 23 .002
Two-way mixed effects model where people effects are random and measures effects are fixed. a Type A intraclass correlation coefficients using an absolute agreement definition. b The estimator is the same, whether the interaction effect is present or not. c This estimate is computed assuming the interaction effect is absent, because it is not estimable otherwise.
Table 24: Intraclass correlation for Treadmill Exercise in Female and Male Subjects
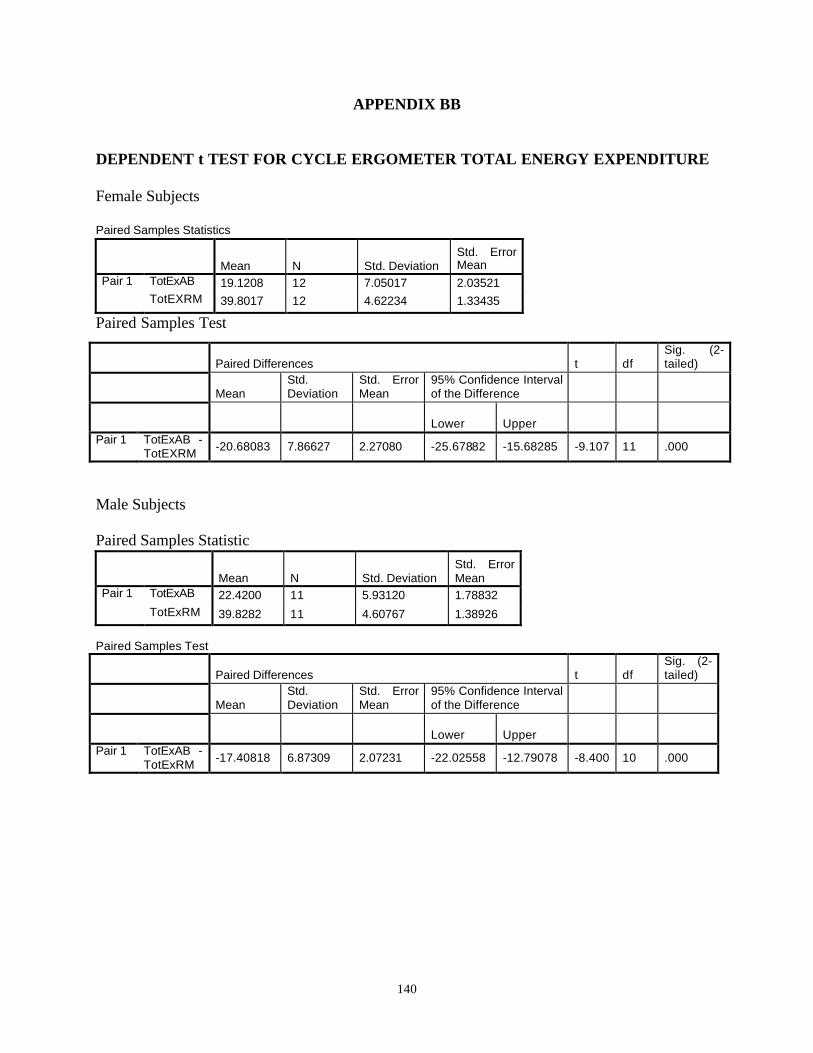
140
APPENDIX BB
DEPENDENT t TEST FOR CYCLE ERGOMETER TOTAL ENERGY EXPENDITURE Female Subjects Paired Samples Statistics
Mean N Std. Deviation Std. Error Mean
Pair 1 TotExAB 19.1208 12 7.05017 2.03521 TotEXRM 39.8017 12 4.62234 1.33435
Paired Samples Test
Male Subjects Paired Samples Statistic
Mean N Std. Deviation Std. Error Mean
Pair 1 TotExAB 22.4200 11 5.93120 1.78832 TotExRM 39.8282 11 4.60767 1.38926
Paired Samples Test
Paired Differences t df Sig. (2-tailed)
Mean Std. Deviation
Std. Error Mean
95% Confidence Interval of the Difference
Lower Upper Pair 1 TotExAB -
TotExRM -17.40818 6.87309 2.07231 -22.02558 -12.79078 -8.400 10 .000
Paired Differences t df Sig. (2-tailed)
Mean Std. Deviation
Std. Error Mean
95% Confidence Interval of the Difference
Lower Upper Pair 1 TotExAB -
TotEXRM -20.68083 7.86627 2.27080 -25.67882 -15.68285 -9.107 11 .000
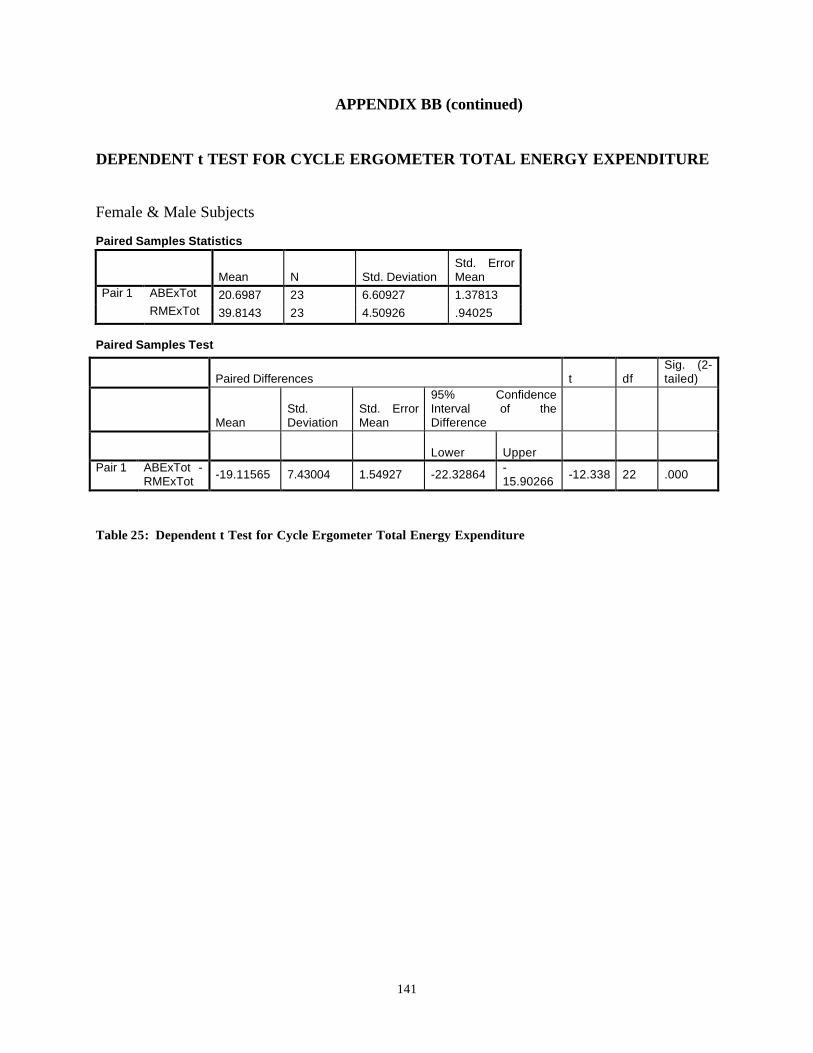
141
APPENDIX BB (continued)
DEPENDENT t TEST FOR CYCLE ERGOMETER TOTAL ENERGY EXPENDITURE
Female & Male Subjects Paired Samples Statistics
Mean N Std. Deviation Std. Error Mean
Pair 1 ABExTot 20.6987 23 6.60927 1.37813 RMExTot 39.8143 23 4.50926 .94025
Paired Samples Test
Table 25: Dependent t Test for Cycle Ergometer Total Energy Expenditure
Paired Differences t df Sig. (2-tailed)
Mean Std. Deviation
Std. Error Mean
95% Confidence Interval of the Difference
Lower Upper Pair 1 ABExTot -
RMExTot -19.11565 7.43004 1.54927 -22.32864 -15.90266 -12.338 22 .000
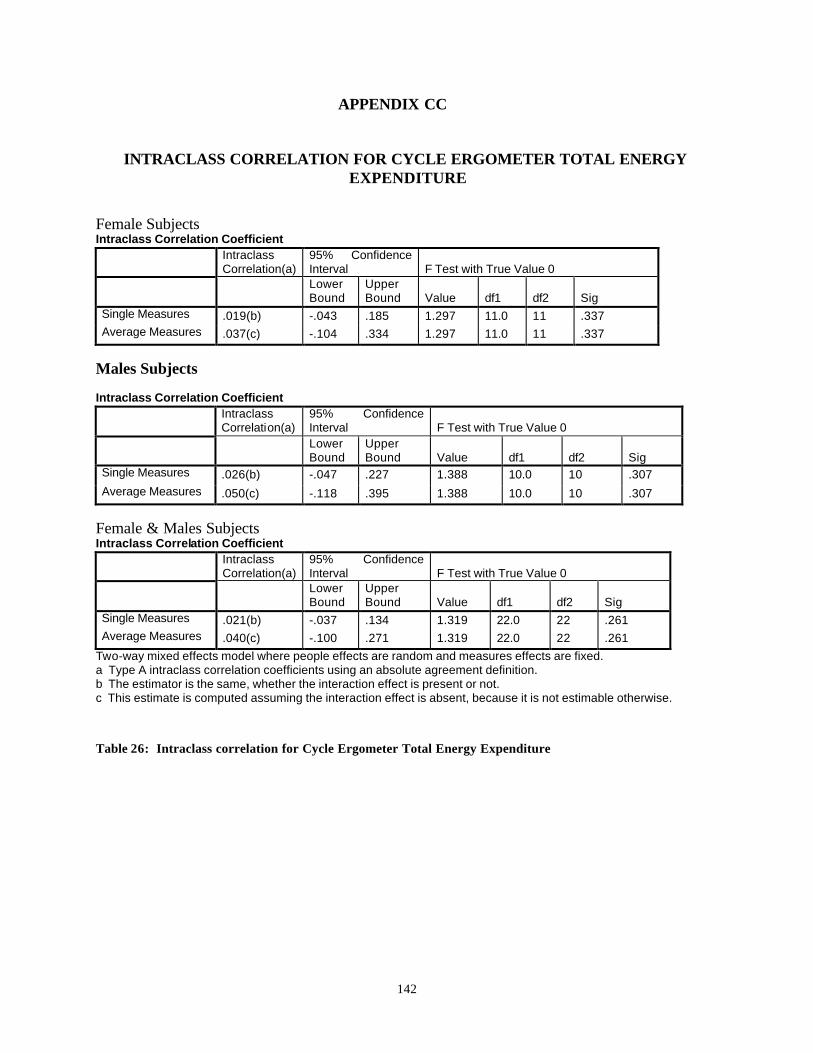
142
APPENDIX CC
INTRACLASS CORRELATION FOR CYCLE ERGOMETER TOTAL ENERGY EXPENDITURE
Female Subjects Intraclass Correlation Coefficient
Intraclass Correlation(a)
95% Confidence Interval F Test with True Value 0
Lower Bound
Upper Bound Value df1 df2 Sig
Single Measures .019(b) -.043 .185 1.297 11.0 11 .337 Average Measures .037(c) -.104 .334 1.297 11.0 11 .337
Males Subjects Intraclass Correlation Coefficient
Intraclass Correlation(a)
95% Confidence Interval F Test with True Value 0
Lower Bound
Upper Bound Value df1 df2 Sig
Single Measures .026(b) -.047 .227 1.388 10.0 10 .307 Average Measures .050(c) -.118 .395 1.388 10.0 10 .307
Female & Males Subjects Intraclass Correlation Coefficient
Intraclass Correlation(a)
95% Confidence Interval F Test with True Value 0
Lower Bound
Upper Bound Value df1 df2 Sig
Single Measures .021(b) -.037 .134 1.319 22.0 22 .261 Average Measures .040(c) -.100 .271 1.319 22.0 22 .261
Two-way mixed effects model where people effects are random and measures effects are fixed. a Type A intraclass correlation coefficients using an absolute agreement definition. b The estimator is the same, whether the interaction effect is present or not. c This estimate is computed assuming the interaction effect is absent, because it is not estimable otherwise.
Table 26: Intraclass correlation for Cycle Ergometer Total Energy Expenditure
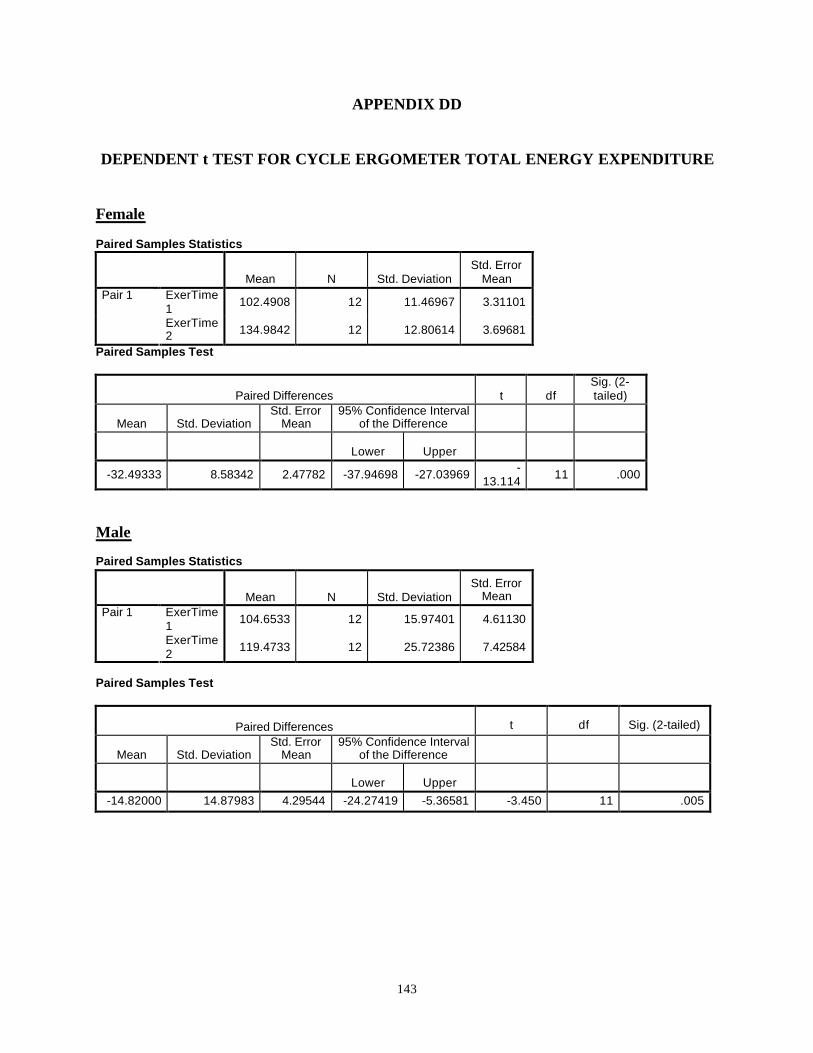
143
APPENDIX DD
DEPENDENT t TEST FOR CYCLE ERGOMETER TOTAL ENERGY EXPENDITURE
Female Paired Samples Statistics
Mean N Std. Deviation Std. Error
Mean ExerTime1 102.4908 12 11.46967 3.31101 Pair 1
ExerTime2 134.9842 12 12.80614 3.69681
Paired Samples Test
Paired Differences t df Sig. (2-tailed)
Mean Std. Deviation Std. Error
Mean 95% Confidence Interval
of the Difference
Lower Upper
-32.49333 8.58342 2.47782 -37.94698 -27.03969 -13.114 11 .000
Male Paired Samples Statistics
Mean N Std. Deviation Std. Error
Mean ExerTime1 104.6533 12 15.97401 4.61130 Pair 1
ExerTime2 119.4733 12 25.72386 7.42584
Paired Samples Test
Paired Differences t df Sig. (2-tailed)
Mean Std. Deviation Std. Error
Mean 95% Confidence Interval
of the Difference
Lower Upper -14.82000 14.87983 4.29544 -24.27419 -5.36581 -3.450 11 .005
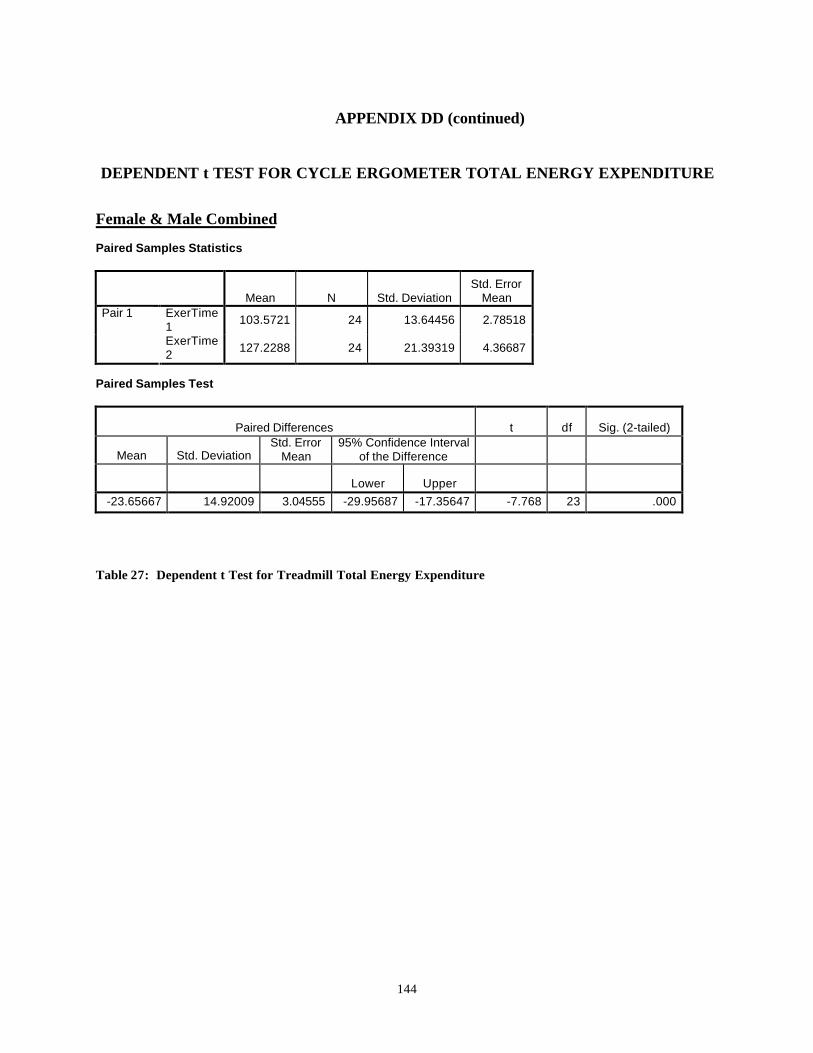
144
APPENDIX DD (continued)
DEPENDENT t TEST FOR CYCLE ERGOMETER TOTAL ENERGY EXPENDITURE Female & Male Combined Paired Samples Statistics
Mean N Std. Deviation Std. Error
Mean ExerTime1 103.5721 24 13.64456 2.78518 Pair 1
ExerTime2 127.2288 24 21.39319 4.36687
Paired Samples Test
Paired Differences t df Sig. (2-tailed)
Mean Std. Deviation Std. Error
Mean 95% Confidence Interval
of the Difference
Lower Upper -23.65667 14.92009 3.04555 -29.95687 -17.35647 -7.768 23 .000
Table 27: Dependent t Test for Treadmill Total Energy Expenditure
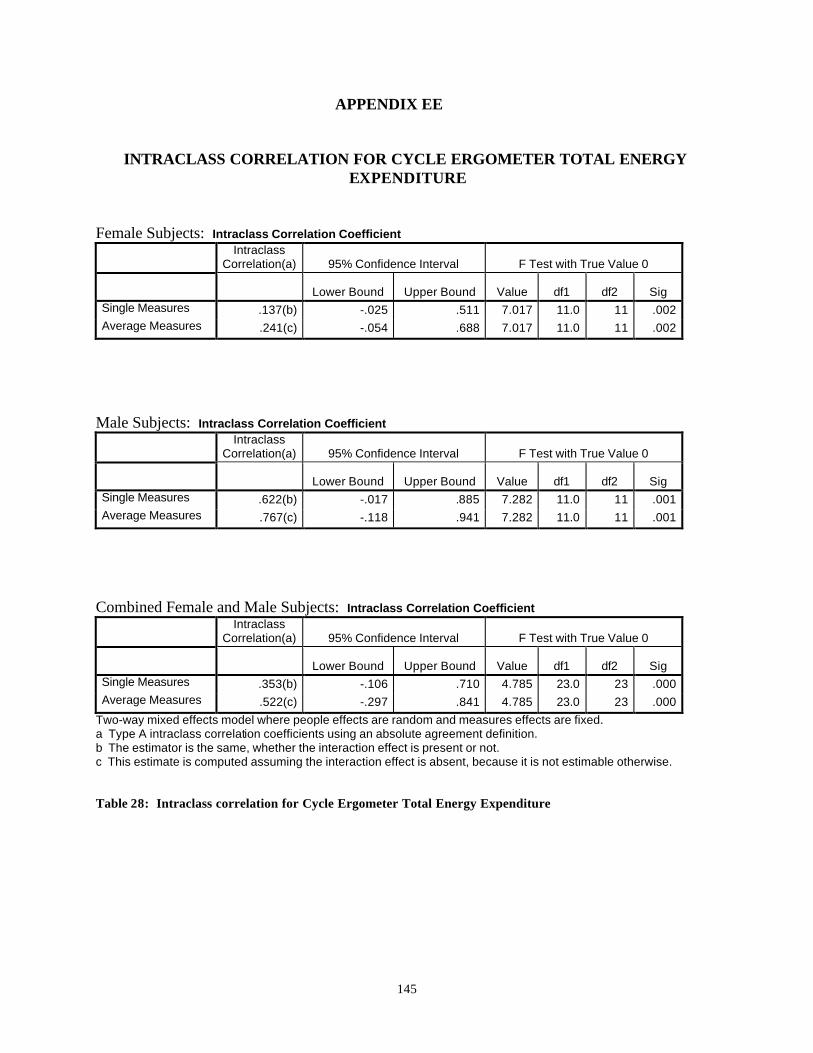
145
APPENDIX EE
INTRACLASS CORRELATION FOR CYCLE ERGOMETER TOTAL ENERGY EXPENDITURE
Female Subjects: Intraclass Correlation Coefficient
Intraclass
Correlation(a) 95% Confidence Interval F Test with True Value 0
Lower Bound Upper Bound Value df1 df2 Sig Single Measures .137(b) -.025 .511 7.017 11.0 11 .002 Average Measures .241(c) -.054 .688 7.017 11.0 11 .002
Male Subjects: Intraclass Correlation Coefficient
Intraclass
Correlation(a) 95% Confidence Interval F Test with True Value 0
Lower Bound Upper Bound Value df1 df2 Sig Single Measures .622(b) -.017 .885 7.282 11.0 11 .001 Average Measures .767(c) -.118 .941 7.282 11.0 11 .001
Combined Female and Male Subjects: Intraclass Correlation Coefficient
Intraclass
Correlation(a) 95% Confidence Interval F Test with True Value 0
Lower Bound Upper Bound Value df1 df2 Sig Single Measures .353(b) -.106 .710 4.785 23.0 23 .000 Average Measures .522(c) -.297 .841 4.785 23.0 23 .000
Two-way mixed effects model where people effects are random and measures effects are fixed. a Type A intraclass correlation coefficients using an absolute agreement definition. b The estimator is the same, whether the interaction effect is present or not. c This estimate is computed assuming the interaction effect is absent, because it is not estimable otherwise.
Table 28: Intraclass correlation for Cycle Ergometer Total Energy Expenditure
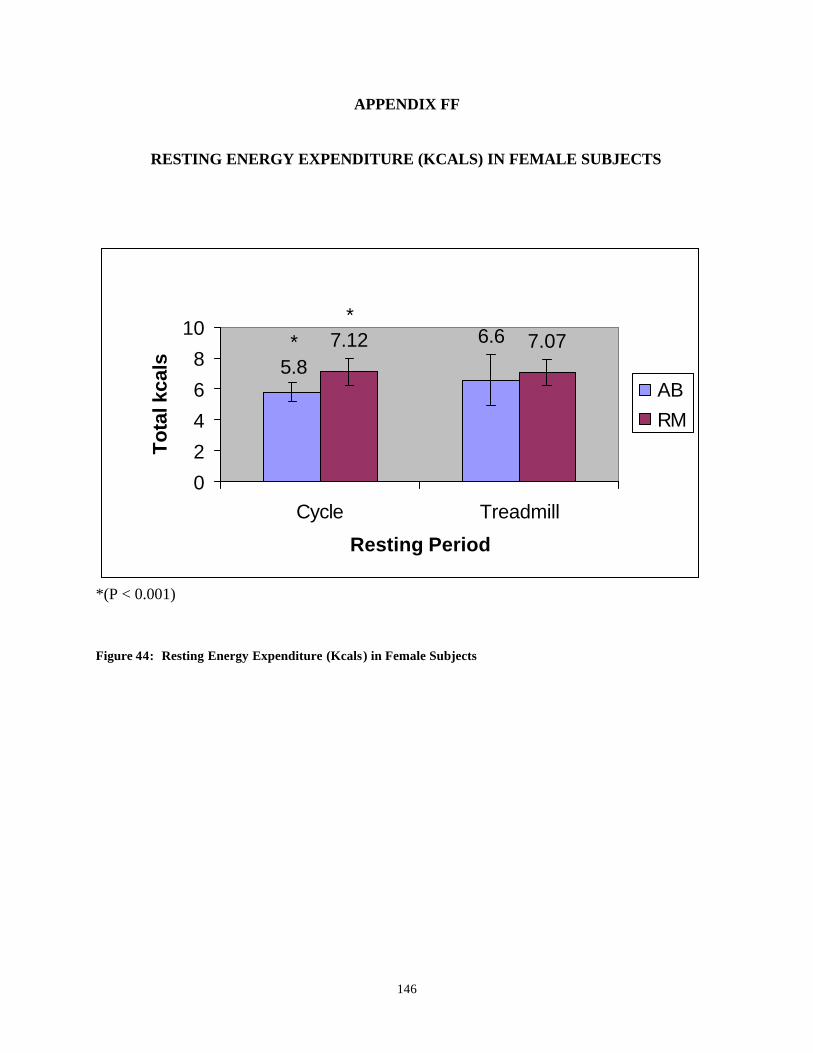
146
APPENDIX FF
RESTING ENERGY EXPENDITURE (KCALS) IN FEMALE SUBJECTS
6.6*5.8
7.07*
7.12
0
2
4
6
8
10
Cycle Treadmill
Resting Period
To
tal k
cals
ABRM
*(P < 0.001)
Figure 44: Resting Energy Expenditure (Kcals) in Female Subjects
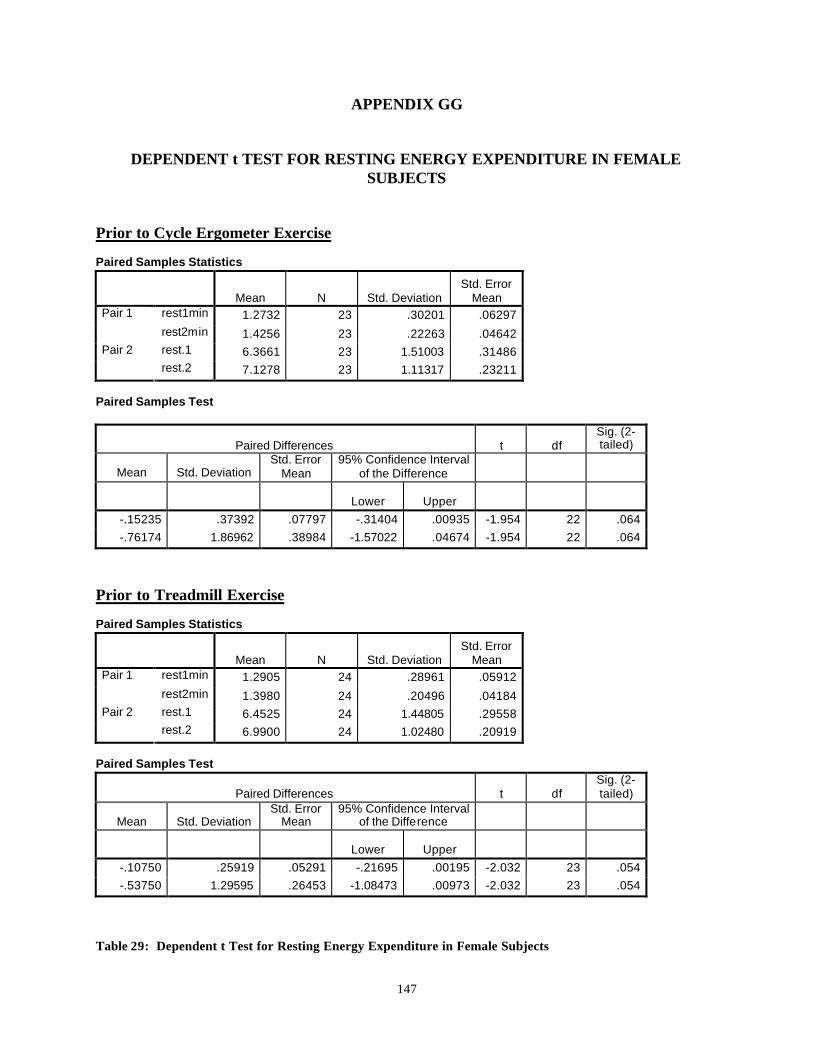
147
APPENDIX GG
DEPENDENT t TEST FOR RESTING ENERGY EXPENDITURE IN FEMALE SUBJECTS
Prior to Cycle Ergometer Exercise Paired Samples Statistics
Mean N Std. Deviation Std. Error
Mean rest1min 1.2732 23 .30201 .06297 Pair 1
rest2min 1.4256 23 .22263 .04642 rest.1 6.3661 23 1.51003 .31486 Pair 2 rest.2 7.1278 23 1.11317 .23211
Paired Samples Test
Paired Differences t df Sig. (2-tailed)
Mean Std. Deviation Std. Error
Mean 95% Confidence Interval
of the Difference
Lower Upper -.15235 .37392 .07797 -.31404 .00935 -1.954 22 .064 -.76174 1.86962 .38984 -1.57022 .04674 -1.954 22 .064
Prior to Treadmill Exercise Paired Samples Statistics
Mean N Std. Deviation Std. Error
Mean rest1min 1.2905 24 .28961 .05912 Pair 1
rest2min 1.3980 24 .20496 .04184 rest.1 6.4525 24 1.44805 .29558 Pair 2 rest.2 6.9900 24 1.02480 .20919
Paired Samples Test
Paired Differences t df Sig. (2-tailed)
Mean Std. Deviation Std. Error
Mean 95% Confidence Interval
of the Difference
Lower Upper -.10750 .25919 .05291 -.21695 .00195 -2.032 23 .054 -.53750 1.29595 .26453 -1.08473 .00973 -2.032 23 .054
Table 29: Dependent t Test for Resting Energy Expenditure in Female Subjects
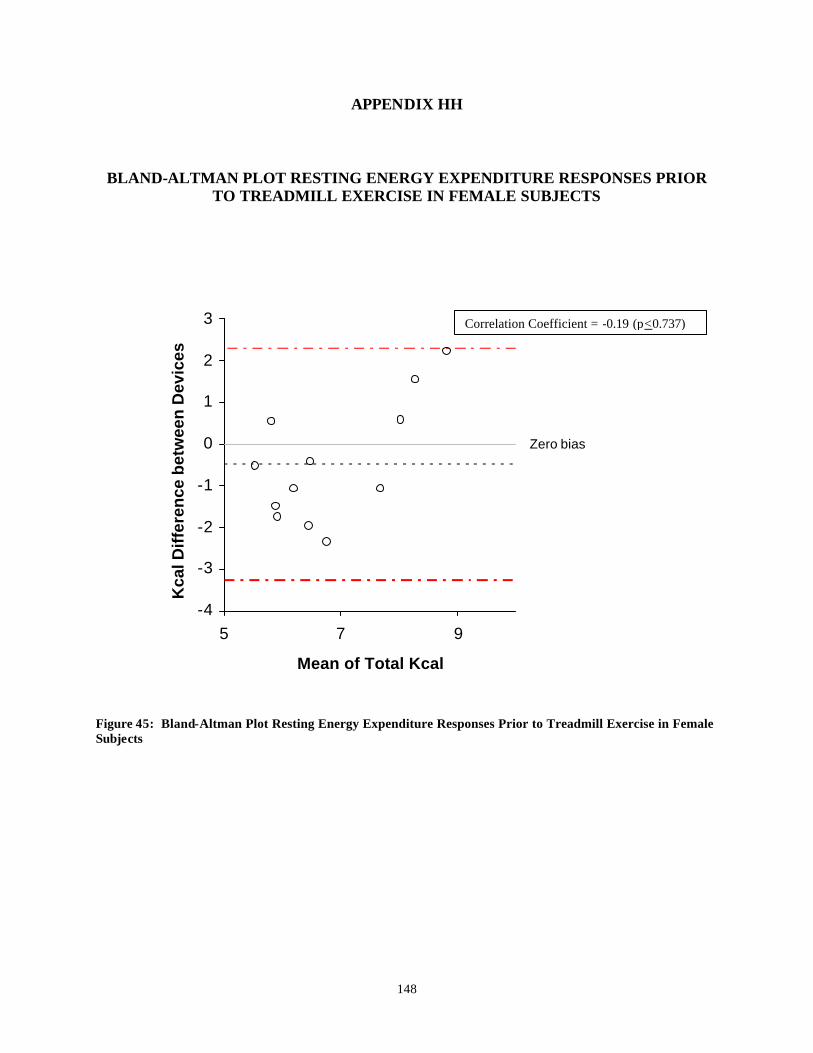
148
APPENDIX HH
BLAND-ALTMAN PLOT RESTING ENERGY EXPENDITURE RESPONSES PRIOR
TO TREADMILL EXERCISE IN FEMALE SUBJECTS
Zero bias
-4
-3
-2
-1
0
1
2
3
5 7 9
Mean of Total Kcal
Kca
l Dif
fere
nce
bet
wee
n D
evic
es
Figure 45: Bland-Altman Plot Resting Energy Expenditure Responses Prior to Treadmill Exercise in Female Subjects
Correlation Coefficient = -0.19 (p<0.737)
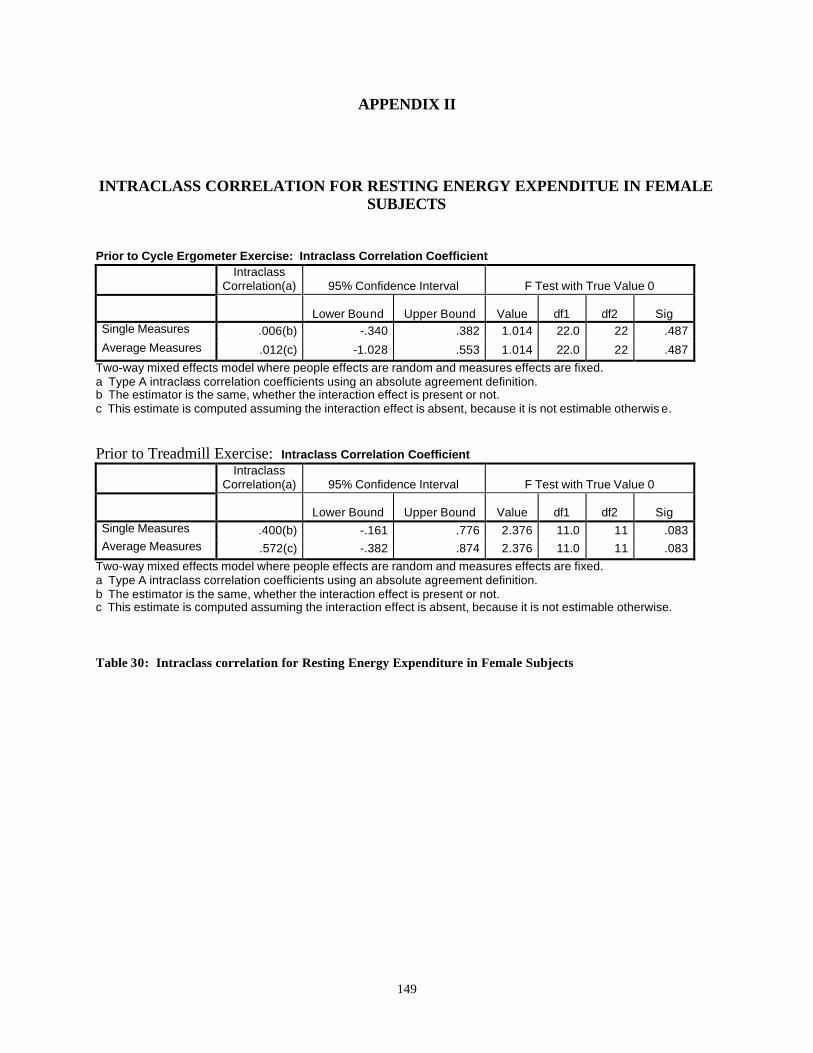
149
APPENDIX II
INTRACLASS CORRELATION FOR RESTING ENERGY EXPENDITUE IN FEMALE
SUBJECTS Prior to Cycle Ergometer Exercise: Intraclass Correlation Coefficient
Intraclass
Correlation(a) 95% Confidence Interval F Test with True Value 0
Lower Bound Upper Bound Value df1 df2 Sig Single Measures .006(b) -.340 .382 1.014 22.0 22 .487 Average Measures .012(c) -1.028 .553 1.014 22.0 22 .487
Two-way mixed effects model where people effects are random and measures effects are fixed. a Type A intraclass correlation coefficients using an absolute agreement definition. b The estimator is the same, whether the interaction effect is present or not. c This estimate is computed assuming the interaction effect is absent, because it is not estimable otherwis e. Prior to Treadmill Exercise: Intraclass Correlation Coefficient
Intraclass
Correlation(a) 95% Confidence Interval F Test with True Value 0
Lower Bound Upper Bound Value df1 df2 Sig Single Measures .400(b) -.161 .776 2.376 11.0 11 .083 Average Measures .572(c) -.382 .874 2.376 11.0 11 .083
Two-way mixed effects model where people effects are random and measures effects are fixed. a Type A intraclass correlation coefficients using an absolute agreement definition. b The estimator is the same, whether the interaction effect is present or not. c This estimate is computed assuming the interaction effect is absent, because it is not estimable otherwise. Table 30: Intraclass correlation for Resting Energy Expenditure in Female Subjects
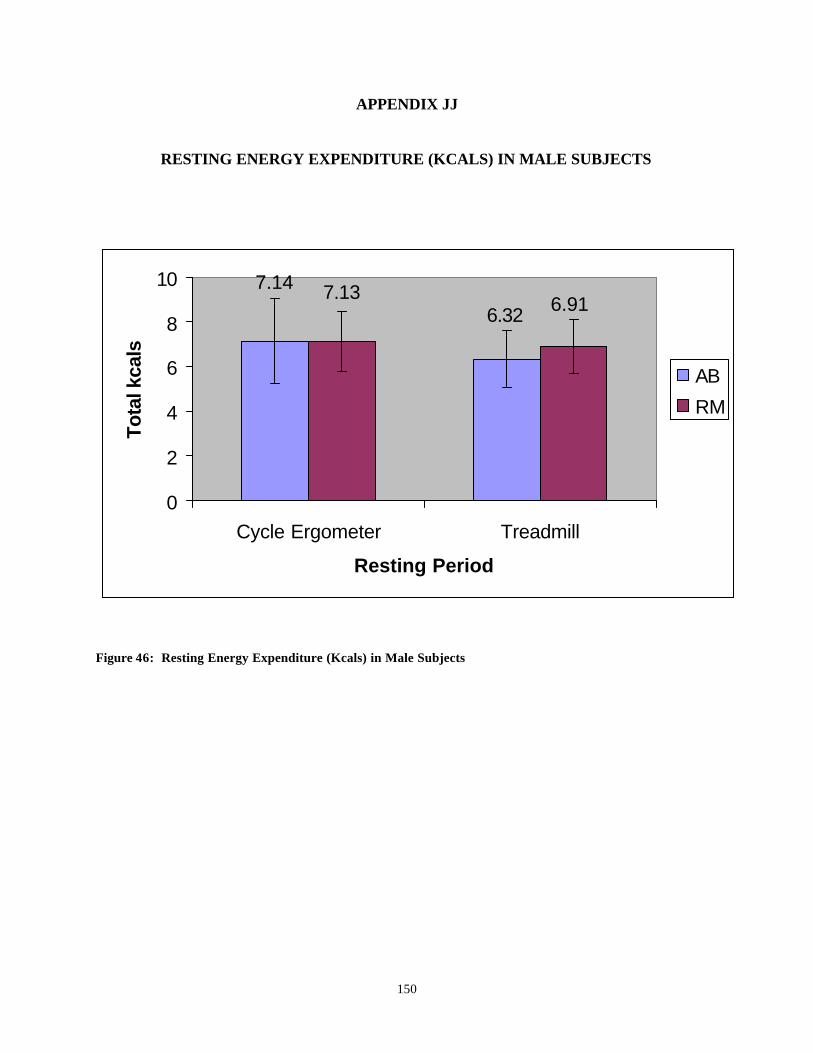
150
APPENDIX JJ
RESTING ENERGY EXPENDITURE (KCALS) IN MALE SUBJECTS
6.32
7.146.91
7.13
0
2
4
6
8
10
Cycle Ergometer Treadmill
Resting Period
Tota
l kca
ls
AB
RM
Figure 46: Resting Energy Expenditure (Kcals) in Male Subjects
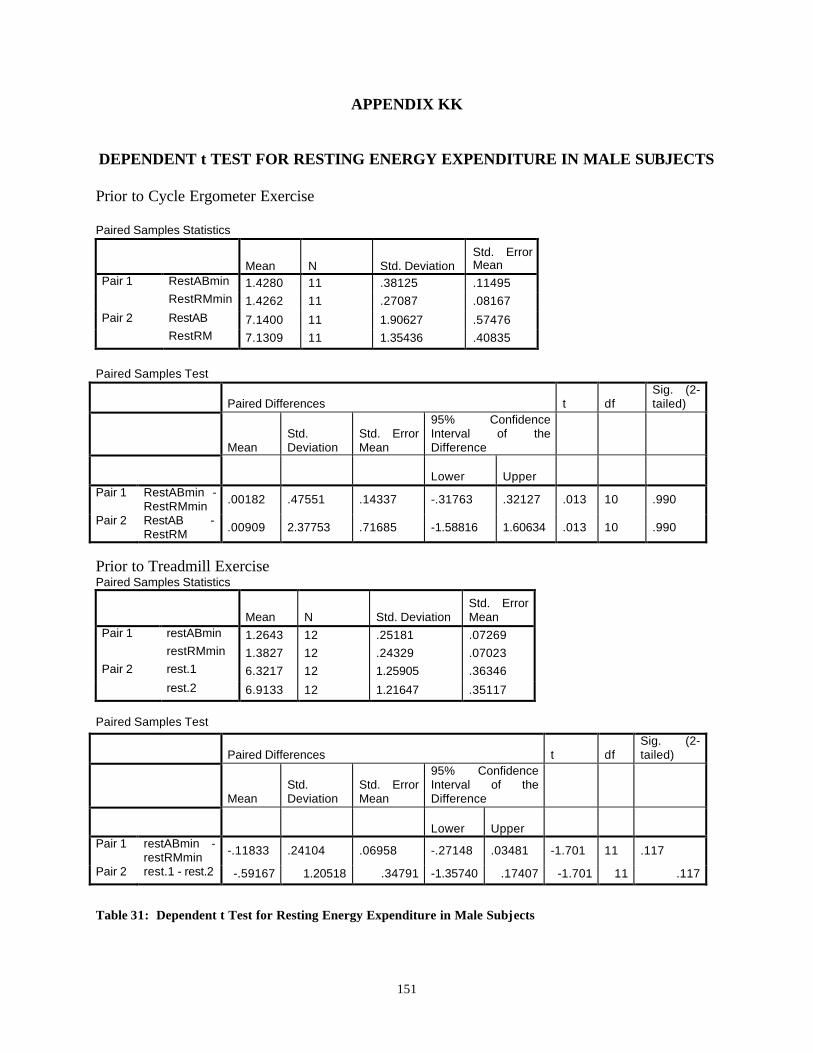
151
APPENDIX KK
DEPENDENT t TEST FOR RESTING ENERGY EXPENDITURE IN MALE SUBJECTS Prior to Cycle Ergometer Exercise Paired Samples Statistics
Mean N Std. Deviation Std. Error Mean
Pair 1 RestABmin 1.4280 11 .38125 .11495 RestRMmin 1.4262 11 .27087 .08167 Pair 2 RestAB 7.1400 11 1.90627 .57476 RestRM 7.1309 11 1.35436 .40835
Paired Samples Test
Paired Differences t df Sig. (2-tailed)
Mean Std. Deviation
Std. Error Mean
95% Confidence Interval of the Difference
Lower Upper Pair 1 RestABmin -
RestRMmin .00182 .47551 .14337 -.31763 .32127 .013 10 .990
Pair 2 RestAB - RestRM .00909 2.37753 .71685 -1.58816 1.60634 .013 10 .990
Prior to Treadmill Exercise Paired Samples Statistics
Mean N Std. Deviation Std. Error Mean
Pair 1 restABmin 1.2643 12 .25181 .07269 restRMmin 1.3827 12 .24329 .07023 Pair 2 rest.1 6.3217 12 1.25905 .36346 rest.2 6.9133 12 1.21647 .35117
Paired Samples Test
Table 31: Dependent t Test for Resting Energy Expenditure in Male Subjects
Paired Differences t df Sig. (2-tailed)
Mean Std. Deviation
Std. Error Mean
95% Confidence Interval of the Difference
Lower Upper Pair 1 restABmin -
restRMmin -.11833 .24104 .06958 -.27148 .03481 -1.701 11 .117
Pair 2 rest.1 - rest.2 -.59167 1.20518 .34791 -1.35740 .17407 -1.701 11 .117
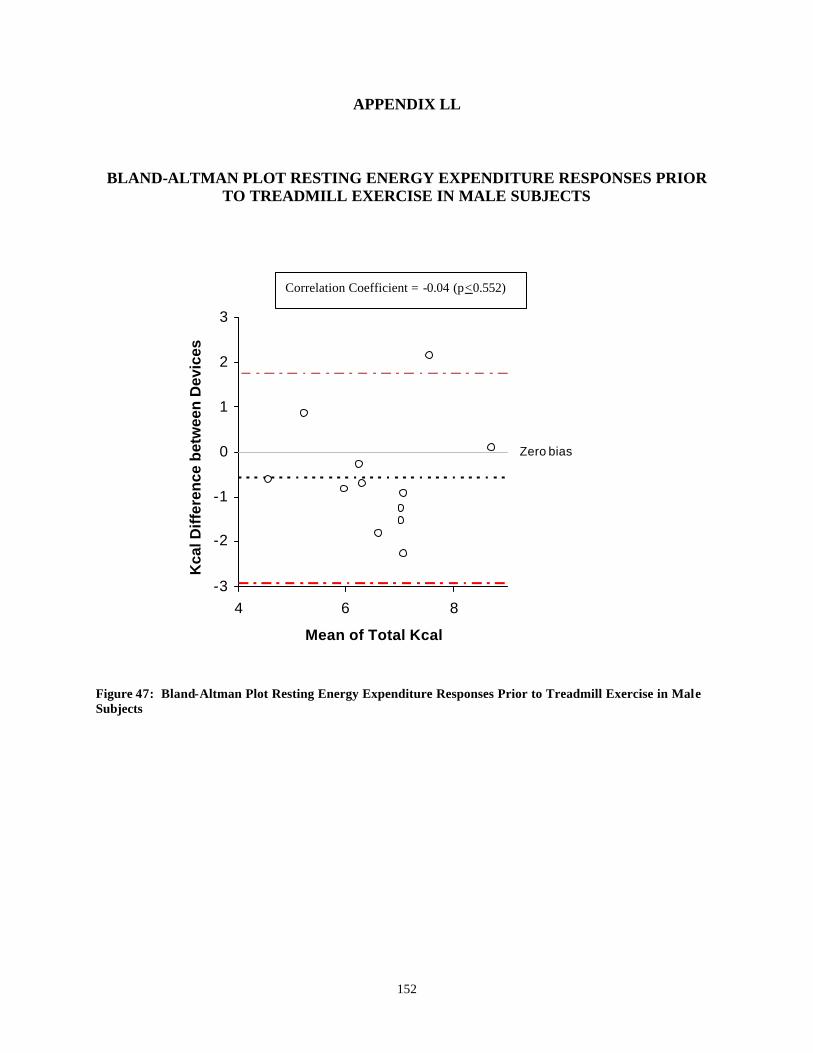
152
APPENDIX LL
BLAND-ALTMAN PLOT RESTING ENERGY EXPENDITURE RESPONSES PRIOR
TO TREADMILL EXERCISE IN MALE SUBJECTS
Zero bias
-3
-2
-1
0
1
2
3
4 6 8
Mean of Total Kcal
Kca
l Dif
fere
nce
bet
wee
n D
evic
es
Figure 47: Bland-Altman Plot Resting Energy Expenditure Responses Prior to Treadmill Exercise in Male Subjects
Correlation Coefficient = -0.04 (p<0.552)

153
APPENDIX MM
INTRACLASS CORRELATIONS FOR RESTING ENERGY EXPENDITURE IN MALE
SUBJECTS Prior to Cycle Ergometer Exercise: Intraclass Correlation Coefficient
Intraclass
Correlation(a) 95% Confidence Interval F Test with True Value 0
Lower Bound Upper Bound Value df1 df2 Sig Single Measures -.037(b) -.700 .576 .935 10.0 10 .541 Average Measures -.077(c) -4.661 .731 .935 10.0 10 .541
Two-way mixed effects model where people effects are random and measures effects are fixed. a Type A intraclass correlation coefficients using an absolute agreement definition. b The estimator is the same, whether the interaction effect is present or not. c This estimate is computed assuming the interaction effect is absent, because it is not estimable otherwise. Prior to Treadmill Exercise: Intraclass Correlation Coefficient
Intraclass
Correlation(a) 95% Confidence Interval F Test with True Value 0
Lower Bound Upper Bound Value df1 df2 Sig Single Measures .490(b) -.023 .814 3.220 11.0 11 .032 Average Measures .657(c) -.070 .898 3.220 11.0 11 .032
Two-way mixed effects model where people effects are random and measures effects are fixed. a Type A intraclass correlation coefficients using an absolute agreement definition. b The estimator is the same, whether the interaction effect is present or not. c This estimate is computed assuming the interaction effect is absent, because it is not estimable otherwise.
Table 32: Intraclass correlation for Resting Energy Expenditure in Male Subjects
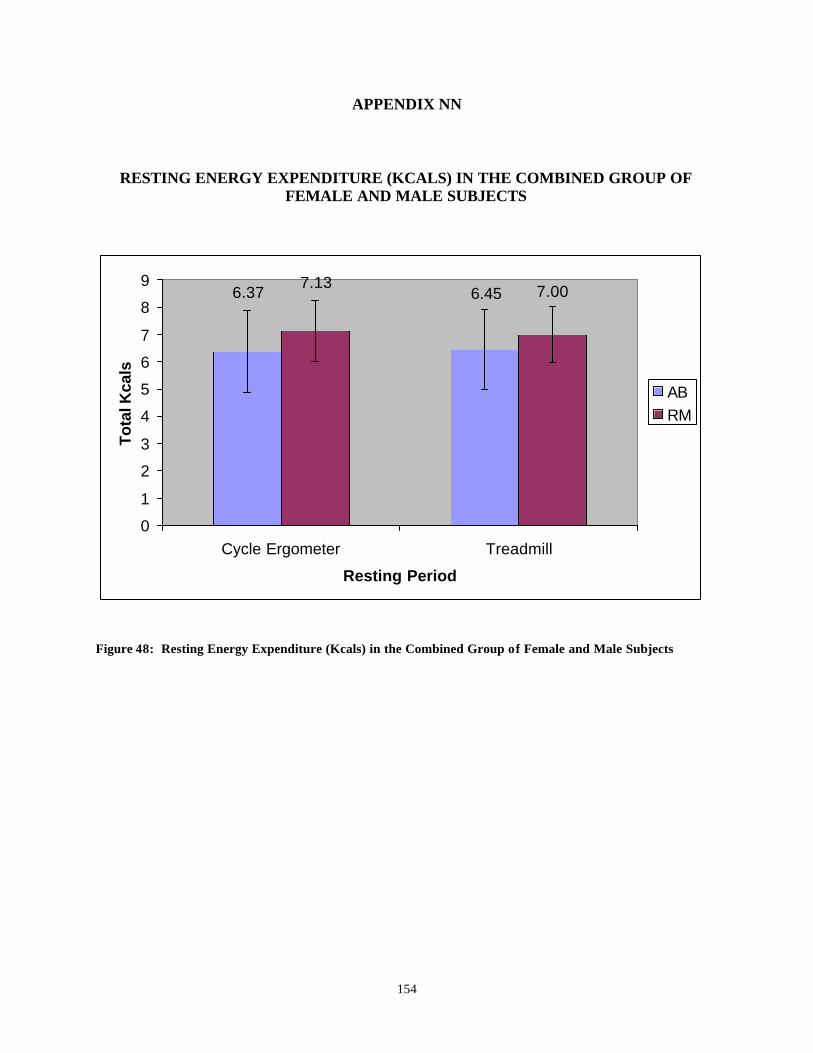
154
APPENDIX NN
RESTING ENERGY EXPENDITURE (KCALS) IN THE COMBINED GROUP OF
FEMALE AND MALE SUBJECTS
6.37 6.457.13 7.00
0
1
2
3
4
5
6
7
8
9
Cycle Ergometer Treadmill
Resting Period
Tota
l Kca
ls
ABRM
Figure 48: Resting Energy Expenditure (Kcals) in the Combined Group of Female and Male Subjects
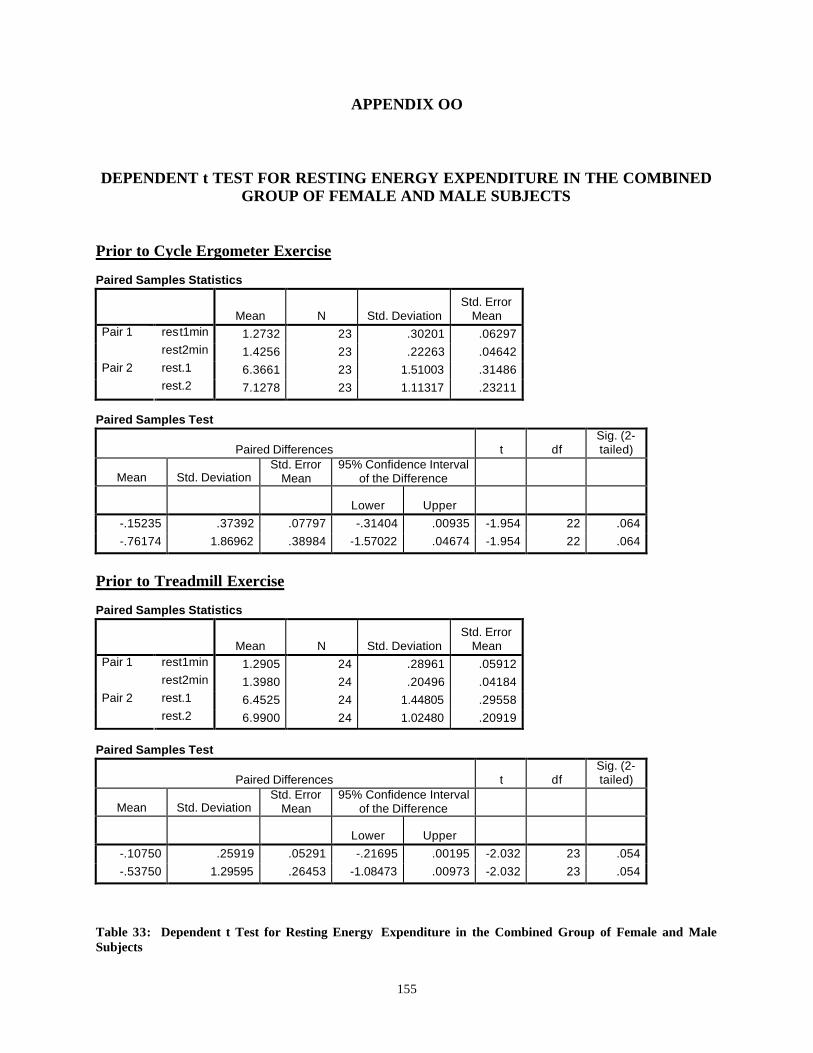
155
APPENDIX OO
DEPENDENT t TEST FOR RESTING ENERGY EXPENDITURE IN THE COMBINED
GROUP OF FEMALE AND MALE SUBJECTS Prior to Cycle Ergometer Exercise Paired Samples Statistics
Mean N Std. Deviation Std. Error
Mean rest1min 1.2732 23 .30201 .06297 Pair 1 rest2min 1.4256 23 .22263 .04642 rest.1 6.3661 23 1.51003 .31486 Pair 2 rest.2 7.1278 23 1.11317 .23211
Paired Samples Test
Paired Differences t df Sig. (2-tailed)
Mean Std. Deviation Std. Error
Mean 95% Confidence Interval
of the Difference
Lower Upper -.15235 .37392 .07797 -.31404 .00935 -1.954 22 .064 -.76174 1.86962 .38984 -1.57022 .04674 -1.954 22 .064
Prior to Treadmill Exercise Paired Samples Statistics
Mean N Std. Deviation Std. Error
Mean rest1min 1.2905 24 .28961 .05912 Pair 1 rest2min 1.3980 24 .20496 .04184 rest.1 6.4525 24 1.44805 .29558 Pair 2 rest.2 6.9900 24 1.02480 .20919
Paired Samples Test
Paired Differences t df Sig. (2-tailed)
Mean Std. Deviation Std. Error
Mean 95% Confidence Interval
of the Difference
Lower Upper -.10750 .25919 .05291 -.21695 .00195 -2.032 23 .054 -.53750 1.29595 .26453 -1.08473 .00973 -2.032 23 .054
Table 33: Dependent t Test for Resting Energy Expenditure in the Combined Group of Female and Male Subjects
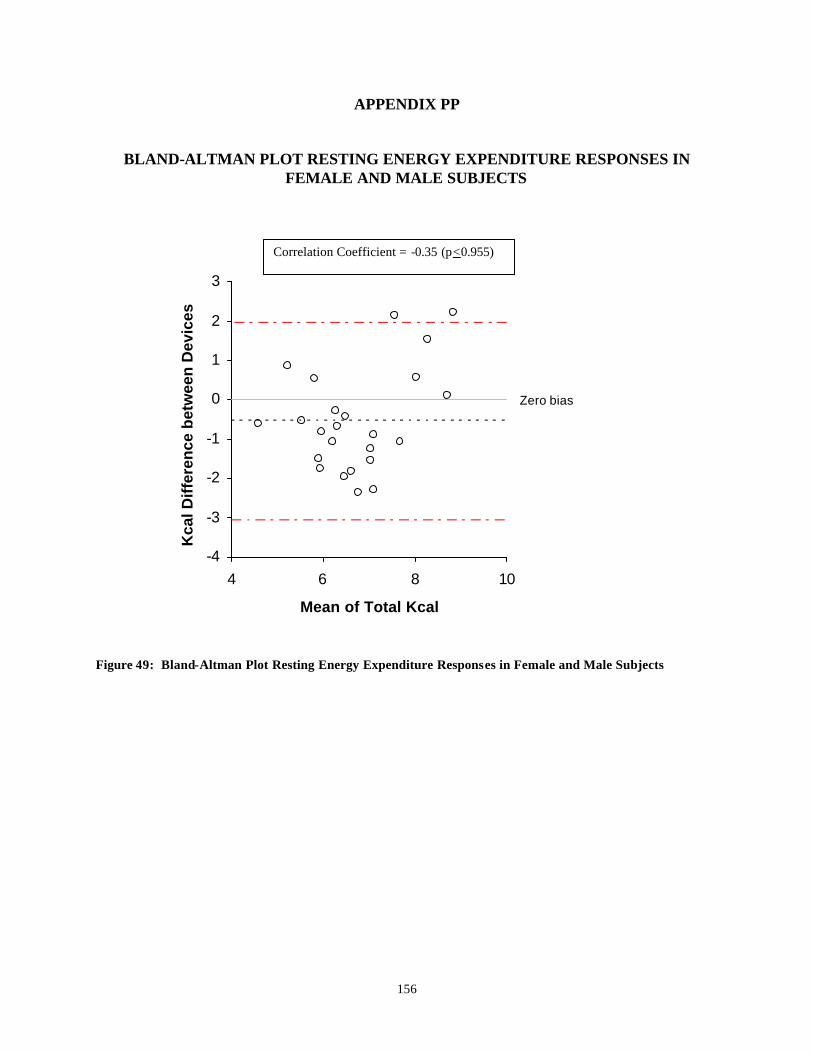
156
APPENDIX PP
BLAND-ALTMAN PLOT RESTING ENERGY EXPENDITURE RESPONSES IN
FEMALE AND MALE SUBJECTS
Zero bias
-4
-3
-2
-1
0
1
2
3
4 6 8 10
Mean of Total Kcal
Kca
l Dif
fere
nce
bet
wee
n D
evic
es
Figure 49: Bland-Altman Plot Resting Energy Expenditure Responses in Female and Male Subjects
Correlation Coefficient = -0.35 (p<0.955)
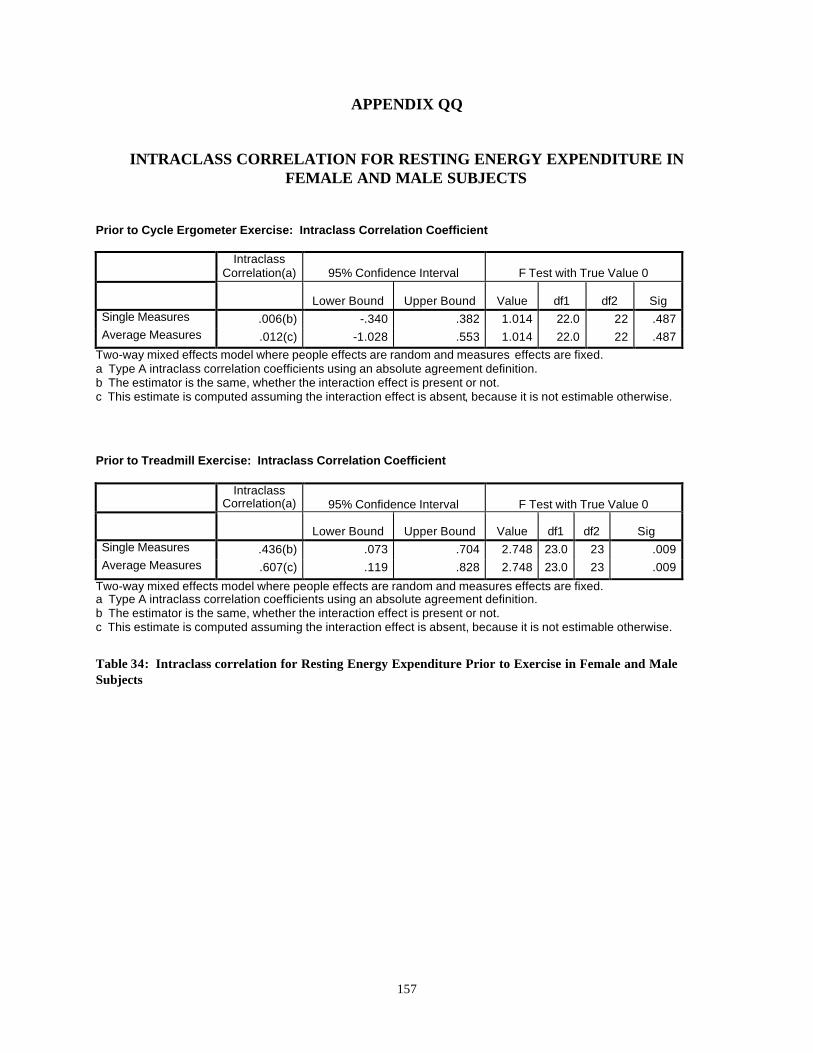
157
APPENDIX QQ
INTRACLASS CORRELATION FOR RESTING ENERGY EXPENDITURE IN FEMALE AND MALE SUBJECTS
Prior to Cycle Ergometer Exercise: Intraclass Correlation Coefficient
Intraclass
Correlation(a) 95% Confidence Interval F Test with True Value 0
Lower Bound Upper Bound Value df1 df2 Sig Single Measures .006(b) -.340 .382 1.014 22.0 22 .487 Average Measures .012(c) -1.028 .553 1.014 22.0 22 .487
Two-way mixed effects model where people effects are random and measures effects are fixed. a Type A intraclass correlation coefficients using an absolute agreement definition. b The estimator is the same, whether the interaction effect is present or not. c This estimate is computed assuming the interaction effect is absent, because it is not estimable otherwise. Prior to Treadmill Exercise: Intraclass Correlation Coefficient
Intraclass
Correlation(a) 95% Confidence Interval F Test with True Value 0
Lower Bound Upper Bound Value df1 df2 Sig Single Measures .436(b) .073 .704 2.748 23.0 23 .009 Average Measures .607(c) .119 .828 2.748 23.0 23 .009
Two-way mixed effects model where people effects are random and measures effects are fixed. a Type A intraclass correlation coefficients using an absolute agreement definition. b The estimator is the same, whether the interaction effect is present or not. c This estimate is computed assuming the interaction effect is absent, because it is not estimable otherwise.
Table 34: Intraclass correlation for Resting Energy Expenditure Prior to Exercise in Female and Male Subjects
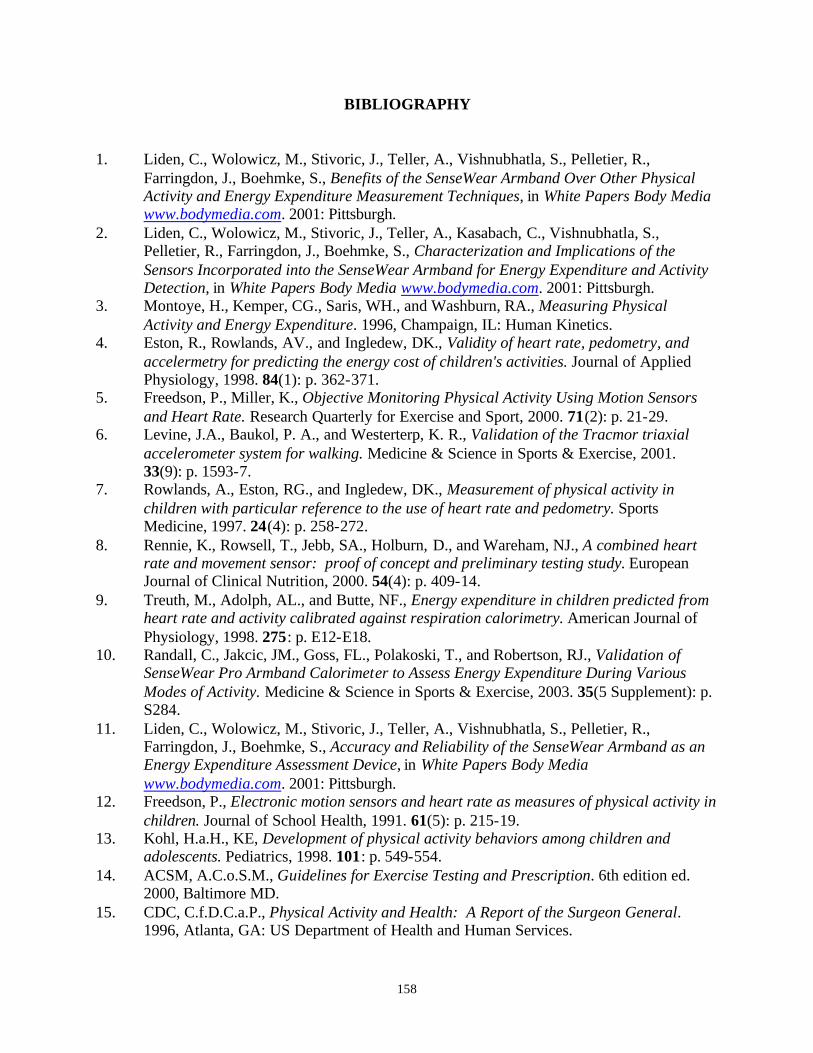
158
BIBLIOGRAPHY 1. Liden, C., Wolowicz, M., Stivoric, J., Teller, A., Vishnubhatla, S., Pelletier, R.,
Farringdon, J., Boehmke, S., Benefits of the SenseWear Armband Over Other Physical Activity and Energy Expenditure Measurement Techniques, in White Papers Body Media www.bodymedia.com. 2001: Pittsburgh.
2. Liden, C., Wolowicz, M., Stivoric, J., Teller, A., Kasabach, C., Vishnubhatla, S., Pelletier, R., Farringdon, J., Boehmke, S., Characterization and Implications of the Sensors Incorporated into the SenseWear Armband for Energy Expenditure and Activity Detection, in White Papers Body Media www.bodymedia.com. 2001: Pittsburgh.
3. Montoye, H., Kemper, CG., Saris, WH., and Washburn, RA., Measuring Physical Activity and Energy Expenditure. 1996, Champaign, IL: Human Kinetics.
4. Eston, R., Rowlands, AV., and Ingledew, DK., Validity of heart rate, pedometry, and accelermetry for predicting the energy cost of children's activities. Journal of Applied Physiology, 1998. 84(1): p. 362-371.
5. Freedson, P., Miller, K., Objective Monitoring Physical Activity Using Motion Sensors and Heart Rate. Research Quarterly for Exercise and Sport, 2000. 71(2): p. 21-29.
6. Levine, J.A., Baukol, P. A., and Westerterp, K. R., Validation of the Tracmor triaxial accelerometer system for walking. Medicine & Science in Sports & Exercise, 2001. 33(9): p. 1593-7.
7. Rowlands, A., Eston, RG., and Ingledew, DK., Measurement of physical activity in children with particular reference to the use of heart rate and pedometry. Sports Medicine, 1997. 24(4): p. 258-272.
8. Rennie, K., Rowsell, T., Jebb, SA., Holburn, D., and Wareham, NJ., A combined heart rate and movement sensor: proof of concept and preliminary testing study. European Journal of Clinical Nutrition, 2000. 54(4): p. 409-14.
9. Treuth, M., Adolph, AL., and Butte, NF., Energy expenditure in children predicted from heart rate and activity calibrated against respiration calorimetry. American Journal of Physiology, 1998. 275: p. E12-E18.
10. Randall, C., Jakcic, JM., Goss, FL., Polakoski, T., and Robertson, RJ., Validation of SenseWear Pro Armband Calorimeter to Assess Energy Expenditure During Various Modes of Activity. Medicine & Science in Sports & Exercise, 2003. 35(5 Supplement): p. S284.
11. Liden, C., Wolowicz, M., Stivoric, J., Teller, A., Vishnubhatla, S., Pelletier, R., Farringdon, J., Boehmke, S., Accuracy and Reliability of the SenseWear Armband as an Energy Expenditure Assessment Device, in White Papers Body Media www.bodymedia.com. 2001: Pittsburgh.
12. Freedson, P., Electronic motion sensors and heart rate as measures of physical activity in children. Journal of School Health, 1991. 61(5): p. 215-19.
13. Kohl, H.a.H., KE, Development of physical activity behaviors among children and adolescents. Pediatrics, 1998. 101: p. 549-554.
14. ACSM, A.C.o.S.M., Guidelines for Exercise Testing and Prescription. 6th edition ed. 2000, Baltimore MD.
15. CDC, C.f.D.C.a.P., Physical Activity and Health: A Report of the Surgeon General. 1996, Atlanta, GA: US Department of Health and Human Services.
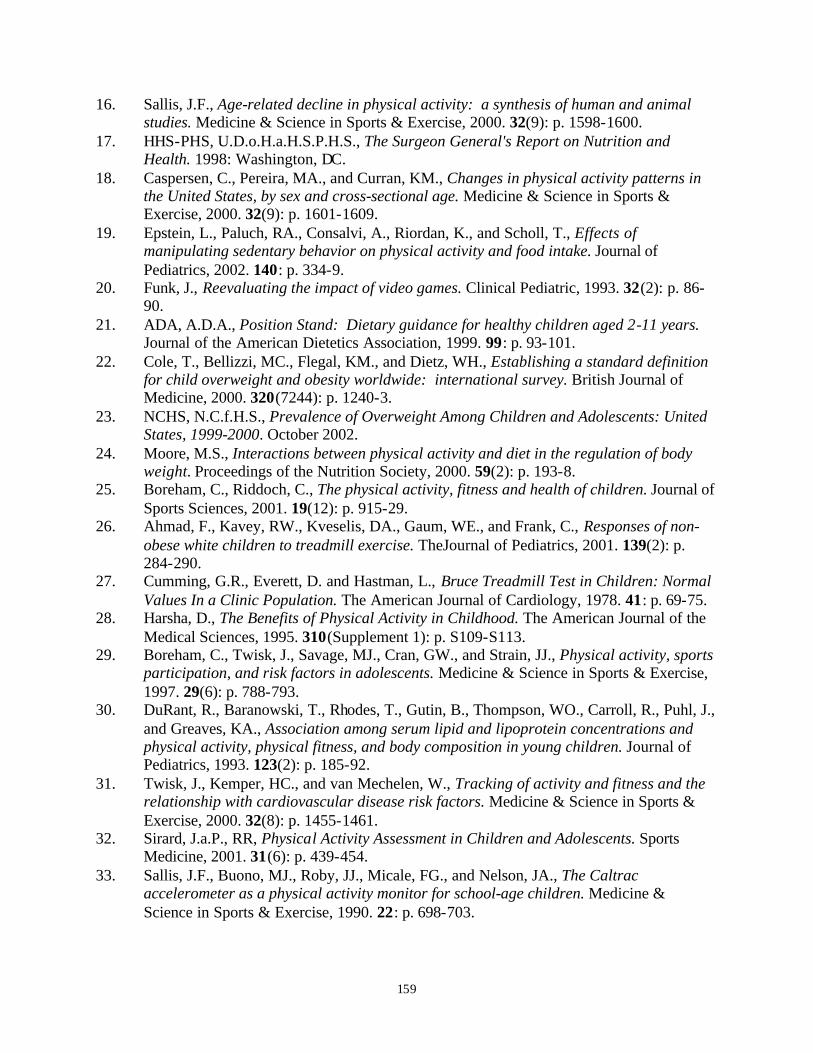
159
16. Sallis, J.F., Age-related decline in physical activity: a synthesis of human and animal studies. Medicine & Science in Sports & Exercise, 2000. 32(9): p. 1598-1600.
17. HHS-PHS, U.D.o.H.a.H.S.P.H.S., The Surgeon General's Report on Nutrition and Health. 1998: Washington, DC.
18. Caspersen, C., Pereira, MA., and Curran, KM., Changes in physical activity patterns in the United States, by sex and cross-sectional age. Medicine & Science in Sports & Exercise, 2000. 32(9): p. 1601-1609.
19. Epstein, L., Paluch, RA., Consalvi, A., Riordan, K., and Scholl, T., Effects of manipulating sedentary behavior on physical activity and food intake. Journal of Pediatrics, 2002. 140: p. 334-9.
20. Funk, J., Reevaluating the impact of video games. Clinical Pediatric, 1993. 32(2): p. 86-90.
21. ADA, A.D.A., Position Stand: Dietary guidance for healthy children aged 2-11 years. Journal of the American Dietetics Association, 1999. 99: p. 93-101.
22. Cole, T., Bellizzi, MC., Flegal, KM., and Dietz, WH., Establishing a standard definition for child overweight and obesity worldwide: international survey. British Journal of Medicine, 2000. 320(7244): p. 1240-3.
23. NCHS, N.C.f.H.S., Prevalence of Overweight Among Children and Adolescents: United States, 1999-2000. October 2002.
24. Moore, M.S., Interactions between physical activity and diet in the regulation of body weight. Proceedings of the Nutrition Society, 2000. 59(2): p. 193-8.
25. Boreham, C., Riddoch, C., The physical activity, fitness and health of children. Journal of Sports Sciences, 2001. 19(12): p. 915-29.
26. Ahmad, F., Kavey, RW., Kveselis, DA., Gaum, WE., and Frank, C., Responses of non-obese white children to treadmill exercise. TheJournal of Pediatrics, 2001. 139(2): p. 284-290.
27. Cumming, G.R., Everett, D. and Hastman, L., Bruce Treadmill Test in Children: Normal Values In a Clinic Population. The American Journal of Cardiology, 1978. 41: p. 69-75.
28. Harsha, D., The Benefits of Physical Activity in Childhood. The American Journal of the Medical Sciences, 1995. 310(Supplement 1): p. S109-S113.
29. Boreham, C., Twisk, J., Savage, MJ., Cran, GW., and Strain, JJ., Physical activity, sports participation, and risk factors in adolescents. Medicine & Science in Sports & Exercise, 1997. 29(6): p. 788-793.
30. DuRant, R., Baranowski, T., Rhodes, T., Gutin, B., Thompson, WO., Carroll, R., Puhl, J., and Greaves, KA., Association among serum lipid and lipoprotein concentrations and physical activity, physical fitness, and body composition in young children. Journal of Pediatrics, 1993. 123(2): p. 185-92.
31. Twisk, J., Kemper, HC., and van Mechelen, W., Tracking of activity and fitness and the relationship with cardiovascular disease risk factors. Medicine & Science in Sports & Exercise, 2000. 32(8): p. 1455-1461.
32. Sirard, J.a.P., RR, Physical Activity Assessment in Children and Adolescents. Sports Medicine, 2001. 31(6): p. 439-454.
33. Sallis, J.F., Buono, MJ., Roby, JJ., Micale, FG., and Nelson, JA., The Caltrac accelerometer as a physical activity monitor for school-age children. Medicine & Science in Sports & Exercise, 1990. 22: p. 698-703.
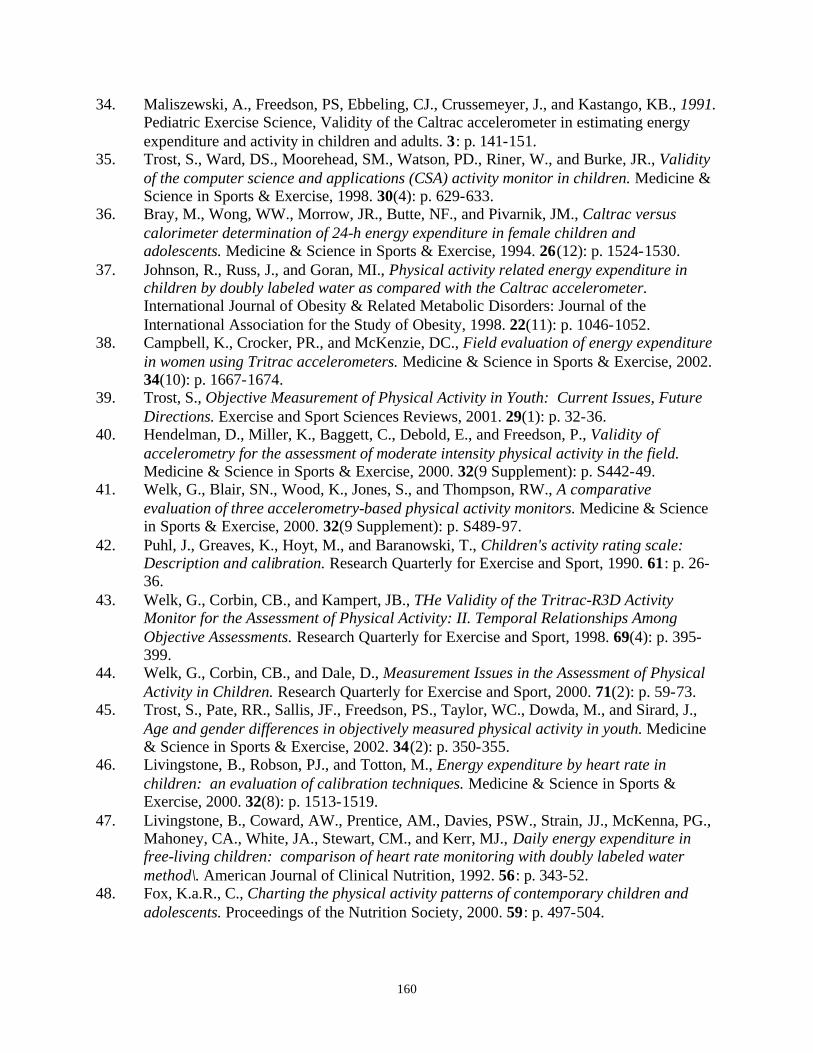
160
34. Maliszewski, A., Freedson, PS, Ebbeling, CJ., Crussemeyer, J., and Kastango, KB., 1991. Pediatric Exercise Science, Validity of the Caltrac accelerometer in estimating energy expenditure and activity in children and adults. 3: p. 141-151.
35. Trost, S., Ward, DS., Moorehead, SM., Watson, PD., Riner, W., and Burke, JR., Validity of the computer science and applications (CSA) activity monitor in children. Medicine & Science in Sports & Exercise, 1998. 30(4): p. 629-633.
36. Bray, M., Wong, WW., Morrow, JR., Butte, NF., and Pivarnik, JM., Caltrac versus calorimeter determination of 24-h energy expenditure in female children and adolescents. Medicine & Science in Sports & Exercise, 1994. 26(12): p. 1524-1530.
37. Johnson, R., Russ, J., and Goran, MI., Physical activity related energy expenditure in children by doubly labeled water as compared with the Caltrac accelerometer. International Journal of Obesity & Related Metabolic Disorders: Journal of the International Association for the Study of Obesity, 1998. 22(11): p. 1046-1052.
38. Campbell, K., Crocker, PR., and McKenzie, DC., Field evaluation of energy expenditure in women using Tritrac accelerometers. Medicine & Science in Sports & Exercise, 2002. 34(10): p. 1667-1674.
39. Trost, S., Objective Measurement of Physical Activity in Youth: Current Issues, Future Directions. Exercise and Sport Sciences Reviews, 2001. 29(1): p. 32-36.
40. Hendelman, D., Miller, K., Baggett, C., Debold, E., and Freedson, P., Validity of accelerometry for the assessment of moderate intensity physical activity in the field. Medicine & Science in Sports & Exercise, 2000. 32(9 Supplement): p. S442-49.
41. Welk, G., Blair, SN., Wood, K., Jones, S., and Thompson, RW., A comparative evaluation of three accelerometry-based physical activity monitors. Medicine & Science in Sports & Exercise, 2000. 32(9 Supplement): p. S489-97.
42. Puhl, J., Greaves, K., Hoyt, M., and Baranowski, T., Children's activity rating scale: Description and calibration. Research Quarterly for Exercise and Sport, 1990. 61: p. 26-36.
43. Welk, G., Corbin, CB., and Kampert, JB., THe Validity of the Tritrac-R3D Activity Monitor for the Assessment of Physical Activity: II. Temporal Relationships Among Objective Assessments. Research Quarterly for Exercise and Sport, 1998. 69(4): p. 395-399.
44. Welk, G., Corbin, CB., and Dale, D., Measurement Issues in the Assessment of Physical Activity in Children. Research Quarterly for Exercise and Sport, 2000. 71(2): p. 59-73.
45. Trost, S., Pate, RR., Sallis, JF., Freedson, PS., Taylor, WC., Dowda, M., and Sirard, J., Age and gender differences in objectively measured physical activity in youth. Medicine & Science in Sports & Exercise, 2002. 34(2): p. 350-355.
46. Livingstone, B., Robson, PJ., and Totton, M., Energy expenditure by heart rate in children: an evaluation of calibration techniques. Medicine & Science in Sports & Exercise, 2000. 32(8): p. 1513-1519.
47. Livingstone, B., Coward, AW., Prentice, AM., Davies, PSW., Strain, JJ., McKenna, PG., Mahoney, CA., White, JA., Stewart, CM., and Kerr, MJ., Daily energy expenditure in free-living children: comparison of heart rate monitoring with doubly labeled water method\. American Journal of Clinical Nutrition, 1992. 56: p. 343-52.
48. Fox, K.a.R., C., Charting the physical activity patterns of contemporary children and adolescents. Proceedings of the Nutrition Society, 2000. 59: p. 497-504.
161
49. Emons, H., Groenenboom, DC., Westerkerp, KR., and Saris, WHM., Comparison of heart rate monitoring combined with indirect calorimetry and the doubly labelled water (2H218O) method for the measurement of energy expnditure in children. European Journal of Applied Physiology, 1992. 65: p. 99-103.
50. Ekelund, U., Yngve, A., Westerterp, K., and Sjostrom, M., Energy expenditure assessed by heart rate and doubly labeled water in young athletes. Medicine & Science in Sports & Exercise, 2002. 34(8): p. 1360-1366.
51. Schoeller, D., Recent Advances from Application of Doubly Labeled Water to Measurement of Human Energy Expenditure. Journal of Nutrition, 1999. 129: p. 1765-1768.
52. Ekelund, U., Sjostrom, M., Yngve, A., Poortvliet, E., Nilsson, A., Froberg, K., Wedderkopp, N. and Westerterp, K., Physical activity assessed by activity monitor and doubly labeled water in children. Medicine & Science in Sports & Exercise, 2001. 33(2): p. 275-281.
53. Schoeller, D.A., and Webb, P., Five-day comparison of the doubly labeled water method with respiratory gas exchange. American Journal of Clinical Nutrition, 1984. 40: p. 153-158.
54. Schoeller, D., and vanSanten, E., Measurement of energy expenditure in humans by doubly labeled water method. Journal of Applied Physiology, 1982. 53(4): p. 955-959.
55. Schoeller, D., Taylor, PB., and Shay, K, Analytic requirements for the doubly labeled water method. Obesity Research, 1995. 3 Supplement(1): p. 15-20.
56. Seale, J., Rumpler, WV., Conway, JM. and Miles, CW., Comparison of doubly labeled water, intake-balance, and direct- and indirect calorimetry methods for measuring energy expenditure in adult men. American Journal of Clinical Nutrition, 1990. 52: p. 66-71.
57. Seale, J., Conway, JM. and Canary, JJ., Seven-day validation of doubly labeled water method using indirect room calorimetry. Journal of Applied Physiology, 1993. 74(1): p. 402-409.
58. Ainslie, P., Reilly, T, and Westerkerp, KR., Estimating Human Energy Expenditure A Review of Techniques with Particular Reference to Doubly Labeled Water. Sports Medicine, 2003. 33(9): p. 683-698.
59. Goran, M.I., Measurement Issues Related to Studies of Childhood Obesity: Assessment of Body Composition, Body Fat Distribution, Physical Activity, and Food Intake. Pediatrics, 1998. 101: p. 505-518.
60. Friedman, A.a.J., RK, Doubly Labeled Water New Advances and Applications for the Practitioner. Nutrition Today, 2002. 37(6): p. 243-48.
61. Spurr, G.B., Prentice, A.M., Murgoatroyd, P.R., Goldberg, G.R., Reina, J.C. and Christman, N.T., Enegy expenditure from minute by minute heart rate recording: comparison with indirect calorimetry. American Journal of Clinical Nutrition, 1988. 48: p. 552-559.
62. Chen, K.a.S., M., Improving energy expenditure estimation by using triaxial accelerometer. Journal of Applied Physiology, 1997. 83(6): p. 2212-2122.
63. Ferrannini, E., The Theoretical Base of Indirect Calorimetry: A Review. Metabolism, 1988. 37(3): p. 287-301.
64. Dauncey, M., Metabolic effects of altering the 24 hour energy intake in man, using direct and indirect calorimetry. British Journal of Nutrition, 1980. 43: p. 257-269.
162
65. Moon, J.a.B., NF, Combined heart rate and activity improve estimates of oxygen consumption and carbon dioxide production rates. Journal of Applied Physiology, 1996. 81(4): p. 1754-1761.
66. Haskell, W., Yee, MC., Evans, A. and Irby, PJ., Simultaneous measurement of heart rate and body motion to quantitate physical activity. Medicine & Science in Sports & Exercise, 1993. 25(1): p. 109-115.
67. Fruin, M.a.R., JW., Reliability and validity of a multisensor armband in estimating resting and exercise energy expenditure. Medicine & Science in Sports & Exercise, 2003. 35(5 Supplement): p. S 285.
68. King, G., Torres, N., Potter, C., Coleman, KJ., Accuracy of a physiological body monitor to estimate expenditure during treadmill exercise. Medicine & Science in Sports & Exercise, 2003. 35(5): p. S285.
69. de Leeuw, J., Statistics: The Study of Stability in Variation. 2002, UCLA Statistics Department: Los Angeles.
70. Altman, D.G.a.B., J.M., Measurement in Medicine: the Analysis of Method Comparison Studies. The Statistician, 1983. 32: p. 307-317.
71. Jakicic, J.M., Marcus, M., Gallagher, K.I., Randall, C., Thomas, E., Goss, F.L., Robertson, R.J., Evaluation of the SenseWear Pro Armband to Assess Energy Expenditure during Exercise. Medicine & Science in Sports & Exercise, 2004. 36(5): p. 897-904.
72. Fruin, M.a.R., JW, Validity of a Multi-Sensor Armband in Estimating Rest and Exercise Energy Expenditure. Medicine & Science in Sports & Exercise, 2004. 36(6): p. 1063-1069.
73. Yngve, A., Nilsson, A., Sjostrom, M., Ekelund, U., Effect of Monitor Placement and of Activity Setting on the MTI Accelerometer Output. Medicine & Science in Sports & Exercise, 2003. 35(2): p. 320-326.
74. Nichols, J.F., Morgan, C. G., Sarkin, J. A., Sallis, J. F. and Calfas, K. J., Validity, reliability, and calibration of the Tritrac accelerometer as a measure of physical activity.[comment]. Medicine & Science in Sports & Exercise, 1999. 31(6): p. 908-12.
75. King, G.A., Torres, N., Potter, C. and Coleman, K.J., Comparison of Activity Monitors to Estimate Energy Cost of Treadmill Exercise. Medicine & Science in Sports & Exercise, 2004. 36(7): p. 1244-1251.
76. Mercer, J.A., Devita, P., Derrick, T.R., Bates, B.T., Individual Effects of Stride Length and Frequency on Shock Attenuation during Running. Medicine & Science in Sports & Exercise, 2003. 35(2): p. 307-313.
77. McCardle, W.D., Katch, F.I., Katch, V.L., Energy Expenditure during Rest and Physical Activity. 2nd ed. Essentials of Exercise Physiology, ed. E. Johnson. 2000, Baltimore, MD: Lippincott Williams & Wilkins.
78. Leenders, N., Sherman, W.M., Nagaraja, H.N., Kien, C.L., Evaluation of methods to assess physical activity in free-living conditions. Medicine & Science in Sports & Exercise, 2001. 33(7): p. 1233-1240.
79. Kerrigan, D.C., Todd, M.K., Croce, U.D., Gender Differences in Joint Biomechanics During Walking: Normative Study in Young Adults. American Journal of Physical Medicine & Rehabilitation, 1998. 77(1): p. 2-7.
163
80. Smith, L.K., Lelas, J.L., Kerrigan, D.C., Gender Differences in pelvic motions and center of mass displacement during walking: stereotypes quantified. Journal of Womens Health Gender Based Medicine, 2002. 11(5): p. 453-8.
81. Brooks, G.A., Fahey, T.D., White, T.P., Gender Differences in Physical Performance. 2nd ed. Exercise Physiology, ed. S. Beauparlant. 1996, Mountain View, CA: Mayfield Publishing.
82. Medicine, I.o., Energy, in Dietary Reference Intakes for Energy, Carbohydrates, Fiber, Fat, Fatty Acids, Cholesterol, Protein and Amino Acids (Macronutrients). 2002, The National Academies Press: Washington, DC. p. 134-146.
83. Kapoor, G., Aneja, S., Kumari, S., Mehta, S.C., Triceps skinfold thickness in adolescents. Indian Journal of Medical Research, 1991. 94: p. 281-5.
84. Westerterp, K.R., Physical activity assessment with accelerometers. International Journal of Obesity & Related Metabolic Disorders: Journal of the International Association for the Study of Obesity, 1999. 23(Supplement 3): p. S45-9.
85. Jakicic, J.M., Winters, C., Lagally, K., Joyce, H., Robertson, R.J., Wing, R.R., The accuracy of the TriTrac-R3D accelerometer to estimate energy expenditure. Medicine & Science in Sports & Exercise, 1999. 31(5): p. 747-754.
86. Fruin, M.a.R., JW, Reliability and Validity of a Multisensor Armband in Estimating Resting and Exercise Energy Expenditure. Medicine & Science in Sports & Exercise, 2003. 35 (5 Supplement): p. S:285.
87. Bassett, D.R., Ainsworth, B.E., Swartz, A.M., Strath, S.J., O'Brien, W.L., King, G.A., Validity of four motion sensors in measuring moderate intensity physical activity. Medicine & Science in Sports & Exercise, 2000. 32(9): p. S471-480.


![Reza Hagel_ water proof mobile and armband 2002 [Compatibility Mode]](https://static.fdocuments.in/doc/165x107/55c4cdddbb61eb5a0f8b4634/reza-hagel-water-proof-mobile-and-armband-2002-compatibility-mode.jpg)