
VALIDATION OF DERIVED EQUATION USING ENERGY · PDF filebuckling loads, has been studied by...
21
217 VALIDATION OF DERIVED EQUATION USING ENERGY TECHNIQUE FOR CALCULATING THE CRITICAL BUCKLING LOAD FOR INTERMEDIATE AND LONG COLUMNS Ahmed Naif Al-Khazaraji 1 , Samir Ali Al-Rabii 2 , * Hameed Shamkhi Al-Khazaali 3 1) Assist Prof., Department of Mechanical Engineering, University of Technology, Baghdad, Iraq. 2) Assist Prof., Department of Mechanical Engineering, University of Technology, Baghdad, Iraq. 3) Assist Lect., Department of Machines and Equipment, Institute of Technology, Middle Technical University, Baghdad, Iraq. Abstract: A new equation has been derived using energy technique (dummy load method) to describe the buckling behavior of intermediate and long columns under dynamic buckling loads compression load and under dynamic combined load with consider of the initial imperfections of the columns and the effect of eccentricity. The results of this equation are compared with the experimentally results of 40 specimens of AISI 303 stainless steel intermediate and long columns tested under dynamic compression loading (compression and torsion) and under dynamic combined loading (compression, bending, and torsion) by using a rotating buckling test machine, and it be found that the derived equation may be used to predict of the theoretical critical buckling load ( ) under both dynamic compression and combined load with maximum percentage error is 19.3% and 16.8%, respectively. Keywords: Energy technique, buckling load, columns, dummy load method. ثبات ا صحة معادلة مشتقةستخدام با تقنيةلطاقة ا لحساب حملنبعاج ا الحرجعمدة ل المتوسطةطول ال وطويلة الصة: الخ تم في هذا البحثاق اشتق معادلة لوصف سلوكنبعاج اكينامي الديعمدة ل المتوسطةطول الطويلة والحت ت تأثير حملنضغاط اكينامي الديحمل والكينامي الدي المركب بأستخدام تقنيةلطاقة ا معخذ ا بنظرعتبار ا تأثير كل مننحراف اولي العمود ل وتأثيرمحورية ال في تسليط حملنضغاط ا. لنتائج ا النظريةحمل لنبعاج ا الحرج منذه هلمعادلة ا تم مقارنتها معلنتائج اعملية الحمل لنبعاج ا الحرج والتي تمحصول ال عليها بفحص40 عينة من اعمدةصلب القاوم الملصدأ لAISI 303 طويلة ال و المتوسطةطول الحت وت تأثيركل من حملنضغاط اكينامي الدي( حمل ضغط محوري زائد حمل التواء) حمل والكينامي الدي المركب( حمل ضغط محوري وحملحناء ان زائد حمل التواء) ، حيث وجد انلمعادلة ا المشتقة يمكن انستخدم تلتنبؤ ل بمقدار حملنبعاج ا النظريعمدة لحت ت تأثير حملنضغاط اكينامي الديحمل والكينامي الدي المركب وبأعلى نسبة مئويةلخطأ ل19.3 % و16.8 % على التوالي. 1. Introduction A columns are generally categorized into two groups: long and intermediate; sometimes the short compression block is considered to be a third group. The distinction between the three is determined by their behavior. Long columns fail by *Corresponding Author [email protected] Vol. 20, No. 04, July 2016 ISSN 2520-0917 www.jeasd.org
-
Upload
doankhuong -
Category
Documents
-
view
216 -
download
2
Transcript of VALIDATION OF DERIVED EQUATION USING ENERGY · PDF filebuckling loads, has been studied by...

Journal of Engineering and Sustainable Development, Vol. 20, No.04, July 2016 www.jeasd.org (ISSN 2520-0917)
217
;
VALIDATION OF DERIVED EQUATION USING ENERGY
TECHNIQUE FOR CALCULATING THE CRITICAL BUCKLING
LOAD FOR INTERMEDIATE AND LONG COLUMNS
Ahmed Naif Al-Khazaraji
1, Samir Ali Al-Rabii
2, * Hameed Shamkhi Al-Khazaali
3
1) Assist Prof., Department of Mechanical Engineering, University of Technology, Baghdad, Iraq.
2) Assist Prof., Department of Mechanical Engineering, University of Technology, Baghdad, Iraq.
3) Assist Lect., Department of Machines and Equipment, Institute of Technology, Middle Technical
University, Baghdad, Iraq.
Abstract: A new equation has been derived using energy technique (dummy load method) to describe
the buckling behavior of intermediate and long columns under dynamic buckling loads compression load
and under dynamic combined load with consider of the initial imperfections of the columns and the
effect of eccentricity. The results of this equation are compared with the experimentally results of 40
specimens of AISI 303 stainless steel intermediate and long columns tested under dynamic compression
loading (compression and torsion) and under dynamic combined loading (compression, bending, and
torsion) by using a rotating buckling test machine, and it be found that the derived equation may be used
to predict of the theoretical critical buckling load (𝑃𝑐𝑟) under both dynamic compression and combined
load with maximum percentage error is 19.3% and 16.8%, respectively.
Keywords: Energy technique, buckling load, columns, dummy load method.
لالعمدة الحرج االنبعاج حمل لحساب الطاقة تقنية باستخدام مشتقة معادلة صحة اثبات
الطويلة و الطول المتوسطة
حمل تأثير تحت والطويلة الطول المتوسطة لالعمدة الديناميكي االنبعاج سلوك لوصف معادلة اشتقاق البحث هذا في تم الخالصة:
للعمود االولي االنحراف من كل تأثير االعتبار بنظر االخذ مع الطاقة تقنية بأستخدام المركب الديناميكي والحمل الديناميكي االنضغاط
لحمل العملية النتائج مع مقارنتها تم المعادلة هذه من الحرج االنبعاج لحمل النظرية النتائج. االنضغاط حمل تسليط في الالمحورية وتأثير
وتحت الطول المتوسطةو الطويلة AISI 303 للصدأ المقاوم الصلب اعمدة من عينة 40 بفحص عليها الحصول تم والتي الحرج االنبعاج
وحمل محوري ضغط حمل) المركب الديناميكي والحمل( التواء حمل زائد محوري ضغط حمل) الديناميكي االنضغاط حمل من تأثيركل
حمل تأثير تحت لالعمدة النظري االنبعاج حمل بمقدار للتنبؤ تستخدم ان يمكن المشتقة المعادلة ان وجد حيث ،(التواء حمل زائد انحناء
.التوالي على% 16.8 و% 19.3 للخطأ مئوية نسبة وبأعلى المركب الديناميكي والحمل الديناميكي االنضغاط
1. Introduction
A columns are generally categorized into two groups: long and intermediate;
sometimes the short compression block is considered to be a third group. The
distinction between the three is determined by their behavior. Long columns fail by
*Corresponding Author [email protected]
Vol. 20, No. 04, July 2016
ISSN 2520-0917
www.jeasd.org
Journal of Engineering and Sustainable Development, Vol. 20, No.04, July 2016 www.jeasd.org (ISSN 2520-0917)
218
buckling or excessive lateral bending; intermediate columns, by a combination of
crushing and buckling; and short compression blocks, by crushing [1]. The
phenomenon of buckling is not limited to columns. Buckling can occur in beams,
plates, shells, and other structural members under a variety of loading conditions [2, 3].
Above the elastic limit of a material the modulus of elasticity becomes a function of
the stress. In other word, one should know the operating level of the stress before one
can find out the modulus. This makes the analysis in the inelastic region complicated
[4]. In case of columns with intermediate slenderness, i.e., columns which are stable
for stresses higher than the proportionality limit, the failure of intermediate columns
occurs subsequent to the onset of inelastic behavior [5]. The main causes of bending in
the columns are lack of straightness in member, i.e., initial curvature in the member,
eccentricity of the load and non-homogeneity in the material of the column. Every
column will have at least small degree of eccentricity [6]. Many aircraft structural
component, structural connections between of boosters for space vehicles, certain
members in bridge trusses, and structural frameworks of buildings are common
examples of columns. Linkage in oscillating or reciprocating machines may also fail by
buckling [7, 8]. Quite often the buckling of a column can lead to a sudden and
catastrophic failure of a structure or mechanism, and has a result, special attention must
be given to the design of columns so that they can safely support their intended
loadings without buckling [9]. The buckling of solid and hollow CK35 and CK45 alloy
steel columns under dynamic compression, bending, and combined loading of them has
been studied theoretically and experimentally. A mathematical model has been derived
in order to model the column buckling problem and determine the number of cycles to
failure for short, intermediate, and long columns subjected to single and combined
loads [10]. A series of experimentally tests on cold formed austenitic stainless steel
square, rectangular, and circular hollow section members to examine the buckling
behavior of columns and beams under effect of gradually increased single and
combined loads (compression, bending, and compression-bending) with two types of
ends conditions pin-ends and fixed-ends [11]. A formula has been suggested for beam-
column interaction using second order in-plane elastic theory analysis. This theoretical
formula was derived to cover, with maximum continuities, the beam column cross-
section classes, stability resistance, and pure elastic and pure plastic behavior [12]. The
elastic buckling behavior of a cantilever straight I-column subjected to various loads
was described by using derived differential equations that based on Yang and Kuos
nonlinear virtual work equation for a 3D straight solid beam. The total potential energy
and virtual work were expressed and then utilized the variation principle to derive the
buckling differential equations for an I-column element [13]. A unified formula for
solid and hollow columns has been derived, on the basis of the theory of elasticity, to
predict the behavior of circular concrete-filled steel tube under axial compression load.
Analytical solution was used to develop unified formula and linear superposition
method was used to deal with the problem of the elastic stability of the composite
columns [14]. The buckling behavior of columns, including the combined effects of
shear force and bending deformations and semi-rigid connections on the elastic critical
buckling loads, has been studied by using three different approaches Engesser,

Journal of Engineering and Sustainable Development, Vol. 20, No.04, July 2016 www.jeasd.org (ISSN 2520-0917)
219
Haringx, and Euler. Classic column cases (i.e. hinged-hinged column, clamped-
clamped column, clamped-free column, and clamped-hinged column) were
investigated using a “simplifies form” of derived equations depending on boundary
conditions of column ends [15].
This paper would like to validate a new derived equation, on the basis of the energy
technique, to describe the dynamic buckling behavior and to predict the critical
buckling load of intermediate and long columns, including the effects of initial
imperfections and eccentricity, by comparing the results, from this derived equation
with experimental results of series of stainless steel (AISI 303) circular cross-section
columns, of different slenderness ratios, subjected to dynamic compression loading
(compression-torsion) and dynamic combined loading (compression-bending-torsion).
2. Theory and Mathematical Model
2.1. Energy Technique in Deflection analysis
Many practical engineering problem involve the combination of a large system of
simple elements in a complex and often highly statically indeterminate structure [16].
As an alternative to the methods based on differential equations, the analysis of stress
and deformation can be accomplished through the use of energy methods. The latter
are predicated on the fact that the equations governing a given stress or strain
configuration are derivable from consideration of the minimization of energy
associated with deformation, stress, or deformation and stress. Application of energy
techniques are quite powerful in situations involving a variety of shapes and variable
cross sections and a complex problems involving elastic stability and multielement
structures [5]. Castigliano’s second theorem (Castigliano’s method) provides a simple
and straightforward approach to the deflection analysis of a complex collection of
many engineering problems involve linear load-deflection relations where the forms of
the strain energy are known. This theorem state that: when an elastic body subjected to
applied forces and reactions, the partial derivative of the strain energy with respect to
an applied force 𝑁𝑖(𝑖 = 1, 2, 3, … , 𝑛) is equal to the component of displacement at the
point of the force that is in the direction of the force (𝛿𝑖).Thus
𝛿𝑖 =𝜕𝑈
𝜕𝑁𝑖 (1)
In applying Castigliano’s theorem, the strain energy (U) must be expressed as a
function of the load [5]. When it is necessary to determine the deflection at a point at
which no load acts, a dummy load is introduced at the required point in the direction of
the desired displacement. The displacement is then found by Castigliano’s theorem,
equating the dummy load to zero in the final result [5, 17].
The expression for the strain energy (U) in a straight or curved slender bar subjected to
a number of common loads (axial force P, bending moment Mz, shearing force V, and
torque 𝑀𝑡) is given by [5]

Journal of Engineering and Sustainable Development, Vol. 20, No.04, July 2016 www.jeasd.org (ISSN 2520-0917)
220
𝑈 = ∫𝑃2𝑑𝑥
2𝐸𝐴+ ∫
𝑀𝑧2𝑑𝑥
2𝐸𝐼𝑧+ ∫
𝛼𝑉2𝑑𝑥
2𝐴𝐺+ ∫
𝑀𝑡2𝑑𝑥
2𝐽𝐺 (2)
The displacement at any point in the bar then radially be found by applying
Castigliano’s theorem. Inasmuch as the force 𝑃𝑖 is not a function of 𝑥 , the
differentiation of 𝑈 with respect to 𝑃𝑖under the integral. In so doing, the displacement
is obtained in the following convenient form:
𝛿𝑖 = ∫1
𝐸𝐴𝑃
𝜕𝑃
𝜕𝑁𝑖𝑑𝑥 + ∫
1
𝐸𝐼𝑧𝑀𝑧
𝜕𝑀𝑧
𝜕𝑁𝑖𝑑𝑥 + ∫
𝛼
𝐴𝐺𝑉
𝜕𝑉
𝜕𝑁𝑖𝑑𝑥 + ∫
1
𝐽𝐺𝑀𝑡
𝜕𝑀𝑡
𝜕𝑁𝑖𝑑𝑥 (3)
In which the integration are carried out over the length of the bar.
2.2. Mathematical model for dynamic buckling
Fig. 1 represents a schematic diagram of a horizontal slender column with fixed-
pinned ends and constant cross section subjected to a compression axial load (P), a
bending load (F), and a torsional twisting moment (𝑀𝑡) with constant rotating speed.
This schematic diagram represents one of the real cases of loading used in the present
research to examine the dynamic buckling behavior under combined loading
conditions.
Figure 1. A slender column with fixed-pinned ends conditions under effect of combined loading (a gradually increased axial compression load P, a gradually increased bending load F, and a constant
torsional twisting moment Mt.

Journal of Engineering and Sustainable Development, Vol. 20, No.04, July 2016 www.jeasd.org (ISSN 2520-0917)
221
The mathematical model is based on the assumption that:
1. The material of the column is homogeneous and isotropic.
2. The dimensions of the cross section of the column are exact and the cross section is
constant.
3. The applied loads and/or support connections are perfectly positioned
geometrically.
4. The axial load and bending load are applied gradually with constant speed of
rotation (constant torque).
5. Plane surfaces remain plane after bending.
6. No initial stresses exist from manufacturing assembly operation or residual stresses
due to material forming.
7. The contribution of the shear force (V) to the displacement is negligible.
Equation (3) will be abbreviated to
𝛿𝑖 =1
𝐸𝐴∫ 𝑃
𝜕𝑃
𝜕𝑁𝑖𝑑𝑥
𝐿
0
+1
𝐸𝐼𝑧∫ 𝑀𝑧
𝜕𝑀𝑧
𝜕𝑁𝑖𝑑𝑥
𝐿
0
+1
𝐽𝐺∫ 𝑀𝑡
𝜕𝑀𝑡
𝜕𝑁𝑖𝑑𝑥
𝐿
0
(4)
To determine the deflection at a distance 0.35L from point B, a dummy load Q is
introduced at point C.
∴ 𝛿𝑖 = 𝛿𝑄 , 𝑁𝑖 = 𝑄, 𝜕𝑃
𝜕𝑁𝑖=
𝜕𝑃
𝜕𝑄= 0, and
𝜕𝑀𝑡
𝜕𝑁𝑖=
𝜕𝑀𝑡
𝜕𝑄= 0,
Equation (4) will be abbreviated to
𝛿𝑄 =1
𝐸𝐼𝑧∫ 𝑀𝑧
𝜕𝑀𝑧
𝜕𝑄𝑑𝑥
𝐿
0 (5)
∴ Bending moment at any section x from the right-hand side is given by
𝑀𝑧 = {
−𝑃𝑣 − 𝑅𝐵𝑥 − 𝑀𝑒 + 𝑀𝑡𝑣′ (0 ≤ 𝑥 ≤ 0.35𝐿)
−𝑃𝑣 − 𝑅𝐵𝑥 − 𝑀𝑒 + 𝑀𝑡𝑣′ + 𝑄(𝑥 − 0.35𝐿) (0.35 ≤ 𝑥 ≤ 0.5𝐿)
−𝑃𝑣 − 𝑅𝐵𝑥 − 𝑀𝑒 + 𝑀𝑡𝑣′ + 𝑄(𝑥 − 0.35𝐿) + 𝐹(𝑥 − 0.5𝐿) (0.5 ≤ 𝑥 ≤ 𝐿)
(6)
Were 𝑀𝑡𝑣′ represent the contribution of the torsional loading or twisting moment (𝑀𝑡)
in the bending moment about z-axis (𝑀𝑧 ) and this based on the deriving of Greenhill
relation [17].
For fixed-pinned ends conditions, and by using superposition method one can write
𝑅𝐵 = (0.4964375)𝑄 + (5
16) 𝐹 −
𝑀𝑒
𝐿 (7)
Substitute (7) in (6) and by taking a partial differentiate of 𝑀𝑧 with respect to the
dummy load Q and then equating the dummy load to zero(put 𝑄 = 0) , one can write
𝜕𝑀𝑧
𝜕𝑄= {
−0.496375 𝑥 (0 ≤ 𝑥 ≤ 0.35𝐿)
−0.496375 𝑥 + (𝑥 − 0.35𝐿) (0.35 ≤ 𝑥 ≤ 0.5𝐿)
−0.496375 𝑥 + (𝑥 − 0.35𝐿) (0.5 ≤ 𝑥 ≤ 𝐿) (8)

Journal of Engineering and Sustainable Development, Vol. 20, No.04, July 2016 www.jeasd.org (ISSN 2520-0917)
222
Substitute (6), (7) and (8) in (5) and equating the dummy load to zero, (5) will be as
follows:
𝛿𝑄 =1
𝐸𝐼𝑧[∫ (−𝑃𝑣 − ((
5
16) 𝐹 −
𝑀𝑒
𝐿) 𝑥 − 𝑀𝑒 + 𝑀𝑡𝑣′ ) ∗ (−0.496375 𝑥)𝑑𝑥
0.35𝐿
0+
∫ (−𝑃𝑣 − ((5
16) 𝐹 −
𝑀𝑒
𝐿) 𝑥 − 𝑀𝑒 + 𝑀𝑡𝑣′) ∗ (−0.496375 𝑥 + (𝑥 −
0.5𝐿
0.35𝐿
0.35𝐿))𝑑𝑥 + ∫ (−𝑃𝑣 − ((5
16) 𝐹 −
𝑀𝑒
𝐿) 𝑥 − 𝑀𝑒 + 𝑀𝑡𝑣′ + 𝐹(𝑥 − 0.5𝐿)) ∗ (
𝐿
0.5−
0.496375 𝑥 + (𝑥 − 0.35𝐿))𝑑𝑥] (9)
The deflection curve of a column with fixed-pinned ends conditions loaded by an axial
load can be represented by the following relation [16]
𝑣 = 0.715𝛿𝑚𝑎𝑥 (1 − cos( 𝑎𝑥′
𝐿) +
1
𝑎sin( 𝑎
𝑥′
𝐿) −
𝑥′
𝐿) (10)
Were 𝑎 = 𝑐𝑜𝑛𝑠𝑡𝑎𝑛𝑡 = 4.493 and 𝛿𝑚𝑎𝑥 =maximum deflection.
For the present research and to simplify the integration, the deflection curve 𝑣 to be
calculated from the right hand of the column as follow:
𝑣 = −0.715𝛿𝑚𝑎𝑥 (1 − cos( 𝑎(𝐿−𝑥)
𝐿) +
1
𝑎sin( 𝑎
(𝐿−𝑥)
𝐿) −
(𝐿−𝑥)
𝐿) (11)
∴ The slope will be, 𝑣′ =0.715𝛿𝑚𝑎𝑥
𝐿(𝑎 sin( 𝑎
(𝐿−𝑥)
𝐿+ cos( 𝑎
(𝐿−𝑥)
𝐿) − 1) (12)
It should be noted, for the present research, the point of applying a dummy load
(point C) as shown in Fig. 1, has been selected for two reason: first, for a column with
fixed-pinned ends support it known that the an equivalent unsupported length can be
calculated by using effective-length factor K= 0.7 which give a value of equivalent
unsupported length=0.7L measured from point B (Fig. 1). Therefore, the maximum
deflection of the column will be at a distance (0.7/2)L=0.35L.Second, from the
equation of the deflection curve of a column with fixed-pinned ends conditions (10) or
(11), it can be find that the point of maximum deflection 𝑣 = 0.999738 𝛿𝑚𝑎𝑥 is locate
at distance 0.4L from point B, and at this point the slope 𝑣′ = 0 and this will give
trivial solution. So, in order to satisfy the two conditions mentioned above, the location
of a point C is selected to be 0.35L from point B and this location will give 𝑣 =
0.983 𝛿𝑚𝑎𝑥.
The moment (𝑀𝑒) represented an eccentricity moment due to eccentricity distance
(e). This moment is given by
𝑀𝑒 = 𝑃𝑒 = 𝑃𝓵 tan 𝜃, and for small value of 𝜃, tan 𝜃 ≅ 𝜃 thus,
𝑀𝑒 = 𝑃𝓵𝜃 = 𝑃𝓵 ∗ (𝑣′)𝒙=𝟎 (13)
Where, 𝜃 =slope=(𝑣′)𝒙=𝟎

Journal of Engineering and Sustainable Development, Vol. 20, No.04, July 2016 www.jeasd.org (ISSN 2520-0917)
223
From (12) and for 𝑥 = 0, (𝑣′)𝒙=𝟎 =0.715𝛿𝑚𝑎𝑥
𝐿∗ (−5.602938819) and by substituting
this value into (13) one can write
𝑀𝑒 =0.715𝛿𝑚𝑎𝑥
𝐿𝑃𝓵 ∗ (−5.602938819) (14)
By Substituting (11), (12), and (14) into (9) and integration yields
𝛿𝑄 =𝐿
𝐸𝐼𝑧
[(0.715𝛿𝑚𝑎𝑥 𝑃(−0.06805589 𝐿 − 0.2071336 𝓵 ))
+ (0.715𝛿𝑚𝑎𝑥 𝑀𝑡(0.1018409)) − (8.704427 ∗ 10−3𝐹𝐿2)] (15)
Now (15) can be arranged to determine the axial compression load P (critical buckling
load) as follows:
∴Critical buckling load
𝑃𝑐𝑟 =𝛿𝑄𝐸𝐼
0.715𝛿𝑚𝑎𝑥 𝐻𝐿−
0.1018𝑀𝑡
𝐻+
8.704427 ∗ 10−3𝐹𝐿2
0.715𝛿𝑚𝑎𝑥 𝐻 (16)
Where, 𝐻 is a variable and given by 𝐻 = −(0.068054 𝐿 + 0.2071336 𝓵)
In order to make (16) more accurate, an initial deformation of the column (𝛿𝑜) must
be considered and to do this, the initial deformation of the column must be subtracted
from the displacement at reference point (0.35L from point B) or the displacement
under the dummy load ( 𝛿𝑄 ) and this means that the strain energy due to real
displacement is considered. Thus, one can write (see Fig. 1)
𝛿𝑄∗ = 𝛿𝑄 − 𝛿𝑜
(17) 𝛿𝑚𝑎𝑥
∗ = 𝛿𝑚𝑎𝑥 + |𝛿𝑜|
Where, 𝛿𝑄 = 𝛿𝑐𝑟 (critical deflection of the column).
And from (11) and by substituting 𝑣 = 𝛿𝑄 and 𝑥 = 0.35𝐿 this will give
𝛿𝑚𝑎𝑥 =−𝛿𝑄
0.98274 (18)
So, the final form of (16) will be
∴Critical buckling load
𝑃𝑐𝑟 =(𝛿𝑄
∗)𝐸𝐼
0.715(𝛿𝑚𝑎𝑥∗)𝐻𝐿
−0.1018𝑀𝑡
𝐻+
8.704427 × 10⁻³𝐹𝐿2
0.715(𝛿𝑚𝑎𝑥∗) 𝐻
(19)
Equation (19) will be used to determine the theoretical critical buckling load
throughout the present research. For dynamic compression loading, (19) may be used
by setting the bending load equal to zero (F=0). It must be noted that when the column
type is intermediate, the Young modulus must be replaced by Tangential modulus (𝐸𝑡)
that calculated from the experimental results of the tensile test of AISI 303 stainless

Journal of Engineering and Sustainable Development, Vol. 20, No.04, July 2016 www.jeasd.org (ISSN 2520-0917)
224
steel tensile specimens. In order to determine where as the column long or
intermediate, effective and critical slenderness ratios are used. The value of the
effective slenderness ratio (𝜆𝑒) is calculated by using the relation [9]:
𝜆𝑒 =𝐾𝐿
𝑟=
𝐿𝑒
𝑟 (20)
The value of slenderness ratio above which column’s type is long and under this
intermediate is obtained using the following relation [18]:
𝜆𝑐 = 𝜆𝑒 = 𝜋. √𝐸
𝜎𝑝𝑙 (21)
and by substitution the value of E, 𝜎𝑝𝑙 from Table 2, and the value of K=0.7 (for fixed-
pinned ends) in (21), the value of critical slenderness ratio is found as 𝜆𝑐 = 86.5.
In (16) and (19), the effect of a bending load (F) and a twisting load (𝑀𝑡) on the
value of critical buckling load (𝑃𝑐𝑟 ) has been insulated in two clear mathematical
expressions by using energy technique. So, the correct value of theoretical critical
buckling load can be predicted. Also, if the position of the point of applying dummy
load (Q) has been change, then the limits of integration will be change in (9) and this
will give, as a result, different values of critical buckling loads from (19) and only the
minimum value of them represents the real value of the critical buckling load of the
column.
It should be noted that the direction of applied of the twisting moment 𝑀𝑡 (i.e.
clockwise or anti-clockwise) will change (15) and/or (19). For example, if one has used
an anti-clockwise twisting moment instead of clockwise twisting moment, then the
ahead sign of the part that represents the effect of the twisting moment will be
changing from positive sign (+) into negative sign (-), and this will led to decrease the
value of the critical buckling load (𝑃𝑐𝑟).
3. Experimental Work
3.1. Material used and buckling test machine
AISI 303 stainless steel intermediate and long columns of circular cross-section
𝐷 = 8 mm, 𝐼 = 201.1 mm4, 𝑟 = 2 mm, and different slenderness ratios were tested
by using a rotating column buckling test machine which is capable to apply dynamic
compression loading (compression-torsion), dynamic bending loading (bending-
torsion), and dynamic combined loading (compression-bending and torsion), with
column ends support of fixed- pinned and rotating speeds of 17 and 34 r.p.m. In this
research, low speed (17 r.p.m) was used in all dynamic buckling experiments (i.e. in
both dynamic compression loading and dynamic combined loading). It should be noted
that the low speed (17 r.p.m) is chosen in order to give a maximum twisting load
because the twisting torque as known is inversely proportional to the rotating speed.
Torsion load (twisting moment) has a constant value of 𝑀𝑡 = 280861.7 N. mm which
is corresponding to 0.5 KW of motor power. The photograph of the rotating buckling

Journal of Engineering and Sustainable Development, Vol. 20, No.04, July 2016 www.jeasd.org (ISSN 2520-0917)
225
test machine is shown in Fig. 2. More details of buckling test machine, used in this
research, are in [10]. The detail of the chemical composition of stainless steel is shown
in Table 1 and the significant mechanical properties are given in Table 2. Based on the
experimental results of the tensile test of 303 AISI stainless steel, the values of
tangential modulus (𝐸𝑡) are calculated for intermediate columns and the results are
given in Table 3, and for more details about the method used to determine the values of
tangential modulus (𝐸𝑡) see Appendix A. The geometrical dimensions and buckling
parameters of buckling specimens are shown in Table 4.
3.2. Failure criterion of buckling
When the maximum deflection of the column reaches the critical value of deflection
(𝛿𝑐𝑟) of the column length, then the load measured (by pressure gauge, see Appendix
B) is the critical buckling load of the column. In the present work, the value of the
critical deflection of the column is taken as (𝛿𝑐𝑟(𝑚𝑚) = (𝐿 ∗ 1%) + 𝛿𝑜) [17, 20, and
21]. The initial deflection of the column (𝛿𝑜) is measured by using a dial gauge, see
Fig. 3. And with a column rotating effect then, the measured value is divided by two
(i.e. 𝛿𝑜= (measured value by dial gauge)/2) to determine the correct value of (𝛿𝑜).
Because of the rotating effect on the reading of the column deflection using a dial
gauge, a laser cell circuit tool was fabricated, with whistle sound, fixed on electronic
vernier (with a reading accuracy of 0.01 mm), Fig. 3, to make the reading of critical
deflection (𝛿𝑐𝑟) more strict.
The steps of using a laser cell circuit as a tool for buckling failure criterion can be
summarized as follows:
1. Calculation of the magnitude of the lateral critical deflection of the column length
in millimeters.
2. Operate the laser-ray circuit and Laser-ray are initially keep tangentially to the
surface of the column at the required position (for the present paper: 0.35 of the
column length from pinned-end support). This position represents a reference level
for the lateral deflection measurement.
3. Input the value of the critical lateral deflection (𝛿𝑐𝑟) in the digital vernier, this is
represented by movement of vernier head and as a resultant changing the level of
the laser-ray into a new one that represent the required failure criterion.
4. After exerting of the loads on the column, the column begins to deflect laterally
with spiral (deflect) shape, and when the column deflection reaches the critical
value (𝛿𝑐𝑟) then it cross the laser-ray and a whistle warning sound is break out
which signify the end of the experiment.
Fig. 4 shows some of buckling specimens before and after buckling test.

Journal of Engineering and Sustainable Development, Vol. 20, No.04, July 2016 www.jeasd.org (ISSN 2520-0917)
226
Figure 2. The rotating buckling test machine and types of loading used in the present research: (A) dynamic axial compression load, (C) dynamic combined load.
Table 1. Chemical compositions (wt. %) of the used and standard AISI 303 stainless steel
Alloy C Si Mn P Cr Ni
Used material a
0.114 0.539 1.14 0.032 18.20 8.19
Standard
(ASM) [19]
Up to 0.15 Up to 1.0 Up to 2.0 Up to 0.2 17-19 8-10
a Source: State Company for Inspection and Engineering Rehabilitation (SIER)/Baghdad. Laboratory and Engineering Inspection Department Minerals Lab. (Spectral analysis of metals) stainless steel rod sample
Table 2. Experimental mechanical properties of AISI 303 stainless steel used in present work
(Average of three specimens)
AISI 303 stainless steel 𝜎𝑢𝑙𝑡 (𝑀𝑝𝑎) 𝜎𝑦a
(𝑀𝑝𝑎)
𝐸 (𝐺𝑝𝑎)
Elongationb
% 𝜎𝑝𝑙
(𝑀𝑝𝑎)
Experimental properties 880 673 204.2 41.4 269.2
a Proof stress at 0.2% of stain;
b in gauge length 𝐿𝑜 = 25 𝑚𝑚
Table 3. Values of Tangential modulus for intermediate columns
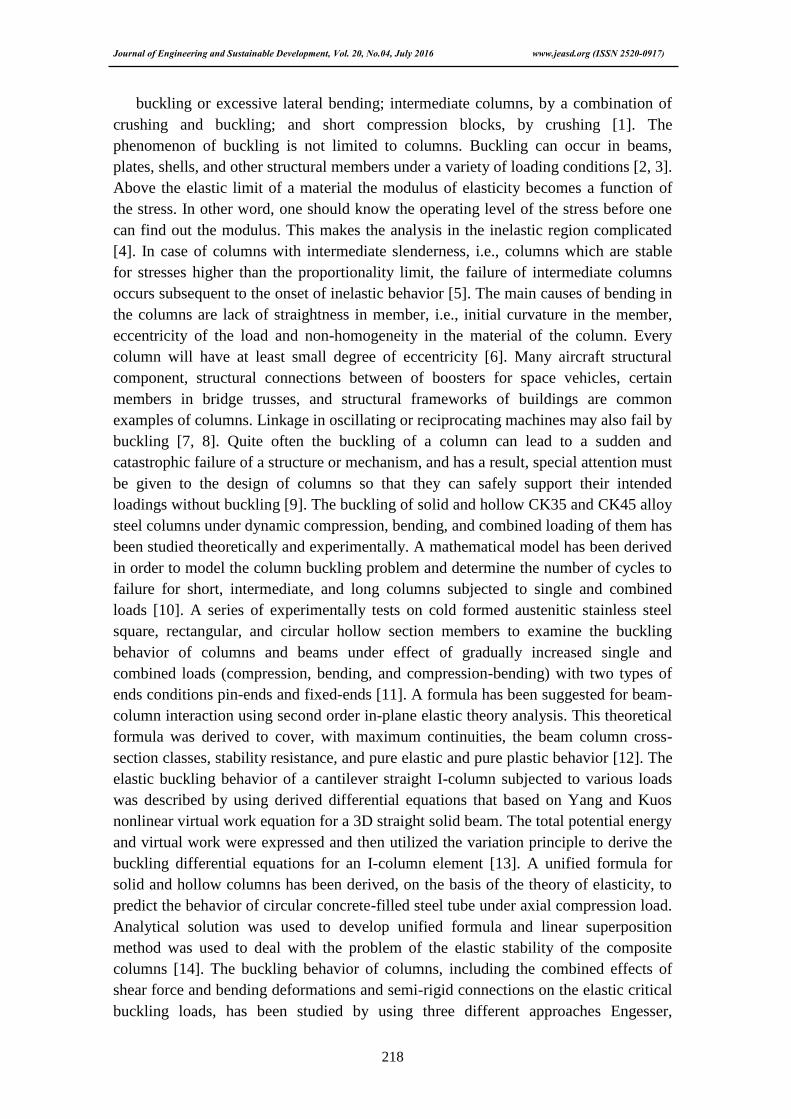
Table 4. Geometrical dimensions and buckling parameters of the used specimens
No. 𝐿 (𝑚𝑚)
𝐿𝑒
(𝑚𝑚)
𝜆𝑒
(=𝐿𝑒
𝑟)
𝐸𝑡 (𝐺𝑃𝑎)
1 160 112 56 137.131
2 170 119 59.5 146.248
3 180 126 63 154.764
4 190 133 66.5 162.686
5 200 140 70 170.035
6 210 147 73.5 176.836
7 220 154 77 183.123
8 230 161 80.5 188.928
9 240 168 84 194.288
No. Symbol 𝐿 (𝑚𝑚)
𝐿𝑒 a
(𝑚𝑚)
𝛿𝑜
(𝑚𝑚)
𝛿𝑐𝑟 b
(𝑚𝑚) 𝜆𝑒
(𝐿𝑒
𝑟)
Type of loading
Type c
of column
1 1a 160 112 0.55/2 1.88 56 dynamic comp.
Intermediate 1b 0.9/2 2.05 combined
2 2a 170 119 0.6/2 2 59.5 dynamic comp.
Journal of Engineering and Sustainable Development, Vol. 20, No.04, July 2016 www.jeasd.org (ISSN 2520-0917)
227
a 𝐿𝑒 = 𝐾𝐿 ; b 𝛿𝑐𝑟(𝑚𝑚) = (𝐿 ∗ 1%) + 𝛿𝑜
c 𝜆𝑐 = 𝜋. √𝐸
𝜎𝑝𝑙= 86.5 , 𝑖𝑓 𝜆𝑒 > 𝜆𝑐 → 𝑙𝑜𝑛𝑔 𝑐𝑜𝑙𝑢𝑚𝑛 and 𝑖𝑓 𝜆𝑒 < 𝜆𝑐 → 𝑖𝑛𝑡𝑒𝑟𝑚𝑒𝑑𝑖𝑎𝑡𝑒 𝑐𝑜𝑙𝑢𝑚𝑛
2b 1.1/2 2.25 combined
3 3a 180 126 0.71/2 2.16 63 dynamic comp.
3b 1.24/2 2.42 combined
4 4a 190 133 0.96/2 2.38 66.5 dynamic comp.
4b 1.3/2 2.55 combined
5 5a 200 140 0.8/2 2.4 70 dynamic comp.
5b 1.3/2 2.65 combined
6 6a 210 147 1.22/2 2.71 73.5 dynamic comp.
6b 1.46/2 2.83 combined
7 7a 220 154 1.1/2 2.75 77 dynamic comp.
7b 1.6/2 3 combined
8 8a 230 161 1.21/2 2.91 80.5 dynamic comp.
8b 1.4/2 3 combined
9 9a 240 168 1.2/2 3.0 84 dynamic comp.
9b 1.5/2 3.15 combined
10 10a 260 182 1/2 3.1 91 dynamic comp.
Long
10b 1.3/2 3.25 combined
11 11a 280 196 0.95/2 3.28 98 dynamic comp.
11b 1/2 3.3 combined
12 12a 300 210 1.15/2 3.58 105 dynamic comp.
12b 0.95/2 3.48 combined
13 13a 320 224 1.2/2 3.8 112 dynamic comp.
13b 0.8/2 3.6 combined
14 14a 340 238 1.48/2 4.14 119 dynamic comp.
14b 1.1/2 3.95 combined
15 15a 360 252 1.3/2 4.25 126 dynamic comp.
15b 1.15/2 4.18 combined
16 16a 380 266 1.43/2 4.52 133 dynamic comp.
16b 1.2/2 4.4 combined
17 17a 400 280 1.26/2 4.63 140 dynamic comp.
17b 0.9/2 4.45 combined
18 18a 420 294 1.45/2 4.93 147 dynamic comp.
18b 1/2 4.7 combined
19 19a 440 308 1.58/2 5.19 154 dynamic comp.
19b 1.3/2 5.05 combined
20 20a 460 322 1.8/2 5.5 161 dynamic comp.
20b 2.3/2 5.75 combined

Journal of Engineering and Sustainable Development, Vol. 20, No.04, July 2016 www.jeasd.org (ISSN 2520-0917)
228
Figure 3. System used to control the deflection of columns during buckling test.
Figure 4. Specimens before and after buckling test.
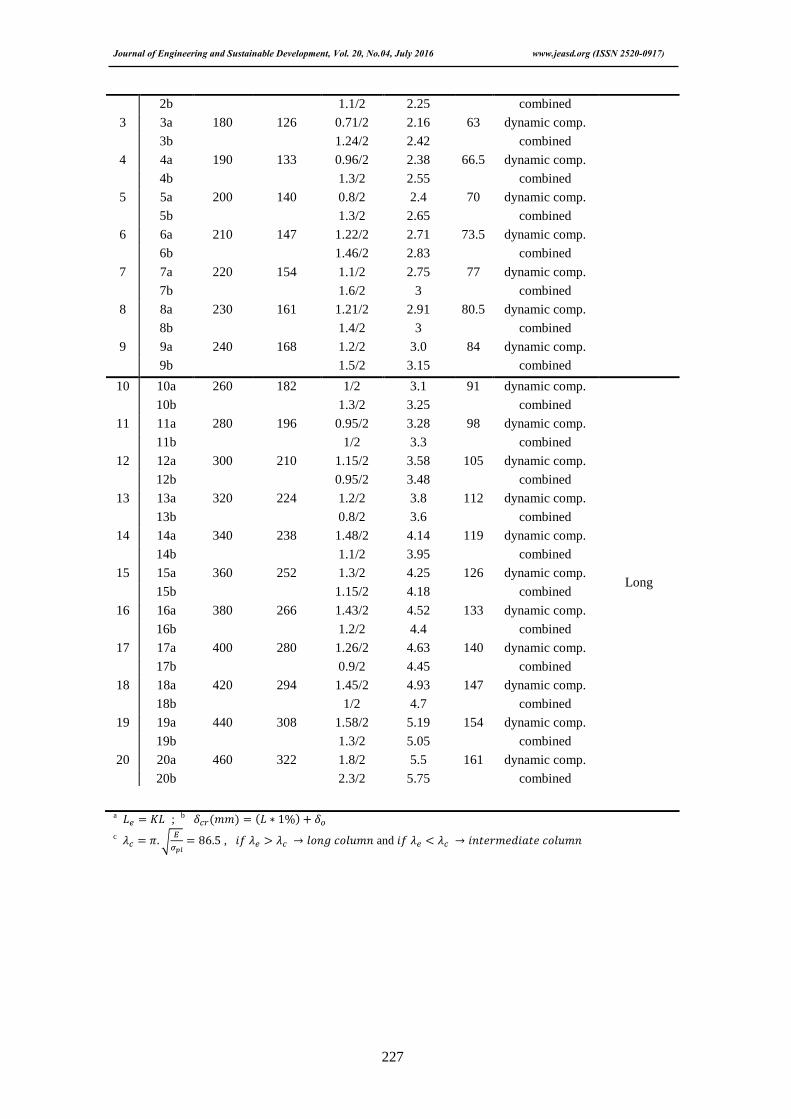
4. Results and Discussion
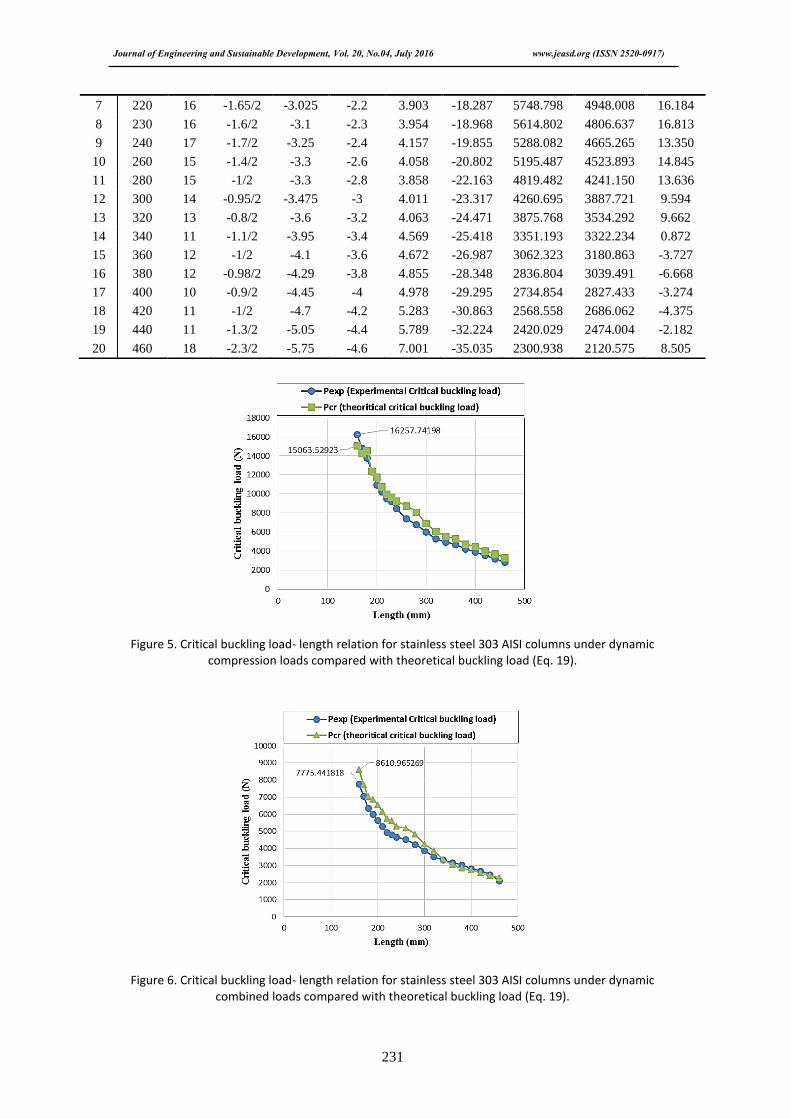
Table 5 shows the experimental results of dynamic buckling test of 303 AISI
column specimens. In this table, it can be observed that the critical buckling stress
(𝜎𝑒𝑥𝑝) decreased with the increase in effective slenderness ratio (𝜆𝑒) for both dynamic
compression load (compression-torsion load) and dynamic combined load
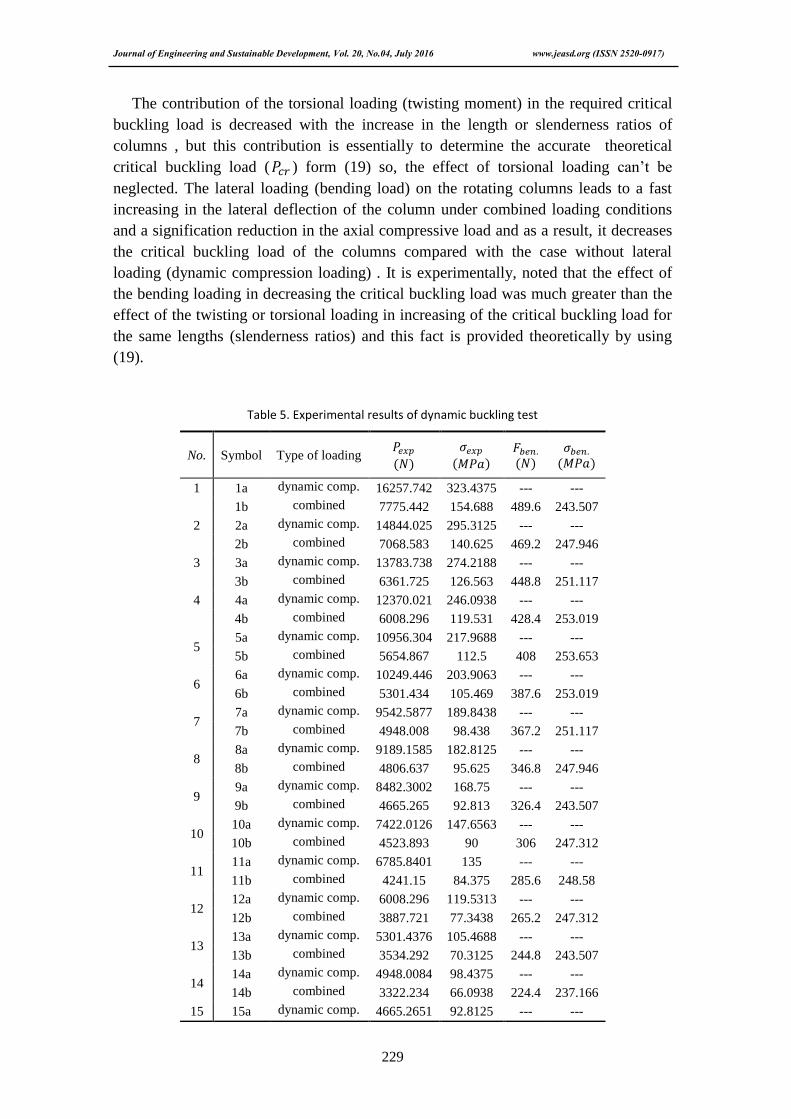
(compression-bending-torsion load). In order to make a comparison between the
experimental results and theoretical results, (19) is used to calculate the theoretical
critical buckling load (𝑃𝑐𝑟) for the specimens under both dynamic compression load
and dynamic combined load, and the results are shown in Table 6 for dynamic
compression load and Table 7 for dynamic combined load. From Table 5 and Table 6,
it can be observed that there is a good agreement between the experimental critical
buckling load (𝑃𝑒𝑥𝑝) and the theoretical critical buckling load (𝑃𝑐𝑟) predicts from (19)
and the maximum percentage error under dynamic compression load and under
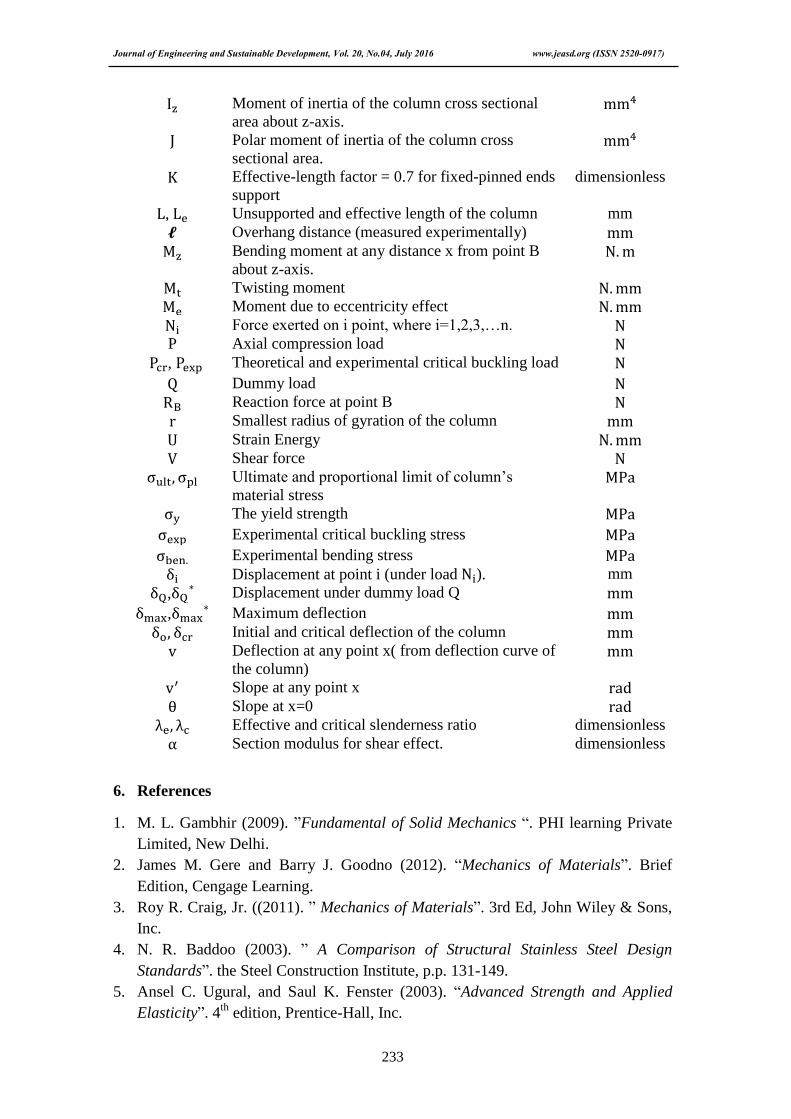
dynamic combined load is 19.3% and 16.8%, respectively. Fig. 5 and Fig. 6 are plotted
by using the experimental results of Table 5 for specimens under dynamic compression
load, whereas Table 6 and Table 7 are gave the theoretical results from derived
equation (19). It can be observed that the derived equation (19) may be used to
describe the buckling behavior of intermediate and long columns under both dynamic
compression load and under dynamic combined load.
Journal of Engineering and Sustainable Development, Vol. 20, No.04, July 2016 www.jeasd.org (ISSN 2520-0917)
229
The contribution of the torsional loading (twisting moment) in the required critical
buckling load is decreased with the increase in the length or slenderness ratios of
columns , but this contribution is essentially to determine the accurate theoretical
critical buckling load (𝑃𝑐𝑟 ) form (19) so, the effect of torsional loading can’t be
neglected. The lateral loading (bending load) on the rotating columns leads to a fast
increasing in the lateral deflection of the column under combined loading conditions
and a signification reduction in the axial compressive load and as a result, it decreases
the critical buckling load of the columns compared with the case without lateral
loading (dynamic compression loading) . It is experimentally, noted that the effect of
the bending loading in decreasing the critical buckling load was much greater than the
effect of the twisting or torsional loading in increasing of the critical buckling load for
the same lengths (slenderness ratios) and this fact is provided theoretically by using
(19).
Table 5. Experimental results of dynamic buckling test
No. Symbol Type of loading 𝑃𝑒𝑥𝑝
(𝑁)
𝜎𝑒𝑥𝑝
(𝑀𝑃𝑎)
𝐹𝑏𝑒𝑛.
(𝑁)
𝜎𝑏𝑒𝑛.
(𝑀𝑃𝑎)
1 1a dynamic comp. 16257.742 323.4375 --- ---
1b combined 7775.442 154.688 489.6 243.507
2 2a dynamic comp. 14844.025 295.3125 --- ---
2b combined 7068.583 140.625 469.2 247.946
3 3a dynamic comp. 13783.738 274.2188 --- ---
3b combined 6361.725 126.563 448.8 251.117
4 4a dynamic comp. 12370.021 246.0938 --- ---
4b combined 6008.296 119.531 428.4 253.019
5 5a dynamic comp. 10956.304 217.9688 --- ---
5b combined 5654.867 112.5 408 253.653
6 6a dynamic comp. 10249.446 203.9063 --- ---
6b combined 5301.434 105.469 387.6 253.019
7 7a dynamic comp. 9542.5877 189.8438 --- ---
7b combined 4948.008 98.438 367.2 251.117
8 8a dynamic comp. 9189.1585 182.8125 --- ---
8b combined 4806.637 95.625 346.8 247.946
9 9a dynamic comp. 8482.3002 168.75 --- ---
9b combined 4665.265 92.813 326.4 243.507
10 10a dynamic comp. 7422.0126 147.6563 --- ---
10b combined 4523.893 90 306 247.312
11 11a dynamic comp. 6785.8401 135 --- ---
11b combined 4241.15 84.375 285.6 248.58
12 12a dynamic comp. 6008.296 119.5313 --- ---
12b combined 3887.721 77.3438 265.2 247.312
13 13a dynamic comp. 5301.4376 105.4688 --- ---
13b combined 3534.292 70.3125 244.8 243.507
14 14a dynamic comp. 4948.0084 98.4375 --- ---
14b combined 3322.234 66.0938 224.4 237.166
15 15a dynamic comp. 4665.2651 92.8125 --- ---
Journal of Engineering and Sustainable Development, Vol. 20, No.04, July 2016 www.jeasd.org (ISSN 2520-0917)
230
Table 6. Theoretical values of critical buckling load using (19) under dynamic compression load
15b combined 3180.863 63.2813 204 228.288
16 16a dynamic comp. 4241.1501 84.375 --- ---
16b combined 3039.491 60.4688 183.6 216.874
17 17a dynamic comp. 3887.7209 77.34375 --- ---
17b combined 2827.433 56.25 163.2 202.923
18 18a dynamic comp. 3534.2917 70.3125 --- ---
18b combined 2686.062 53.4375 142.8 186.435
19 19a dynamic comp. 3180.8626 63.28125 --- ---
19b combined 2474.004 49.2188 122.4 167.411
20 20a dynamic comp. 2827.4334 56.25 --- ---
20b combined 2120.575 42.1875 81.6 116.68
No. 𝐿
(𝑚𝑚)
ℓ
(𝑚𝑚)
𝛿𝑜
(𝑚𝑚)
𝛿𝑐𝑟
(𝑚𝑚)
𝛿𝑄∗
(𝑚𝑚)
𝛿𝑚𝑎𝑥∗
(𝑚𝑚) 𝐻
𝑃𝑐𝑟
(𝑁)
𝑃𝑒𝑥𝑝
(𝑁)
Error
%
1 160 10 -0.55/2 -1.88 -1.6 2.183 -12.963 15835.931 16257.742 -2.595
2 170 11 -0.6/2 -2 -1.7 2.335 -13.851 14782.228 14844.025 -0.416
3 180 10 -0.71/2 -2.16 -1.8 2.548 -14.325 13923.073 13783.738 1.011
4 190 10 -0.96/2 -2.38 -1.9 2.902 -15.006 12414.393 12370.022 0.359
5 200 15 -0.8/2 -2.4 -2 2.842 -16.722 11772.94 10956.305 7.454
6 210 10 -1.22/2 -2.71 -2.1 3.368 -16.367 10771.182 10249.447 5.090
7 220 16 -1.1/2 -2.75 -2.2 3.349 -18.291 9973.695 9542.588 4.518
8 230 13 -1.21/2 -2.905 -2.3 3.562 -18.350 9690.538 9189.159 5.456
9 240 14 -1.2/2 -3 -2.4 3.653 -19.238 9263.168 8482.300 9.206
10 260 17 -1/2 -3.1 -2.6 3.654 -21.221 8753.701 7422.013 17.942
11 280 15 -0.95/2 -3.275 -2.8 3.808 -22.168 8094.641 6785.840 19.287
12 300 17 -1.15/2 -3.575 -3 4.213 -23.944 6888.278 6008.296 14.646
13 320 17 -1.3/2 -3.85 -3.2 4.568 -25.306 6099.157 5301.438 15.047
14 340 14 -1.48/2 -4.14 -3.4 4.954 -26.046 5550.473 4948.009 12.176
15 360 13 -1.3/2 -4.25 -3.6 4.975 -27.200 5296.112 4665.265 13.522
16 380 13 -1.43/2 -4.515 -3.8 5.309 -28.769 4754.383 4241.150 12.101
17 400 15 -1.26/2 -4.63 -4 5.341 -30.544 4456.744 3887.721 14.636
18 420 14 -1.45/2 -4.925 -4.2 5.736 -31.906 4034.401 3534.292 14.150
19 440 16 -1.58/2 -5.19 -4.4 6.071 -33.268 3703.398 3180.863 16.427
20 460 18 -1.9/2 -5.55 -4.6 6.597 -35.043 3300.375 2827.433 16.727
No. 𝐿
(mm)
𝓵
(𝑚𝑚)
𝛿𝑜
( 𝑚𝑚)
𝛿𝑐𝑟
( 𝑚𝑚)
𝛿𝑄∗
( 𝑚𝑚)
𝛿𝑚𝑎𝑥∗
( 𝑚𝑚) 𝐻
𝑃𝑐𝑟
(𝑁)
𝑃𝑒𝑥𝑝
(𝑁)
Error
%
1 160 15 -0.9/2 -2.05 -1.6 2.536 -13.996 8610.965 7775.442 10.745
2 170 16 -1.1/2 -2.25 -1.7 2.839 -14.884 7748.431 7068.583 9.618
3 180 16 -1.35/2 -2.475 -1.8 3.193 -15.565 7033.603 6361.725 10.561
4 190 16 -1.3/2 -2.55 -1.9 3.245 -16.245 6869.471 6008.296 14.333
5 200 17 -1.3/2 -2.65 -2 3.347 -17.133 6545.262 5654.867 15.745
6 210 16 -1.46/2 -2.83 -2.1 3.609 -17.606 6176.227 5301.438 16.501
Table 7. Theoretical values of critical buckling load using (19) for specimens under dynamic combined load
Journal of Engineering and Sustainable Development, Vol. 20, No.04, July 2016 www.jeasd.org (ISSN 2520-0917)
231
Figure 5. Critical buckling load- length relation for stainless steel 303 AISI columns under dynamic compression loads compared with theoretical buckling load (Eq. 19).
Figure 6. Critical buckling load- length relation for stainless steel 303 AISI columns under dynamic combined loads compared with theoretical buckling load (Eq. 19).
7 220 16 -1.65/2 -3.025 -2.2 3.903 -18.287 5748.798 4948.008 16.184
8 230 16 -1.6/2 -3.1 -2.3 3.954 -18.968 5614.802 4806.637 16.813
9 240 17 -1.7/2 -3.25 -2.4 4.157 -19.855 5288.082 4665.265 13.350
10 260 15 -1.4/2 -3.3 -2.6 4.058 -20.802 5195.487 4523.893 14.845
11 280 15 -1/2 -3.3 -2.8 3.858 -22.163 4819.482 4241.150 13.636
12 300 14 -0.95/2 -3.475 -3 4.011 -23.317 4260.695 3887.721 9.594
13 320 13 -0.8/2 -3.6 -3.2 4.063 -24.471 3875.768 3534.292 9.662
14 340 11 -1.1/2 -3.95 -3.4 4.569 -25.418 3351.193 3322.234 0.872
15 360 12 -1/2 -4.1 -3.6 4.672 -26.987 3062.323 3180.863 -3.727
16 380 12 -0.98/2 -4.29 -3.8 4.855 -28.348 2836.804 3039.491 -6.668
17 400 10 -0.9/2 -4.45 -4 4.978 -29.295 2734.854 2827.433 -3.274
18 420 11 -1/2 -4.7 -4.2 5.283 -30.863 2568.558 2686.062 -4.375
19 440 11 -1.3/2 -5.05 -4.4 5.789 -32.224 2420.029 2474.004 -2.182
20 460 18 -2.3/2 -5.75 -4.6 7.001 -35.035 2300.938 2120.575 8.505

Journal of Engineering and Sustainable Development, Vol. 20, No.04, July 2016 www.jeasd.org (ISSN 2520-0917)
232
5. Conclusions
1. A new equation has been derived using energy technique (dummy load method) to
describe the buckling behavior of intermediate and long columns under dynamic
compression load and under dynamic combined load with consider of the initial
imperfections of the column and the effect of eccentricity.
2. The theoretical critical buckling load expression
𝑃𝑐𝑟 =(𝛿𝑄
∗)𝐸𝐼
0.715(𝛿𝑚𝑎𝑥∗)𝐻𝐿
−0.1018𝑀𝑡
𝐻+
8.704427×10⁻³𝐹𝐿2
0.715(𝛿𝑚𝑎𝑥∗) 𝐻
may be used to predict of the
critical buckling load under both dynamic compression and combined load with
maximum percentage error is 19.3% and 16.8%, respectively.
3. The derived model (19) is applicable to be applied for other than stainless steel
materials because it does not depend on special mechanical properties of column
material, and the present model can be re-derived, by using the same previous
process, to predict the critical buckling load for other types of column’s end
conditions.
4. The contribution of the torsional loading (twisting moment) in the critical buckling
load is dependent on its direction (i.e. Clockwise or anit-clockwise). A clockwise
direction of rotation leads to produce a twisting moment contribute in increasing of
the critical buckling load of columns and this will appeared clearly from derivation
of (19).
5. The contribution of the torsional loading (twisting moment) in the required critical
buckling load is decreased with the increase in the length and/or eccentricity of
columns and this contribution is essentially to determine the accurate theoretical
critical buckling load (𝑃𝑐𝑟) form (19) so, the effect of torsional loading can’t be
neglected.
6. The lateral loading (bending load) on the rotating columns leads to a fast increasing
in the lateral deflection of the column under combined loading conditions and a
signification reduction in the axial compressive load (critical buckling load).
7. Effect of the bending load, in decreasing of the critical buckling load, is increased
with the increase of the length and/or eccentricity of columns. The average
decreasing in the values of the critical buckling load is -37.92% compared with the
values of the critical buckling load without lateral bending load for the same length
of the column under dynamic combined load.
Abbreviations
Units Definition Nomenclature
mm2 The cross-sectional area of the column A
GPa Modulus of elasticity. E
GPa Tangent modulus. Et
mm Eccentricity of the column e
N bending load F, Fben.
GPa Shear modulus G
mm A variable depending on column’s length and
overhang distance. H
Journal of Engineering and Sustainable Development, Vol. 20, No.04, July 2016 www.jeasd.org (ISSN 2520-0917)
233
6. References
1. M. L. Gambhir (2009). ”Fundamental of Solid Mechanics “. PHI learning Private
Limited, New Delhi.
2. James M. Gere and Barry J. Goodno (2012). “Mechanics of Materials”. Brief
Edition, Cengage Learning.
3. Roy R. Craig, Jr. ((2011). ” Mechanics of Materials”. 3rd Ed, John Wiley & Sons,
Inc.
4. N. R. Baddoo (2003). ” A Comparison of Structural Stainless Steel Design
Standards”. the Steel Construction Institute, p.p. 131-149.
5. Ansel C. Ugural, and Saul K. Fenster (2003). “Advanced Strength and Applied
Elasticity”. 4th
edition, Prentice-Hall, Inc.
mm4 Moment of inertia of the column cross sectional
area about z-axis. Iz
mm4 Polar moment of inertia of the column cross
sectional area. J
dimensionless Effective-length factor = 0.7 for fixed-pinned ends
support K
mm Unsupported and effective length of the column L, Le
mm Overhang distance (measured experimentally) 𝓵
N. m Bending moment at any distance x from point B
about z-axis. Mz
N. mm Twisting moment Mt
N. mm Moment due to eccentricity effect Me
N Force exerted on i point, where i=1,2,3,…n. Ni
N Axial compression load P
N Theoretical and experimental critical buckling load Pcr, Pexp
N Dummy load Q
N Reaction force at point B RB mm Smallest radius of gyration of the column r
N. mm Strain Energy U
N Shear force V
MPa Ultimate and proportional limit of column’s
material stress σult, σpl
MPa The yield strength σy
MPa Experimental critical buckling stress σexp
MPa Experimental bending stress σben. mm Displacement at point i (under load Ni). δi mm Displacement under dummy load Q δQ,δQ
∗
mm Maximum deflection δmax,δmax∗
mm Initial and critical deflection of the column δo, δcr
mm Deflection at any point x( from deflection curve of
the column) v
rad Slope at any point x v′
rad Slope at x=0 θ dimensionless Effective and critical slenderness ratio λe, λc dimensionless Section modulus for shear effect. α

Journal of Engineering and Sustainable Development, Vol. 20, No.04, July 2016 www.jeasd.org (ISSN 2520-0917)
234
6. V. N. Vazirani, M. M. Raaatwani, and S, K, Duggal (2010). ” Analysis of
Structures”. Khanna Publishers.
7. T. H. G. Megson (1999). ”Aircraft Structures for Engineering Students”. 3rd
edition, Butterworth-Heinemann.
8. William A. Nash (1998). “Theory and Problem of Strength of Materials”.
Schaum’s Outline Series 4th edition, McGraw-Hill, Inc.
9. R. C. Hibbeler, SI conversion by S. C. Fan (2004). ” Statics and Mechanics of
Materials”, Prentice-Hall, Inc.
10. Kifah Hameed Al-Jubori (2005). “Columns Lateral Buckling Under Combined
Dynamic Loading”. PhD. Thesis, University of Technology, Department of
Technical Education.
11. L. Gardner, D.A. Nethercot (2004). “Experiments on Stainless Steel Hollow
Sections-Part 2: Member Behavior of Columns and Beams”. Journal of
Constructional Steel Research, Vol. 60, p.p. 1319-1332.
12. N. Boissonnade, J. P. Jaspart, J. P. Muzeau, and M. Villette (2002). “Improvement
of the Interaction Formulae for Beam Columns in Eurocode 3”. Computers and
Structures, Vol. 80, p.p. 2375-2385.
13. Jong-Dar Yau (2007). “Elastic Stability of I-Columns Subjected to Compressions
and bi-Moments”. Journal of the Chinese Institute of Engineers, Vol. 30, No. 4, pp.
569-578.
14. Min Yu, Xiaoxiong Zha, Jianqiao Ye, and Chunyan She (2010). “A Unified
Formulation for Hollow and Solid Concrete-Filled Steel Tube Columns under
Axial Compression”. Engineering Structures, Vol. 32, p.p. 1046-1053.
15. J. Dario Aristizabal-Ochoa (2011). “Stability of columns with Semi-Rigid
Connections Including Shear Effects Using Engesser, Haringx and Euler
Approaches”. Engineering Structures, Vol. 33, p.p. 868–880.
16. Richard G. Budynas (1999).”Advanced Strength and Applied Stress Analysis”. 2nd
edition, McGraw-Hill, Inc.
17. Zdeněk P. Bažant and Luigi Cipolin (2003). “Stability of Structures Elastic,
Inelastic, Fracture, and Damage theories”. Dover Puplications, Inc.
18. James M. Gere (2004). “Mechanics of Materials”. 6th Ed, Thomson Learning, Inc.
19. ASM Handbook (1994). ”Surface Engineering”. ASM International, Vol. 5.
20. Hamed Ali Hussein (2010). ”Buckling of Square Columns Under Cycling Loads for
Nitriding Steel DIN (CK45, CK67, CK101)”. PhD. Thesis, University of
Technology, Department of Mechanical Engineering.
21. Al-Alkhawi H. J. M., Al-Khazraji A. N., and Essam Zuhier Fadhel (2014).
“Determination the Optimum Shot Peening Time for Improving the Buckling
Behavior of Medium Carbon Steel”. Eng. & Tech. Journal, Vol. 32, Part (A), No.
3.
22. Bruce G. Johnston (2006), “Guide to Stability Design Criteria for Metal
Structures”, Springer-Verlag Berlin Heidelberg.

Journal of Engineering and Sustainable Development, Vol. 20, No.04, July 2016 www.jeasd.org (ISSN 2520-0917)
235
Appendices
Appendix – A
Calculation of Tangent Modulus (𝑬𝒕)
At point B as shown in Fig. (1), the elastic modulus is the 𝐸𝑡 (tangent modulus) if
the stress is increased but 𝐸 (Young’s modulus) if the stress is decreased [7]. The
tangent modulus is given by [3, 22]:
𝐸𝑡 =𝑑𝜎
𝑑 (𝐴 − 1)
The critical or Engesser stress may be expressed by means of modification of Euler formula in
which 𝐸𝑡 replaces 𝐸 :
𝜎𝑇 =𝑃𝑐𝑟
𝐴=
𝜋2𝐸𝑡
(𝜆𝑒)2 (𝐴 − 2)
Figure A-1. Stress- strain diagram of a material to illustrate the region of tangent modulus application
[22].
From the experimental tensile test results, the stress-strain curve, Fig.2, for 303 AISI
stainless steel used in this research can be represented by the following relationship:
𝜎 = 2 ∗ 109휀3 − 4 ∗ 107휀2 + 286278 휀 − 31.594 (𝐴 − 3)
Figure (2). Experimental true stress- strain curve of AISI 303 stainless steel used in the present
research (as received material)

Journal of Engineering and Sustainable Development, Vol. 20, No.04, July 2016 www.jeasd.org (ISSN 2520-0917)
236
Where (휀) and (𝜎) are the uniaxial strain and stress, respectively.
The tangent modulus is given by (A-1):
𝐸𝑡 =𝑑𝜎
𝑑휀
So, by differentiation of (A-3) with respect to 휀, one can write:
𝐸𝑡 =𝑑𝜎
𝑑= 6 ∗ 109휀2 − 8 ∗ 107휀 + 286278 (𝐴 − 4)
Now, substituting (A-3) and (A-4) into (A-2) gives
2 ∗ 109휀3 − 4 ∗ 107휀2 + 286278 휀 − 31.594
=𝜋2
(𝜆𝑒)2∗ [6 ∗ 109휀2 − 8 ∗ 107휀 + 286278] (𝐴 − 5)
By rearranging (A-5), one can write:
2 ∗ 109휀3 − (4 ∗ 107 + 6 ∗ 109 ∗𝜋2
(𝜆𝑒)2) 휀2 + (286278 + 8 ∗ 107 ∗𝜋2
(𝜆𝑒)2) 휀
− (31.594 + 286278 ∗𝜋2
(𝜆𝑒)2) = 0 (𝐴 − 6)
Equation (A-6) can be solved to determine the correct value (root) of real strain 휀
and then substitute this value in (A-4) to determine the value of the tangent modulus 𝐸𝑡
[16].
The following calculations are made for the buckling specimen 1a, see Table 4. This
specimens has the following geometrical dimensions: L=160 mm and 𝜆𝑒 = 56.
From (A-6) and for slenderness ratio 𝜆𝑒=56
2 ∗ 109휀3 − (4 ∗ 107 + 6 ∗ 109 ∗𝜋2
(56)2) 휀2 + (286278 + 8 ∗ 107 ∗𝜋2
(56)2) 휀
− (31.594 + 286278 ∗𝜋2
(56)2) = 0
The above equation is a quadratic equation of 3rd
degree so there will be three roots,
but one of them will be the true root.
The true root is, 휀 = 2.240986 ∗ 10−3
By substituting 휀 = 2.240986 ∗ 10−3 in (A-4) this will gives
∴ 𝐸𝑡 = 6 ∗ 109 ∗ (2.240986 ∗ 10−3)2 − 8 ∗ 107 ∗ (2.240986 ∗ 10−3) + 286278= 137131.238 𝑀𝑃𝑎 = 137.131 𝐺𝑃𝑎
Appendix –B
Calculation of Torsion and Compression Loads
1. Torsion load (twisting moment)
𝑃𝑜𝑤𝑒𝑟 = 𝜔 ∗ 𝑇 =2𝜋𝑁∗𝑀𝑡
60 (𝐵 − 1)

Journal of Engineering and Sustainable Development, Vol. 20, No.04, July 2016 www.jeasd.org (ISSN 2520-0917)
237
Where,
Power=driving motor power= 0.5 KW=500 Watt.
𝜔=angular velocity (rad/sec).
𝑀𝑡= twisting moment or torque (N.m).
N=rotational speed (r.p.m)= 17 r.p.m (constant)
∴ 𝑀𝑡 =60∗𝑃𝑜𝑤𝑒𝑟
2𝜋∗𝑁=
60∗500
2𝜋∗17= 280.8617 𝑁. 𝑚 = 280861.7 𝑁. 𝑚𝑚
2. Axial compression load and compression stress At hydraulic pump
𝑝 =𝐹
𝐴𝑐𝑦𝑙𝑖𝑛𝑑𝑒𝑟 (𝐵 − 2)
or 𝐹 = 𝑝 ∗ 𝐴𝑐𝑦𝑙𝑖𝑛𝑑𝑒𝑟 (𝐵 − 3)
Where,
𝑝: is the applied pressure by hydraulic pump.
𝐹: is the applied load on column.
𝐴𝑐𝑦𝑙𝑖𝑛𝑑𝑒𝑟: is the cross sectional area of hydraulic pump rod.
At a column
𝜎𝑐𝑜𝑚𝑝. =𝐹
𝐴𝑐𝑜𝑙𝑢𝑚𝑛 (𝐵 − 4)
or 𝐹 = 𝜎𝑐𝑜𝑚𝑝𝑟. ∗ 𝐴𝑐𝑜𝑙𝑢𝑚𝑛 (𝐵 − 5)
Now, by equating the forces in hydraulic pump and on a column cross sectional
area, it can be written
𝜎𝑐𝑜𝑚𝑝𝑟. = 𝑝 ∗𝐴𝑐𝑦𝑙𝑖𝑛𝑑𝑒𝑟
𝐴𝑐𝑜𝑙𝑢𝑚𝑛= 𝑝 ∗ (
𝐷
𝑑)
2
(𝐵 − 6)
Where,
D: is the diameter of hydraulic pump delivery rod.
D=30 mm
d: is the diameter of column.
d= 8 mm (constant for all columns)
∴ 𝜎𝑐𝑜𝑚𝑝𝑟. = 𝑝 ∗ (14.0625)
For a column 1a, Table 5
a recorded pressure 𝑝 = 230 𝑏𝑎𝑟 = 23 𝑀𝑃𝑎, then the compression stress on the
column is
𝜎𝑐𝑜𝑚𝑝𝑟. = 𝜎𝑒𝑥𝑝 = 23 ∗ 14.0625 = 323.438 𝑀𝑃𝑎
And the compression load is
𝑃𝑒𝑥𝑝. = 𝜎𝑒𝑥𝑝 ∗ 𝐴𝑐𝑜𝑙𝑢𝑚𝑛 = 323.438 ∗ 106 ∗𝜋
4(8)2 = 16257.742 𝑁


![Buckling Analysis of Cold Formed Silo Column - · PDF fileBuckling Analysis of Cold Formed Silo Column Karol Rejowski ... Eurocode 3 [9] buckling formula for the silo design basing](https://static.fdocuments.in/doc/165x107/5a9dff167f8b9ada718c45e4/buckling-analysis-of-cold-formed-silo-column-analysis-of-cold-formed-silo-column.jpg)

