Validation of Analytical Methods for Determination of...
9
IOSR Journal of Pharmacy and Biological Sciences (IOSR-JPBS) e-ISSN:2278-3008, p-ISSN:2319-7676. Volume 11, Issue 5 Ver. III (Sep. - Oct.2016), PP 51-59 www.iosrjournals.org DOI: 10.9790/3008-1105035159 www.iosrjournals.org 51 | Page Validation of Analytical Methods for Determination of Methamphetamine Using Fourier Transform Infrared (FTIR) Spectroscopy Riyanto 1 and Sri Wulan Nas 2 1 Department of Chemistry, Faculty of Mathematics and Natural Science, Islamic University of Indonesia, Jalan Kaliurang KM 14,5 Sleman Yogyakarta Indonesia 55584 2 Department of Analytical Chemistry, Faculty of Mathematics and Natural Science, Islamic University of Indonesia, Jalan Kaliurang KM 14,5 Sleman Yogyakarta Indonesia 55584 Abstract: Validation of analytical methods for determination of methamphetamine using Fourier Transform Infrared (FTIR) Spectroscopy has been done. Parameter validation method are the repeatability of the system (precision), accuracy, linear ranges, limit of detection (LOD) and limit of quantification (LOQ). Samples was prepared by mixing a weighed portion of methamphetamine standard and alum and swirled flatly to homogeneous mixture. The mixture with total weighed of powder obtained is approximately 1.0 g. This sample was analysis using FTIR. The results of the study showed that the correlation of determination analysis methamphetamine using FTIR was R 2 =0.9998 at functional group with wave length number 698.83 cm -1 . Precision, RSD Horwitz, LOQ, LOD and recovery of the validation of analytical methods for determination of methamphetamine using FTIR were found to be 0.0087%, 2.052%, 2.3035%, 7.6786%, and 104.2%, respectively. This method have uncertainty of measurement is 0.8552%. The final result and uncertainty was (84.3334 ± 0.8552) % of methamphetamine in sample. As a conclusion, the validation of analytical methods for determination of methamphetamine using FTIR is very good method. This method is simplicity of sample preparation and low cost reagents. Keywords: Validation, Methamphetamine, FTIR, Spectroscopy. I. Introduction Methamphetamine (MA), are ranked as the second most commonly used drug after cannabis. Up to 53 million people, i.e. 1.2% of the world population are estimated to have used an ATS in 2010. During the years 1998–2010 the seizures of ATS more than trebled and the seizure growth rates were far greater than those of the plant derived drugs (i.e. heroin, cocaine and cannabis). MA was the most prevalent ATS seized worldwide in 2010 with its seizure rates more than double that of two years earlier [1]. Methamphetamine is a central nervous system stimulant from the amphetamine family. It produces alertness, and elation, along with a variety of adverse reactions. First Synthesized in 1887, in the 1930s it was sold in the U.S. as a nasal spray for treatment of inflammation of nasal passages and as treatment for narcolepsy. During World War II, both sides used it to improve soldiers’ performance. This became a major problem in Japan after World War II as they experienced the first known epidemic of methamphetamine abuse. In 1970, the Controlled Substances Act regulated the production of methamphetamine [2]. Today much of the methamphetamine available on the street is illicit and produced in clandestine laboratories. Methamphetamine’s effects include euphoria, hyper-excitability, extreme nervousness, accelerated heartbeat, sweating, restlessness, insomnia, tooth grinding and incessant talking. Users of large amount of methamphetamine over a long period can develop an amphetamine psychosis, which is a mental disorder similar to paranoid schizophrenia. Methamphetamine abuse develops moderate physical and psychological dependence as well as a strong tolerance. Withdrawal symptoms can occur when use of any amphetamines is stopped abruptly [3]. Fourier Transform Infrared Spectroscopy (FTIR) has emerged as a powerful analytical technique used in pharmaceutical sciences [4]. Fourier Transform Infrared Spectroscopy (FTIR) is a well established analytical technique for organic molecules, with the mid-IR region (4000 cm -1 to 400 cm -1 ) being rich in information about the structure of the functional groups within the analyte. FTIR can be used quantitatively, as the energy absorbed at a particular wavelength is in proportion to the number of bonds absorbing the associated quanta of energy, so with larger concentrations of analyte more of the energy will be absorbed [5]. Methamphetamine is an amphetamine derivative that has a history as a periodi-cally popular drug of abuse. Ogata first synthesized the drug in Japan in 1919, patented in 1920, and later licensed to Burroughs Wellcome, who marketed it as the anorectic Methedrine. There are a variety of popular terms including meth, crystal, crystal meth, ice, speed, whiz, and crank, for the name of methamphetamine. No term is specific for particular grade or chemical product, although these terms generally reserved for illicit preparations, as opposed
Transcript of Validation of Analytical Methods for Determination of...

IOSR Journal of Pharmacy and Biological Sciences (IOSR-JPBS)
e-ISSN:2278-3008, p-ISSN:2319-7676. Volume 11, Issue 5 Ver. III (Sep. - Oct.2016), PP 51-59
www.iosrjournals.org
DOI: 10.9790/3008-1105035159 www.iosrjournals.org 51 | Page
Validation of Analytical Methods for Determination of
Methamphetamine Using Fourier Transform Infrared (FTIR)
Spectroscopy
Riyanto1 and Sri Wulan Nas
2
1Department of Chemistry, Faculty of Mathematics and Natural Science, Islamic University of Indonesia,
Jalan Kaliurang KM 14,5 Sleman Yogyakarta Indonesia 55584 2Department of Analytical Chemistry, Faculty of Mathematics and Natural Science,
Islamic University of Indonesia, Jalan Kaliurang KM 14,5 Sleman Yogyakarta Indonesia 55584
Abstract: Validation of analytical methods for determination of methamphetamine using Fourier Transform
Infrared (FTIR) Spectroscopy has been done. Parameter validation method are the repeatability of the system
(precision), accuracy, linear ranges, limit of detection (LOD) and limit of quantification (LOQ). Samples was
prepared by mixing a weighed portion of methamphetamine standard and alum and swirled flatly to
homogeneous mixture. The mixture with total weighed of powder obtained is approximately 1.0 g. This sample
was analysis using FTIR. The results of the study showed that the correlation of determination analysis
methamphetamine using FTIR was R2=0.9998 at functional group with wave length number 698.83 cm
-1.
Precision, RSD Horwitz, LOQ, LOD and recovery of the validation of analytical methods for determination of
methamphetamine using FTIR were found to be 0.0087%, 2.052%, 2.3035%, 7.6786%, and 104.2%,
respectively. This method have uncertainty of measurement is 0.8552%. The final result and uncertainty was
(84.3334 ± 0.8552) % of methamphetamine in sample. As a conclusion, the validation of analytical methods for
determination of methamphetamine using FTIR is very good method. This method is simplicity of sample
preparation and low cost reagents.
Keywords: Validation, Methamphetamine, FTIR, Spectroscopy.
I. Introduction Methamphetamine (MA), are ranked as the second most commonly used drug after cannabis. Up to 53
million people, i.e. 1.2% of the world population are estimated to have used an ATS in 2010. During the years
1998–2010 the seizures of ATS more than trebled and the seizure growth rates were far greater than those of the
plant derived drugs (i.e. heroin, cocaine and cannabis). MA was the most prevalent ATS seized worldwide in
2010 with its seizure rates more than double that of two years earlier [1].
Methamphetamine is a central nervous system stimulant from the amphetamine family. It produces
alertness, and elation, along with a variety of adverse reactions. First Synthesized in 1887, in the 1930s it was
sold in the U.S. as a nasal spray for treatment of inflammation of nasal passages and as treatment for narcolepsy.
During World War II, both sides used it to improve soldiers’ performance. This became a major problem in
Japan after World War II as they experienced the first known epidemic of methamphetamine abuse. In 1970, the
Controlled Substances Act regulated the production of methamphetamine [2]. Today much of the
methamphetamine available on the street is illicit and produced in clandestine laboratories. Methamphetamine’s
effects include euphoria, hyper-excitability, extreme nervousness, accelerated heartbeat, sweating, restlessness,
insomnia, tooth grinding and incessant talking. Users of large amount of methamphetamine over a long period
can develop an amphetamine psychosis, which is a mental disorder similar to paranoid schizophrenia.
Methamphetamine abuse develops moderate physical and psychological dependence as well as a strong
tolerance. Withdrawal symptoms can occur when use of any amphetamines is stopped abruptly [3].
Fourier Transform Infrared Spectroscopy (FTIR) has emerged as a powerful analytical technique used
in pharmaceutical sciences [4]. Fourier Transform Infrared Spectroscopy (FTIR) is a well established analytical
technique for organic molecules, with the mid-IR region (4000 cm-1
to 400 cm-1
) being rich in information about
the structure of the functional groups within the analyte. FTIR can be used quantitatively, as the energy
absorbed at a particular wavelength is in proportion to the number of bonds absorbing the associated quanta of
energy, so with larger concentrations of analyte more of the energy will be absorbed [5].
Methamphetamine is an amphetamine derivative that has a history as a periodi-cally popular drug of
abuse. Ogata first synthesized the drug in Japan in 1919, patented in 1920, and later licensed to Burroughs
Wellcome, who marketed it as the anorectic Methedrine. There are a variety of popular terms including meth,
crystal, crystal meth, ice, speed, whiz, and crank, for the name of methamphetamine. No term is specific for
particular grade or chemical product, although these terms generally reserved for illicit preparations, as opposed

Validation of Analytical Methods for Determination of Methamphetamine Using Fourier ….
DOI: 10.9790/3008-1105035159 www.iosrjournals.org 52 | Page
to diverted pharmaceuticals. Frequently, drugs sold as methamphetamine may in fact contain no
methamphetamine at all, and are actually substitutes such as caffeine, ephedrine, pseudoephedrine, or even co-
caine, depending on local drug availability. Fig. 1. shown is Chemical structure of methamphetamine or (S)-
N,)-dimethylbenzeneethanamine [2].
Figure 1. Chemical structure of methamphetamine or (S)-N,)-dimethylbenzeneethanamine
Drug abuse is widely considered to be one of the most serious social problems in all areas of the
developed world. At present, d-methamphetamine hydrochloride (MA) is the most extensively abused drug in
Japan and most areas of the US and Europe. Studies have shown that rates of MA abuse in Japan are growing
fastest among teen-agers and the amount of seized MA is increasing rapidly. Development of rapid, convenient,
and accurate analytical methods for the identification of MA is a high priority for the Japanese forensic
community. Fourier transform infrared absorption spectroscopy (FTIR) has historically been used extensively
for the identification of MA. However, dilution with inorganic salts such as potassium bromide and sodium
chloride and formation of a pellet comprise the normal required pretreatment for FTIR analysis. Such
pretreatment is relatively time-consuming, destroys the sample, increases the risk of contamination and requires
operator contanct with the hazardous material [5].
A variety of analytical techniques, for example titrimetry [6], spectroscopy [7], capillary
electrophoresis [8-10], liquid chromatography [11-14] and gas chromatography [15-18] have been used for
quantization of amphetamine and methamphetamine in different real samples. Undoubtedly, GC coupled on-line
to a MS detection system is the most powerful technique for identification and confirmation of amphetamines.
However, there are laboratories around the world, especially in developing countries, which cannot afford such
an expensive instrument. In these laboratories, identification of amphetamines, especially in forensic cases, has
been performed by high-performance liquid chromatography diode array detector (HPLC-DAD) as the most
rational and universal separation and identification technique. However, many of these techniques require a
process that requires the destruction of a complicated, long analysis time, high cost, sophisticated instruments
and skilled operators. FTIR technique has the advantage of a simple, rapid, time-saving, inexpensive, sensitive,
and in-situ detection of traces of various analytes and is widely used in the detection of drugs such as MA [19].
In the present work a new, simple and precise method is proposed for the determination of MA in
drugs. Validation of analytical methods for determination of methamphetamine using Fourier Transform
Infrared (FTIR) Spectroscopy has been done. Parameter validation method are the repeatability of the system
(precision), accuracy, linear ranges, limit of detection (LOD) and limit of quantification (LOQ). The validation
of analytical methods for determination of methamphetamine using FTIR is very good method. This method is
simplicity of sample preparation and low cost reagents.
II. Experiments
2.1 Solvents and reagents
The reagents used were of highest purity (>99.95 % purity), methamphetamine (C10H15N.HCl)
samples, were supplied from the National Narcotics Agency (BNN) Indonesia. A total of 1 g; 0.9 g; 0.8 g; 0.7 g;
0.6 g; 0.5 g; 0.4 g; 0.3 g; 0.2 g; 0.1 g of pure methamphetamine powder and put in a cup that has been labeled.
Each coupled with alum-weight to 1 g and shaken until homogeneous. It is a standard methamphetamine with a
concentration of 100%, 90%, 80%, 70%, 60%, 50%, 40%, 30%, 20%, and 10% will be used for the preparation
of calibration curve and determination of methamphetamine.
2.2 Validation of Analytical Methods
The values for the precession of the system (RSD % ≤ 2.0, n = 7) show that the system is precise and
method validation. The linear range of the method was studied by analyzing in duplicate ten concentrations of
each compound ranging from 10.0 to 100.0 %. The obtained linear ranges for each of the methamphetamine
with corresponding correlation coefficients (R2) are given in paper. Limit of detection (LOD) and limit of
quantification (LOQ) by an empirical method that consisted of analyzing a series of standard solutions
containing decreasing amounts of methamphetamine were determined. The limit of detection was calculated by
Validation of Analytical Methods for Determination of Methamphetamine Using Fourier ….
DOI: 10.9790/3008-1105035159 www.iosrjournals.org 53 | Page
LOD=(3Sy/x)/a where Sy/x is the standard deviation of the response of the blank and a is the slope of the
calibration curve. The limit of quantification was calculated by LOQ=(10Sy/x)/a. The limits were validated by
analyzing standards prepared at the concentrations of the LOQs for each standard and their precision and
accuracy were assessed
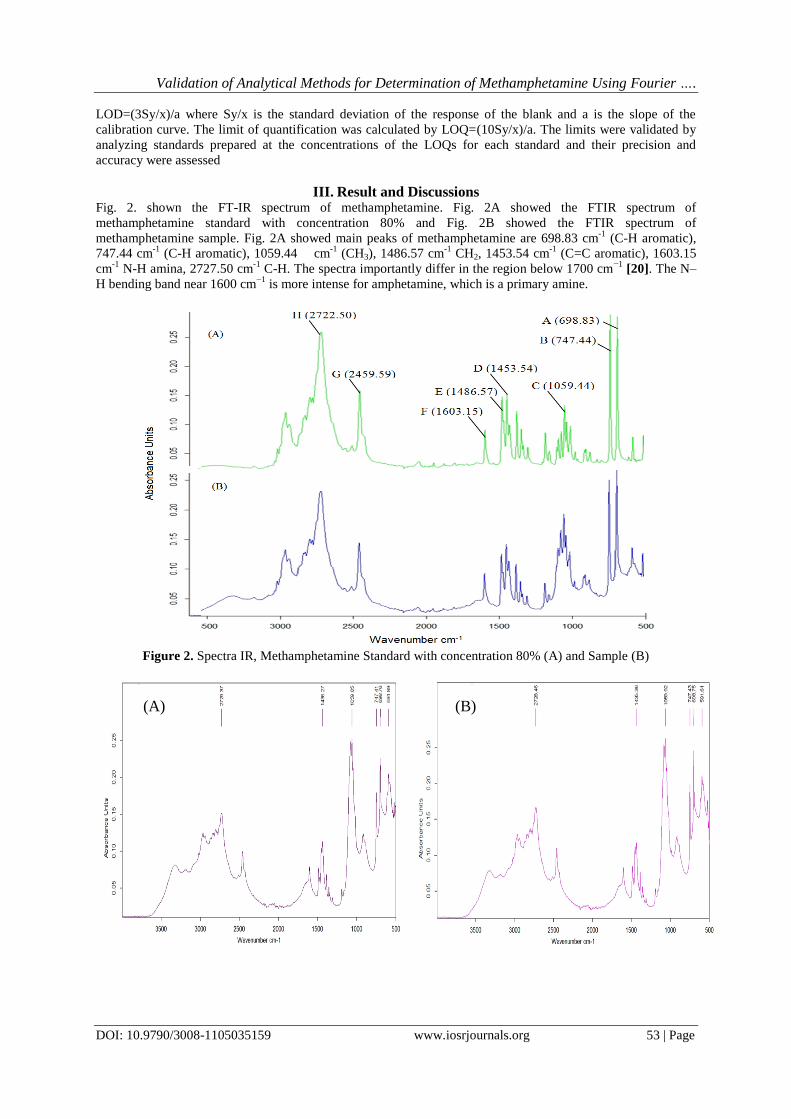
III. Result and Discussions Fig. 2. shown the FT-IR spectrum of methamphetamine. Fig. 2A showed the FTIR spectrum of
methamphetamine standard with concentration 80% and Fig. 2B showed the FTIR spectrum of
methamphetamine sample. Fig. 2A showed main peaks of methamphetamine are 698.83 cm-1
(C-H aromatic),
747.44 cm-1
(C-H aromatic), 1059.44 cm-1
(CH3), 1486.57 cm-1
CH2, 1453.54 cm-1
(C=C aromatic), 1603.15
cm-1
N-H amina, 2727.50 cm-1
C-H. The spectra importantly differ in the region below 1700 cm−1
[20]. The N–
H bending band near 1600 cm−1
is more intense for amphetamine, which is a primary amine.
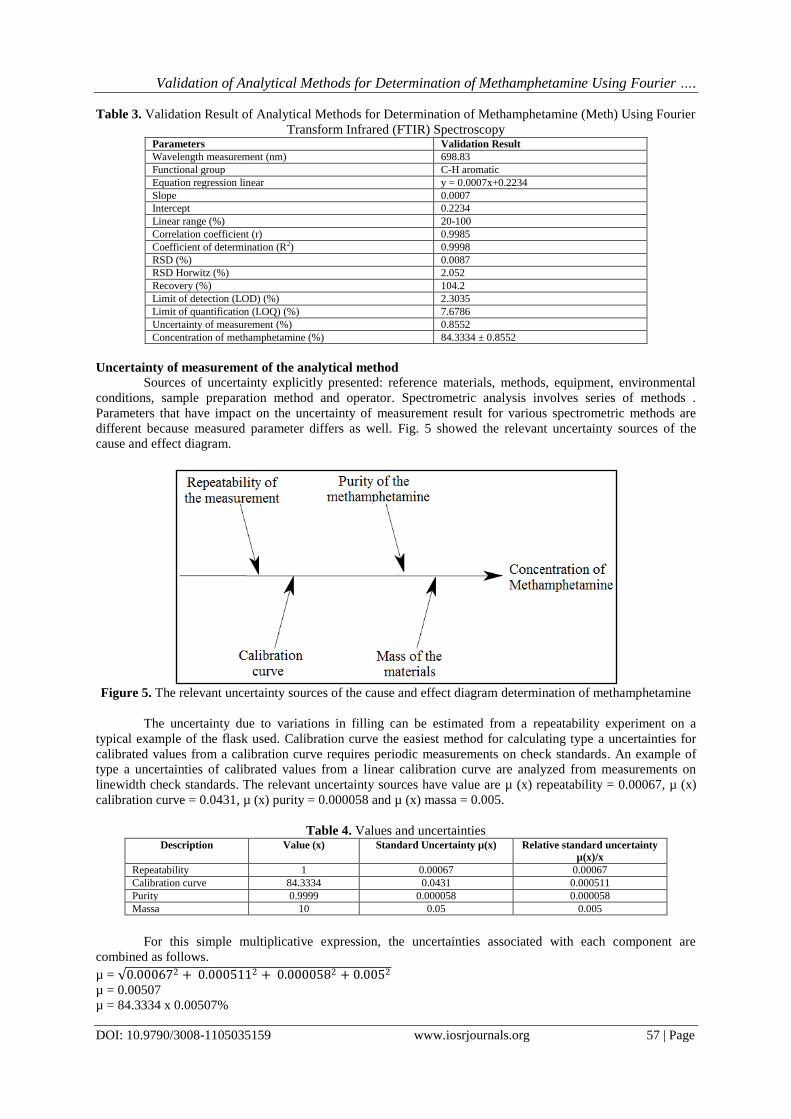
Figure 2. Spectra IR, Methamphetamine Standard with concentration 80% (A) and Sample (B)
(A) (B)

Validation of Analytical Methods for Determination of Methamphetamine Using Fourier ….
DOI: 10.9790/3008-1105035159 www.iosrjournals.org 54 | Page
Figure 3. FTIR spectra of Methamphetamine with concentration (A) 20% (B) 40% (C) 60% (D) 80% and (E)
100%
Fig. 3 shown FTIR spectra of methamphetamine with various concentrations are (A) 20% (B) 40% (C)
60% (D) 80% and (E) 100%. Calibration curve is an essential stage in most measurement procedures. Fig. 3
shown the increases in absorbance peaks at wavelength number are 698.83, 747.44, 1059.44, 1486.57, 1453.54,
1603.15 and 2727.50 cm-1
. Each peak has a specific wave number. For the purposes of quantitative analysis,
correlation between the concentration methamphetamine by absorbance is a very importance. Analytic
parameters of the methamphetamine using FTIR at wave number of measurement with various concentrations
show at Table 1.
Table 1. Analytic Parameters of the Methamphetamine using FTIR at Wave number of Measurement Peaks
Symbol
Wave number cm-1 of
Measurement
Functional Group Analytical Parameters
Regressions Linear Rate of Determination (R2)
A 698.83 C-H aromatic y = 0.0007x + 0.2234 0.9998
B 747.44 C-H aromatic y = 0.0015x + 0.1524 0.8261
C 1059.44 CH3 y = -0.0004x + 0.1290 0.6712
D 1453.54 CH2 y = 0.0005x + 0.0991 0.9535
E 1486.57 C=C aromatic y = -0.0004x + 0.1290 0.6712
F 1603.15 N-H amina y = 0.0003x + 0.0680 0.7813
G 2727.50 C-H y = 0.0016x + 0.1121 0.8326
(C) (D)
(E)

Validation of Analytical Methods for Determination of Methamphetamine Using Fourier ….
DOI: 10.9790/3008-1105035159 www.iosrjournals.org 55 | Page
Figure 4. Callibration curve, where 698.83 cm-1
(C-H Aromatic) (A); 747.44 cm-1
(C-H Aromatic) (B); 1059.44
cm-1
(CH3) (C); 1486.57 cm-1
CH2 (D); 1453.54 cm-1
(C=C Aromatic) (E); 1603.15 cm-1
N-H Amina (F);
2727.50 cm-1
C-H (G)
Fig. 4 shows the methamphetamine peak in the vicinity of 698.83 cm-1 which was used to generate the
calibration curve. An excellent correlation coefficient of 0.9998 was obtained with respect to the calibration
curve generated from this, as shown in Fig. 4A. The calibration curves for methamphetamine were found by the
results of FTIR method. Fig. 4A shows the calibration curve for the concentration of methamphetamine with
wavelength number is 698.83 cm-1
(C-H Aromatic). The spectra FTIR obtained for methamphetamine with
various concentrations that were linear over the concentration range of 20-100%. In this Fig. 4A, absorbances
y = 0.0007x + 0.2234R² = 0.9998
0
0.1
0.2
0.3
0.4
0 50 100 150
Ab
sorb
ance
Methamphetamine (%)
y = 0.0015x + 0.1524
R² = 0.8261
0
0.1
0.2
0.3
0.4
0 20 40 60 80 100 120
Ab
sorb
an
ce
Methamphetamine (%)
y = -0.0004x + 0.1290
R² = 0.67120
0.05
0.1
0.15
0 20 40 60 80 100 120
Ab
sorb
an
ce
Methamphetamine (%)
y = 0.0005x + 0.0991
R² = 0.9535
0
0.05
0.1
0.15
0.2
0 20 40 60 80 100 120
Ab
sorb
an
ceMethamphetamine (%)
y = -0.0004x + 0.1290
R² = 0.6712
0
0.05
0.1
0.15
0 20 40 60 80 100 120
Ab
sorb
an
ce
Methamphetamine (%)
y = 0.0003x + 0.0680
R² = 0.7813
0
0.02
0.04
0.06
0.08
0.1
0 20 40 60 80 100 120
Ab
sorb
an
ce
Methamphetamine (%)
y = 0.0016x + 0.1121
R² = 0.8326
0
0.1
0.2
0.3
0 20 40 60 80 100 120
Ab
sorb
an
ce
Methamphetamine (%)
(A) (B)
(C) (D)
(E) (F)
(G)

Validation of Analytical Methods for Determination of Methamphetamine Using Fourier ….
DOI: 10.9790/3008-1105035159 www.iosrjournals.org 56 | Page
were plotted against the concentration of methamphetamine and linear regression analysis completed on the
resulting curve. From the calibration curve, the correlation of determination (R2) recorded is 0.9998. Linear
regression equation (Fig. 4A) is y = 0.0007x + 0.2234 with slope 0.0007 and intercept is 0.2234. The linear
regression equation can be used to determine the concentration of methamphetamine in forensic sample.
Table 2. Concentration of Methamphetamine (%) in samples using FTIR method Code Number of Measurement Absorbanc Concentration of Methamphetamine (%)
Sample 1 1 0.286 89.429
2 0.285 88.000
3 0.287 90.857
4 0.286 89.429
5 0.286 89.429
6 0.287 90.857
7 0.286 89.429
8 0.285 88.000
9 0.287 90.857
10 0.287 90.857
Sample 2 1 0.279 79.429
2 0.278 78.000
3 0.280 80.857
4 0.279 79.429
5 0.280 80.857
6 0.279 79.429
7 0.279 79.429
8 0.278 78.000
9 0.279 79.429
10 0.279 79.429
Sample 3 1 0.282 83.714
2 0.282 83.714
3 0.281 82.286
4 0.283 85.143
5 0.282 83.714
6 0.283 85.143
7 0.281 82.286
8 0.282 83.714
9 0.283 85.143
10 0.282 83.714
Table 2 shown of methamphetamine (%) concentration in samples using FTIR method. Sample 1, 2
and 3 derived from the same samples. This data can be used for determination of precision. Precision is a
measure of the closeness of the analytical results obtained from a series of replicate measurements of the same
measure under the conditions of the method. It reflects the random errors which occur in a method. Precision is
usually measured as the coefficient of variation or relative standard deviation of analytical results obtained from
independently prepared quality control standards [21-22]. The precision of a measurement is a measure of the
reproducibility of a set of measurements. Precision has been obtained by the analysis of samples by the same
method as much as 10 replications. Results of the analysis of the precision values (RSD) and RSD Horwitz are
0.0087% and 2.052%, respectively. This method has a good precision as below the limit of 2%.
The limit of detection expresses the lowest concentration of analyte that can be detected for a given
type of sample, instrument, and method. If a sample is measured as having a concentration below this value (or
gives a reading indistinguishable from the baseline), the best we can say confidently about the sample is that any
analyte present is below the LOD; we can never claim that the sample does not contain the analyte in question,
since there is always the possibility that it does, but not in detectable amounts. The LOD is defined as the lowest
concentration that can be distinguished from the background noise with a certain degree of confidence. Limit of
detection (LOD) and limit of quantification (LOQ) are two important performance characteristics in method
validation. LOD and LOQ are terms used to describe the smallest concentration of an analyte that can be
reliably measured by an analytical procedure [23-24]. LOD and LOQ of the analysis methamphetamine using
FTIR method were found to be 2.3035% and 7.6786%, respectively.
Recovery experiments should be performed by comparing the analytical results for extracted samples at
three concentrations. Recovery of the analyte need not be 100%, but the extent of recovery of an analyte and of
the internal standard should be consistent, precise, and reproducible. Table 1 showed analysis methamphetamine
using FTIR method have a good recovery is close to 100%.
Validation of Analytical Methods for Determination of Methamphetamine Using Fourier ….
DOI: 10.9790/3008-1105035159 www.iosrjournals.org 57 | Page
Table 3. Validation Result of Analytical Methods for Determination of Methamphetamine (Meth) Using Fourier
Transform Infrared (FTIR) Spectroscopy Parameters Validation Result
Wavelength measurement (nm) 698.83
Functional group C-H aromatic
Equation regression linear y = 0.0007x+0.2234
Slope 0.0007
Intercept 0.2234
Linear range (%) 20-100
Correlation coefficient (r) 0.9985
Coefficient of determination (R2) 0.9998
RSD (%) 0.0087
RSD Horwitz (%) 2.052
Recovery (%) 104.2
Limit of detection (LOD) (%) 2.3035
Limit of quantification (LOQ) (%) 7.6786
Uncertainty of measurement (%) 0.8552
Concentration of methamphetamine (%) 84.3334 ± 0.8552
Uncertainty of measurement of the analytical method
Sources of uncertainty explicitly presented: reference materials, methods, equipment, environmental
conditions, sample preparation method and operator. Spectrometric analysis involves series of methods .
Parameters that have impact on the uncertainty of measurement result for various spectrometric methods are
different because measured parameter differs as well. Fig. 5 showed the relevant uncertainty sources of the
cause and effect diagram.
Figure 5. The relevant uncertainty sources of the cause and effect diagram determination of methamphetamine
The uncertainty due to variations in filling can be estimated from a repeatability experiment on a
typical example of the flask used. Calibration curve the easiest method for calculating type a uncertainties for
calibrated values from a calibration curve requires periodic measurements on check standards. An example of
type a uncertainties of calibrated values from a linear calibration curve are analyzed from measurements on
linewidth check standards. The relevant uncertainty sources have value are µ (x) repeatability = 0.00067, µ (x)
calibration curve = 0.0431, µ (x) purity = 0.000058 and µ (x) massa = 0.005.
Table 4. Values and uncertainties Description Value (x) Standard Uncertainty µ(x) Relative standard uncertainty
µ(x)/x
Repeatability 1 0.00067 0.00067
Calibration curve 84.3334 0.0431 0.000511
Purity 0.9999 0.000058 0.000058
Massa 10 0.05 0.005
For this simple multiplicative expression, the uncertainties associated with each component are
combined as follows.
µ = 0.000672 + 0.0005112 + 0.0000582 + 0.0052 µ = 0.00507
µ = 84.3334 x 0.00507%

Validation of Analytical Methods for Determination of Methamphetamine Using Fourier ….
DOI: 10.9790/3008-1105035159 www.iosrjournals.org 58 | Page
µ = 0.427597%
Uncertainty is expressed as combined expanded measurement uncertainty. The expanded uncertainty U (c
methamphetamine) is obtained by multiplying the combined standard uncertainty with a coverage factor of 2
provides ~95% level of confidence, giving:
U (c methamphetamine) = 0.427597 x 2%
U (c methamphetamine) = 0.8552%
Final result is = 84.3334 ± 0.8552%
The final result and uncertainty was (84.3334 ± 0.8552)% of methamphetamine or expressed as 0.8552% with
associated uncertainty.
IV. Conclusion FTIR is very good method for determination of methamphetamine in forensics sample. This method is
simplicity of sample preparation and low cost reagents. FTIR method was conducted to generate a calibration
curve with methamphetamine sample at concentrations from 10% to 100%. Using either method, an excellent
correlation coefficient of 0.9998 was obtained, confirming that these methods are effective for quantitative
analysis of methamphetamine. The study showed that the correlation of determination analysis
methamphetamine using FTIR was R2=0.9998 at functional group with wave length number 698.83 cm
-1.
Precision, RSD Horwitz, LOQ, LOD and recovery of the validation of analytical methods for determination of
methamphetamine using FTIR were found to be 0.0087%, 2.052%, 2.3035%, 7.6786%, and 104.2%,
respectively. This method have uncertainty of measurement is 0.8552%. The final result and uncertainty was
(84.3334 ± 0.8552) % of methamphetamine in sample.
Acknowledgment This research was supported by the Ministries of Research, Technology, and Higher Education
Republic of Indonesia through “Hibah Bersaing” Research Grant 2016 for the financial support.
References [1]. J. Hughes, G. Ayoko, S. Collett, and G. Golding, Rapid quantification of methamphetamine: Using attenuated total reflectance
Fourier Transform Infrared Spectroscopy (ATR-FTIR) and Chemometrics, Plos One Journal., 8(7), 2013, 1-7. [2]. U.S. Department of Justice, Drugs of Abuse (Washington, 1997).
[3]. O. Baran, Determination of Narcotic and Psychotropic Substances by Using Infrared Spectroscopy (A Thesis Submitted to the
Graduate of Natural and Applied Sciences of Middle East Technical University, 2005). [4]. P. Rakesh, P. Charmi, and K.S. Rajesh, Quantitative analytical applications of FTIR spectroscopy in pharmaceutical and allied
areas, J. Adv. Pharm. Edu. & Res., 4(2), 2014, 145-157.
[5]. H. Tsuchihashi, M. Katagi, M. Nishikawa, M. Tatsuno, H. Nishioka, A. Nara, E. Nishio, and C. Petty, Determination of methamphetamine and its related compounds using Fourier Transform Raman Spectroscopy, Applied Spectroscopy, 51(12), 1997,
1796-1799.
[6]. N. Velghe, and A. Claeys, Titrimetric determination of amphetamine sulphate in tablets, Analyst., 98, 1973, 372-377. [7]. C.M. Legua, F.P. Campins, C.A. Sevillano, Extractive-spectrophotometric determination of amphetamine in urine samples with
sodim 1,2-naphthoquinone 4-sulphonate, Analytica chimica acta, 275, 1993, 23-48.
[8]. M. Nieddu, G. Boatto, A. Carta, A. Sanna, and M. Pisano, Simultaneous determination of ten amphetamine designer drugs in human whole blood by capillary electrophoresis with diode array detection, Biomedical Chromatography, 19, 2005, 737-743.
[9]. V.C. Trenerry, J. Robertson, and R.J. Wells, Analysis of illicit amphetamine seizures by capillary electrophoresis. J. Chromatogr.
A., 708, 1995, 169-173. [10]. R. Iio, S. Chinaka, S.Tanaka, N. Takayama, and K. Hayakawa, Simultaneous chiral determination of methamphetamine and its
metabolites in urine by capillary electrophoresis-mass spectrometry, Analyst, 128, 2003, 646-653.
[11]. Pavlova, V. Trajkovska, and S.P. Jovanoviæ, HPLC separation and identification of amphetamine and methamphetamine in combination with caffeine (Proceedings of 2nd International Symposium of Ecologist of the Republic, 2007).
[12]. M. Longo, C. Martines, L. Rolandi, and A. Cavallaro, Simple and fast determination of some phenethylamines in illicit tablets by
base-deactivated reversed phase HPLC, J. Liquid Chromatogr, 17, 1994, 649-657.
[13]. N.A. Santagati, G. Ferrara, A. Marrazzo, and G. Ronsisvalle, Simultaneous determination of amphetamine and one of is metabolites
by HPLC with electrochemical detection, J. Pharm. Biomed. Anal. 30, 2002, 247-256.
[14]. Pavlova, and S.P. Jovanović, Simultaneous determination of amphetamine, methamphetamine, and caffeine in seized tablets by High-Performance Liquid Chromatography, Acta Chromatographica, 18, 2007, 157-167.
[15]. M. Pelegrini, F. Rosati, R. Pacifici, P. Zuccaro, F.S., Romalo, and A. Lopez, Rapid screening method for determination of ecstasy
and amphetamines in urine samples using gas chromatography–chemical ionization mass spectrometry, J. Chromatogr. B, 769, 2002, 243-250.
[16]. B. Mitrevski, Z. Zdravkovski, and V. Pavlova, Rapid and simple method for direct amphetamines separation and determination in forensic samples by GCFID (Proceedings on the 18th Congress of Chemists and Technologists of Macedonia. ACE-18, Ohrid,
Macedonia, 2004).
[17]. J.L. Villamor, A.M. Bermejo, P. Fernández, and M.J. Tabernero. GCMS determination of amphetamines in human urine, Analytical Letters, 38, 2005, 781-795.
[18]. B.D. Paul, J. Jemionek, D. Lesser, A. Jacobs, and D.A. Searles, Enantiomeric separation and quantitation of (+/-)-amphetamine, (+/-
)-methamphetamine, (+/-)-MDA, (+/-)-MDMA, and (+/-)-MDEA in urine specimens by GC-EI-MS after derivatization with (R)-(-)- or (S)-(+)-alpha-methoxy-alpha-(trifluoromethy)phenylacetyl chloride (MTPA), J. Anal. Toxicol., 28 (6), 2004, 449-455

Validation of Analytical Methods for Determination of Methamphetamine Using Fourier ….
DOI: 10.9790/3008-1105035159 www.iosrjournals.org 59 | Page
[19]. Laboratory and Scientific Section, United Nations Office on Drugs and Crime Vienna, Recommended Methods for the Identification
and Analysis of Amphetamine, Methamphetamine and Their Ring-substituted Analogues in Seized Materials (United Nations, New
York, 2006). [20]. Clark J., The fingerprint region of an infrared spectrum (New York: Marcel Dekker Inc., 2000).
[21]. B. Renger, H. Jehle, M. Fischer and W. Funk, Validation of analytical procedures in pharmaceutical analytical chemistry: HPTLC
assay of theophylline in an effervescent tablet, J. Planar Chrom., 8, 1995, 269–278. [22]. Wegscheider, Validation of analytical methods, in: Accreditation and quality assurance in analytical chemistry (Springer Verlag,
Berlin, 1996).
[23]. J. Dobilienė, E. Raudienė, and R.P. Žilinskas, Uncertainty of Spectrometric Analysis (12th Joint Symposium on Man Science & Measurement September, Annecy, France. 2008).
[24]. S.H. Queenie and Chui, Uncertainties related to linear calibration curves: A case study for flame atomic absorption spectrometry, J.
Braz. Chem. Soc., 18(2), 2007, 424-430.