*Corresponding author G.Alekhya, Email: alekhya.chinnu@gmail

EFFICIENCY GAIN OF LOW-SPEED AXIAL FLOW ROTORS DUE TO FORWARD
SWEEP
VAD, János (corresponding author)
Department of Fluid Mechanics
Faculty of Mechanical Engineering
Budapest University of Technology and Economics
Bertalan Lajos u. 4 – 6.
H-1111 Budapest, Hungary
Telephone: +36 1 463 2464
Fax: +36 1 463 3464
Email: [email protected]
HALÁSZ, Gábor
Department of Hydrodynamic Systems
Faculty of Mechanical Engineering
Budapest University of Technology and Economics
Műegyetem rkp. 3.
H-1111 Budapest, Hungary
Telephone: +36 1 463 1690
Fax: +36 1 463 3091
Email: [email protected]
BENEDEK, Tamás
Department of Fluid Mechanics
Faculty of Mechanical Engineering
Budapest University of Technology and Economics
Bertalan Lajos u. 4 – 6.
H-1111 Budapest, Hungary
Telephone: +36 1 463 2635
Fax: +36 1 463 3464
Email: [email protected]
Abstract:
The paper aims at discovering the relationship between the spanwise gradient of blade circulation and
the total efficiency gain due to forward sweep, in the case of low-speed axial flow fans, at the design
point. For this purpose, an extensive set of literature data have been processed and evaluated by
statistical means. A trend function has been established for quantifying the aforementioned
relationship. By such means, it has been pointed out that the efficiency gain due to forward sweep tends
to increase with the spanwise gradient of blade circulation. This means that the purposeful
incorporation of forward sweep in the design process offers an increased potential for efficiency
improvement in the case of rotors of controlled vortex design. The maximum efficiency gain has been
observed to be 2 to 3 percent, due to an in-house developed design method. It has been noted that the
efficiency improvement due to forward sweep tends to be minor for free-vortex rotors. Furthermore,
the efficiency tends to deteriorate if spanwise decreasing blade circulation occurs in forward-swept
rotors. Remarks have been made on the means of simultaneous reduction of loss and noise related to
low-speed axial fans, for a prescribed aerodynamic performance.
Keywords:
axial flow fan, efficiency improvement, forward sweep, controlled vortex design, noise reduction
1 INTRODUCTION AND OBJECTIVES
The rotors of low-speed axial flow fans – used e.g. in cooling, ventilating, air conditioning, and
industrial air technology (e.g. combustion air supply) – form the subject of the paper, with
consideration of incompressible flow. In these days, the efficiency of energy-related products is to
correspond to quantitative measures [1]. The Directive 2009/125/EC [2] aims at the ecodesign of
energy-related products. The execution of Directive [2] with regard to fans is guaranteed by Regulation
327/2011/EU [3], being effective as of April 2011. Regulation 327/2011/EU [3] sets efficiency
demands on fans of various types. Only those fans are permitted to be placed on the market and to be
put into service of which efficiency is equal to or greater than the target value set by Regulation [3], at
the optimal energy efficiency point. The energy efficiency requirements formulated in [3] came into
effect in January 2013. From January 2015, the prescribed efficiency target values will become even
more strict [3]. For axial flow fans, a total efficiency target value increased by 8 percent is to be
achieved. In addition to EU Regulation [3], the U.S. Regulation [4] is also referred to herein for recent
prescription of energy efficiency demands for commercial and industrial fans.
In addition to the initiative for rational use of energy converted to driving the fans, manifested in
[3], the improvement of fan efficiency is also an important issue for the fan manufacturers. It enables
the use of fan-driving electric motors of less nominal shaft power for realising a prescribed
aerodynamic performance. On this basis, motors of smaller size, lower weight, and reduced purchase
price can be applied, thus improving the competitiveness of the fan on the market.
The above overview reflects that the improvement of fan total efficiency, , at a prescribed
aerodynamic performance, by means of – among others – innovative aerodynamic design techniques, is
a current engineering target. Axial flow fan rotors, operating near the design flow rate, form the subject
of the present article. One example for the aerodynamic analysis on an axial flow industrial fan is paper
[5], referring to Regulation [3] for setting the efficiency target in fan redesign.
In the classic free vortex design (FVD) of axial flow rotor blade rows, spanwise constant blade
circulation is prescribed. As an alternative to the FVD method, industrial axial fan rotors are often of
controlled vortex design (CVD), i.e. the blade circulation as well as the isentropic total pressure rise
increases along the blade span in a prescribed manner. The benefits of CVD are outlined in reference
[6].
For quantification of the intensity of change of isentropic total pressure rise along the blade span,
the circulation gradient parameter, G, a spanwise-averaged representative value of radial circulation
gradient, d/dR, is introduced herein.
A blade is swept when the sections of a datum – unswept – blade of radial stacking line are shifted
parallel to their chord. Forward sweep (FSW) means that, considering the relative flow field, the blade
leading edge at a given radius is shifted upstream of the neighboring leading edge at lower radius. FSW
offers a means for noise reduction, as well as a potential for performance and efficiency improvement
via controlling the three-dimensional blade passage flow [6].
CVD and FSW are often applied together, aiming at combining the aforementioned benefits.
Examples are given in Article [6] and in Fig. 1. Fig. 1 presents the CAD image of the industrial fan
rotor examined by Benedek and Vad in paper [7]. As detailed in [6], (i) Both CVD and FSW influence
the three-dimensional interblade flow; (ii) Contrarily, the effects of sweep are often presented in the
literature as features being independent from the fact that the blading has been designed for spanwise
increasing circulation; (iii) Only very few papers comment on the combined effects of CVD and FSW.
In reference [8], Vad proposed a preliminary CVD method, harmonizing the angle of forward sweep
with the spanwise circulation distribution for total efficiency improvement. This can be achieved,
farther away from the endwalls, by means of shortening the flow path length on the blade suction side
in order to minimize the total pressure loss at prescribed isentropic total pressure rise. As summarized
in [6], the near-tip loss, being increased due to CVD, is also moderated if forward sweep is applied.
Therefore, an appropriately chosen forward sweep angle distribution provides a means for by

reducing the loss farther away from the endwalls as well as near the tip, as compared to an unswept
datum rotor. Based on the results of [6, 8], the benefit of FSW, in terms of moderating the total pressure
loss, is expected to be better utilized for the rotors of CVD (by design, G > 0), in comparison to those
of FVD (by design, G = 0). This statement implies the following expected trend: the gain in total
efficiency, – achievable by means of harmonizing the spanwise distributions of sweep angle and
blade circulation –, tends to increase with the increase of G.
To the authors’ best knowledge, so far no information has been made available in the literature on
any quantitative relationship between and G. This article aims at discovering and approximately
quantifying the expected relationship (G), by processing data available in the literature.
The article serves with a method for quantifying an approximate correlation between variables –
such as and G in the present example – in a statistically appropriate manner, by means of statistical
data processing, if the construction of the mathematical function between the quantities – in the present
case, = f(G) – is unknown.
The formulation of the objectives of the paper, processing the literature, and evaluation of the
results have been carried out at the Department of Fluid Mechanics, Budapest University of
Technology and Economics (BME). Preliminary studies were reported by Vad in [9]. The statistical
data processing methodology presented in the Appendix has been elaborated at the Department of
Hydrodynamic Systems, BME.
2 DATA PROCESSING, EVALUATION OF THE RESULTS
Table 1 contains the (G, ) data pairs taken on the basis of literature references [10-22]. These data
pairs are subject to statistical data processing. Comments are made in the table on the case study rotors
and on the way of obtaining the data. References are cited herein in which a gain in total efficiency –
– has been reported, in comparison to an unswept datum rotor, by means of applying FSW. The
data are partly taken from the literature review in [23]. The operational states in the cited case studies
are either exactly the design points or are close to them. This fits to the fact that the Fan Regulation [3]
is related to the optimal energy efficiency points, i.e. design or near-design points. The G value being
representative for a rotor has been determined or estimated on the basis of the (R) distribution in the
annulus region farther away from the endwalls. For each case, the G value has been taken as the
average of the G values characterizing the comparative unswept and FSW rotors under investigation.
The table incorporates the data rows in the order of decreasing values. In a number of cases, 0,
i.e. no improvement or even deterioration of efficiency has occurred by introducing FSW. The table
presents a serial number (column “i”), the reference associated with the data pair (column “Ref.”), the
identifier of the FSW rotor in the cited reference (column “FSW ID”), the rotor design style (column
“Design”: FVD / CVD, occasionally based on an assumption, if not stated explicitly in the reference).
Even in the case of certain rotors of FVD, the rotor realized a spanwise non-uniform circulation
distribution, as the G 0 data indicate. In the “G evaluation” and “ evaluation” columns, the sources
of the related data are commented on. The comment “design” means that the related G data has been
obtained from the designed (R) distribution. The comments “exp” or “CFD” mean that the related
data are based on the results of experiments or Computational Fluid Dynamics (CFD) studies,
respectively.
The statistical data processing method, supported by the data in the last four columns in Table 1, is
detailed in the Appendix. Fig. 2 presents the (G, ) data pairs specified in Table 1 and utilized in
approximating the (G) trend. The data points scatter significantly, which is dedicated to the
following main reasons. (i) The G and data in themselves already have an error associated with
them, due to the error of the source data (e.g. measurement error), and due to the error originating from
the approximative manner of calculating G. The conservatively estimated absolute errors are 0.1 for
G and 0.5 % for . These errors are indicated by error bars in the diagram. (ii) In the cited case
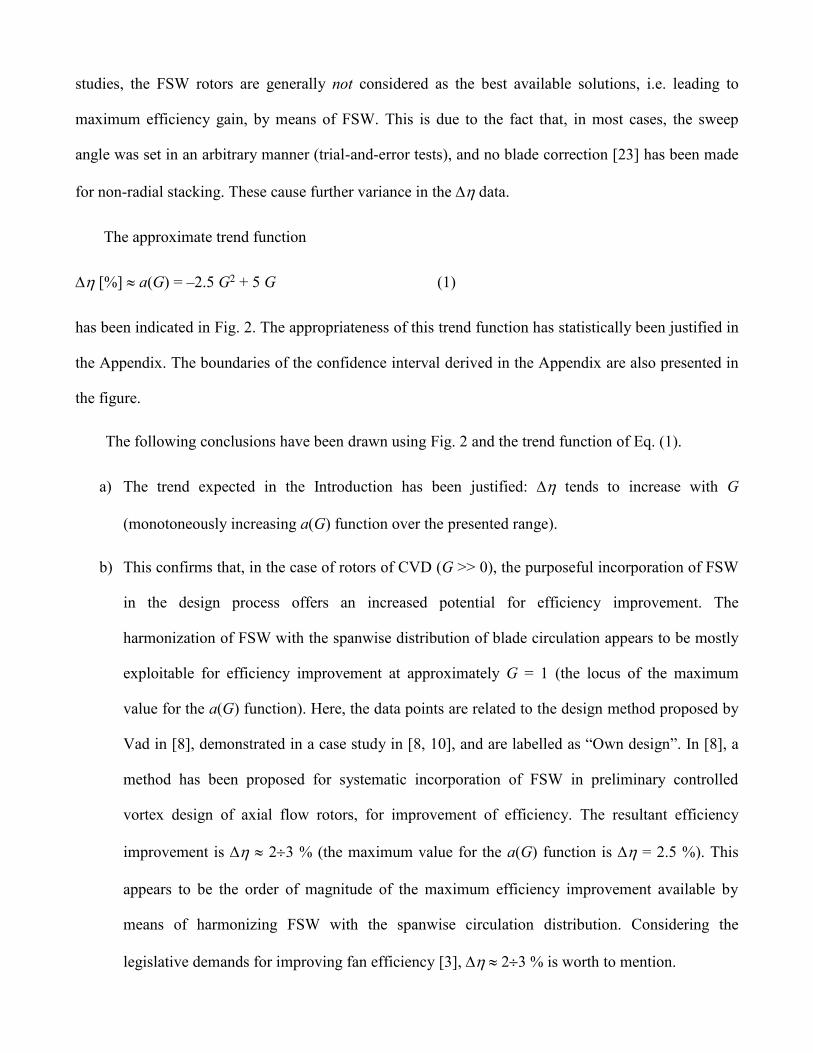
studies, the FSW rotors are generally not considered as the best available solutions, i.e. leading to
maximum efficiency gain, by means of FSW. This is due to the fact that, in most cases, the sweep
angle was set in an arbitrary manner (trial-and-error tests), and no blade correction [23] has been made
for non-radial stacking. These cause further variance in the data.
The approximate trend function
[%] a(G) = –2.5 G2 + 5 G (1)
has been indicated in Fig. 2. The appropriateness of this trend function has statistically been justified in
the Appendix. The boundaries of the confidence interval derived in the Appendix are also presented in
the figure.
The following conclusions have been drawn using Fig. 2 and the trend function of Eq. (1).
a) The trend expected in the Introduction has been justified: tends to increase with G
(monotoneously increasing a(G) function over the presented range).
b) This confirms that, in the case of rotors of CVD (G >> 0), the purposeful incorporation of FSW
in the design process offers an increased potential for efficiency improvement. The
harmonization of FSW with the spanwise distribution of blade circulation appears to be mostly
exploitable for efficiency improvement at approximately G = 1 (the locus of the maximum
value for the a(G) function). Here, the data points are related to the design method proposed by
Vad in [8], demonstrated in a case study in [8, 10], and are labelled as “Own design”. In [8], a
method has been proposed for systematic incorporation of FSW in preliminary controlled
vortex design of axial flow rotors, for improvement of efficiency. The resultant efficiency
improvement is 23 % (the maximum value for the a(G) function is = 2.5 %). This
appears to be the order of magnitude of the maximum efficiency improvement available by
means of harmonizing FSW with the spanwise circulation distribution. Considering the
legislative demands for improving fan efficiency [3], 23 % is worth to mention.

c) In the case of rotors of FVD, operating in a state of spanwise (nearly) constant circulation, the
efficiency improvement available by means of FSW tends to be minor. (G = 0 represents a
locus of zero value for the a(G) function).
d) The figure indicates that if spanwise decreasing blade circulation (G < 0) occurs in a rotor of
FSW, the efficiency tends to deteriorate ( < 0). Such deterioration of efficiency is
demonstrated by the data point of i = 22 [21] in Table 1, identified in Fig. 2 as of minimum
value. An explanation for efficiency deterioration, based on the elongation of the flow paths on
the blade suction side, is presented in [21, 23].
In reference [7], the industrial fan of case study exhibited a spanwise changing circulation of G
0.7. Considering Fig. 2, the redesign of the rotor, also incorporating a harmonization of the FSW angle
with the spanwise circulation distribution, offers a potential for remarkable efficiency improvement.
The available experience and knowledge on the topic, as well as the data set represented in Fig. 2, is to
be supplemented in the future by i) a thorough processing of the most recent literature being available
on systematic incorporation of FSW in CVD, such as [24]; ii) new design and redesign case studies,
such as redesigning the case study fan in [7].
In addition to efficiency improvement, another aspect of practical importance is the reduction of
the noise emitted by the fan. The Department of Fluid Mechanics, BME aims at developing on-site
diagnostics for industrial axial fans, with involvement of the Phased Array Microphone technique [25].
In reference [7], the measurement techniques presented in the literature for noise source
localization have been supplemented by an aerodynamic investigation method. This method is based on
the measurement of the inlet axial velocity profile as well as on cascade correlations. By such means, a
coupled acoustic-aerodynamic diagnostics method has been elaborated, and demonstrated in a case
study of a short-ducted, free inlet, free exhausting fan. In addition to laboratory applications, the
diagnostics method makes possible the on-site investigation of built-in unducted or short-ducted rotor-
only industrial fan configurations, even if they are accessible for diagnostics only from the upstream
direction. By means of the diagnostics method, the spanwise distributions of i) the loss indicators
related to the blading as well as ii) the Phased Array Microphone-measured sound pressure can be
discovered. On this basis, a proposal is to be elaborated in the future for redesigning the blading for
simultaneous reduction of noise emission and aerodynamic loss.
On the basis of the above, the authors aim at elaborating guidelines for redesign of industrial axial
fans of CVD + FSW. The target of redesign is the simultaneous improvement of efficiency and
reduction of noise, at a prescribed aerodynamic performance.
3 SUMMARY
Remarks have been made on the utilization of the combined effects of CVD and FSW for
efficiency improvement of low-speed axial fans. An extensive literature database has been processed in
a statistically appropriate manner, as presented in the Appendix. On this basis, the formerly expected
trend has been confirmed, as quantified in Fig. 2 and in Eq. (1): the gain in total efficiency, –
achievable by means of harmonizing the spanwise distributions of forward sweep angle and blade
circulation –, tends to increase with G. This implies the following tendencies by applying FSW: a) for
CVD fan rotors, a maximum of 23 % can be reached (at G 1); b) for FVD rotors (G 0), only
a minor efficiency gain ( 0) can be expected; c) The efficiency tends to deteriorate if G < 0.
ACKNOWLEDGMENTS
This work has been supported by the Hungarian National Fund for Science and Research under
contracts No. OTKA K 83807 and OTKA K 112277. The work relates to the scientific program of the
project "Development of quality-oriented and harmonized R+D+I strategy and the functional model at
BME", supported by the New Hungary Development Plan (Project ID: TÁMOP-4.2.1/B-09/1/KMR-
2010-0002). It is also supported by the project "Talent care and cultivation in the scientific workshops
of BME" project (Project ID: TÁMOP-4.2.2/B-10/1-2010-0009).

REFERENCES
1. de Wilt, G. EU policies on energy efficiency and the impact on fan manufacturers. Keynote
Lecture, Fan2012, International Conference on Fan Noise, Technology and Numerical Methods,
April 2012, Senlis, France.
2. Directive No. 2009/125/EC of the European Parliament and of the Council of the European
Union, of 21 October 2009, establishing a framework for the setting of ecodesign requirements for
energy-related products.
3. Regulation of the European Commission (EU) No. 327/2011, of 30 March 2011, implementing
Directive 2009/125/EC of the European Parliament and of the Council of the European Union with
regard to ecodesign requirements for fans driven by motors with an electric input power between
125 W and 500 kW.
4. Energy Conservation Standards Rulemaking Framework for Commercial and Industrial Fans and
Blowers. U.S. Department of Energy, 1 February 2013.
5. Corsini, A., Delibra, G. and Sheard, A. G. The application of sinusoidal blade-leading edges in a
fan-design methodology to improve stall resistance. Proc. IMechE, Part A – Journal of Power and
Energy, December 12, 2013, doi: 10.1177/0957650913514229 (published online )
6. Vad, J. Forward blade sweep applied to low-speed axial fan rotors of controlled vortex design: an
overview. ASME Journal of Engineering for Gas Turbines and Power, 2013, 135, pp. 012601-
1:012601:9.
7. Benedek, T. and Vad, J. Concerted aerodynamic and acoustic diagnostics of an axial flow
industrial fan, involving the phased array microphone technique. 2014, ASME Paper GT2014-
25916.
8. Vad, J. (2012), Incorporation of forward blade sweep in preliminary controlled vortex design of
axial flow rotors. Proc. IMechE, Part A – Journal of Power and Energy, 2012, 226, pp. 462-478.
9. Vad, J. Energiahatékony axiális átömlésű ventilátor-járókerekek tervezése (Design of energy-
efficient axial flow fan rotors). Energiagazdálkodás, 2012, 53 (4), pp. 8-10. (in Hungarian)
10. Corsini, A. and Rispoli, F. Using sweep to extend the stall-free operational range in axial fan
rotors. Proc. Instn Mech. Engrs, Part A, J. Power and Energy, 2004, 218, pp. 129-139.
11. Mohammed, K. P. and Prithvi Raj, D. Investigation on axial flow fan impellers with forward
swept blades. ASME J. Fluids Engineering, September 1977, pp. 543-547.
12. Ramakrishna, P. V. and Govardhan, M. Study of sweep and induced dihedral effects in subsonic
axial flow compressor passages – Part 1: Design considerations – changes in incidence, deflection,
and streamline curvature. Int. J. Rotating Machinery, 2009, Article ID 787145, 11 pages, doi:
10.1155/2009/787145.
13. McNulty, G. S., Decker, J. J., Beacher, B. F. and Khalid, S. A. The impact of forward swept
rotors on tip-limited low-speed axial compressors. 2003, ASME Paper No. GT2003-38837.
14. Li, Y., Quang, H. and Du, Z.-H. Optimization design and experimental study of low-pressure
axial fan with forward-skewed blades. Int. J. Rotating Machinery, 2007, Article ID 85275, 10
pages, doi: 10.1155/2007/85275.
15. Rohkamm, H., Kosyna, G., Saathoff, H. and Stark, U. Enhancement of highly-loaded axial
compressor stage performance using rotor blade tip tailoring, Part II – Experimental results. 6th
European Conference on Turbomachinery Fluid Dynamics and Thermodynamics, Lille, 2005,
Proceedings pp. 100-110.
16. Beiler, M. G. Untersuchung der dreidimensionalen Strömung durch Axialventilatoren mit
gekrümmten Schaufeln. Doctoral Dissertation, Universität-GH-Siegen, VDI Verlag, Reihe 7:
Strömungstechnik, No. 298, Düsseldorf, 1996.
17. Yamaguchi, N., Tominaga, T., Hattori, S. and Mitsuhashi, T. Secondary-loss reduction by
forward-skewing of axial compressor rotor blading. Yokohama International Gas Turbine
Congress, Yokohama, 1991, Proceedings pp. II.61-II.68.
18. Meixner, H. U. Vergleichende LDA-Messungen an ungesichelten und gesichelten
Axialventilatoren. Doctoral Dissertation, Universität Karlsruhe, VDI-Verlag, Reihe 7:
Strömungstechnik, No. 266, Düsseldorf, 1995.
19. Helming, K. Numerical analysis of sweep effects in shrouded propfan rotors. J. Propulsion and
Power, 1996, 12, pp. 139-145.
20. Clemen, C., Gümmer, V., Goller, M., Rohkamm, H., Stark, U. and Saathoff, H. Tip-
aerodynamics of forward-swept rotor blades in a highly-loaded single-stage axial-flow low-speed
compressor. 10th International Symposium on Transport Phenomena and Dynamics of Rotating
Machinery (ISROMAC10), Honolulu, 2004, Proceedings CD-ROM, Paper No. 027.
21. Vad, J., Kwedikha, A. R. A. and Jaberg, H. Influence of blade sweep on the energetic behavior
of axial flow turbomachinery rotors at design flow rate. 2004, ASME Paper No. GT2004-53544.
22. Vad, J., Kwedikha, A. R. A., Horváth, Cs., Balczó, M., Lohász, M. M. and Régert, T.
Aerodynamic effects of forward blade skew in axial flow rotors of controlled vortex design. Proc.
Instn Mech. Engrs, Part A, J. Power and Energy, 2007, 221, pp. 1011-1023.
23. Vad, J. Aerodynamic effects of blade sweep and skew in low-speed axial flow rotors at the design
flow rate: an overview. Proc. IMechE, Part A – Journal of Power and Energy, 2008, 222, pp. 69-
85.
24. Masi, M., Piva, M., and Lazzaretto, A. Design guidelines to increase the performance of a rotor-
only axial fan with constant-swirl blading. 2014, ASME Paper GT2014-27176.
25. Benedek, T., and Tóth, P. Beamforming measurements of an axial fan in an industrial
environment. Periodica Polytechnica, Mechanical Engineering, 2013, 57 (2), pp. 37-46.
26. Linnik, Y. V. Méthode des moindres carrés. Éléments de la théorie du traitement statistique des
observations. Dunod, Paris, 1963.
27. Devore, J., and Farnum, N. Applied statistics for engineers and scientists. 2nd edition. Thomson
Brooks/Cole, Belmont, CA, USA, 2005.

NOTATION
a(G) [-] approximate function for the (G) relationship
f(G) [-] functional relationship between G and
G [-] circulation gradient parameter
h [-] radius of confidence interval
i [-] index for the data points
m(G) [-] difference function
n [-] sample size (n = 22)
p [-] probability
q2, r, s*2 [-] statistics for the Abbe test
R [-] radius normalized by the blade tip radius
t [-] statistics for the one-sample t test
[-] deviation
[-] mean value of deviation
i [-] error for f(Gi)
[-] improvement in total efficiency, due to introducing FSW
[-] sweep angle
i [-] error for Gi
[-] standard deviation
[-] local isentropic total pressure rise coefficient (pitchwise mass-averaged isentropic total
pressure rise divided by the dynamic pressure calculated with the tip circumferential speed)
Subscripts
act actual value
crit critical value

APPENDIX
The relationship specified in Eq. (1) has arbitrarily been chosen as an approximate function. The
appropriateness of this choice is to be justified by statistical means. The statistical processing and
evaluation of the literature data is in accordance with the following steps.
a) It is assumed that there exists a functional relationship
= f(G) (2)
between the variables G and . The mathematical construction of f(G) is unknown. Therefore, the
theorem regarding the least squares method in [26] (p. 149) cannot be applied directly: the least squares
method is to be used for determination of the free parameters of a f(G) function of known construction.
The approximate function
a(G), (3)
represented in Eq. (1), has arbitrarily and purposefully been chosen, in an iterative (trial-and-error)
manner. It has been aimed at justifying the appropriateness of this approximate relationship (trend
function) by statistical means.
b) The difference function
m(G) = f(G) – a(G) (4)
is considered. Introducing m(G) makes possible a judgement on the appropriateness of a(G). If the
m(G) difference is suitably small, a(G) is a suitable approximation for f(G).
c) The following methodology leads to evaluating m(G). Fig. 3 presents the enlarged
environment of a data point under consideration. The notation indicated in the figure is introduced.
Point Pi indicates the accurate values of the observation, characterized by co-ordinates (Gi , f(Gi)). It is
assumed that both Gi and f(Gi) are quantities with random error of normal distribution. The errors for Gi

and f(Gi) are i and i, respectively, for which i N(0, ), and i N(0, ). Therefore, the data point
of actual observation, Mi, is characterized by the co-ordinates (Gi + i) and (f(Gi) + i).
The deviation i can be calculated for each actual point of observation as follows:
i = i – a(Gi + i), i = 1, 2, …24 (5)
The a(Gi + i) data in the table have been calculated with use of Eq. (1). For calculating i, the i
and Gi+i data in Table 1 are to be used, since the efficiency change and circulation gradient parameter
data in the table are actually observed values, i.e. they have an error associated with them (that is why
the circulation gradient parameter is indicated in the table as (Gi + i)). Calculation of i for each data
point in the table makes a statistical sample {i} available for as a statistical variable. The statistical
sample consisting of the i values is presented in the table.
d) Using the notation in Fig. 3, the following relationships can be written:
a(Gi + i) + i = f(Gi) + i (6a)
i = f(Gi) – a(Gi + i)+ i (6b)
It is assumed that the following approximation is valid:
a(Gi + i) a(Gi) + i a’(Gi) (7)
Where a’(Gi) is the derivative of the a(G) function at Gi. Combining Eqs. (4), (6b) and (7) reads:
i = f(Gi) – a(Gi) – i a’(Gi) + i = m(Gi) – i a’(Gi) + i (8)
This implies that for a given Gi, the expected value of the statistical variable i is
E(i) = m(Gi) (9)
e) The null hypothesis
H10: E(i) = m0 = constant (10)
is tested first, with utilisation of the {i} sample presented in the table, by means of the Abbe test ([26]
p. 114).
The i values in the last two rows of Table 1 (4.587; 3.873) are 2 times larger than the largest
i value in the remaining data set in the {i} sample (2.000). For this reason, the data in the last two
rows have been considered as “out-of-trend observations”, and have arbitrarily been excluded from
further processing. From this point onwards, the remaining data points of n = 22 are discussed.
The Abbe test aims at investigating whether a change in G causes any change in the expected
value E(i). For this reason, the i values within the {i} sample have been re-arranged in a sequence
corresponding to increasing G values, and the Abbe test has been executed on the i values arranged by
such means. (In general, the value of q2 depends on the sequence of the i values.)
The following statistics ([26] p. 114) have been calculated:
1
1
2
1
2
12
1 n
iii
nq = 0.676 (11)
n
ii
n 1
1 = – 0.103 (12)
n
ii
ns
1
22
1
1 = 0.665 (13)
2
2
act s
qr = 1.015 (14)
The critical value for r is rcrit(0.95,22) = 0.665, on the basis of [26] (p. 355, Table V). Here, 0.95 is
the prescribed confidence level (widespread in engineering practice), and n = 22 is the sample size.
Given that
ract > rcrit (1.015 > 0.665), (15)
the truth of the (10) null hypothesis has been assessed. By considering Eq. (9), this implies that
E(i) = m(Gi) = m0 = constant (16)
f) The assessment of the truth of the (10) null hypothesis enables the application of the one-
sample t test [27] (p. 358), by means of which the null hypothesis
H20: m0 = 0 (17)
is tested. The actual value of the t variable is
ns
mt
)0(0act
= – 0.592 (18)
The critical value for t is tcrit (0.95,22) = 2.074, on the basis of [27] (p. 566, Table IV).
Given that
tact < tcrit (0.592 < 2.074), (19)
the truth of the (17) null hypothesis has been assessed.
By considering Eq. (4), the assessment of the truth of the (17) null hypothesis results in the
acceptance of the a(G) approximate function in Eq. (1).
g) A confidence interval can be drawn in the vicinity of the a(G) approximate function,
incorporating the unknown f(G) function in the G range under investigation at a prescribed probability
of p. It has been proven (Eq. (16)) that m(G) = m0 = constant. It is possible to calculate the interval that
incorporates m0 at a probability of 0.95: this is the confidence interval surrounding . The radius of
this confidence interval is
h (p = 0.95, n = 22)n
st
crit = 0.361 (20)
The boundaries of the confidence interval, a(G) – h and a(G) + h, are indicated in Fig. 2.

FIGURE CAPTIONS
Fig. 1 Rotor of FSW and spanwise increasing blade circulation: an example [7]
Fig. 2 Presentation of data processing and evaluation
Fig. 3 Illustration for statistical data processing
TABLE
Table 1 Literature-based data
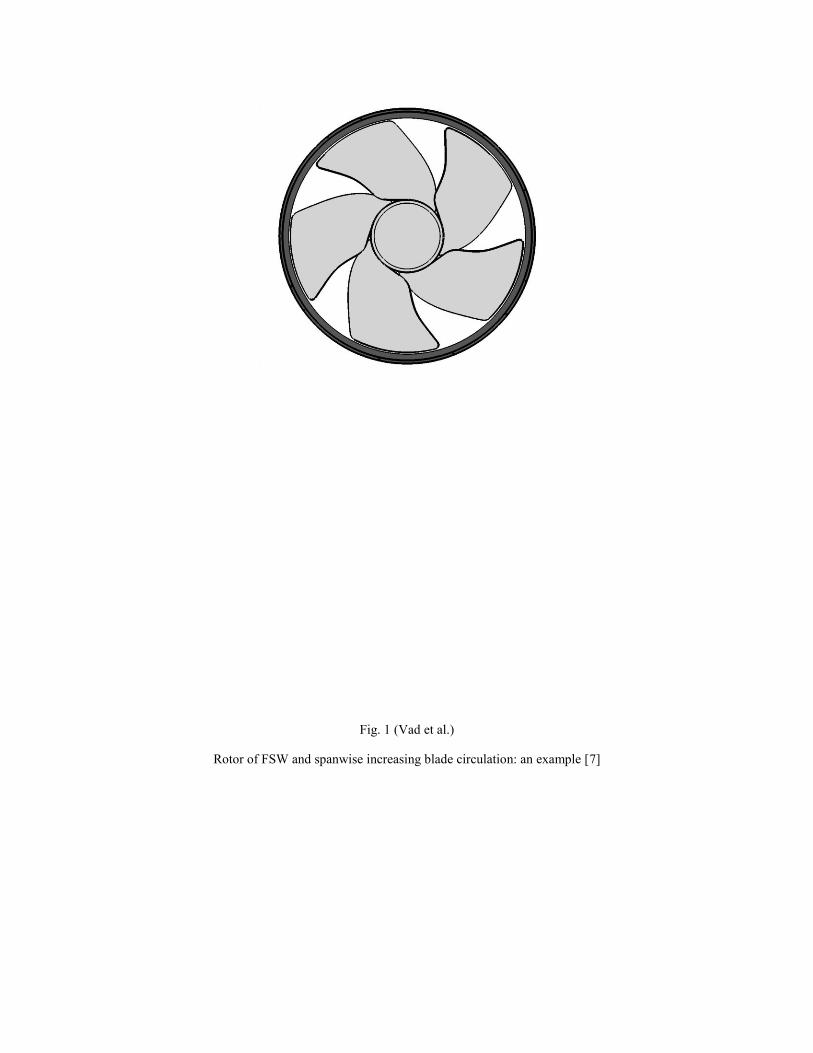
Fig. 1 (Vad et al.)
Rotor of FSW and spanwise increasing blade circulation: an example [7]
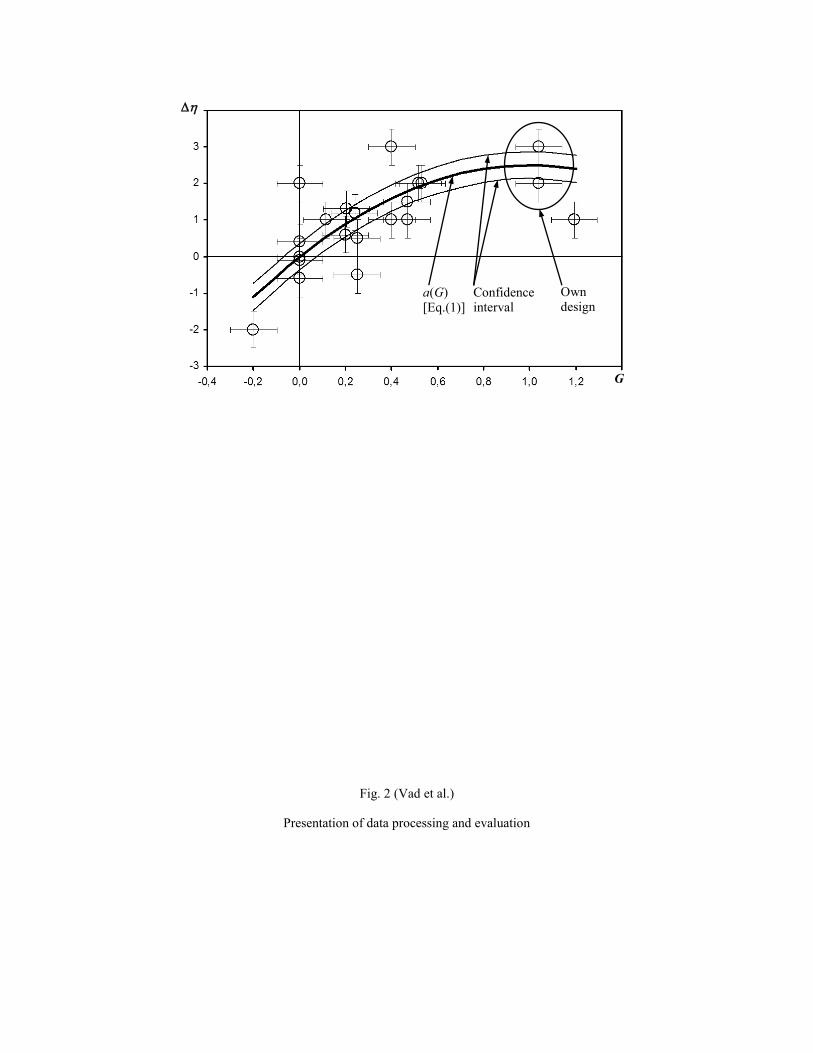
Fig. 2 (Vad et al.)
Presentation of data processing and evaluation
G
Own design
a(G) [Eq.(1)]
Confidence interval
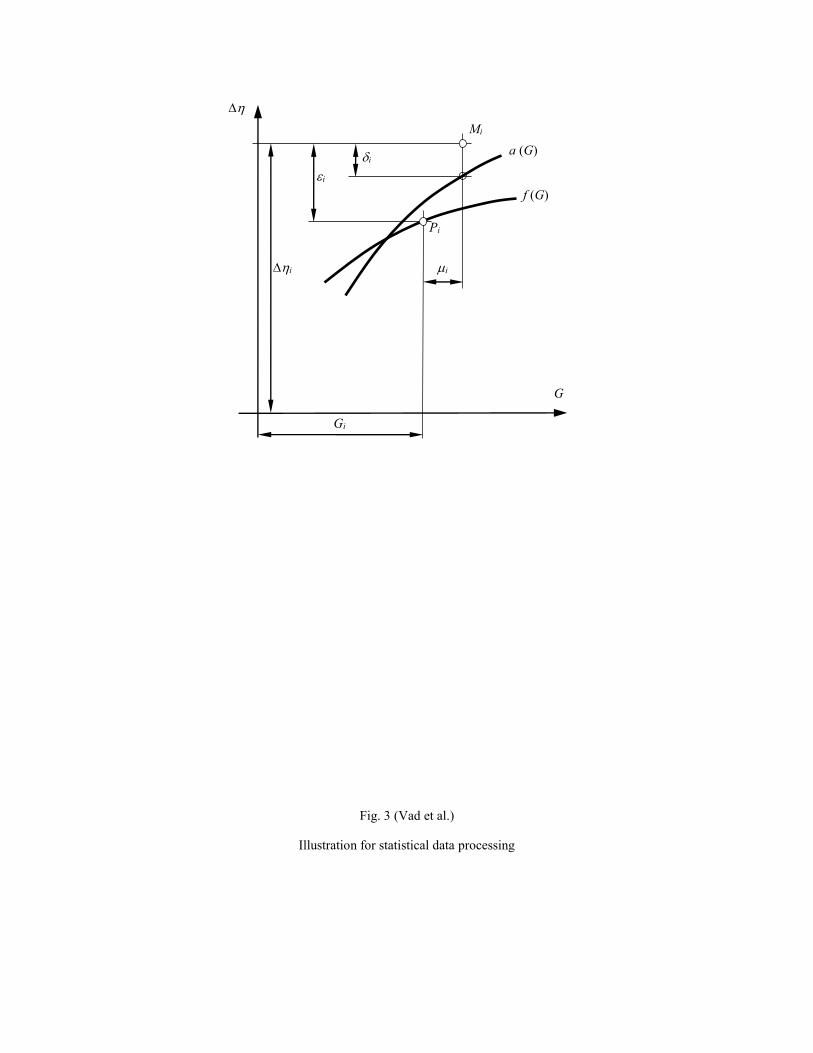
Fig. 3 (Vad et al.)
Illustration for statistical data processing
G
f (G)
a (G)
Pi
Gi
Mi
i i
i
i
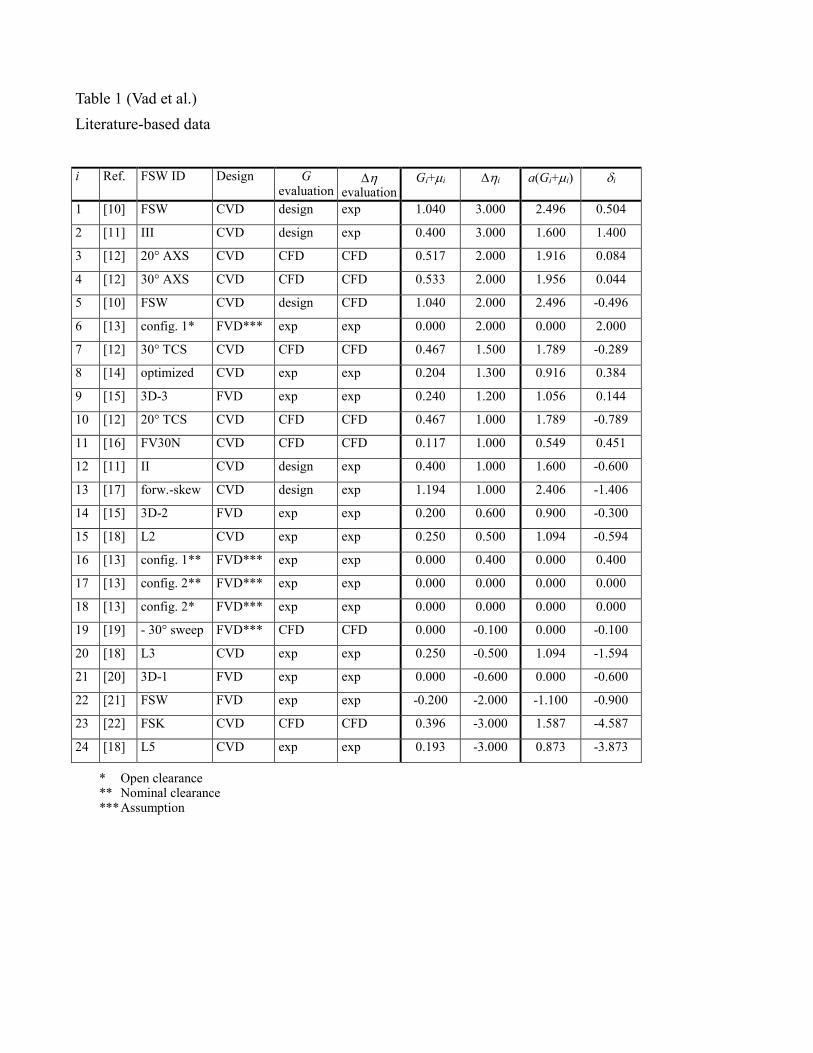
Table 1 (Vad et al.)
Literature-based data
i Ref. FSW ID Design G evaluation
evaluation
Gi+i i a(Gi+i) i
1 [10] FSW CVD design exp 1.040 3.000 2.496 0.504
2 [11] III CVD design exp 0.400 3.000 1.600 1.400
3 [12] 20° AXS CVD CFD CFD 0.517 2.000 1.916 0.084
4 [12] 30° AXS CVD CFD CFD 0.533 2.000 1.956 0.044
5 [10] FSW CVD design CFD 1.040 2.000 2.496 -0.496
6 [13] config. 1* FVD*** exp exp 0.000 2.000 0.000 2.000
7 [12] 30° TCS CVD CFD CFD 0.467 1.500 1.789 -0.289
8 [14] optimized CVD exp exp 0.204 1.300 0.916 0.384
9 [15] 3D-3 FVD exp exp 0.240 1.200 1.056 0.144
10 [12] 20° TCS CVD CFD CFD 0.467 1.000 1.789 -0.789
11 [16] FV30N CVD CFD CFD 0.117 1.000 0.549 0.451
12 [11] II CVD design exp 0.400 1.000 1.600 -0.600
13 [17] forw.-skew CVD design exp 1.194 1.000 2.406 -1.406
14 [15] 3D-2 FVD exp exp 0.200 0.600 0.900 -0.300
15 [18] L2 CVD exp exp 0.250 0.500 1.094 -0.594
16 [13] config. 1** FVD*** exp exp 0.000 0.400 0.000 0.400
17 [13] config. 2** FVD*** exp exp 0.000 0.000 0.000 0.000
18 [13] config. 2* FVD*** exp exp 0.000 0.000 0.000 0.000
19 [19] - 30° sweep FVD*** CFD CFD 0.000 -0.100 0.000 -0.100
20 [18] L3 CVD exp exp 0.250 -0.500 1.094 -1.594
21 [20] 3D-1 FVD exp exp 0.000 -0.600 0.000 -0.600
22 [21] FSW FVD exp exp -0.200 -2.000 -1.100 -0.900
23 [22] FSK CVD CFD CFD 0.396 -3.000 1.587 -4.587
24 [18] L5 CVD exp exp 0.193 -3.000 0.873 -3.873
* Open clearance ** Nominal clearance *** Assumption