V9.3 SAS System Output - uab.edu · rvad implant at time of lvad operation) ... allegheny general...
29
Page 1 of 29 # HHSN268201100025C Quarterly Report – 2013 Q4 03/24/2014 Alfred M 14 69 112.5 INTERMACS Interagency Registry for Mechanically Assisted Circulatory Support Quarterly Statistical Report 2013 4th Quarter Implant and event dates: June 23, 2006 to December 31, 2013 03/24/2014 Prepared by: The Data Collection and Analysis Center University of Alabama at Birmingham For questions or comments contact: James K. Kirklin, MD at [email protected] David C. Naftel, Ph.D at [email protected] Susan L. Myers at [email protected] Mary Lynne Clark at [email protected] Stephen Craig Collum at [email protected] Kathryn Hollifield at [email protected] Ryan S. Cantor at [email protected]
Transcript of V9.3 SAS System Output - uab.edu · rvad implant at time of lvad operation) ... allegheny general...

Page 1 of 29
# HHSN268201100025C Quarterly Report – 2013 Q4
03/24/2014 Alfred M 14 69 112.5
INTERMACS
Interagency Registry for Mechanically Assisted Circulatory Support
Quarterly Statistical Report
2013 4th Quarter Implant and event dates: June 23, 2006 to December 31, 2013 03/24/2014 Prepared by: The Data Collection and Analysis Center University of Alabama at Birmingham For questions or comments contact: James K. Kirklin, MD at [email protected] David C. Naftel, Ph.D at [email protected] Susan L. Myers at [email protected] Mary Lynne Clark at [email protected] Stephen Craig Collum at [email protected] Kathryn Hollifield at [email protected] Ryan S. Cantor at [email protected]

Page 2 of 29
# HHSN268201100025C Quarterly Report – 2013 Q4
03/24/2014
INTERMACS Quarterly Report Implants: June 23, 2006 to December 31, 2013
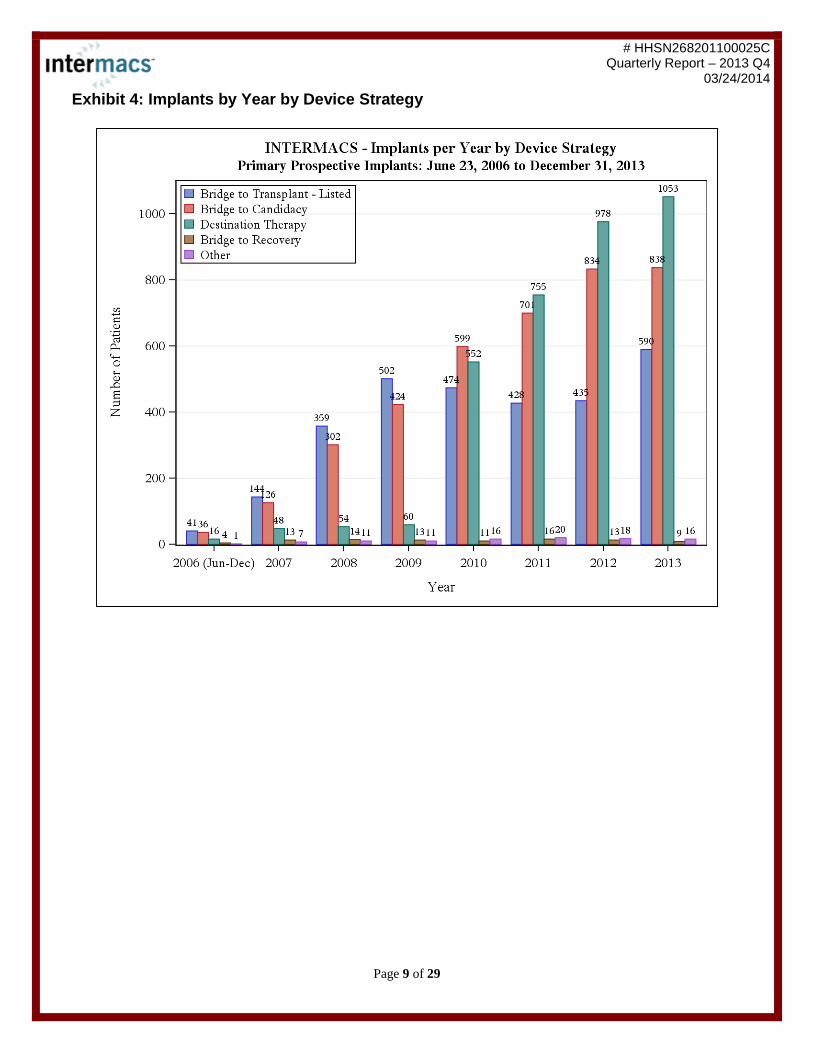
The Interagency Registry for Mechanically Assisted Circulatory Support is a North American registry established in 2005 for patients who are receiving mechanical circulatory support device therapy to treat advanced heart failure. INTERMACS was established as a joint effort of the National Heart, Lung and Blood Institute (NHLBI), the Centers for Medicare and Medicaid Services (CMS), the Food and Drug Administration (FDA), clinicians, scientists and industry representatives in conjunction with Dr. James K. Kirklin and the University of Alabama at Birmingham. This quarterly report includes clinical information from 10542 adult patients receiving primary prospective implants between June 23, 2006 and December 31, 2013.
Table of Contents Exhibit 1: Hospital Activation and Patient Enrollment ................................................................................................................... 3
Exhibit 2: Participating Hospital Listing ......................................................................................................................................... 4
Exhibit 3: Patient Demographics by Implant Period ..................................................................................................................... 8
Exhibit 4: Implants by Year by Device Strategy ............................................................................................................................ 9
Exhibit 5: Implants per Year by Device Type .............................................................................................................................. 10
Exhibit 6: Patient Profile at Time of Implant by Implant Period ................................................................................................... 11
Exhibit 7: Device Strategy at Time of Implant by Implant Period ................................................................................................ 12
Exhibit 8: Patient Profile by Device Strategy at Time of Implant ................................................................................................. 13
Exhibit 9: Patient Status by Device Strategy at Implant.............................................................................................................. 15
Exhibit 10: Primary Cause of Death ........................................................................................................................................... 17
Exhibit 11: Kaplan-Meier Survival for INTERMACS OVERALL .................................................................................................. 18
Exhibit 12: Kaplan-Meier Survival by Flow Type and Device ..................................................................................................... 19
Exhibit 13: Kaplan-Meier Survival for Continuous Flow LVADs (with or without RVAD implant at time of LVAD operation) by Implant Era ................................................................................................................................................................................. 20
Exhibit 14: Kaplan-Meier Survival for Continuous Flow LVADs (with or without RVAD implant at time of LVAD operation) by Pre-Implant Device Strategy ...................................................................................................................................................... 21
Exhibit 15: Kaplan-Meier Survival for Continuous Flow LVADs (with or without RVAD implant at time of LVAD operation) by Pre-Implant Patient Profile ......................................................................................................................................................... 22
Exhibit 16: Kaplan-Meier Survival for Continuous Flow LVADs (with or without RVAD implant at time of LVAD operation) by Device Type ............................................................................................................................................................................... 23
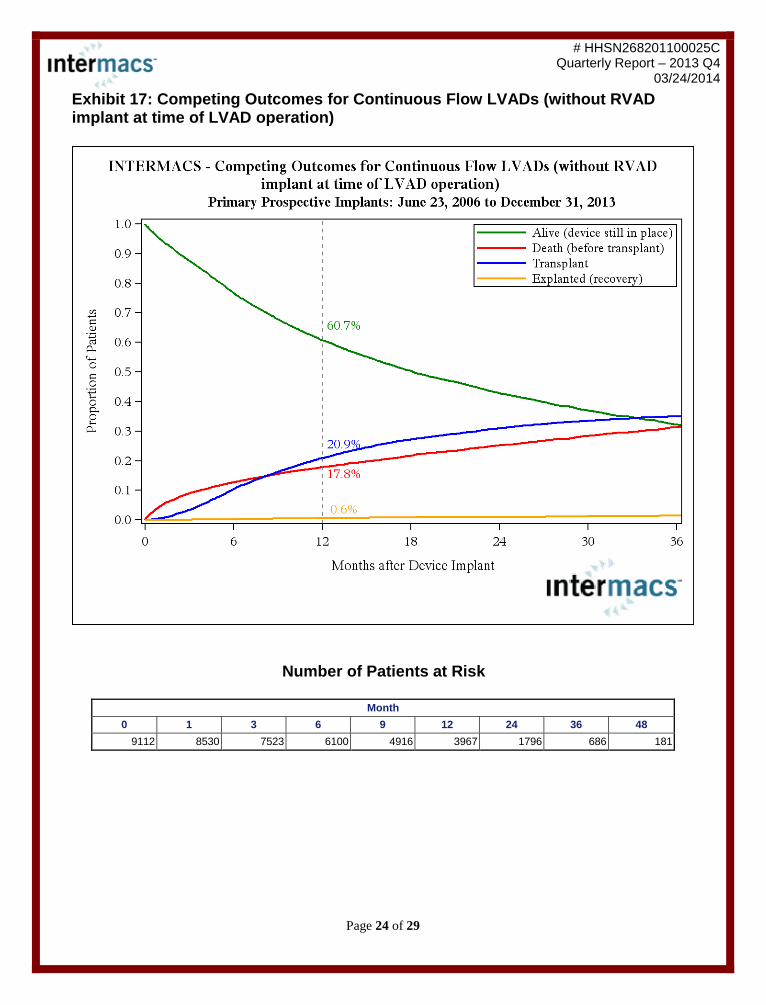
Exhibit 17: Competing Outcomes for Continuous Flow LVADs (without RVAD implant at time of LVAD operation) .................. 24
Exhibit 18: Competing Outcomes for Continuous Flow LVADs (with RVAD implant at time of LVAD operation) ....................... 25
Exhibit 19: Competing Outcomes for TAHs ................................................................................................................................ 26
Exhibit 20: Adverse Event Rates for Patients Receiving a Primary Prospective Implant - Continuous Flow LVADs (with or without RVAD implant at time of LVAD operation) .................................................................................................................................. 27
Exhibit 21: Infection Rates by Location - Continuous Flow LVADs (with or without RVAD implant at time of LVAD operation) . 28
Exhibit 20: Follow-up Compliance .............................................................................................................................................. 29

Page 3 of 29
# HHSN268201100025C Quarterly Report – 2013 Q4
03/24/2014 Exhibit 1: Hospital Activation and Patient Enrollment Exhi bit 1: Hospital Acti vati on and Pati ent Enr ollment Between June 23, 2006 and December 31, 2013, 158 hospitals participated in INTERMACS and, of these, 141 hospitals actively contributed information on a total of 10542 patients. Cumulative patient accrual and the number of participating hospitals over this time period are displayed below.

Page 4 of 29
# HHSN268201100025C Quarterly Report – 2013 Q4
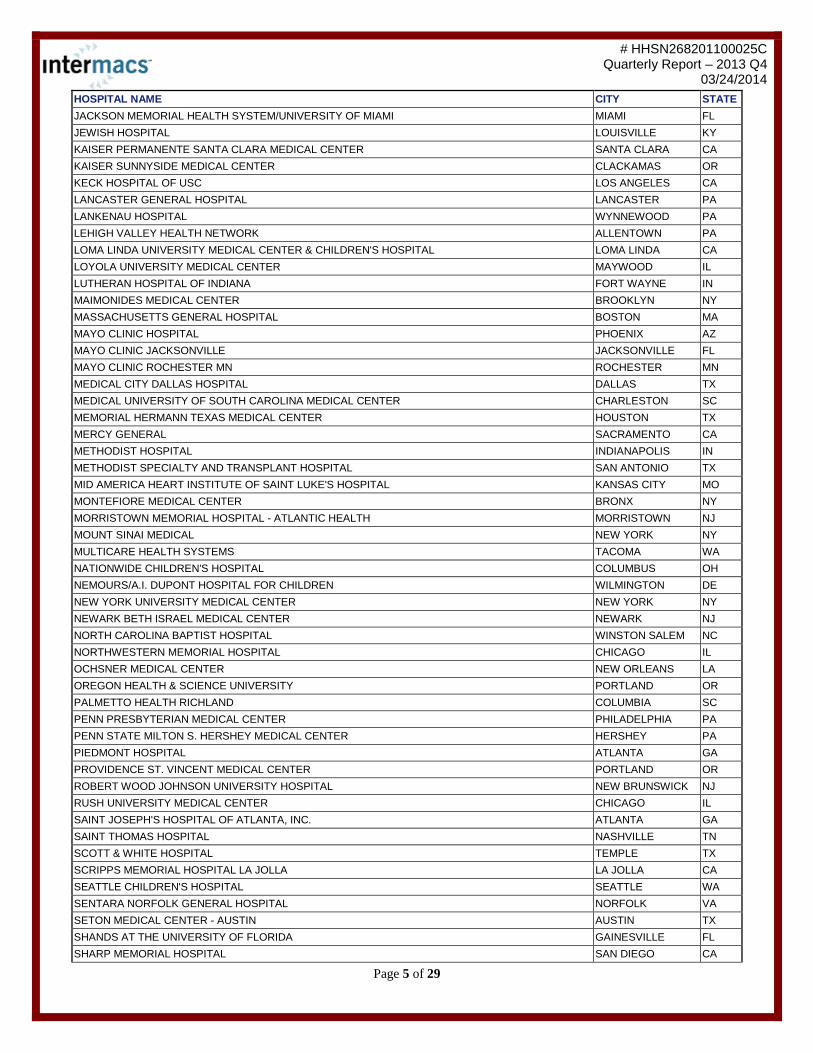
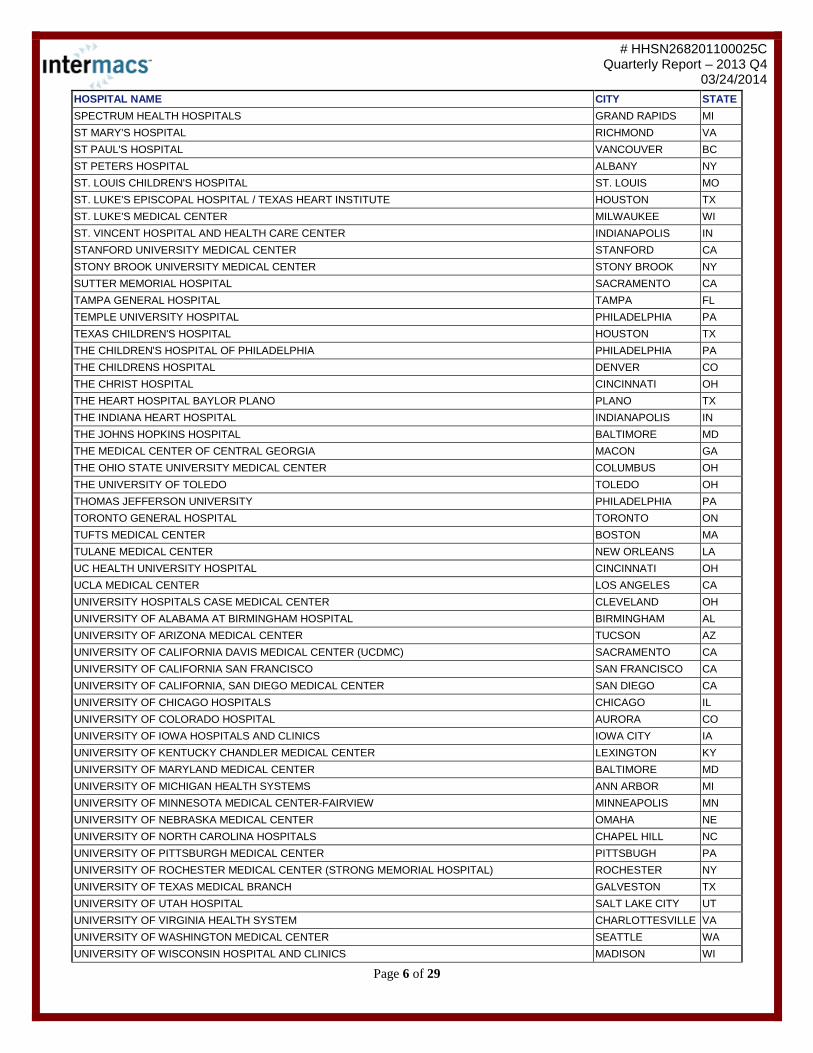
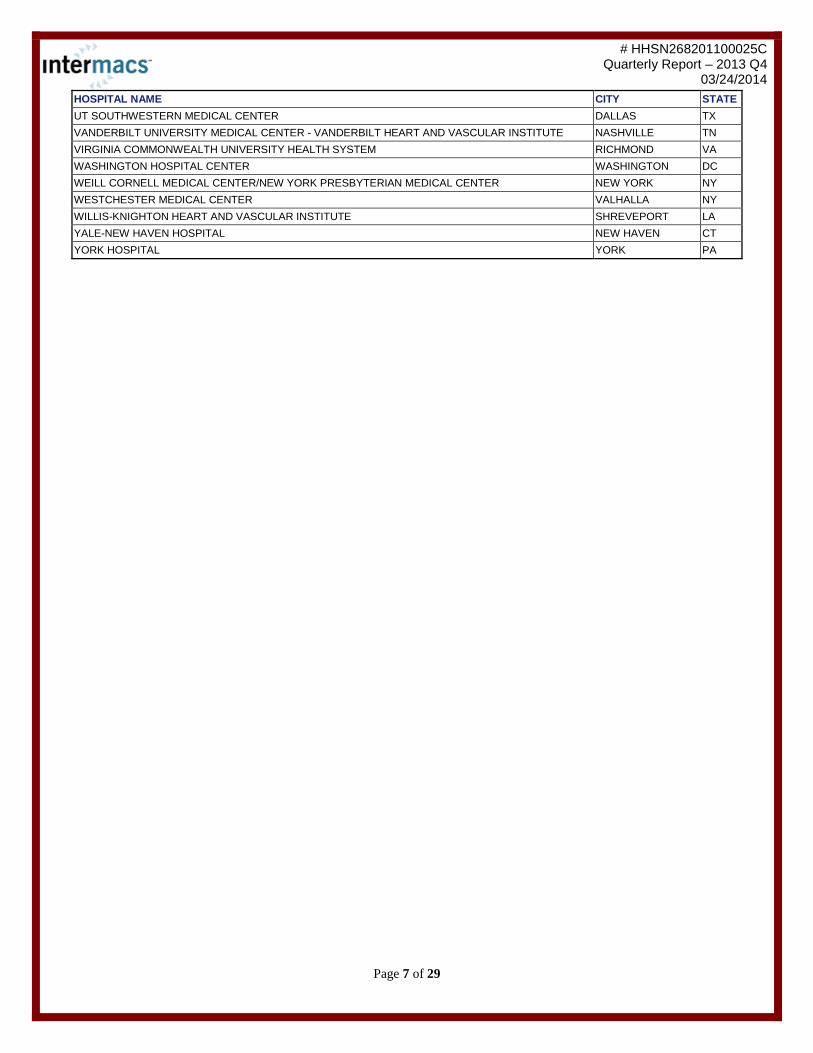
03/24/2014 Exhibit 2: Participating Hospital Listing Exhi bit 2: Participati ng Hospital Listi ng As of December 31, 2013 there were 158 hospitals participating in INTERMACS. HOSPITAL NAME CITY STATE ABBOTT NORTHWESTERN HOSPITAL MINNEAPOLIS MN ABINGTON MEMORIAL HOSPITAL ABINGTON PA ADVOCATE CHRIST MEDICAL CENTER OAK LAWN IL ALBANY MEDICAL CENTER ALBANY NY ALBERT EINSTEIN MEDICAL CENTER PHILADELPHIA PA ALLEGHENY GENERAL HOSPITAL PITTSBURGH PA ANN & ROBERT H. LURIE CHILDREN’S HOSPITAL OF CHICAGO CHICAGO IL BANNER GOOD SAMARITAN PHOENIX AZ BAPTIST HEALTH MEDICAL CENTER LITTLE ROCK AR BAPTIST MEMORIAL HOSPITAL - MEMPHIS MEMPHIS TN BARNES-JEWISH HOSPITAL ST. LOUIS MO BAYLOR UNIVERSITY MEDICAL CENTER DALLAS TX BRIGHAM AND WOMEN'S HOSPITAL BOSTON MA BRYANLGH MEDICAL CENTER LINCOLN NE CALIFORNIA PACIFIC MEDICAL CENTER SAN FRANCISCO CA CARILION ROANOKE MEMORIAL HOSPITAL ROANOKE VA CAROLINAS MEDICAL CENTER CHARLOTTE NC CEDARS SINAI MEDICAL CENTER LOS ANGELES CA CHILDREN'S HEALTHCARE OF ATLANTA ATLANTA GA CHILDREN'S HOSPITAL BOSTON BOSTON MA CHILDREN'S HOSPITAL OF PITTSBURGH PITTSBURGH PA CHILDREN'S HOSPITAL OF WISCONSIN MILWAUKEE WI CHILDREN'S MEDICAL CENTER DALLAS TX CHRISTIANA CARE HEALTH SYSTEM NEWARK DE CINCINNATI CHILDREN'S HOSPITAL MEDICAL CENTER CINCINNATI OH CJW MEDICAL CENTER RICHMOND VA CLEVELAND CLINIC CLEVELAND OH COLUMBIA PRESBYTERIAN - CHILDREN'S HOSPITAL OF NEW YORK NEW YORK NY COLUMBIA UNIVERSITY MEDICAL CENTER-NY PRESBYTERIAN NEW YORK NY CONE HEALTH SYSTEM GREENSBORO NC DUKE UNIVERSITY MEDICAL CENTER DURHAM NC EDWARD HOSPITAL NAPERVILLE IL EMORY UNIVERSITY HOSPITAL ATLANTA GA FLORIDA HOSPITAL ORLANDO FL FROEDTERT & THE MEDICAL COLLEGE OF WISCONSIN MILWAUKEE WI GEISINGER CLINIC DANVILLE PA HACKENSACK UNIVERSITY MEDICAL CENTER HACKENSACK NJ HAHNEMANN UNIVERSITY HOSPITAL PHILADELPHIA PA HARTFORD HOSPITAL HARTFORD CT HENRY FORD HOSPITAL DETROIT MI HOSPITAL OF THE UNIVERSITY OF PENNSYLVANIA PHILADELPHIA PA HOUSTON METHODIST HOSPITAL HOUSTON TX INLAND NORTHWEST THORACIC ORGAN TRANSPLANT PROGRAM - SACRED HEART MEDICAL CENTER
SPOKANE WA
INOVA FAIRFAX HOSPITAL FALLS CHURCH VA INSTITUT NATIONAL D'EXCELLENCE EN SANTÉ ET EN SERVICES SOCIAUX MONTREAL QC INTEGRIS BAPTIST MEDICAL CENTER OKLAHOMA CITY OK INTERMOUNTAIN HEART INSTITUTE-ARTIFICIAL HEART PROGRAM MURRAY UT
Page 5 of 29
# HHSN268201100025C Quarterly Report – 2013 Q4
03/24/2014 HOSPITAL NAME CITY STATE JACKSON MEMORIAL HEALTH SYSTEM/UNIVERSITY OF MIAMI MIAMI FL JEWISH HOSPITAL LOUISVILLE KY KAISER PERMANENTE SANTA CLARA MEDICAL CENTER SANTA CLARA CA KAISER SUNNYSIDE MEDICAL CENTER CLACKAMAS OR KECK HOSPITAL OF USC LOS ANGELES CA LANCASTER GENERAL HOSPITAL LANCASTER PA LANKENAU HOSPITAL WYNNEWOOD PA LEHIGH VALLEY HEALTH NETWORK ALLENTOWN PA LOMA LINDA UNIVERSITY MEDICAL CENTER & CHILDREN'S HOSPITAL LOMA LINDA CA LOYOLA UNIVERSITY MEDICAL CENTER MAYWOOD IL LUTHERAN HOSPITAL OF INDIANA FORT WAYNE IN MAIMONIDES MEDICAL CENTER BROOKLYN NY MASSACHUSETTS GENERAL HOSPITAL BOSTON MA MAYO CLINIC HOSPITAL PHOENIX AZ MAYO CLINIC JACKSONVILLE JACKSONVILLE FL MAYO CLINIC ROCHESTER MN ROCHESTER MN MEDICAL CITY DALLAS HOSPITAL DALLAS TX MEDICAL UNIVERSITY OF SOUTH CAROLINA MEDICAL CENTER CHARLESTON SC MEMORIAL HERMANN TEXAS MEDICAL CENTER HOUSTON TX MERCY GENERAL SACRAMENTO CA METHODIST HOSPITAL INDIANAPOLIS IN METHODIST SPECIALTY AND TRANSPLANT HOSPITAL SAN ANTONIO TX MID AMERICA HEART INSTITUTE OF SAINT LUKE'S HOSPITAL KANSAS CITY MO MONTEFIORE MEDICAL CENTER BRONX NY MORRISTOWN MEMORIAL HOSPITAL - ATLANTIC HEALTH MORRISTOWN NJ MOUNT SINAI MEDICAL NEW YORK NY MULTICARE HEALTH SYSTEMS TACOMA WA NATIONWIDE CHILDREN'S HOSPITAL COLUMBUS OH NEMOURS/A.I. DUPONT HOSPITAL FOR CHILDREN WILMINGTON DE NEW YORK UNIVERSITY MEDICAL CENTER NEW YORK NY NEWARK BETH ISRAEL MEDICAL CENTER NEWARK NJ NORTH CAROLINA BAPTIST HOSPITAL WINSTON SALEM NC NORTHWESTERN MEMORIAL HOSPITAL CHICAGO IL OCHSNER MEDICAL CENTER NEW ORLEANS LA OREGON HEALTH & SCIENCE UNIVERSITY PORTLAND OR PALMETTO HEALTH RICHLAND COLUMBIA SC PENN PRESBYTERIAN MEDICAL CENTER PHILADELPHIA PA PENN STATE MILTON S. HERSHEY MEDICAL CENTER HERSHEY PA PIEDMONT HOSPITAL ATLANTA GA PROVIDENCE ST. VINCENT MEDICAL CENTER PORTLAND OR ROBERT WOOD JOHNSON UNIVERSITY HOSPITAL NEW BRUNSWICK NJ RUSH UNIVERSITY MEDICAL CENTER CHICAGO IL SAINT JOSEPH'S HOSPITAL OF ATLANTA, INC. ATLANTA GA SAINT THOMAS HOSPITAL NASHVILLE TN SCOTT & WHITE HOSPITAL TEMPLE TX SCRIPPS MEMORIAL HOSPITAL LA JOLLA LA JOLLA CA SEATTLE CHILDREN'S HOSPITAL SEATTLE WA SENTARA NORFOLK GENERAL HOSPITAL NORFOLK VA SETON MEDICAL CENTER - AUSTIN AUSTIN TX SHANDS AT THE UNIVERSITY OF FLORIDA GAINESVILLE FL SHARP MEMORIAL HOSPITAL SAN DIEGO CA
Page 6 of 29
# HHSN268201100025C Quarterly Report – 2013 Q4
03/24/2014 HOSPITAL NAME CITY STATE SPECTRUM HEALTH HOSPITALS GRAND RAPIDS MI ST MARY'S HOSPITAL RICHMOND VA ST PAUL'S HOSPITAL VANCOUVER BC ST PETERS HOSPITAL ALBANY NY ST. LOUIS CHILDREN'S HOSPITAL ST. LOUIS MO ST. LUKE'S EPISCOPAL HOSPITAL / TEXAS HEART INSTITUTE HOUSTON TX ST. LUKE'S MEDICAL CENTER MILWAUKEE WI ST. VINCENT HOSPITAL AND HEALTH CARE CENTER INDIANAPOLIS IN STANFORD UNIVERSITY MEDICAL CENTER STANFORD CA STONY BROOK UNIVERSITY MEDICAL CENTER STONY BROOK NY SUTTER MEMORIAL HOSPITAL SACRAMENTO CA TAMPA GENERAL HOSPITAL TAMPA FL TEMPLE UNIVERSITY HOSPITAL PHILADELPHIA PA TEXAS CHILDREN'S HOSPITAL HOUSTON TX THE CHILDREN'S HOSPITAL OF PHILADELPHIA PHILADELPHIA PA THE CHILDRENS HOSPITAL DENVER CO THE CHRIST HOSPITAL CINCINNATI OH THE HEART HOSPITAL BAYLOR PLANO PLANO TX THE INDIANA HEART HOSPITAL INDIANAPOLIS IN THE JOHNS HOPKINS HOSPITAL BALTIMORE MD THE MEDICAL CENTER OF CENTRAL GEORGIA MACON GA THE OHIO STATE UNIVERSITY MEDICAL CENTER COLUMBUS OH THE UNIVERSITY OF TOLEDO TOLEDO OH THOMAS JEFFERSON UNIVERSITY PHILADELPHIA PA TORONTO GENERAL HOSPITAL TORONTO ON TUFTS MEDICAL CENTER BOSTON MA TULANE MEDICAL CENTER NEW ORLEANS LA UC HEALTH UNIVERSITY HOSPITAL CINCINNATI OH UCLA MEDICAL CENTER LOS ANGELES CA UNIVERSITY HOSPITALS CASE MEDICAL CENTER CLEVELAND OH UNIVERSITY OF ALABAMA AT BIRMINGHAM HOSPITAL BIRMINGHAM AL UNIVERSITY OF ARIZONA MEDICAL CENTER TUCSON AZ UNIVERSITY OF CALIFORNIA DAVIS MEDICAL CENTER (UCDMC) SACRAMENTO CA UNIVERSITY OF CALIFORNIA SAN FRANCISCO SAN FRANCISCO CA UNIVERSITY OF CALIFORNIA, SAN DIEGO MEDICAL CENTER SAN DIEGO CA UNIVERSITY OF CHICAGO HOSPITALS CHICAGO IL UNIVERSITY OF COLORADO HOSPITAL AURORA CO UNIVERSITY OF IOWA HOSPITALS AND CLINICS IOWA CITY IA UNIVERSITY OF KENTUCKY CHANDLER MEDICAL CENTER LEXINGTON KY UNIVERSITY OF MARYLAND MEDICAL CENTER BALTIMORE MD UNIVERSITY OF MICHIGAN HEALTH SYSTEMS ANN ARBOR MI UNIVERSITY OF MINNESOTA MEDICAL CENTER-FAIRVIEW MINNEAPOLIS MN UNIVERSITY OF NEBRASKA MEDICAL CENTER OMAHA NE UNIVERSITY OF NORTH CAROLINA HOSPITALS CHAPEL HILL NC UNIVERSITY OF PITTSBURGH MEDICAL CENTER PITTSBUGH PA UNIVERSITY OF ROCHESTER MEDICAL CENTER (STRONG MEMORIAL HOSPITAL) ROCHESTER NY UNIVERSITY OF TEXAS MEDICAL BRANCH GALVESTON TX UNIVERSITY OF UTAH HOSPITAL SALT LAKE CITY UT UNIVERSITY OF VIRGINIA HEALTH SYSTEM CHARLOTTESVILLE VA UNIVERSITY OF WASHINGTON MEDICAL CENTER SEATTLE WA UNIVERSITY OF WISCONSIN HOSPITAL AND CLINICS MADISON WI
Page 7 of 29
# HHSN268201100025C Quarterly Report – 2013 Q4
03/24/2014 HOSPITAL NAME CITY STATE UT SOUTHWESTERN MEDICAL CENTER DALLAS TX VANDERBILT UNIVERSITY MEDICAL CENTER - VANDERBILT HEART AND VASCULAR INSTITUTE NASHVILLE TN VIRGINIA COMMONWEALTH UNIVERSITY HEALTH SYSTEM RICHMOND VA WASHINGTON HOSPITAL CENTER WASHINGTON DC WEILL CORNELL MEDICAL CENTER/NEW YORK PRESBYTERIAN MEDICAL CENTER NEW YORK NY WESTCHESTER MEDICAL CENTER VALHALLA NY WILLIS-KNIGHTON HEART AND VASCULAR INSTITUTE SHREVEPORT LA YALE-NEW HAVEN HOSPITAL NEW HAVEN CT YORK HOSPITAL YORK PA
Page 8 of 29
# HHSN268201100025C Quarterly Report – 2013 Q4
03/24/2014
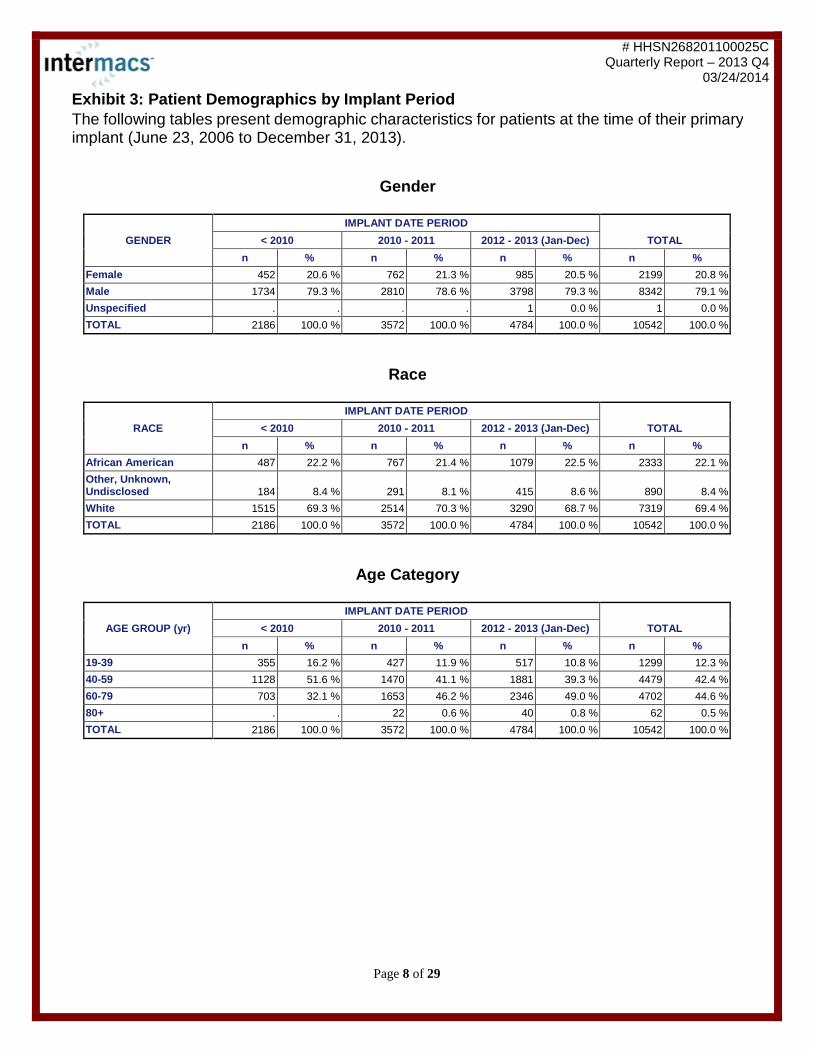
Exhibit 3: Patient Demographics by Implant Period Exhi bit 3: Pati ent D emographics by Implant Period The following tables present demographic characteristics for patients at the time of their primary implant (June 23, 2006 to December 31, 2013).
Gender
GENDER IMPLANT DATE PERIOD
TOTAL < 2010 2010 - 2011 2012 - 2013 (Jan-Dec) n % n % n % n %
Female 452 20.6 % 762 21.3 % 985 20.5 % 2199 20.8 % Male 1734 79.3 % 2810 78.6 % 3798 79.3 % 8342 79.1 % Unspecified . . . . 1 0.0 % 1 0.0 % TOTAL 2186 100.0 % 3572 100.0 % 4784 100.0 % 10542 100.0 %
Race
RACE IMPLANT DATE PERIOD
TOTAL < 2010 2010 - 2011 2012 - 2013 (Jan-Dec) n % n % n % n %
African American 487 22.2 % 767 21.4 % 1079 22.5 % 2333 22.1 % Other, Unknown, Undisclosed 184 8.4 % 291 8.1 % 415 8.6 % 890 8.4 % White 1515 69.3 % 2514 70.3 % 3290 68.7 % 7319 69.4 % TOTAL 2186 100.0 % 3572 100.0 % 4784 100.0 % 10542 100.0 %
Age Category
AGE GROUP (yr) IMPLANT DATE PERIOD
TOTAL < 2010 2010 - 2011 2012 - 2013 (Jan-Dec) n % n % n % n %
19-39 355 16.2 % 427 11.9 % 517 10.8 % 1299 12.3 % 40-59 1128 51.6 % 1470 41.1 % 1881 39.3 % 4479 42.4 % 60-79 703 32.1 % 1653 46.2 % 2346 49.0 % 4702 44.6 % 80+ . . 22 0.6 % 40 0.8 % 62 0.5 % TOTAL 2186 100.0 % 3572 100.0 % 4784 100.0 % 10542 100.0 %
Page 9 of 29
# HHSN268201100025C Quarterly Report – 2013 Q4
03/24/2014 Exhibit 4: Implants by Year by Device Strategy Exhi bit 4: Impl ants by Year by Device Str ategy

Page 10 of 29
# HHSN268201100025C Quarterly Report – 2013 Q4
03/24/2014 Exhibit 5: Implants per Year by Device Type Exhi bit 5: Impl ants per Year by Devi ce Type
Number of Implants by Device Type and Implant Date Period
DEVICE TYPE IMPLANT DATE PERIOD
TOTAL < 2010 2010 - 2011 2012 - 2013 (Jan-Dec) n % n % n % n %
LVAD 1853 84.7 % 3342 93.5 % 4529 94.6 % 9724 92.2 % BiVAD 256 11.7 % 175 4.8 % 148 3.0 % 579 5.4 % TAH 77 3.5 % 55 1.5 % 107 2.2 % 239 2.2 % TOTAL 2186 100.0 % 3572 100.0 % 4784 100.0 % 10542 100.0 %
Page 11 of 29
# HHSN268201100025C Quarterly Report – 2013 Q4
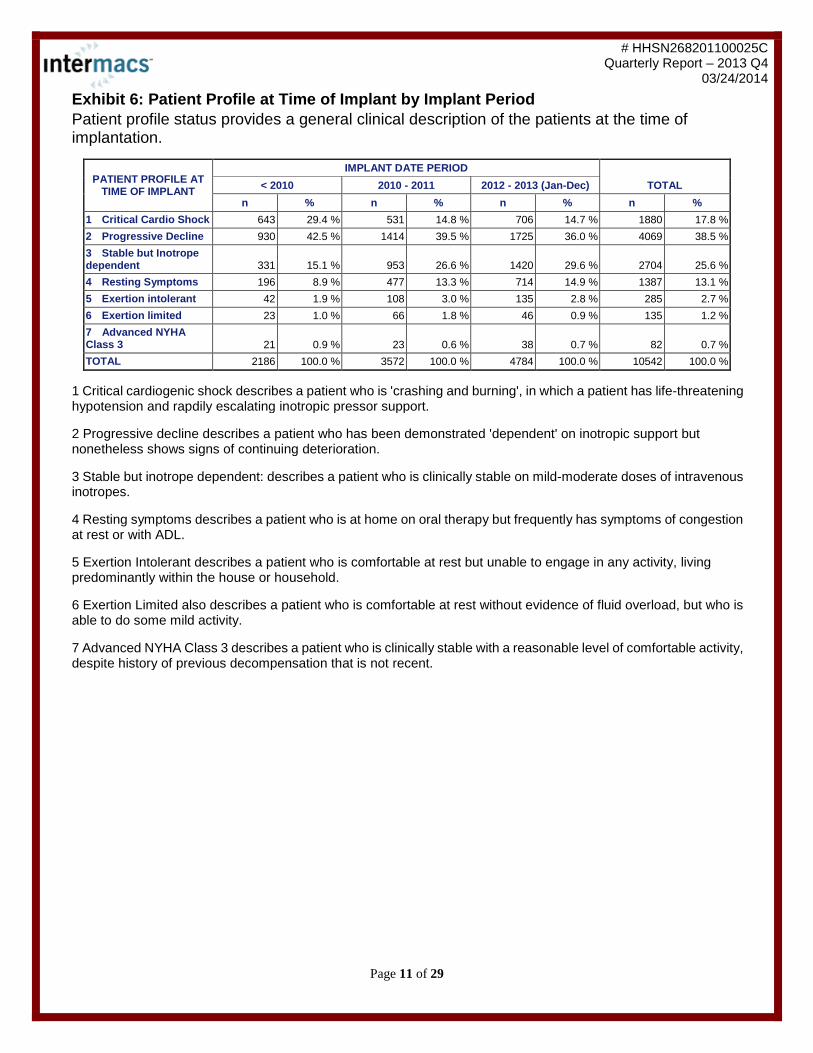
03/24/2014 Exhibit 6: Patient Profile at Time of Implant by Implant Period Exhi bit 6: Pati ent Pr ofile at Ti me of Impl ant by Implant Period Patient profile status provides a general clinical description of the patients at the time of implantation.
PATIENT PROFILE AT TIME OF IMPLANT
IMPLANT DATE PERIOD TOTAL < 2010 2010 - 2011 2012 - 2013 (Jan-Dec)
n % n % n % n % 1 Critical Cardio Shock 643 29.4 % 531 14.8 % 706 14.7 % 1880 17.8 % 2 Progressive Decline 930 42.5 % 1414 39.5 % 1725 36.0 % 4069 38.5 % 3 Stable but Inotrope dependent 331 15.1 % 953 26.6 % 1420 29.6 % 2704 25.6 % 4 Resting Symptoms 196 8.9 % 477 13.3 % 714 14.9 % 1387 13.1 % 5 Exertion intolerant 42 1.9 % 108 3.0 % 135 2.8 % 285 2.7 % 6 Exertion limited 23 1.0 % 66 1.8 % 46 0.9 % 135 1.2 % 7 Advanced NYHA Class 3 21 0.9 % 23 0.6 % 38 0.7 % 82 0.7 % TOTAL 2186 100.0 % 3572 100.0 % 4784 100.0 % 10542 100.0 %
1 Critical cardiogenic shock describes a patient who is 'crashing and burning', in which a patient has life-threatening hypotension and rapdily escalating inotropic pressor support. 2 Progressive decline describes a patient who has been demonstrated 'dependent' on inotropic support but nonetheless shows signs of continuing deterioration. 3 Stable but inotrope dependent: describes a patient who is clinically stable on mild-moderate doses of intravenous inotropes. 4 Resting symptoms describes a patient who is at home on oral therapy but frequently has symptoms of congestion at rest or with ADL. 5 Exertion Intolerant describes a patient who is comfortable at rest but unable to engage in any activity, living predominantly within the house or household. 6 Exertion Limited also describes a patient who is comfortable at rest without evidence of fluid overload, but who is able to do some mild activity. 7 Advanced NYHA Class 3 describes a patient who is clinically stable with a reasonable level of comfortable activity, despite history of previous decompensation that is not recent.

Page 12 of 29
# HHSN268201100025C Quarterly Report – 2013 Q4
03/24/2014 Exhibit 7: Device Strategy at Time of Implant by Implant Period Exhi bit 7: Device Str ategy at Ti me of Implant by Implant Period Device strategy is determined in conjunction with the heart failure cardiologist and surgeon at the time of the implant.
DEVICE STRATEGY AT TIME OF IMPLANT
IMPLANT DATE PERIOD TOTAL < 2010 2010 - 2011 2012 - 2013 (Jan-Dec)
n % n % n % n % BTT - Listed 1046 47.8 % 902 25.2 % 1025 21.4 % 2973 28.2 % BTT - Likely 589 26.9 % 812 22.7 % 1042 21.7 % 2443 23.1 % BTT - Moderate 211 9.6 % 363 10.1 % 489 10.2 % 1063 10.0 % BTT - Unlikely 88 4.0 % 125 3.4 % 141 2.9 % 354 3.3 % Destination Therapy 178 8.1 % 1307 36.5 % 2031 42.4 % 3516 33.3 % Bridge to Recovery 44 2.0 % 27 0.7 % 22 0.4 % 93 0.8 % Rescue Therapy 25 1.1 % 15 0.4 % 20 0.4 % 60 0.5 % Other 5 0.2 % 21 0.5 % 14 0.2 % 40 0.3 % TOTAL 2186 100.0 % 3572 100.0 % 4784 100.0 % 10542 100.0 %
1. Bridge to Transplant (BTT) Listed - patient already listed for transplant or listed within 24 hours before device implantation. 2. Bridge to Transplant (BTT) Likely - patient in whom the transplant evaluation has not been completed, but no contra-indications are anticipated, or in whom a current contra-indication is anticipated to resolve rapidly. 3. Bridge to Transplant (BTT) Moderate - patient in whom the transplant evaluation has not been completed, but with some potential concerns that might prevent eligibility. 4. Bridge to Transplant (BTT) Unlikely - patient in whom major concerns that might prevent eligibility have already been identified. 5. Destination Therapy - the patient is definitely not eligible for transplant. 6. Bridge to Recovery (BTR) - use of a durable device to allow recovery from chronic cardiac failure (at least 3 months in duration). 7. Rescue Therapy - use of a durable device to support resolution from an acute event without major previous cardiac dysfunction. 8. Other.
Page 13 of 29
# HHSN268201100025C Quarterly Report – 2013 Q4
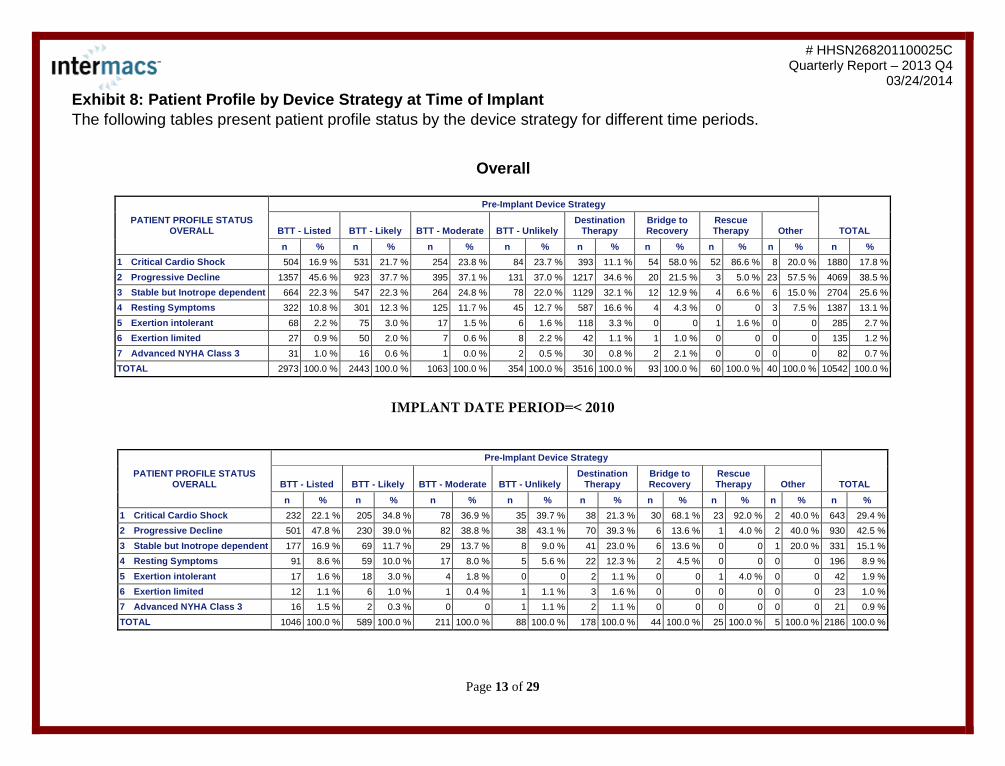
03/24/2014 Exhibit 8: Patient Profile by Device Strategy at Time of Implant Exhi bit 8: Pati ent Pr ofile by D evice Strateg y at Ti me of Impl ant The following tables present patient profile status by the device strategy for different time periods.
Overall
PATIENT PROFILE STATUS OVERALL
Pre-Implant Device Strategy
TOTAL BTT - Listed BTT - Likely BTT - Moderate BTT - Unlikely Destination
Therapy Bridge to Recovery
Rescue Therapy Other
n % n % n % n % n % n % n % n % n % 1 Critical Cardio Shock 504 16.9 % 531 21.7 % 254 23.8 % 84 23.7 % 393 11.1 % 54 58.0 % 52 86.6 % 8 20.0 % 1880 17.8 % 2 Progressive Decline 1357 45.6 % 923 37.7 % 395 37.1 % 131 37.0 % 1217 34.6 % 20 21.5 % 3 5.0 % 23 57.5 % 4069 38.5 % 3 Stable but Inotrope dependent 664 22.3 % 547 22.3 % 264 24.8 % 78 22.0 % 1129 32.1 % 12 12.9 % 4 6.6 % 6 15.0 % 2704 25.6 % 4 Resting Symptoms 322 10.8 % 301 12.3 % 125 11.7 % 45 12.7 % 587 16.6 % 4 4.3 % 0 0 3 7.5 % 1387 13.1 % 5 Exertion intolerant 68 2.2 % 75 3.0 % 17 1.5 % 6 1.6 % 118 3.3 % 0 0 1 1.6 % 0 0 285 2.7 % 6 Exertion limited 27 0.9 % 50 2.0 % 7 0.6 % 8 2.2 % 42 1.1 % 1 1.0 % 0 0 0 0 135 1.2 % 7 Advanced NYHA Class 3 31 1.0 % 16 0.6 % 1 0.0 % 2 0.5 % 30 0.8 % 2 2.1 % 0 0 0 0 82 0.7 % TOTAL 2973 100.0 % 2443 100.0 % 1063 100.0 % 354 100.0 % 3516 100.0 % 93 100.0 % 60 100.0 % 40 100.0 % 10542 100.0 %
IMPLANT DATE PERIOD=< 2010
PATIENT PROFILE STATUS OVERALL
Pre-Implant Device Strategy
TOTAL BTT - Listed BTT - Likely BTT - Moderate BTT - Unlikely Destination
Therapy Bridge to Recovery
Rescue Therapy Other
n % n % n % n % n % n % n % n % n % 1 Critical Cardio Shock 232 22.1 % 205 34.8 % 78 36.9 % 35 39.7 % 38 21.3 % 30 68.1 % 23 92.0 % 2 40.0 % 643 29.4 % 2 Progressive Decline 501 47.8 % 230 39.0 % 82 38.8 % 38 43.1 % 70 39.3 % 6 13.6 % 1 4.0 % 2 40.0 % 930 42.5 % 3 Stable but Inotrope dependent 177 16.9 % 69 11.7 % 29 13.7 % 8 9.0 % 41 23.0 % 6 13.6 % 0 0 1 20.0 % 331 15.1 % 4 Resting Symptoms 91 8.6 % 59 10.0 % 17 8.0 % 5 5.6 % 22 12.3 % 2 4.5 % 0 0 0 0 196 8.9 % 5 Exertion intolerant 17 1.6 % 18 3.0 % 4 1.8 % 0 0 2 1.1 % 0 0 1 4.0 % 0 0 42 1.9 % 6 Exertion limited 12 1.1 % 6 1.0 % 1 0.4 % 1 1.1 % 3 1.6 % 0 0 0 0 0 0 23 1.0 % 7 Advanced NYHA Class 3 16 1.5 % 2 0.3 % 0 0 1 1.1 % 2 1.1 % 0 0 0 0 0 0 21 0.9 % TOTAL 1046 100.0 % 589 100.0 % 211 100.0 % 88 100.0 % 178 100.0 % 44 100.0 % 25 100.0 % 5 100.0 % 2186 100.0 %

Page 14 of 29
# HHSN268201100025C Quarterly Report – 2013 Q4
03/24/2014 IMPLANT DATE PERIOD=2010 - 2011
PATIENT PROFILE STATUS OVERALL
Pre-Implant Device Strategy
TOTAL BTT - Listed BTT - Likely BTT - Moderate BTT - Unlikely Destination
Therapy Bridge to Recovery
Rescue Therapy Other
n % n % n % n % n % n % n % n % n % 1 Critical Cardio Shock 133 14.7 % 143 17.6 % 68 18.7 % 20 16.0 % 140 10.7 % 11 40.7 % 12 80.0 % 4 19.0 % 531 14.8 % 2 Progressive Decline 407 45.1 % 308 37.9 % 152 41.8 % 48 38.4 % 477 36.4 % 9 33.3 % 0 0 13 61.9 % 1414 39.5 % 3 Stable but Inotrope dependent 214 23.7 % 198 24.3 % 89 24.5 % 31 24.8 % 412 31.5 % 3 11.1 % 3 20.0 % 3 14.2 % 953 26.6 % 4 Resting Symptoms 108 11.9 % 98 12.0 % 43 11.8 % 19 15.2 % 206 15.7 % 2 7.4 % 0 0 1 4.7 % 477 13.3 % 5 Exertion intolerant 23 2.5 % 35 4.3 % 7 1.9 % 2 1.6 % 41 3.1 % 0 0 0 0 0 0 108 3.0 % 6 Exertion limited 9 0.9 % 27 3.3 % 4 1.1 % 5 4.0 % 21 1.6 % 0 0 0 0 0 0 66 1.8 % 7 Advanced NYHA Class 3 8 0.8 % 3 0.3 % 0 0 0 0 10 0.7 % 2 7.4 % 0 0 0 0 23 0.6 % TOTAL 902 100.0 % 812 100.0 % 363 100.0 % 125 100.0 % 1307 100.0 % 27 100.0 % 15 100.0 % 21 100.0 % 3572 100.0 %
IMPLANT DATE PERIOD=2012 - 2013 (Jan-Dec)
PATIENT PROFILE STATUS OVERALL
Pre-Implant Device Strategy
TOTAL BTT - Listed BTT - Likely BTT - Moderate BTT - Unlikely Destination
Therapy Bridge to Recovery
Rescue Therapy Other
n % n % n % n % n % n % n % n % n % 1 Critical Cardio Shock 139 13.5 % 183 17.5 % 108 22.0 % 29 20.5 % 215 10.5 % 13 59.0 % 17 85.0 % 2 14.2 % 706 14.7 % 2 Progressive Decline 449 43.8 % 385 36.9 % 161 32.9 % 45 31.9 % 670 32.9 % 5 22.7 % 2 10.0 % 8 57.1 % 1725 36.0 % 3 Stable but Inotrope dependent 273 26.6 % 280 26.8 % 146 29.8 % 39 27.6 % 676 33.2 % 3 13.6 % 1 5.0 % 2 14.2 % 1420 29.6 % 4 Resting Symptoms 123 12.0 % 144 13.8 % 65 13.2 % 21 14.8 % 359 17.6 % 0 0 0 0 2 14.2 % 714 14.9 % 5 Exertion intolerant 28 2.7 % 22 2.1 % 6 1.2 % 4 2.8 % 75 3.6 % 0 0 0 0 0 0 135 2.8 % 6 Exertion limited 6 0.5 % 17 1.6 % 2 0.4 % 2 1.4 % 18 0.8 % 1 4.5 % 0 0 0 0 46 0.9 % 7 Advanced NYHA Class 3 7 0.6 % 11 1.0 % 1 0.2 % 1 0.7 % 18 0.8 % 0 0 0 0 0 0 38 0.7 % TOTAL 1025 100.0 % 1042 100.0 % 489 100.0 % 141 100.0 % 2031 100.0 % 22 100.0 % 20 100.0 % 14 100.0 % 4784 100.0 %
Page 15 of 29
# HHSN268201100025C Quarterly Report – 2013 Q4
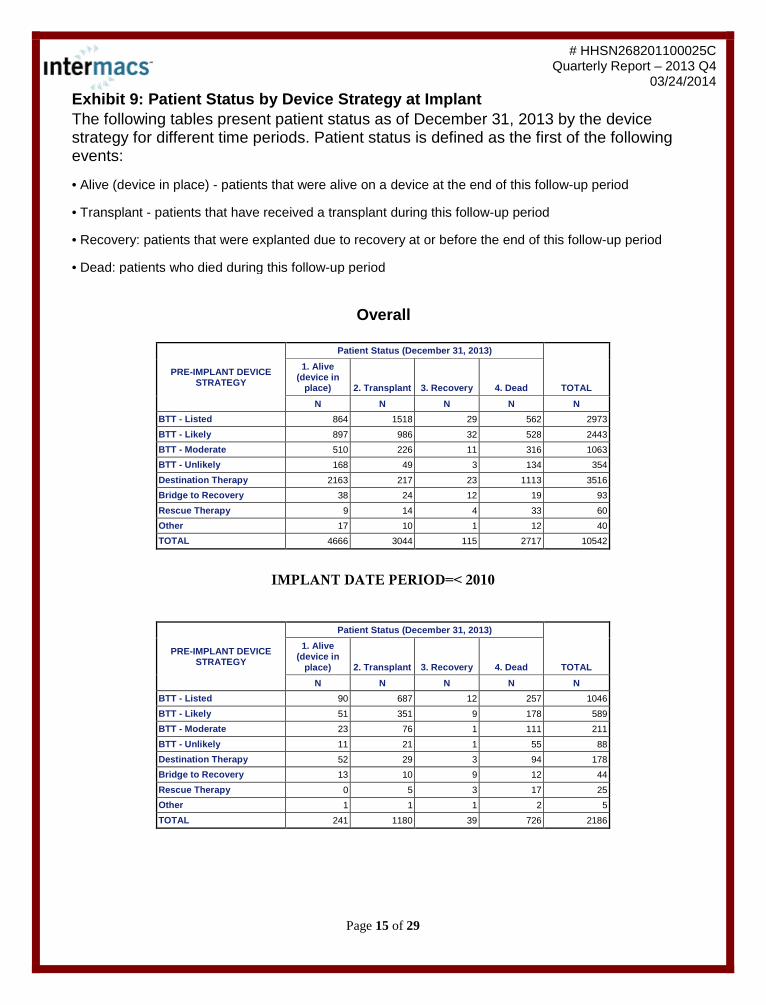
03/24/2014 Exhibit 9: Patient Status by Device Strategy at Implant Exhi bit 9: Pati ent Status by D evice Strateg y at Impl ant The following tables present patient status as of December 31, 2013 by the device strategy for different time periods. Patient status is defined as the first of the following events: • Alive (device in place) - patients that were alive on a device at the end of this follow-up period • Transplant - patients that have received a transplant during this follow-up period • Recovery: patients that were explanted due to recovery at or before the end of this follow-up period • Dead: patients who died during this follow-up period
Overall
PRE-IMPLANT DEVICE STRATEGY
Patient Status (December 31, 2013)
TOTAL
1. Alive (device in
place) 2. Transplant 3. Recovery 4. Dead N N N N N
BTT - Listed 864 1518 29 562 2973 BTT - Likely 897 986 32 528 2443 BTT - Moderate 510 226 11 316 1063 BTT - Unlikely 168 49 3 134 354 Destination Therapy 2163 217 23 1113 3516 Bridge to Recovery 38 24 12 19 93 Rescue Therapy 9 14 4 33 60 Other 17 10 1 12 40 TOTAL 4666 3044 115 2717 10542
IMPLANT DATE PERIOD=< 2010
PRE-IMPLANT DEVICE STRATEGY
Patient Status (December 31, 2013)
TOTAL
1. Alive (device in
place) 2. Transplant 3. Recovery 4. Dead N N N N N
BTT - Listed 90 687 12 257 1046 BTT - Likely 51 351 9 178 589 BTT - Moderate 23 76 1 111 211 BTT - Unlikely 11 21 1 55 88 Destination Therapy 52 29 3 94 178 Bridge to Recovery 13 10 9 12 44 Rescue Therapy 0 5 3 17 25 Other 1 1 1 2 5 TOTAL 241 1180 39 726 2186

Page 16 of 29
# HHSN268201100025C Quarterly Report – 2013 Q4
03/24/2014 IMPLANT DATE PERIOD=2010 - 2011
PRE-IMPLANT DEVICE STRATEGY
Patient Status (December 31, 2013)
TOTAL
1. Alive (device in
place) 2. Transplant 3. Recovery 4. Dead N N N N N
BTT - Listed 190 510 13 189 902 BTT - Likely 218 377 10 207 812 BTT - Moderate 138 98 7 120 363 BTT - Unlikely 59 15 1 50 125 Destination Therapy 622 108 13 564 1307 Bridge to Recovery 12 8 2 5 27 Rescue Therapy 4 5 1 5 15 Other 5 8 0 8 21 TOTAL 1248 1129 47 1148 3572
IMPLANT DATE PERIOD=2012 - 2013 (Jan-Dec)
PRE-IMPLANT DEVICE STRATEGY
Patient Status (December 31, 2013)
TOTAL
1. Alive (device in
place) 2. Transplant 3. Recovery 4. Dead N N N N N
BTT - Listed 584 321 4 116 1025 BTT - Likely 628 258 13 143 1042 BTT - Moderate 349 52 3 85 489 BTT - Unlikely 98 13 1 29 141 Destination Therapy 1489 80 7 455 2031 Bridge to Recovery 13 6 1 2 22 Rescue Therapy 5 4 0 11 20 Other 11 1 0 2 14 TOTAL 3177 735 29 843 4784

Page 17 of 29
# HHSN268201100025C Quarterly Report – 2013 Q4
03/24/2014 Exhibit 10: Primary Cause of Death Exhi bit 10: Primar y C ause of D eath
PRIMARY CAUSE OF DEATH
IMPLANT DATE PERIOD
TOTAL < 2010 2010 - 2011 2012 - 2013 (Jan-Dec)
n % n % n % n % Circulatory: Arterial Non-CNS Thromboembolism 7 0.9 % 15 1.3 % 3 0.3 % 25 0.9 % Circulatory: CHF 28 3.8 % 37 3.2 % 28 3.3 % 93 3.4 % Circulatory: Cardiac Arrhythmia 22 3.0 % 39 3.4 % 16 1.9 % 77 2.8 % Circulatory: End Stage Cardiomyopathy 11 1.5 % 17 1.4 % 10 1.1 % 38 1.4 % Circulatory: Heart Disease . . 8 0.6 % 5 0.5 % 13 0.4 % Circulatory: Hemolysis 1 0.1 % 5 0.4 % 4 0.4 % 10 0.3 % Circulatory: Ischemic Cardiomyopathy 4 0.5 % 9 0.7 % 14 1.6 % 27 0.9 % Circulatory: Major Bleeding 35 4.8 % 35 3.0 % 21 2.5 % 91 3.3 % Circulatory: Myocardial Infarction 3 0.4 % 7 0.6 % 7 0.8 % 17 0.6 % Circulatory: Myocardial Rupture 1 0.1 % . . . . 1 0.0 % Circulatory: Other, Specify 40 5.5 % 37 3.2 % 31 3.7 % 108 3.9 % Circulatory: Pericardial Fluid Collection 1 0.1 % 1 0.0 % 1 0.1 % 3 0.1 % Circulatory: Right Heart Failure 36 4.9 % 66 5.7 % 28 3.3 % 130 4.7 % Circulatory: Ruptured Aortic Aneurysm 1 0.1 % . . . . 1 0.0 % Circulatory: Sudden Unexplained Death 27 3.7 % 56 4.8 % 25 2.9 % 108 3.9 % Device Malfunction 20 2.7 % 44 3.8 % 21 2.5 % 85 3.1 % Digestive: Fluid/Electrolyte Disorder 4 0.5 % 3 0.2 % . . 7 0.2 % Digestive: GI Disorder . . 5 0.4 % 8 0.9 % 13 0.4 % Digestive: Hepatic Dysfunction 12 1.6 % 17 1.4 % 4 0.4 % 33 1.2 % Digestive: Pancreatitis 1 0.1 % . . . . 1 0.0 % Digestive: Renal Dysfunction 20 2.7 % 18 1.5 % 1 0.1 % 39 1.4 % Major Infection 102 14.0 % 121 10.5 % 41 4.8 % 264 9.7 % Multisystem Organ Failure (MSOF) 69 9.5 % 129 11.2 % 173 20.6 % 371 13.6 % Nervous System: Neurological Dysfunction 140 19.3 % 205 17.8 % 143 17.0 % 488 18.0 % Other, specify 30 4.1 % 72 6.2 % 76 9.0 % 178 6.5 % Other: Cancer 6 0.8 % 21 1.8 % 5 0.5 % 32 1.1 % Other: Trauma/accident, specify 6 0.8 % 8 0.6 % 4 0.4 % 18 0.6 % Psychiatric Episode/Suicide 4 0.5 % 1 0.0 % 3 0.3 % 8 0.2 % Respiratory: Pulmonary: Other, specify 3 0.4 % 14 1.2 % 8 0.9 % 25 0.9 % Respiratory: Respiratory Failure 39 5.3 % 50 4.3 % 40 4.7 % 129 4.7 % Respiratory: Venous Thromboembolism Event 1 0.1 % 3 0.2 % 1 0.1 % 5 0.1 % Withdrawal of Support, specify 36 4.9 % 77 6.7 % 116 13.8 % 229 8.4 % ~Unknown~ 15 2.0 % 27 2.3 % . . 42 1.5 % TOTAL 725 100.0 % 1147 100.0 % 837 100.0 % 2709 100.0 %
Note: 8 patients have a missing primary cause of death. * Certain pre-relaunch categories are no longer supported as of the v3.0 Launch (May 2012).
Page 18 of 29
# HHSN268201100025C Quarterly Report – 2013 Q4
03/24/2014
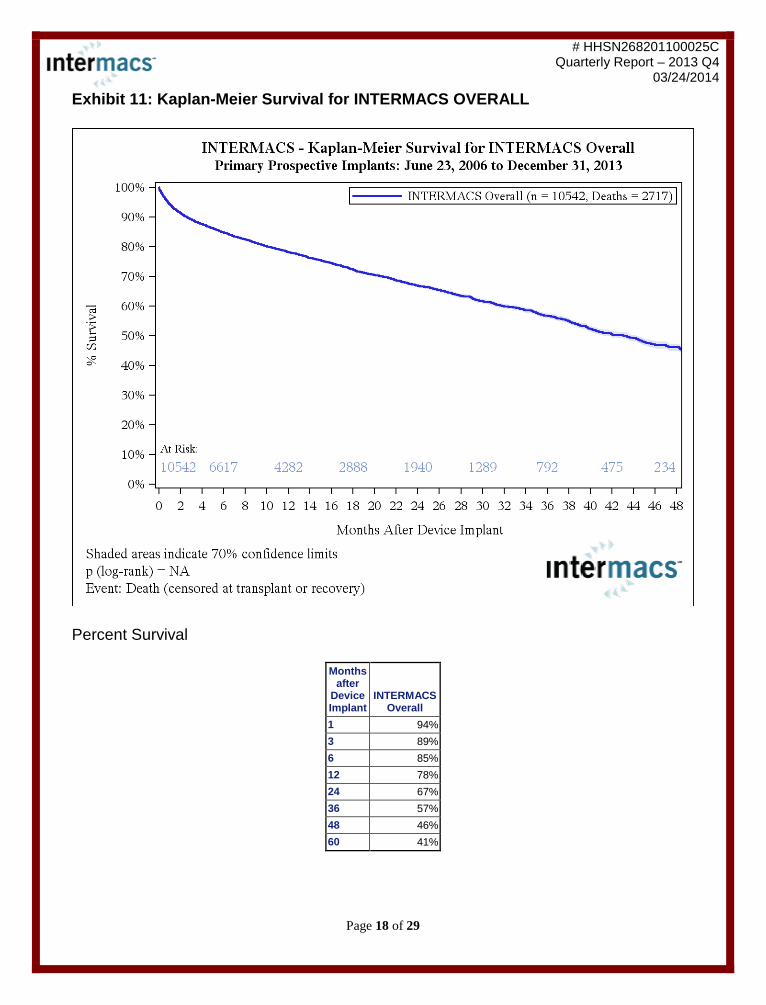
Exhibit 11: Kaplan-Meier Survival for INTERMACS OVERALL Exhi bit 11: Kapl an-M eier Sur vi val for IN TERM ACS OVER ALL
Percent Survival
Months after
Device Implant
INTERMACS Overall
1 94% 3 89% 6 85% 12 78% 24 67% 36 57% 48 46% 60 41%
Page 19 of 29
# HHSN268201100025C Quarterly Report – 2013 Q4
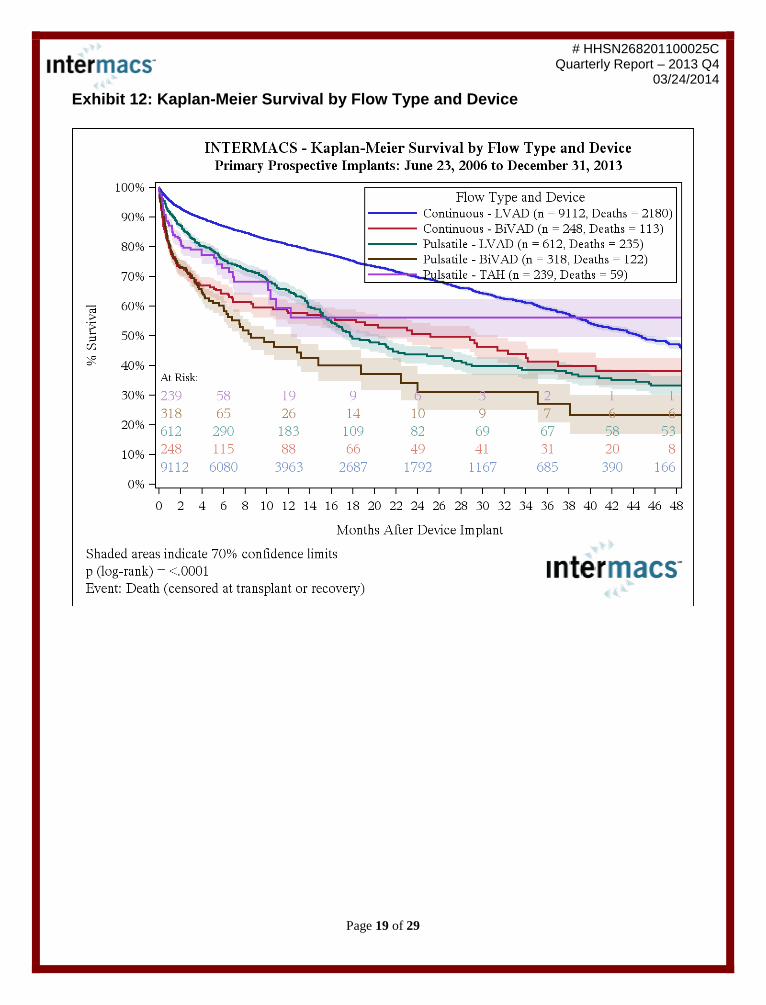
03/24/2014 Exhibit 12: Kaplan-Meier Survival by Flow Type and Device Exhi bit 12: Kapl an-M eier Sur vi val by Fl ow Type and D evice

Page 20 of 29
# HHSN268201100025C Quarterly Report – 2013 Q4
03/24/2014 Exhibit 13: Kaplan-Meier Survival for Continuous Flow LVADs (with or without RVAD implant at time of LVAD operation) by Implant Era Exhi bit 13: Kapl an-M eier Sur vi val for C ontinuous Flow LVADs ( with or wi thout R VAD implant at ti me of LVAD oper ati on) by Impl ant Era

Page 21 of 29
# HHSN268201100025C Quarterly Report – 2013 Q4
03/24/2014 Exhibit 14: Kaplan-Meier Survival for Continuous Flow LVADs (with or without RVAD implant at time of LVAD operation) by Pre-Implant Device Strategy Exhi bit 14: Kapl an-M eier Sur vi val for C ontinuous Flow LVADs ( with or wi thout R VAD implant at ti me of LVAD oper ati on) by Pre-Impl ant Devi ce Str ateg y Bridge to Transplant (BTT) includes: BTT-listed, BTT-likely, BTT-moderately likely, and BTT-unlikely.
Page 22 of 29
# HHSN268201100025C Quarterly Report – 2013 Q4
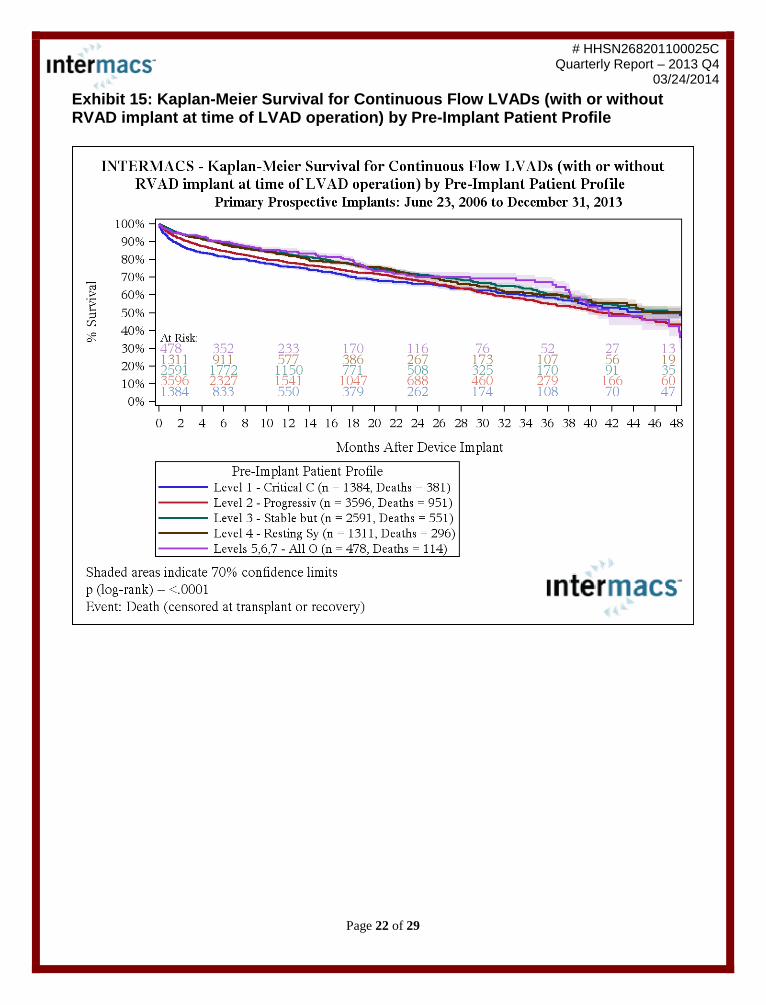
03/24/2014 Exhibit 15: Kaplan-Meier Survival for Continuous Flow LVADs (with or without RVAD implant at time of LVAD operation) by Pre-Implant Patient Profile Exhi bit 15: Kapl an-M eier Sur vi val for C ontinuous Flow LVADs ( with or wi thout R VAD implant at ti me of LVAD oper ati on) by Pre-Impl ant Pati ent Profil e
Page 23 of 29
# HHSN268201100025C Quarterly Report – 2013 Q4
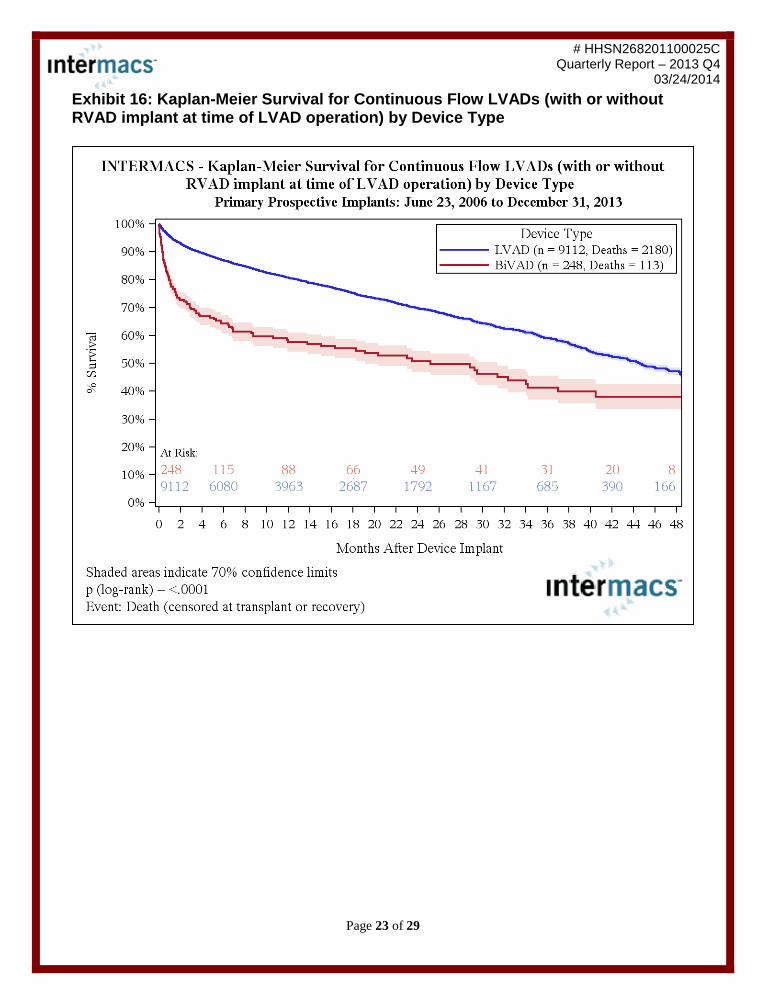
03/24/2014 Exhibit 16: Kaplan-Meier Survival for Continuous Flow LVADs (with or without RVAD implant at time of LVAD operation) by Device Type Exhi bit 16: Kapl an-M eier Sur vi val for C ontinuous Flow LVADs ( with or wi thout R VAD implant at ti me of LVAD oper ati on) by D evice Type
Page 24 of 29
# HHSN268201100025C Quarterly Report – 2013 Q4
03/24/2014 Exhibit 17: Competing Outcomes for Continuous Flow LVADs (without RVAD implant at time of LVAD operation) Exhi bit 17: C ompeti ng Outcomes for C ontinuous Flow LVAD s ( without R VAD i mpl ant at time of LVAD operati on)
Number of Patients at Risk
Month 0 1 3 6 9 12 24 36 48
9112 8530 7523 6100 4916 3967 1796 686 181

Page 25 of 29
# HHSN268201100025C Quarterly Report – 2013 Q4
03/24/2014 Exhibit 18: Competing Outcomes for Continuous Flow LVADs (with RVAD implant at time of LVAD operation) Exhi bit 18: C ompeti ng Outcomes for C ontinuous Flow LVAD s ( with RVAD i mplant at ti me of LVAD operation)
Number of Patients at Risk
Month 0 1 3 6 9 12 24 36 48
248 187 146 117 100 89 50 32 20

Page 26 of 29
# HHSN268201100025C Quarterly Report – 2013 Q4
03/24/2014
Exhibit 19: Competing Outcomes for TAHs Exhi bit 19: C ompeti ng Outcomes for TAHs
Number of Patients at Risk
Month 0 1 3 6 9 12 24 36 48
239 190 121 59 30 20 8 6 6
Page 27 of 29
# HHSN268201100025C Quarterly Report – 2013 Q4
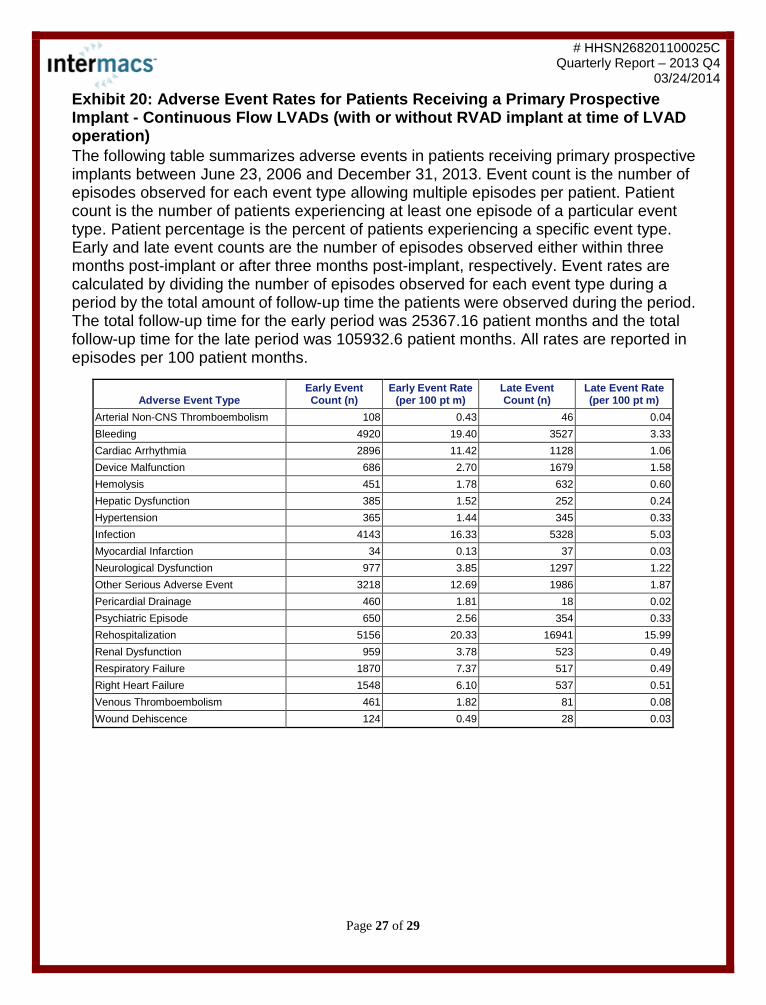
03/24/2014 Exhibit 20: Adverse Event Rates for Patients Receiving a Primary Prospective Implant - Continuous Flow LVADs (with or without RVAD implant at time of LVAD operation) Exhi bit 20: Adverse Event Rates for Pati ents R ecei ving a Primar y Prospecti ve Implant - Conti nuous Fl ow LVADs ( with or without RVAD i mplant at ti me of LVAD operation) The following table summarizes adverse events in patients receiving primary prospective implants between June 23, 2006 and December 31, 2013. Event count is the number of episodes observed for each event type allowing multiple episodes per patient. Patient count is the number of patients experiencing at least one episode of a particular event type. Patient percentage is the percent of patients experiencing a specific event type. Early and late event counts are the number of episodes observed either within three months post-implant or after three months post-implant, respectively. Event rates are calculated by dividing the number of episodes observed for each event type during a period by the total amount of follow-up time the patients were observed during the period. The total follow-up time for the early period was 25367.16 patient months and the total follow-up time for the late period was 105932.6 patient months. All rates are reported in episodes per 100 patient months.
Adverse Event Type Early Event Count (n)
Early Event Rate (per 100 pt m)
Late Event Count (n)
Late Event Rate (per 100 pt m)
Arterial Non-CNS Thromboembolism 108 0.43 46 0.04 Bleeding 4920 19.40 3527 3.33 Cardiac Arrhythmia 2896 11.42 1128 1.06 Device Malfunction 686 2.70 1679 1.58 Hemolysis 451 1.78 632 0.60 Hepatic Dysfunction 385 1.52 252 0.24 Hypertension 365 1.44 345 0.33 Infection 4143 16.33 5328 5.03 Myocardial Infarction 34 0.13 37 0.03 Neurological Dysfunction 977 3.85 1297 1.22 Other Serious Adverse Event 3218 12.69 1986 1.87 Pericardial Drainage 460 1.81 18 0.02 Psychiatric Episode 650 2.56 354 0.33 Rehospitalization 5156 20.33 16941 15.99 Renal Dysfunction 959 3.78 523 0.49 Respiratory Failure 1870 7.37 517 0.49 Right Heart Failure 1548 6.10 537 0.51 Venous Thromboembolism 461 1.82 81 0.08 Wound Dehiscence 124 0.49 28 0.03
Page 28 of 29
# HHSN268201100025C Quarterly Report – 2013 Q4
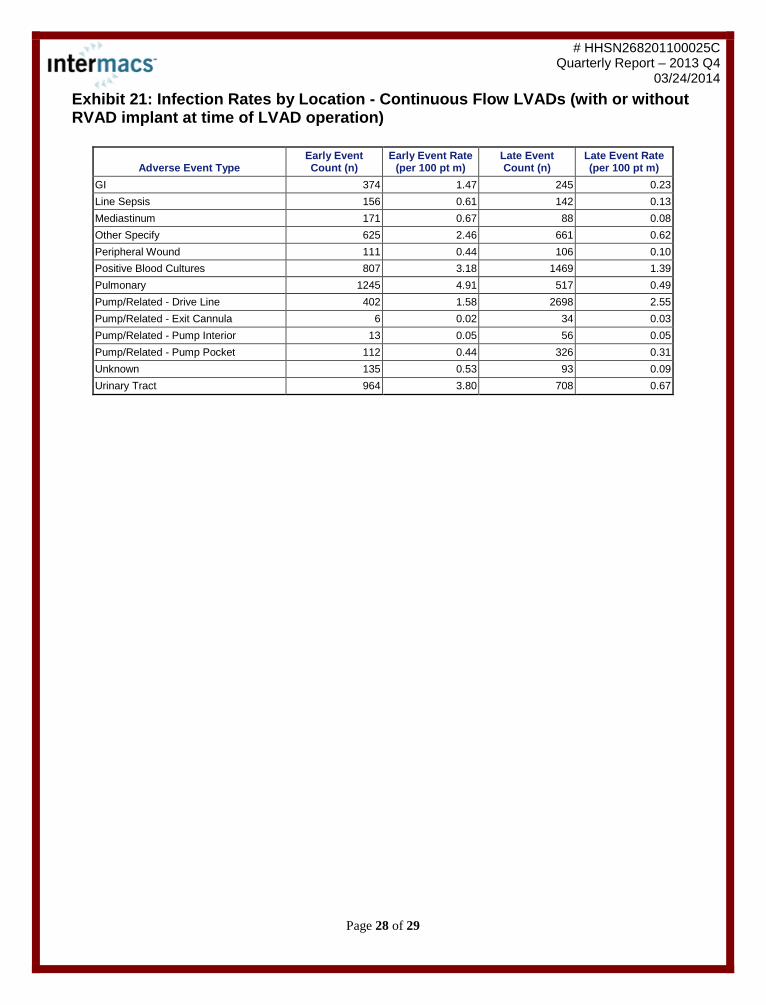
03/24/2014 Exhibit 21: Infection Rates by Location - Continuous Flow LVADs (with or without RVAD implant at time of LVAD operation) Exhi bit 21: Infec tion R ates by Location - C ontinuous Flow LVADs ( with or wi thout R VAD impl ant at ti me of LVAD oper ati on)
Adverse Event Type Early Event Count (n)
Early Event Rate (per 100 pt m)
Late Event Count (n)
Late Event Rate (per 100 pt m)
GI 374 1.47 245 0.23 Line Sepsis 156 0.61 142 0.13 Mediastinum 171 0.67 88 0.08 Other Specify 625 2.46 661 0.62 Peripheral Wound 111 0.44 106 0.10 Positive Blood Cultures 807 3.18 1469 1.39 Pulmonary 1245 4.91 517 0.49 Pump/Related - Drive Line 402 1.58 2698 2.55 Pump/Related - Exit Cannula 6 0.02 34 0.03 Pump/Related - Pump Interior 13 0.05 56 0.05 Pump/Related - Pump Pocket 112 0.44 326 0.31 Unknown 135 0.53 93 0.09 Urinary Tract 964 3.80 708 0.67

Page 29 of 29
# HHSN268201100025C Quarterly Report – 2013 Q4
03/24/2014 Exhibit 20: Follow-up Compliance Exhi bit 20: Follow- up Compliance Site compliance is determined by the percentage of all follow-up forms that are due during this reporting period that have been completed. This calculation has been updated to include ALL follow-up forms expected for ALL patients and ALL devices. Only sites that have at least 10 follow-up forms expected are included in this figure. INTERMACS has defined required compliance as 90%.