UvA-DARE (Digital Academic Repository) … and Mass Transfer in Multiphase Reactors ACADEMISCH...
179
UvA-DARE is a service provided by the library of the University of Amsterdam (http://dare.uva.nl) UvA-DARE (Digital Academic Repository) Hydrodynamics and mass transfer in multiphase reactors Vandu, C.O. Link to publication Citation for published version (APA): Vandu, C. O. (2005). Hydrodynamics and mass transfer in multiphase reactors. General rights It is not permitted to download or to forward/distribute the text or part of it without the consent of the author(s) and/or copyright holder(s), other than for strictly personal, individual use, unless the work is under an open content license (like Creative Commons). Disclaimer/Complaints regulations If you believe that digital publication of certain material infringes any of your rights or (privacy) interests, please let the Library know, stating your reasons. In case of a legitimate complaint, the Library will make the material inaccessible and/or remove it from the website. Please Ask the Library: http://uba.uva.nl/en/contact, or a letter to: Library of the University of Amsterdam, Secretariat, Singel 425, 1012 WP Amsterdam, The Netherlands. You will be contacted as soon as possible. Download date: 19 May 2019
Transcript of UvA-DARE (Digital Academic Repository) … and Mass Transfer in Multiphase Reactors ACADEMISCH...

UvA-DARE is a service provided by the library of the University of Amsterdam (http://dare.uva.nl)
UvA-DARE (Digital Academic Repository)
Hydrodynamics and mass transfer in multiphase reactorsVandu, C.O.
Link to publication
Citation for published version (APA):Vandu, C. O. (2005). Hydrodynamics and mass transfer in multiphase reactors.
General rightsIt is not permitted to download or to forward/distribute the text or part of it without the consent of the author(s) and/or copyright holder(s),other than for strictly personal, individual use, unless the work is under an open content license (like Creative Commons).
Disclaimer/Complaints regulationsIf you believe that digital publication of certain material infringes any of your rights or (privacy) interests, please let the Library know, statingyour reasons. In case of a legitimate complaint, the Library will make the material inaccessible and/or remove it from the website. Please Askthe Library: http://uba.uva.nl/en/contact, or a letter to: Library of the University of Amsterdam, Secretariat, Singel 425, 1012 WP Amsterdam,The Netherlands. You will be contacted as soon as possible.
Download date: 19 May 2019

Hydrodynamics and Mass Transfer in Multiphase Reactors
Chippla O. Vandu

Hydrodynamics and Mass Transfer in Multiphase Reactors

Hydrodynamics and Mass Transfer in Multiphase Reactors
ACADEMISCH PROEFSCHRIFT
ter verkrijging van de graad van doctor
aan de Universiteit van Amsterdam,
op gezag van de Rector Magnificus
Prof. mr. P.F. van der Heijden ten overstaan van een
door het college voor promoties ingestelde commissie,
in het openbaar te verdedigen in de Aula der Universiteit
op dinsdag 17 mei 2005 te 12:00 uur
door
Chippla Oliver Vandu
geboren te Victoria Island (Nigeria)

Promotiecommissie Promotor: Prof. dr. R. Krishna
Overige leden:
Prof. dr. F. Kapteijn
Prof. dr. ir. J.C. Schouten
Prof. dr. R.F. Mudde
Dr. ir. A. Stankiewicz
Dr. A.C. Dimian
Dr. ir. H.C.J. Hoefsloot
Faculteit der Natuurwetenschappen, Wiskunde en Informatica

To my mother and father


CONTENTS
Summary ……………………………………………………………………………… 1 Chapter 1 Introduction……………………………………………………………….... 11 Chapter 2 Gas Holdup and Mass Transfer in Bubble Columns……………………...... 19 Chapter 3 Large Bubble Sizes and Rise Velocities in a Bubble Column Slurry
Reactor……………………………………………………………………... 43
Chapter 4 Hydrodynamics and Mass Transfer in an Upflow Monolith Loop Reactor.. 61 Chapter 5 Hydrodynamics and Mass Transfer in an Upflow Monolith Loop Reactor:
Influence of Vibration Excitement…………………………………………. 87 Chapter 6 Hydrodynamics of Taylor Flow in Vertical Capillaries……………………. 105 Chapter 7 Mass Transfer from Taylor Bubbles rising in Single Capillaries………….. 135 Chapter 8 Conclusions………………………………………………………………… 151 Samenvatting (Dutch Summary)….……………………………………………………... 155 Publications and Presentations………………………………………………………...… 165 Acknowledgements………………………………………………………………………. 167

Summary
SUMMARY
INTRODUCTION
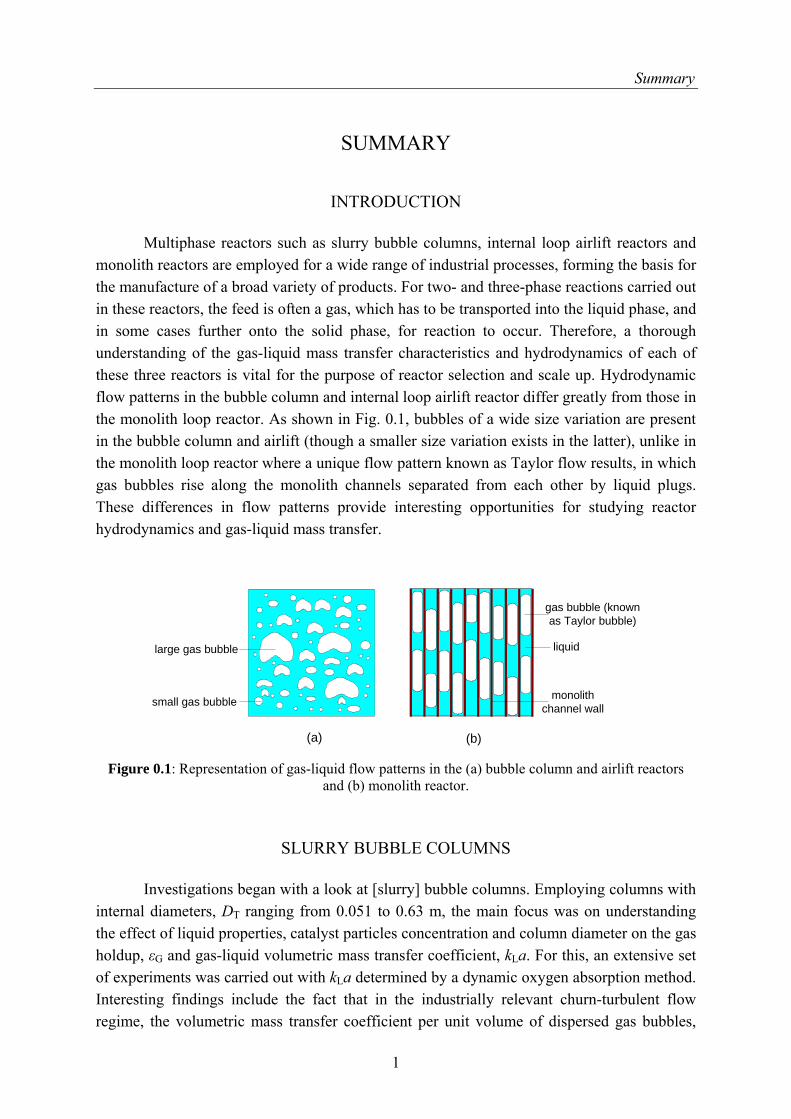
Multiphase reactors such as slurry bubble columns, internal loop airlift reactors and monolith reactors are employed for a wide range of industrial processes, forming the basis for the manufacture of a broad variety of products. For two- and three-phase reactions carried out in these reactors, the feed is often a gas, which has to be transported into the liquid phase, and in some cases further onto the solid phase, for reaction to occur. Therefore, a thorough understanding of the gas-liquid mass transfer characteristics and hydrodynamics of each of these three reactors is vital for the purpose of reactor selection and scale up. Hydrodynamic flow patterns in the bubble column and internal loop airlift reactor differ greatly from those in the monolith loop reactor. As shown in Fig. 0.1, bubbles of a wide size variation are present in the bubble column and airlift (though a smaller size variation exists in the latter), unlike in the monolith loop reactor where a unique flow pattern known as Taylor flow results, in which gas bubbles rise along the monolith channels separated from each other by liquid plugs. These differences in flow patterns provide interesting opportunities for studying reactor hydrodynamics and gas-liquid mass transfer.
(a) (b)
large gas bubble
small gas bubble
gas bubble (knownas Taylor bubble)
liquid
monolithchannel wall
Figure 0.1: Representation of gas-liquid flow patterns in the (a) bubble column and airlift reactors and (b) monolith reactor.
SLURRY BUBBLE COLUMNS
Investigations began with a look at [slurry] bubble columns. Employing columns with internal diameters, DT ranging from 0.051 to 0.63 m, the main focus was on understanding the effect of liquid properties, catalyst particles concentration and column diameter on the gas holdup, εG and gas-liquid volumetric mass transfer coefficient, kLa. For this, an extensive set of experiments was carried out with kLa determined by a dynamic oxygen absorption method. Interesting findings include the fact that in the industrially relevant churn-turbulent flow regime, the volumetric mass transfer coefficient per unit volume of dispersed gas bubbles,
1

Summary
kLa/εG is independent of the superficial gas velocity, UG, assuming a constant plateau value, which varies with the liquid employed; see Fig. 0.2. This constant value furthermore depends on the liquid phase Schmidt number, Sc; see Fig. 0.3. An increase in column diameter gives rise to a weak but noticeable increase in kLa/εG in the churn-turbulent flow regime. This is due to an increase in liquid recirculations within the bubble column; see Fig 0.4.
Superficial gas velocity, UG /[m/s]
0.0 0.1 0.2 0.3 0.4
(kLa
/εG
) /[s
-1]
0.0
0.2
0.4
0.6
0.8
1.0
WaterTetradecaneParaffin oil AParaffin oil BTellus oil
DT = 0.1 m
Figure 0.2: Constancy of the volumetric mass transfer coefficient per unit volume of dispersed gas bubbles, kLa/εG in the churn-turbulent flow regime.
Liquid phase Schmidt number
102 103 104 105
(kLa
/εG) /
[s-1
]
0.01
0.1
1
Sc-1/3 dependenceWaterTetradecaneParaffin oil AParaffin oil BTeulls oil
DT = 0.1 m
Figure 0.3: Dependence of kLa/εG on the liquid phase Schmidt number, Sc.
The influence of solid particles on gas-liquid mass transfer was found to be very much dependent on the nature of the particles employed. With silica particles in air-water and air-
2

Summary
tetradecane systems, kLa/εG generally decreases with an increase in particles concentration. The same is true for alumina particles in air-tetradecane system. However alumina particles in air-paraffin oil mixture system leads to an increase in kLa/εG as particles concentration increases. This paraffin oil mixture consisted predominantly of C9-C11 hydrocarbons. More research in this area is required. A strategy proposed for estimating kLa in slurry bubble columns operating in the churn-turbulent regime is depicted in Fig 0.5.
Column diameter, DT /[m]
0.0 0.2 0.4 0.6
(kLa
/εG) /
[s-1
]
0.01
0.1
1
WaterTellus oil
Figure 0.4: Influence of an increase in column diameter on kLa/εG.
Estimate the gasholdup,εG
Use value topredict kLa in thepure liquid based
on the liquidphase Sc number
εG Correct for column
diameter effectwith known kLa/εG
Account for effect ofslurry concentration
on kLa/εG
Figure 0.5: Strategy for estimating kLa in a slurry bubble column.
Video imaging techniques were used to study bubble rise characteristics in a 0.02-m-deep, 0.1-m-wide rectangular bubble column, with a paraffin oil and alumina particles as the liquid and solid phases. These mimicked the properties of the Fischer-Tropsch slurry under reaction conditions. The large bubble diameter was discovered to be practically independent of the superficial gas velocity, UG in the churn-turbulent regime of operation for solids holdup, εS > 0.05 and UG > 0.1 m/s. Also, the rise velocity of the large bubbles can very well be predicted by the extended Davies-Taylor relationship with the incorporation of a scale correction factor, SF and an acceleration factor, AF. Estimates of the liquid side mass transfer coefficient, kL were an order of magnitude higher than those from literature correlations. The reason for this is the frequent breakup and coalescence phenomena of large bubbles, which occur in the churn-turbulent regime of operation.
3

Summary
MONOLITH LOOP REACTOR
Experimental gas-liquid mass transfer studies were carried out in an internal loop
upflow monolith reactor and an internal loop airlift reactor. The performance of these reactors was then compared with that of the bubble columns previously studied. The monolith reactor comprised of square-channel cordierite monolith pieces, such as that shown in Fig 0.6, in its riser section, where gas and liquid flow upward.
Figure 0.6: Square-channel cordierite monolith piece used in the monolith reactor experiments.
For a given superficial gas velocity, UG, the volumetric mass transfer coefficient, kLa is much higher in the monolith reactor than in both the airlift and bubble column, as shown in Fig. 0.7. kLa/εG stands highest in the airlift reactor however, though the monolith still performs better than the bubble column in this regard. For the results in Fig. 0.7, similar perforated plate gas distributors with holes of 0.5-mm-diameter were used in all reactors. The higher kLa values obtained in the monolith loop reactor are due to the unique gas-liquid flow pattern in the monolith channels, called Taylor flow; see Fig. 0.1.
Superficial gas velocity, UG /[m/s]
0.00 0.05 0.10 0.15
k La
/[s-1
]
0.00
0.05
0.10
0.15
0.20
0.25
0.30MonolithAirliftBubble column
Superficial gas velocity, UG /[m/s]
0.00 0.05 0.10 0.15
k La/
ε G /[
s-1]
0.0
0.5
1.0
1.5
2.0MonolithAirliftBubble column
(a) (b)
Figure 0.7: Comparison of the performance of the monolith, airlift and bubble column reactors.
4

Summary
Preliminary predictions of the gas-liquid volumetric mass transfer coefficient, based on hydrodynamic parameters obtained from studies in a single capillary, showed that the bulk of mass transfer occurs from the liquid film surrounding a Taylor bubble as it rises in the monolith channel. For these predictions, a mass transfer model accounting for the separate contributions of gas-liquid mass transfer from the bubble cap and the liquid film surrounding the bubble was used.
The influence of low frequency vibrations (amplitude of λ = 0.5 mm and frequency of f = 60 Hz) on the hydrodynamics and mass transfer of square- and circular-channel monolith loop reactors, an airlift loop reactor and a bubble column was also investigated experimentally. For these experiments, the gas distributor on all the columns was made up of eleven 0.9-mm-diameter capillaries. As shown in Fig. 0.8, kLa and kLa/εG are much higher for the monolith loop reactors.
Superficial gas velocity, UG /[m/s]
0.00 0.05 0.10 0.15
k La
/[s-1
]
0.00
0.05
0.10
0.15
Monolith (circular)Monolith (square)AirliftBubble column
Superficial gas velocity, UG /[m/s]
0.00 0.05 0.10 0.15
k La/ε
G /[
s-1]
0.0
0.5
1.0
1.5Monolith (circular)Monolith (square)AirliftBubble column
Superficial gas velocity, UG /[m/s]
0.00 0.05 0.10 0.15
k La
/[s-1
]
0.00
0.05
0.10
0.15
0.20
0.25Monolith (circular)Monolith (square)AirliftBubble column
Superficial gas velocity, UG /[m/s]
0.00 0.05 0.10 0.15
k La/
ε G /[
s-1]
0.0
0.5
1.0
1.5
2.0
2.5Monolith (circular)Monolith (square)AirliftBubble column
(a) (b)
(c) (d)
without vibrations without vibrations
with vibrations:λ = 0.5 mm; f = 60 Hz with vibrations:
λ = 0.5 mm; f = 60 Hz
Figure 0.8: Comparison of kLa and kLa/εG of the circular- and square-channel monolith reactors with the airlift loop reactor and bubble column.
5

Summary
Furthermore, the application of low frequency vibrations helps to improve both kLa and kLa/εG. In the monolith loop reactors, vibrations also have the added advantage of improving gas liquid distribution into the monolith channels. The better gas-liquid mass transfer performance of the monolith loop reactor makes it a viable candidate for mass transfer limited reactions. Whereas mass transfer limitations are often overcome by the use of mechanical stirrers, the monolith offers the unique advantage of not only high mass transfer rates, but the much desired plug flow, without which reaction rates become diminished due to liquid backmixing and reactor productivity reduced. To truly understand what characteristics of Taylor flow in monolith channels give rise to its higher mass transfer rates, extensive sets of experiments were then performed in single capillaries
SINGLE CAPILLARIES
Studies carried out in single capillaries were two fold: firstly, the hydrodynamics of Taylor flow was investigated with a view to understanding flow regimes and regime transition, as well as developing practical correlations for estimating the bubble rise velocity, liquid slug length and the total pressure drop. Secondly, gas liquid mass transfer experimental studies were conducted.
For hydrodynamic studies, circular and square capillaries with hydraulic diameters ranging from 0.9 to 3 mm were used. Water, ethanol or an oil mixture was used as the liquid phase. Significant results include the characterization of flow regimes, useful for understanding under what conditions Taylor flow will occur in the channels of a monolith reactor. Also, a simple and practical correlation was developed for estimating the bubble rise velocity in a single capillary. The beauty of this correlation is that it simply depends on the gas and liquid velocities and the Capillary number, Ca, which is a function of liquid properties. Excellent agreements were obtained between the correlation and experimentally observed Taylor bubble rise velocities as shown in Fig. 0.9 for a few cases. An attempt was made to predict the liquid slug length, Lslug in Taylor flow. However, difficulties were experienced resulting from the fact that in addition to being a function of the gas and liquid flow rates, Lslug also depends on the configuration of the gas-liquid feed system.
A flow regime dependent pressure drop model was developed for predicting the total pressure drop in capillary two-phase flow systems, and invariably, in the channels of a monolith reactor. This model relies on the estimation of dimensionless pressure factors. Correlations were developed for the homogeneous and heterogeneous flow regime pressure factors. Predictions obtained using this new pressure drop model in single capillaries were very good. Fig 0.10 shows two examples.
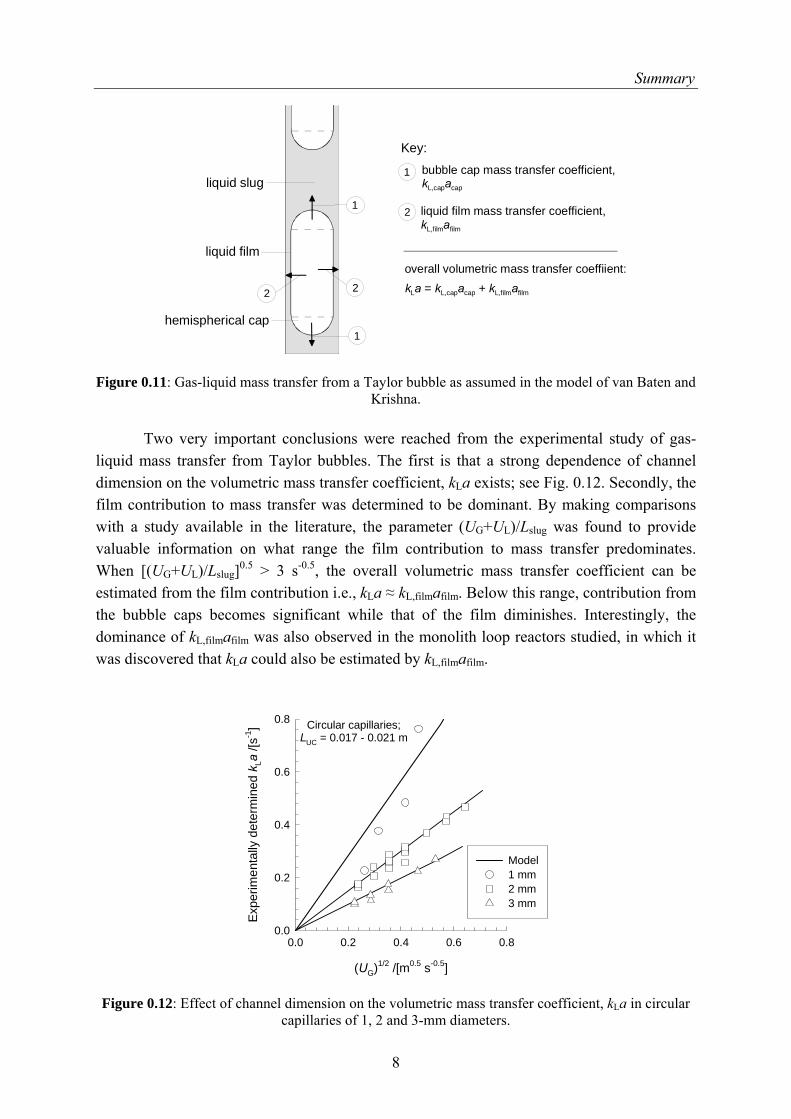
An extensive experimental study was conducted in order to understand gas-liquid mass transfer phenomenon from Taylor bubbles to the surrounding liquid phase in single capillaries. Experimental results were compared with a theoretical mass transfer model, proposed by van Baten and Krishna, in which the separate mass transfer contributions of the bubble cap and the thin liquid film surrounding the bubble were accounted for. This model,
6

Summary
was formulated on the basis of Higbie’s mass transfer theory and backed by extensive computational fluid dynamics (CFD) simulations. Its basic form is depicted schematically in Fig. 0.11.
Two phase superficial velocity, UTP /[m/s]
0.0 0.2 0.4 0.6 0.8 1.0 1.2
Bubb
le ri
se v
eloc
ity, V
b /[m
/s]
0.0
0.2
0.4
0.6
0.8
1.0
1.2
1.4
1.6
ExperimentalCorrelation
3.02-mm circularAir-water
Two phase superficial velocity, UTP /[m/s]
0.0 0.2 0.4 0.6 0.8
Bubb
le ri
se v
eloc
ity, V
b /[m
/s]
0.0
0.2
0.4
0.6
0.8
1.0
ExperimentalCorrelation
2.89-mm squareAir-water
Two phase superficial velocity, UTP /[m/s]
0.0 0.2 0.4 0.6 0.8
Bub
ble
rise
velo
city
, Vb /
[m/s
]
0.0
0.2
0.4
0.6
0.8
1.0
ExperimentalCorrelation
3.02-mm circularAir-ethanol
Two phase superficial velocity, UTP /[m/s]
0.0 0.1 0.2 0.3 0.4
Bubb
le ri
se v
eloc
ity, V
b /[m
/s]
0.0
0.1
0.2
0.3
0.4
0.5
0.6
ExperimentalCorrelation
2.89-mm squareAir-oil mixture
(a) (b)
(c) (d)
Figure 0.9: Experimental bubble rise velocities, Vb as well as values predicted by the correlation developed.
50
Superficial gas velocity, UG /[m/s]0.01 0.1 1
Tota
l pre
ssur
e dr
op, ∆
PT
/[kPa
]
1
10
UL=0.009 m/sUL=0.054 m/sUL=0.159 m/sUL=0.268 m/sUL=0.363 m/sUL=0.455 m/sUL=0.009 m/sUL=0.054 m/sUL=0.159 m/sUL=0.268 m/sUL=0.363 m/sUL=0.455 m/s
3.02-mm circularAir-water
50
(a) (b)
Superficial gas velocity, UG /[m/s]
0.01 0.1 1
Tota
l pre
ssur
e dr
op, ∆
PT
/[kPa
]
1
10
UL=0.021 m/sUL=0.124 m/sUL=0.343 m/sUL=0.537 m/sUL=0.021 m/sUL=0.124 m/sUL=0.343 m/sUL=0.537 m/s
2-mm circularAir-ethanol
Figure 0.10: Experimental and predicted total pressure drop values.
7
Summary
hemispherical cap
1
2
liquid film
2
1
liquid slug1
2
bubble cap mass transfer coefficient, kL,capacap
liquid film mass transfer coefficient, kL,filmafilm
Key:
overall volumetric mass transfer coeffiient:kLa = kL,capacap + kL,filmafilm
Figure 0.11: Gas-liquid mass transfer from a Taylor bubble as assumed in the model of van Baten and Krishna.
Two very important conclusions were reached from the experimental study of gas-
liquid mass transfer from Taylor bubbles. The first is that a strong dependence of channel dimension on the volumetric mass transfer coefficient, kLa exists; see Fig. 0.12. Secondly, the film contribution to mass transfer was determined to be dominant. By making comparisons with a study available in the literature, the parameter (UG+UL)/Lslug was found to provide valuable information on what range the film contribution to mass transfer predominates. When [(UG+UL)/Lslug]0.5 > 3 s-0.5, the overall volumetric mass transfer coefficient can be estimated from the film contribution i.e., kLa ≈ kL,filmafilm. Below this range, contribution from the bubble caps becomes significant while that of the film diminishes. Interestingly, the dominance of kL,filmafilm was also observed in the monolith loop reactors studied, in which it was discovered that kLa could also be estimated by kL,filmafilm.
(UG)1/2 /[m0.5 s-0.5]
0.0 0.2 0.4 0.6 0.8
Expe
rimen
tally
det
erm
ined
kLa
/[s-1
]
0.0
0.2
0.4
0.6
0.8
Model1 mm2 mm3 mm
Circular capillaries;LUC = 0.017 - 0.021 m
Figure 0.12: Effect of channel dimension on the volumetric mass transfer coefficient, kLa in circular capillaries of 1, 2 and 3-mm diameters.
8

Summary
In conclusion, the work presented in this dissertation provides new understanding into gas-liquid mass transfer in bubble columns, the airlift loop reactor and the monolith loop reactor. It demonstrates the superiority of the monolith reactor over the bubble column from a gas-liquid mass transfer point of view, opening up opportunities for potential applications of the former in a range of processes. Further insight into the monolith reactor was gained through studies in single capillaries.
9


Chapter 1 Introduction
Chapter 1
INTRODUCTION
1.1 IMPORTANCE AND APPLICATIONS OF MULTIPHASE REACTORS
The term multiphase reactors refers to a range of reactor types in which reactions involving two or three phases occur, such as gas-liquid, gas-solid or gas-liquid-solid reactions. They are applied in a wide range of processes, forming the basis for the manufacture of a broad variety of intermediate and consumer end products.
Fig. 1.1 shows schematic representations of three types of multiphase reactors that are of particular interest in gas-liquid and gas-liquid-solid operations. The first of these is the bubble column reactor, which is currently employed in a host of industrial processes. It is essentially a cylindrical vessel in which contact between gas and liquid phases occurs. The gas phase is dispersed into the liquid phase often from the bottom of the column. For solid-catalyzed reactions, solid catalyst particles are also dispersed in the liquid phase. In such cases, the column is referred to as a slurry bubble column reactor.
Gas in
Gas out
Liquid in
Liquid out
Catalystparticle
Rising gasbubble
Gas in
Gas out
Liquid in
Liquid out
Heatexchange
tube
Downcomer(recirculation)
Catalystparticle
Riser
Gas in
Gas out
Liquid in
Liquid out
Heatexchange
tube
Monolith
Downcomer(recirculation)
BUBBLE COLUMN REACTOR INTERNAL LOOPAIRLIFT REACTOR
INTERNAL LOOPMONOLITH REACTOR
Figure 1.1: Schematic representation of the bubble column, the internal loop airlift reactor and the internal loop monolith reactor.
11

Chapter 1 Introduction
The second reactor is the internal loop airlift reactor, in which well-defined liquid circulation occurs, by dividing the reactor into sections – a riser section, where upflow of gas, liquid and solid (if present) phases occurs and a downcomer section, in which the liquid and solids flow downward. The third reactor, the monolith loop reactor, is similar to the internal loop airlift reactor. However, into its riser section is fitted a monolith block onto which solid catalyst particles can be coated. The use of monolith loop reactors for three-phase reactions is a novel concept, and one that will likely find increasing application in the near future.
Examples of industrial scale processes, which make use of the three multiphase reactors described above, are provided in Fig. 1.2. This list is by no means exhaustive. For further examples, consult works in the literature.1-3 The only known industrial scale three-phase application of the monolith reactor is in the production of hydrogen peroxide by the anthraquinone process,4 though it has been employed in laboratory scale studies for the oxidation of glucose,5 dehydrogenation of ethylbenzene6 and the Fischer-Tropsch process,7 amongst others. Airlift reactors are generally employed for biological and biochemical reactions.
[Slurry] Bubblecolumn reactor
Airliftreactor
Monolithreactor
Oxidations (e.g. partial oxidation of ethylene to acetaldehyde, oxidation of n-paraffins to secondary alcohols)
Biological waste water treatment
Hydrogenations (e.g. hydrogenation of benzene to cyclohexane, saturation of unsaturated fats,
hydrogenation of glucose to sorbitol)
Chlorinations (e.g. production of monochloroacetic acid by the chlorination of acetic acid)
Fischer-Tropsch synethesis
Production of hydrogen peroxide
Methanol synthesis
Biochemical fermentation
Animal cell culture
Polymerization of olefins
Figure 1.2: Examples of industrial applications of the bubble column, monolith and airlift reactors.
12

Chapter 1 Introduction
Multiphase catalytic reactors are also used in the production of bulk commodity chemicals. They are increasingly replacing antiquated processes that consume expensive and hazardous feedstocks and generate environmentally unfriendly by-products.8 The greater efficiency of multiphase catalytic routes means that less expensive feedstock are required which eventually produce minimal emissions.
1.2 IMPORTANCE OF INVESTIGATING MASS TRANSFER
In a number of two- and three-phase reactions, the feed is gaseous while reaction occurs in the liquid or solid phase. Thus, the transport of gaseous feed molecules to the liquid phase is a necessary step for such reactions to occur. This phenomenon is broadly known as gas-liquid mass transfer. Classical analysis of the problem using the film mass transfer model assumes the existence of two hypothetical boundary layers where resistance to the transport of gas phase molecules to the liquid phase occurs.9 One layer lies on the gas side of the gas-liquid interface, while the other lies on the liquid side of this interface. In most practical applications, the gas side resistance is negligible compared to the liquid side resistance. Therefore, the quantity used to describe the speed of transfer from the gas to the liquid phase is the liquid phase mass transfer coefficient, kL. For solid-catalyzed reactions, where reaction occurs not in the liquid phase but in the pores of solid particles, the liquid-solid mass transfer coefficient, kLS also needs to be known.
kL and kLS are important parameters in the design and operation of multiphase reactors. In describing the overall chemical reaction rate, a combination of chemical kinetics, i.e., chemical reaction proper as occurring on the catalyst surface, and mass transfer phenomena need to be taken into account. In other words, knowledge of mass transfer rates is a sine qua non in multiphase reactor design and development. In situations where the rate of gas-liquid mass transfer is much slower than liquid-solid transfer and chemical kinetics, say an order of magnitude slower, it alone will suffice to describe the overall chemical reaction. This goes to show the importance of accurately estimating mass transfer rates for a particular reaction in different reactor systems and under a wide range of operating conditions.
In three-phase reactions, limitations posed by liquid-solid mass transfer can be overcome by increasing the amount of catalyst particles present in the reactor, or decreasing the size of the particles. Reducing the resistance to gas-liquid mass transfer on the other hand is rather more complex, as this often requires a modification of the reactor design or the adoption of a totally different reactor. Such a reactor will invariably utilize a different gas-liquid contacting pattern. Investigating and comparing gas-liquid mass transfer rates in different reactor configurations such as the bubble column, airlift and monolith loop reactors shown in Fig. 1.1 will help provide very useful information for the selection and design of these reactors for a wide range of processes.
13

Chapter 1 Introduction
1.3 CHARACTERISTICS OF MULTIPHASE REACTORS
In addition to mass transfer, there exists a wide range of other factors that need to be
considered in determining the optimal reactor for a given process. Table 1.1 compares the bubble column, airlift loop and monolith loop reactors for a selected number of such parameters, based on literature information available for the three reactors.
Shown in Fig. 1.3 are a pictorial representations of flow patterns that occur in (a) the bubble column and airlift loop reactors as well as (b) the monolith loop reactor. The flow pattern in the monolith loop reactor, characterized by gas bubble plugs rising in the monolith channels, separated from each other by liquid slugs, generally occurs at low to moderate gas and liquid velocities. This flow pattern is known as Taylor flow. Also, a smaller variation in bubble sizes will be present in the airlift loop reactor than in the bubble column for the same gas flow rate due to well-defined liquid circulation in the former, which inhibits bubble coalescence. The different flow patterns in the bubble column, airlift loop and monolith loop reactors affect the overall reactor hydrodynamics in each case. Since hydrodynamics and mass transfer are coupled, a study of gas-liquid mass transfer should also include hydrodynamic parameters such as gas holdup and liquid circulation velocity to be of use in reactor design and scale up.
(a) (b)
large gasbubble
small gasbubble
gas bubble (known asTaylor bubble)
liquid
monolithchannel wall
Figure 1.3: Representation of gas-liquid flow patterns as will be obtained in (a) the bubble column and airlift loop reactors and (b) the monolith loop reactor. The flow pattern in the channels of the
monolith loop reactor is called Taylor flow.
1.4 OBJECTIVE AND STRUCTURE OF THIS THESIS
The aim of this thesis is the investigation of the hydrodynamics and gas-liquid mass transfer in bubble column, airlift loop and monolith loop reactors. For the bubble column reactor, attention will be paid to both the homogeneous flow regime as well as the industrially relevant churn-turbulent regime of operation, encountered in a growing number of processes.
14

Chapter 1 Introduction
Table 1.1: Comparing the bubble column, airlift loop and monolith loop reactors
Parameter Bubble Column Airlift Loop Monolith Loop Gas-liquid flow pattern Gas bubbles dispersed in
continuous liquid or slurry phase. At high gas velocities, a wide range of bubble sizes exists, such as in the churn-turbulent regime. See Fig. 1.3(a).
Dispersed gas bubbles are present in the liquid phase.
For low to moderate gas and liquid velocities, a flow pattern known as Taylor or bubble-train flow ensues. See Fig. 1.3(b).
Backmixing Considerable degree of gas and liquid phase backmixing, which can sometimes be a disadvantage.10
Well-defined gas and liquid phase backmixing as a result of liquid circulation.11
Moderate amounts of liquid phase backmixing have been reported.12, 13 Gas phase backmixing does not occur with Taylor flow.
Temperature Control Excellent temperature control is obtained by the use of internal cooling pipes, and operating in the churn-turbulent regime, allowing for near isothermal operation.
Liquid circulation allows for uniform temperature distribution.
Temperature control and uniform temperature distribution are more difficult to obtain, especially when the monolith is constructed of a poor heat transfer material, like a ceramic.
Catalyst particles When the liquid is a reaction product, particles need to be separated from it by filtration. This can be a difficult process.
Same as for the bubble column.
Catalyst particles in the structured monolith channels are fixed. No filtration is thus required, giving monolith reactors an advantage over slurry bubble columns and airlifts.
Catalyst attrition For operations in the churn-turbulent regime, particle attrition will result over time.
Particle attrition will result if operations are carried out at high velocities.
Since the particles are immobile, significant attrition will not occur.
Pressure drop Relatively high-pressure drop with respect to the monolith loop reactor.
Higher-pressure drop than in the monolith loop reactor.
Low-pressure drop.
Gas-liquid mass transfer High mass transfer rates obtainable in the churn-turbulent flow regime of operation.14, 15
Mass transfer rates are comparable to the bubble column for the internal loop airlift reactor at low to moderate gas velocities.11
Most studies available are for single channels,16,
17 and indicate that monolith reactors perform at the very least as good as bubble columns from a gas-liquid mass transfer point of view.
15

Chapter 1 Introduction
Slurry bubble column systems will also be investigated with a view to understanding the effect of solid catalyst particles on gas-liquid mass transfer. To better understand the results obtained from the monolith loop reactor, a fundamental investigation of gas-liquid flow in single capillaries will be carried out.
Chapter 2 begins with an investigation of the gas holdup and volumetric mass transfer coefficient in bubble columns of different dimensions. Different liquids and catalyst particles are employed in an attempt to understand the influence of liquid properties, column diameter and an increase in catalyst particle concentration on the gas holdup and mass transfer coefficient. The aim is to provide valuable scale up information in the design of slurry bubble column reactors.
In Chapter 3, a more fundamental study of large bubble sizes rising in a slurry bubble column is carried out. Use is made of a paraffin oil and catalyst particles that have properties similar to that of the Fischer-Tropsch slurry under actual reactor operating conditions.
The hydrodynamics and mass transfer characteristics of an upflow monolith loop reactor is studied in Chapter 4, and comparisons made with those of an internal loop airlift reactor and a bubble column.
Chapter 5 focuses on the investigation of the effect of low frequency vibrations on the hydrodynamics and mass transfer in upflow monolith loop reactors of square- and circular-channels, an internal loop airlift rector and a bubble column.
Chapter 6 involves a study on the hydrodynamics of Taylor flow in single capillaries of circular and square cross sections. Flow regimes, bubble rise velocity, liquid slug length and pressure drop are investigated. Results obtained are useful for the purpose of designing and scaling up monolith reactors.
In Chapter 7, a gas-liquid mass transfer study in single capillaries of circular and square cross sections is presented. A theoretical model is used to understand mass transfer phenomenon from a Taylor gas bubble to its surrounding liquid phase.
Finally, Chapter 8 offers concluding remarks on the work done and results obtained.
BIBLIOGRAPHY (1) Shah, Y. T.; Kelkar, B. G.; Godbole, S. P.; Deckwer, W.-D. Design parameters estimations for bubble column reactors. American Institute of Chemical Engineers Journal 1982, 28, 353-379. (2) Chisti, Y.; Moo-Young, M. Airlift reactors: characteristics, applications and design considerations. Chemical Engineering Communications 1987, 60, 195-242. (3) Deckwer, W. D., Bubble column reactors, John Wiley, New York, NY, 1992. (4) Edvinsson Albers, R.; Nyström, M.; Siverström, M.; Sellin, A.; Dellve, A.-C.; Andersson, U.; Herrmann, W.; Berglin, T. Development of a monolith-based process for H2O2 production: from idea to large-scale implementation. Catalysis Today 2001, 69, 247-252.
16

Chapter 1 Introduction
(5) Kawakami, K.; Kawasaki, K.; Shiraishi, F.; Kusunoki, K. Performance of a honeycomb monolith bioreactor in a gas-liquid-solid three-phase system. Industrial & Engineering Chemistry Research 1989, 28, 394-400. (6) Liu, W.; Addiego, W. P.; Sorensen, C. M.; Boger, T. Monolith reactor for the dehydrogenation of ethylbenzene to styrene. Industrial & Engineering Chemistry Research 2002, 41, 3131-3138. (7) de Deugd, R. M.; Kapteijn, F.; Moulijn, J. A. Using monolithic catalysts for highly selective Fischer-Tropsch synthesis. Catalysis Today 2003, 79, 495-501. (8) Dudukovic, M. P.; Larachi, F.; Mills, P. L. Multiphase catalytic reactors: a perspective on current knowledge and future trends. Catalysis Reviews-Science and Engineering 2002, 44, 123-246. (9) Bird, R. B.; Stewart, W. E.; Lightfoot, E. N., Transport Phenomena, John Wiley, New York, USA, 2002. (10) Urseanu, M. I. Scaling up bubble column reactors. PhD Thesis. University of Amsterdam, Amsterdam, The Netherlands, 2000. (11) Elvers, B.; Hawkins, S.; Schulz, G., Ullmann's Encyclopedia of Industrial Chemistry, Vol. B4, VCH Verlagsgesellschaft mbH, Weinheim, Germany, 1992. (12) Thulasidas, T. C.; Abraham, M. A.; Cerro, R. L. Dispersion during bubble-train flow in capillaries. Chemical Engineering Science 1999, 54, 61-76. (13) Kreutzer, M. T. Hydrodynamics of Taylor flow in capillaries and monolith reactors. Ph.D. Thesis. Delft University of Technology, Delft, The Netherlands, 2003. (14) Letzel, H. M.; Schouten, J. C.; Krishna, R.; van den Bleek, C. M. Gas holdup and mass transfer in bubble column reactors operated at elevated pressure. Chemical Engineering Science 1999, 54, 2237-2246. (15) De Swart, J. W. A. Scale-up of a Fischer-Tropsch slurry reactor. PhD Thesis. University of Amsterdam, Amsterdam, The Netherlands, 1996. (16) Bercic, G.; Pintar, A. The role of gas bubbles and liquid slug lengths on mass transport in the Taylor flow through capillaries. Chemical Engineering Science 1997, 52, 3709-3719. (17) Irandoust, S.; Ertle, S.; Andersson, B. Gas-liquid mass-transfer in Taylor flow through a capillary. Canadian Journal of Chemical Engineering 1992, 70, 115-119.
17


Chapter 2 Gas Holdup and Mass Transfer in Bubble Columns
Chapter 2
GAS HOLDUP AND MASS TRANSFER IN BUBBLE COLUMNS
2.1 INTRODUCTION
Bubble columns are widely used for carrying out a variety of chemical reactions. In bubble column slurry reactors, catalyst particles smaller than say 100 µm in size can be used, thus eliminating intra-particle diffusion resistance. These catalyst particles are held in suspension due to liquid circulations caused by rising gas bubbles. For the highly exothermic Fischer-Tropsch synthesis, the slurry bubble column is the favored reactor choice, and high reactor productivities are achieved by the use of high slurry concentrations (up to 25-vol %) in columns approaching 10 m in diameter and a height of 40 m,1-3 operating at high superficial gas velocities, UG in the 0.3-0.4 m/s range.
For the successful scale up of bubble column reactors, it is important to be able to estimate hydrodynamic and mass transfer parameters in both homogeneous and heterogeneous flow regimes. At low gas velocities, homogenous flow prevails, characterized by the presence of small bubbles rising up along the column. With an increase in gas velocity, the flow goes through a transition regime where small bubbles begin coalescing to form large bubbles. Further increase in velocity leads to the heterogeneous flow regime. In this regime, a wide range of bubble sizes is present. For descriptive purposes however, it is common to speak of small and large bubble sizes, based on the two-phase heterogeneous model first proposed by Krishna.4, 5 Extensive studies have been carried out on bubble column hydrodynamics with special focus on such parameters as the gas holdup, εG, liquid phase backmixing and liquid velocity profile.6-9 From these studies, the emphasis of a strong influence of column diameter, DT on bubble column hydrodynamics can be seen. For instance, Urseanu10 reported that for the same superficial gas velocity, a larger column diameter results in a lower gas holdup in both low and high-viscosity liquids.
Though there have been a number of experimental studies on gas-liquid mass transfer in bubble columns (for literature surveys, see Inga and Morsi11 and Behkish et al.12), most published work is restricted to low gas velocities, UG < 0.1 m/s, in columns of diameter, DT < 0.1 m, with low slurry concentrations. Furthermore, nothing is known about the influence of column diameter on the rate of gas-liquid mass transfer from information available in the literature. Therefore, further research is required to understand gas-liquid mass transfer at superficial gas velocities in excess of 0.1 m/s, in columns of different sizes, utilizing a wide range of liquids and different slurry concentrations. This leads to the primary focus of the work presented in this chapter, which is:
19

Chapter 2 Gas Holdup and Mass Transfer in Bubble Columns
The study of the influence of liquid properties on the gas holdup, εG and volumetric mass transfer coefficient, kLa in bubble columns. Liquids with viscosities ranging from 0.85 to 75 mPa s were employed for this. Investigation of the influence of column diameter on εG and kLa. This helps provide
valuable scale up information in the design of bubble column reactors. Investigation of the influence of catalyst particle concentration on kLa. Silica and alumina
particles were utilized.
2.2 EXPERIMENTAL SETUP
To conduct the aforementioned studies of the gas holdup and volumetric mass transfer coefficient in bubble columns, experiments were carried out in a glass column of 0.051-m-diameter, and polyacrylate columns of 0.1, 0.15, 0.38 and 0.63-m-diameters. The experimental setup for the 0.1-m-diameter column is shown in Fig. 2.1; this was typical of all setups used. While a 3-mm-thick sintered glass plate with an average pore size of 70 µm was used in the 0.051-m column, the 0.1, 0.15 and 0.38-m-diameter columns were equipped with brass sieve plate distributors, which had 0.5-mm-diameter holes with a pitch of 7 mm. The 0.63-m-diameter column had a spider shaped sparger (see inset to Fig. 2.1). Details of the distributors are specified in Table 2.1.
4 m
air from compressor
manometer tube
graduated rule
voltmeter
ammeter
pressure transducer
PC
oxygen sensor
gas distributorpressure tap
nitrogen
rotameters
1
0.10 m
1
∆P
Spider sparger distributor
25 mm dia.
2.5 mm holes
gas inlet
0.5 mm holes
7 mm
Sieve plate distributor
Figure 2.1: Schematic representation of the experimental setup for the 0.1-m-diameter column. The inset on the right shows details of the brass sieve plate and spider shaped distributors.
20

Chapter 2 Gas Holdup and Mass Transfer in Bubble Columns
Air was used as the gas phase in all experiments. The rate of air flow into each column was controlled by the use of one or more pre-calibrated Sho-Rate Brooks rotameters aligned in parallel. Nitrogen flow, which was required for stripping out dissolved oxygen, was controlled by the use of manually operated control valves connected to each of the bubble columns. Pressure taps were installed along the height of the columns for the determination of gas holdup.
Table 2.1: Details of distributors used in the bubble columns
Column diameter, DT (m)
Type of distributor Hole diameter (mm)
Number of holes
0.051 Sintered glass plate 7x10⁻⁵ 0.1 Brass sieve plate 0.5 199, on triangular pitch 0.15 Brass sieve plate 0.5 625, on triangular pitch 0.38 Brass sieve plate 0.5 2750, on triangular pitch 0.63 Spider shaped sparger 2.5 64
Six different liquids were used in the experiments: demineralized water, ethanol, tetradecane, paraffin oil A, paraffin oil B and Tellus oil. The properties of each liquid are specified in Table 2.2. Paraffin oil B is a predominantly C9-C11 n-paraffin mixture.
Table 2.2: Properties of liquids used at 298 K
Liquid Density, ρL (kg/m3)
Viscosity, µL (mPa s)
Surface tension, σ (mN/m)
Oxygen diffusivity in the liquid, ÐL (10-9 m2/s)
Water 998 1 72 2.11 Ethanol 798 1.27 23 2.02 Tetradecane 763 2.2 27 4.11 Paraffin oil A 795 2.9 28 3.69 Paraffin oil B† 726 0.85 23 3.69 Tellus oil 862 75 28 1.02
† The composition of Paraffin oil B is: C≤ 8: 3.3 %; C9: 36.3 %; C10: 34.5 %; C11: 23.8 %; C≥ 12: 1.9 %
Three different solid particles were employed: passivated Raney cobalt catalyst particles, porous silica particles and Sasol PURALOX ScCa 5/170, an alumina-based catalyst particle carrier. Properties of the solid particles are given in Table 2.3. The solids concentration, εS is expressed as the volume fraction of solids in gas-free slurry, with the pore volume of the particles (liquid filled during operation) counted as being part of the solid phase. The temperature used in all experiments corresponded to ambient conditions. Table 2.4 gives an overview of the experimental systems investigated.
21

Chapter 2 Gas Holdup and Mass Transfer in Bubble Columns
Table 2.3: Properties of solid particles used
Raney cobalt catalyst particles Bulk density 1177 kg/m3
Skeletal density 4167 kg/m3
Mean particle diameter 25.4 µm Particle size distribution 10% < 9 µm; 50% < 28 µm; 90% < 61 µm
Silica catalyst particles Skeletal density 2100 kg/m3
Pore volume 1.05 mL/g Particle size distribution 10% < 27 µm; 50% < 38 µm; 90% < 47 µm
Alumina-based catalyst carrier Al2O3 content 98% Skeletal density 3900 kg/m3
Specific surface area 192 m2/g Particle porosity 70% Particle size distribution 10% < 10 µm; 50% < 16 µm; 90% < 39 µm
Table 2.4: Experimental systems studied
Column diameter, DT (m)
Liquid
Solids conc., εS
Solid phase
Height of ungassed liquid, H0 (m)
εG measurement technique
0.051 Ethanol 0 1.65 Pressure sensor0.051 Ethanol 0.01 Raney cobalt 1.65 Pressure sensor 0.051 Ethanol 0.038 Raney cobalt 1.65 Pressure sensor 0.1 Water 0 1.6 Pressure sensor 0.1 Water 0.136 Silica 1.61 Visual 0.1 Water 0.213 Silica 1.61 Visual 0.1 Tetradecane 0 1.22 Visual 0.1 Tetradecane 0.045 Silica 1.24 Visual 0.1 Tetradecane 0.15 Silica 1.27 Visual 0.1 Tetradecane 0.25 Silica 1.3 Visual 0.1 Tetradecane 0.047 Alumina 1.33 and 1.37 Visual 0.1 Tetradecane 0.15 Alumina 1.35 Visual 0.1 Tetradecane 0.25 Alumina 1.35 Visual 0.1 Tellus oil 0 1.3 Visual 0.1 Paraffin oil A 0 1.44 and 1.59 Pressure sensor 0.1 Paraffin oil B 0 1.34 Visual 0.1 Paraffin oil B 0.05 Alumina 1.36 Visual 0.1 Paraffin oil B 0.10 Alumina 1.36 Visual 0.1 Paraffin oil B 0.15 Alumina 1.36 Visual 0.1 Paraffin oil B 0.20 Alumina 1.36 Visual 0.1 Paraffin oil B 0.25 Alumina 1.36 Visual 0.15 Water 0 1.6 Pressure sensor 0.38 Water 0 1.6 Pressure sensor 0.38 Tellus oil 0 1.73 Visual 0.63 Water 0 2.18 Pressure sensor
22

Chapter 2 Gas Holdup and Mass Transfer in Bubble Columns
2.3 EXPERIMENTAL DETERMINATION OF GAS HOLDUP AND
VOLUMETRIC MASS TRANSFER COEFFICIENT
The gas holdup was determined either by the use of pressure taps installed along the height of the bubble columns or by visual measurements (refer to Table 2.4). In the first method, two pressure taps, one of which was positioned close to the column base and the other, close to the clear liquid height, were used. The taps were connected to pressure ports on a Validyne DP15 pressure transducer, which was in turn coupled to a personal computer (PC) via an analog-to-digital (AD) converter system consisting of the pressure transducer, a voltmeter and an analog-to-digital converter card on the PC. To determine the gas holdup in each experiment, the gas flow rate was adjusted using one rotameter at a time. Sufficient time was given for steady state to be reached in each column after which the increase in liquid pressure at the higher of the two pressure taps was recorded. The measured pressure signals, obtained in the form of voltage readings were then interpreted to obtain information on the gas holdups. In the second method, gas holdup values were obtained by visual observation. In this case, the total gas holdup, εG is defined as:
0G
H HH
ε −= (2.1)
where H0 is the ungassed column height and H is the column dispersion height due to the presence of gas bubbles.
The volumetric mass transfer coefficient, kLa was determined by means of a dynamic oxygen absorption technique. An oxygen electrode (Yellow Springs Incorporated Model 5331) was used to measure the change in dissolved oxygen concentration. Readings given by the electrode were fed to the PC via an ammeter and the AD converter card. The change in dissolved oxygen concentration was reflected as a change in the electrical current displayed on the ammeter. The oxygen electrode was made sensitive to the presence of dissolved oxygen by the application of a 0.13 g/mL KCl solution between its tip and an outer membrane, made of Teflon. Before the start of each experimental run, the membrane surrounding the tip of the electrode was changed and the time constant of the oxygen sensor determined. The sensor constant value corresponds to an inherent delay in readings obtained as a result of the fact that the oxygen sensor has a finite response time. In determining the sensor constant, two continuously stirred glass beakers were used, the first containing the particular liquid employed for a given set of experiments, and the other, the liquid or slurry, with solid particles in the same ratio as was present in the bubble column. Nitrogen was continuously bubbled into the first beaker and air into the other, such that the liquid phases in both beakers became completely saturated with dissolved gas over time. The sensor was first placed in the nitrogen-saturated liquid and after registering a negligible oxygen concentration, was instantaneously transferred to the oxygen-saturated liquid. Fig. 2.2 shows a representation of the setup used in the determination of the sensor constant.
23

Chapter 2 Gas Holdup and Mass Transfer in Bubble Columns
nitrogen-saturated liquid
oxygen-saturated liquid or slurry
nitrogen inlettube
air inlettube
magnetic stirrer
oxygen sensor
stirring bean
Figure 2.2: Schematic representation of the setup used in determining the sensor time constant.
Assuming perfect mixing in the liquid phase within each beaker, the oxygen concentration value indicated by the sensor, Csensor is given by:
( *sensorsensor L sensor
d Cd
C k Ct
= − ) (2.2)
where ksensor is the sensor time constant. Integrating Eq. (2.2) gives:
sensorsensor*L
1 k tC eC
−= − (2.3)
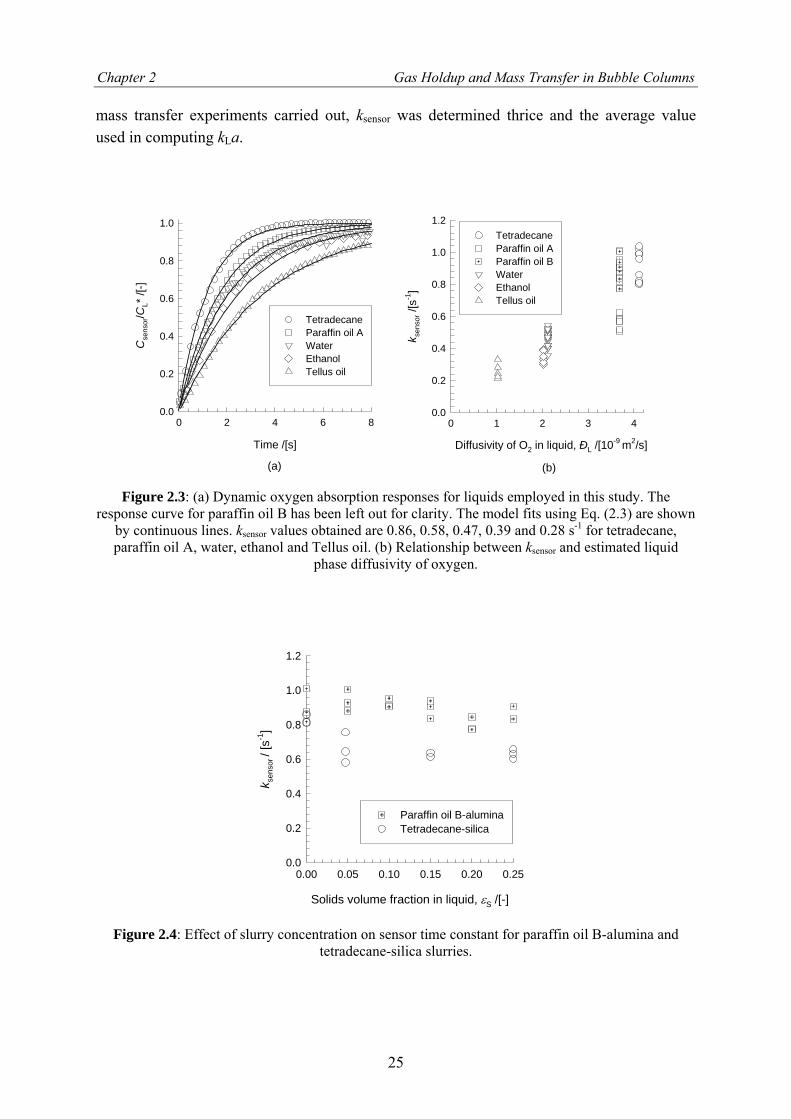
Fig. 2.3(a) shows typical sensor responses for the various liquids employed, excluding paraffin oil B. These correspond to the maximum rates of oxygen detection by the sensor for each liquid. It is apparent from these curves that the value of ksensor is dependent on liquid properties. Fitting Eq. (2.3) to these curves gives ksensor values of 0.86, 0.58, 0.47, 0.39 and 0.28 s-1 for tetradecane, paraffin oil A, water, ethanol and Tellus oil, respectively. Using literature correlations, the liquid phase diffusivity of oxygen, ÐL was estimated for each of the liquids employed, with the Wilke-Chang correlation13 for oxygen diffusivities in water and ethanol, Hayduk-Minhas13 for oxygen diffusivities in paraffin oil A, tetradecane and Tellus oil. Correlations by Erkey et al.14 and Marano and Holder15 were used to estimate ÐL in paraffin oil B. The sensor constant is found to depend on ÐL (see Fig. 2.3(b)). It thus appears that ksensor is not entirely a sensor property but is also dictated by oxygen diffusion through a stagnant liquid layer surrounding the oxygen sensor.
Furthermore, no significant dependence of ksensor on slurry concentration was found. This is demonstrated for the tetradecane and paraffin oil B slurries by the plot in Fig. 2.4, which shows the relationship between ksensor and slurry concentration. ksensor can be seen to vary between 0.77 and 1.01 s-1 for the paraffin oil B system, and between 0.58 and 0.86 s-1 for the tetradecane system, showing no particular dependence on slurry concentration. In all
24
Chapter 2 Gas Holdup and Mass Transfer in Bubble Columns
mass transfer experiments carried out, ksensor was determined thrice and the average value used in computing kLa.
Time /[s]
0 2 4 6 8
Cse
nsor
/CL*
/[-]
0.0
0.2
0.4
0.6
0.8
1.0
TetradecaneParaffin oil AWaterEthanolTellus oil
Diffusivity of O2 in liquid, ÐL /[10-9 m2/s]
0 1 2 3 4k s
enso
r /[s
-1]
0.0
0.2
0.4
0.6
0.8
1.0
1.2TetradecaneParaffin oil AParaffin oil BWaterEthanolTellus oil
(a) (b)
Figure 2.3: (a) Dynamic oxygen absorption responses for liquids employed in this study. The response curve for paraffin oil B has been left out for clarity. The model fits using Eq. (2.3) are shown
by continuous lines. ksensor values obtained are 0.86, 0.58, 0.47, 0.39 and 0.28 s-1 for tetradecane, paraffin oil A, water, ethanol and Tellus oil. (b) Relationship between ksensor and estimated liquid
phase diffusivity of oxygen.
Solids volume fraction in liquid, εS /[-]
0.00 0.05 0.10 0.15 0.20 0.25
k sen
sor /
[s-1
]
0.0
0.2
0.4
0.6
0.8
1.0
1.2
Paraffin oil B-aluminaTetradecane-silica
Figure 2.4: Effect of slurry concentration on sensor time constant for paraffin oil B-alumina and tetradecane-silica slurries.
25

Chapter 2 Gas Holdup and Mass Transfer in Bubble Columns
For the determination of kLa in the bubble columns, dissolved oxygen was stripped from the liquid phase in each column to a negligible concentration by the use of nitrogen sparged through the gas distributor. After the stripping operation, a step input of air was introduced into the column, with the uptake of oxygen into the liquid phase continuously monitored by the oxygen sensor. Sufficient time was given in each experimental run for the oxygen saturation concentration in the liquid, CL
* to be reached. Based on the assumption that the liquid is perfectly mixed, and oxygen depletion from
the gas phase is negligible, the rate of oxygen uptake is described by:
( *LL L L L
ddC k a C Ct
= − ) (2.4)
where kLaL is the volumetric mass transfer coefficient per unit volume of liquid in the bubble column. The assumption of a well-mixed liquid phase was indeed a good one for the experimental conditions, due to the high degree of liquid circulations in the churn-turbulent regime. The sensor delay equation resulting from the finite response time of the oxygen sensor is given by:
(sensorsensor L sensor
dd
C k C Ct
= − ) (2.5)
Analytical solution of Eq. (2.4) along with the sensor delay equation (2.5) yields:
( sensorL Lsensorsensor L L*
L sensor L L
11 k tk a tC k e k a eC k k a
−−= − −−
)
)
(2.6)
The volumetric mass transfer coefficient per unit volume of dispersion (gas + liquid + solid), kLa is obtained from:
( )(L L L G S S1 1k a k a fε ε= − − (2.7) where fS is the volume fraction of the solid particles due to the solid skeleton structure (i.e., not considering the solid pore volume contribution). Gas-liquid mass transfer can occur in the pores of the solid particles, which become filled with liquid during experiments, making it necessary to account for this contribution. Typical oxygen absorption dynamics experimental data, obtained in the 0.1-m-diameter column are shown in Fig. 2.5(a)-(c). These data are for (a) different liquid, at UG = 0.37 m/s. The values of kLaL obtained from these curves by fitting them to Eq. (2.6) are 0.323, 0.238 and 0.03 s-1 for tetradecane, water and Tellus oil respectively. (b) Varying slurry concentrations, with water and silica particles as the liquid and solid phases, at UG = 0.14 m/s. kLaL values obtained from these curves are 0.223, 0.061 and 0.038 s-1 for εS = 0, 0.136 and 0.213 respectively. (c) Varying gas velocities for εS = 0.25,
26

Chapter 2 Gas Holdup and Mass Transfer in Bubble Columns
with paraffin oil B and alumina particles as the liquid and solid phases. Resulting kLaL values are 0.056, 0.124 and 0.254 s-1 for UG = 0.043, 0.137 and 0.36 m/s respectively.
Time /[s]
0 5 10 15 20 25
Cse
nsor
/CL*
/[-]
0.0
0.2
0.4
0.6
0.8
1.0
TetradecaneWaterTellus oil
Time /[s]
0 10 20 30 40C
sens
or/C
L* /[
-]0.0
0.2
0.4
0.6
0.8
1.0
εS = 0
εS = 0.136
εS = 0.213
Time /[s]
0 5 10 15 20 25
Cse
nsor
/CL*
/[-]
0.0
0.2
0.4
0.6
0.8
1.0
UG = 0.36 m/sUG = 0.137 m/sUG = 0.043 m/s
UG = 0.37 m/s
UG = 0.14 m/s
Water-silica
Paraffin oil B-alumina
εS = 0.25
(a)
(c)
(b)
Figure 2.5: (a) Oxygen absorption dynamics with tetradecane, water and Tellus oil as liquids in the 0.1-m-diameter column, at UG = 0.37 m/s. (b) Oxygen absorption dynamics for air-water-silica system at UG = 0.14 m/s, with varying slurry concentrations. (c) Oxygen absorption dynamics for air-paraffin oil B-alumina for εS=0.25, at varying superficial gas velocities. In all plots, continuous lines represent
fits obtained using Eq. (2.6).
It is important to note that even at the highest gas velocities employed, based on all experiments carried out, the oxygen absorption dynamics were at least twice slower than the sensor dynamics. This in effect meant that suitably accurate estimations of kLa could be obtained. In any case, the sensor dynamics was routinely accounted for by the use of Eq. (2.6). Generally, the experimental studies as presented in Table 2.4, were carried out without major hindrances. An exception was the set of experiments that utilized alumina particles as the solid phase. Alumina particles are poor conductors of electricity, but good supporters of
27

Chapter 2 Gas Holdup and Mass Transfer in Bubble Columns
electrostatic fields, i.e., they are excellent dielectric materials. One consequence of this property of alumina particles is that they can become fairly good conductors of electricity in the presence of large electrostatic fields. This in turn has an enormously negative effect on kLa measurements, because the alumina particles were continuously deposited on the oxygen sensor, severely limiting its ability to detect for the presence of dissolved oxygen. This problem was fully overcome by inserting a 50-mL hollow copper tube in the column. The tube was properly earthed using a thin copper wire, and provided a large conducting surface compared to the oxygen sensor. In this way, alumina particles were deposited on the surface of the copper tube but not at all on the oxygen sensor. During gas holdup experiments, the additional increase in dispersion volume resulting from the presence of the hollow copper tube was corrected for.
Further details on the experimental setup and measurement techniques, including photographs and video recordings are available online.16
2.4 RESULTS AND DISCUSSION
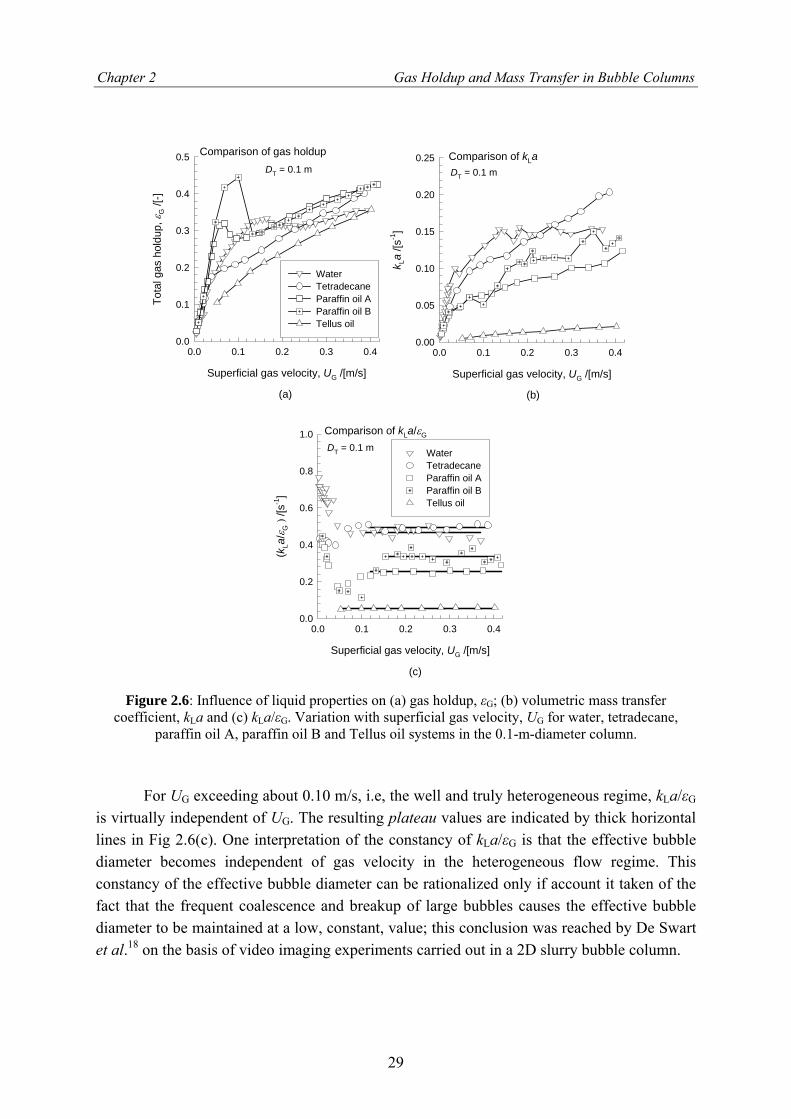
INFLUENCE OF LIQUID PROPERTIES ON kLa
Fig. 2.6 shows the variation of (a) gas holdup, εG; (b) volumetric mass transfer coefficient, kLa and (c) kLa/εG with superficial gas velocity, UG in the 0.1-m-diameter column, operating with five different liquids. For liquids with low viscosities: water, tetradecane, paraffin oil A and paraffin oil B, Fig. 2.6(a) shows the existence of both homogeneous and heterogeneous flow regimes, with regime transition taking place at values of UG in the region of 0.04 to 0.08 m/s. Paraffin oils A and B, both of which consist of mixtures of linear hydrocarbons, have a strong tendency to foam at low gas velocities, showing sharp maximums at UG = 0.06 m/s and UG = 0.08 m/s on the UG-εG curve, respectively.
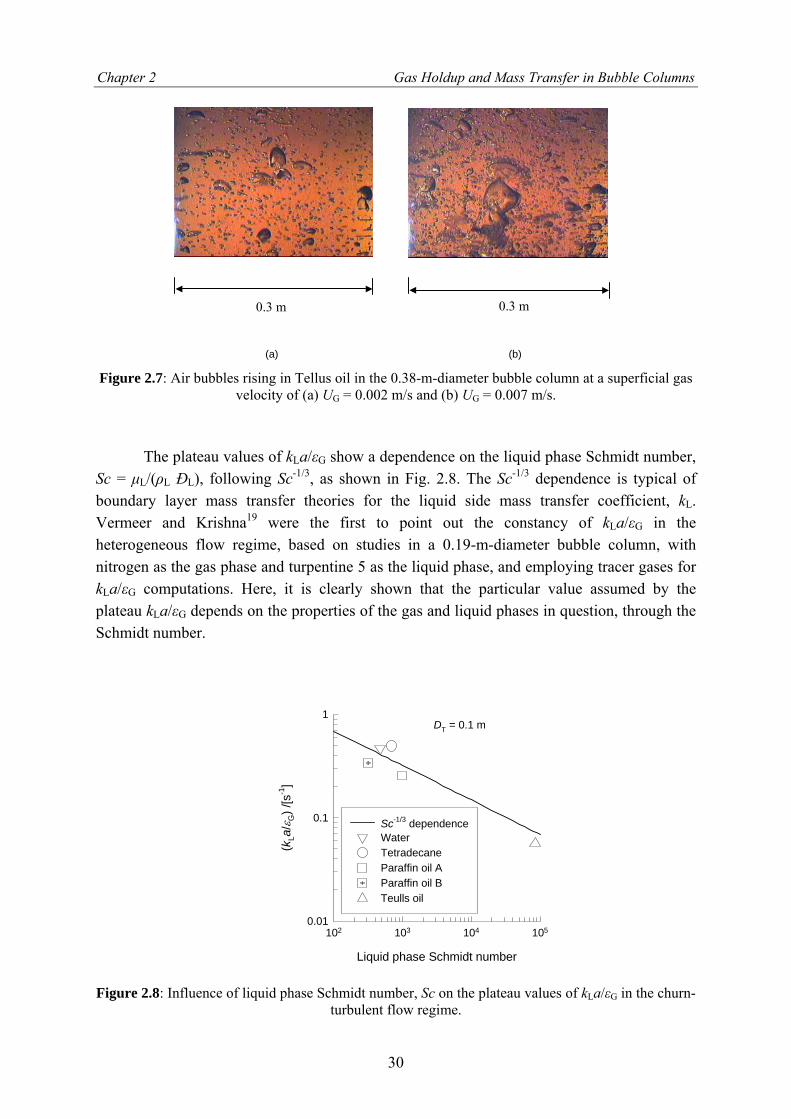
With Tellus oil, a kind of motor oil (with a viscosity of µL=75 mPa s), as the liquid phase, the homogeneous regime of operation is virtually non-existent and large fast-rising bubbles appear even at low values of UG. This has been observed visually, snapshots of which are shown in Fig. 2.7 – you can view the movies from which these snapshots were extracted online.16 At the extremely low velocity of UG = 0.002 m/s, large bubbles can be seen to be present among the small bubbles. For UG = 0.007 m/s, greater formation of large bubbles is observed. Dynamic gas experiments have also confirmed that for Tellus oil, the dispersion consists predominantly of large fast-rising bubbles.17 The kLa values shown in Fig. 2.6(b), largely follow the trends in εG, except that no sharp maxima are detected. Fig. 2.6(c) shows the values of kLa/εG, which represents the volumetric mass transfer coefficient per unit volume of dispersed gas bubbles, for the five different liquids.
28
Chapter 2 Gas Holdup and Mass Transfer in Bubble Columns
Superficial gas velocity, UG /[m/s]
0.0 0.1 0.2 0.3 0.4
Tota
l gas
hol
dup,
εG /[
-]
0.0
0.1
0.2
0.3
0.4
0.5
WaterTetradecaneParaffin oil AParaffin oil BTellus oil
Superficial gas velocity, UG /[m/s]
0.0 0.1 0.2 0.3 0.4
k La
/[s-1
]
0.00
0.05
0.10
0.15
0.20
0.25
Superficial gas velocity, UG /[m/s]
0.0 0.1 0.2 0.3 0.4
(kLa
/εG
) /[s
-1]
0.0
0.2
0.4
0.6
0.8
1.0
WaterTetradecaneParaffin oil AParaffin oil BTellus oil
DT = 0.1 m DT = 0.1 m
DT = 0.1 m
(a) (b)
(c)
Comparison of gas holdup Comparison of kLa
Comparison of kLa/εG
Figure 2.6: Influence of liquid properties on (a) gas holdup, εG; (b) volumetric mass transfer coefficient, kLa and (c) kLa/εG. Variation with superficial gas velocity, UG for water, tetradecane,
paraffin oil A, paraffin oil B and Tellus oil systems in the 0.1-m-diameter column.
For UG exceeding about 0.10 m/s, i.e, the well and truly heterogeneous regime, kLa/εG is virtually independent of UG. The resulting plateau values are indicated by thick horizontal lines in Fig 2.6(c). One interpretation of the constancy of kLa/εG is that the effective bubble diameter becomes independent of gas velocity in the heterogeneous flow regime. This constancy of the effective bubble diameter can be rationalized only if account it taken of the fact that the frequent coalescence and breakup of large bubbles causes the effective bubble diameter to be maintained at a low, constant, value; this conclusion was reached by De Swart et al.18 on the basis of video imaging experiments carried out in a 2D slurry bubble column.
29
Chapter 2 Gas Holdup and Mass Transfer in Bubble Columns
m0.3 m
(a)
Figure 2.7: Air bubbles rising in Tellus oil in the 0.38-m-diameter velocity of (a) UG = 0.002 m/s and (b) UG =
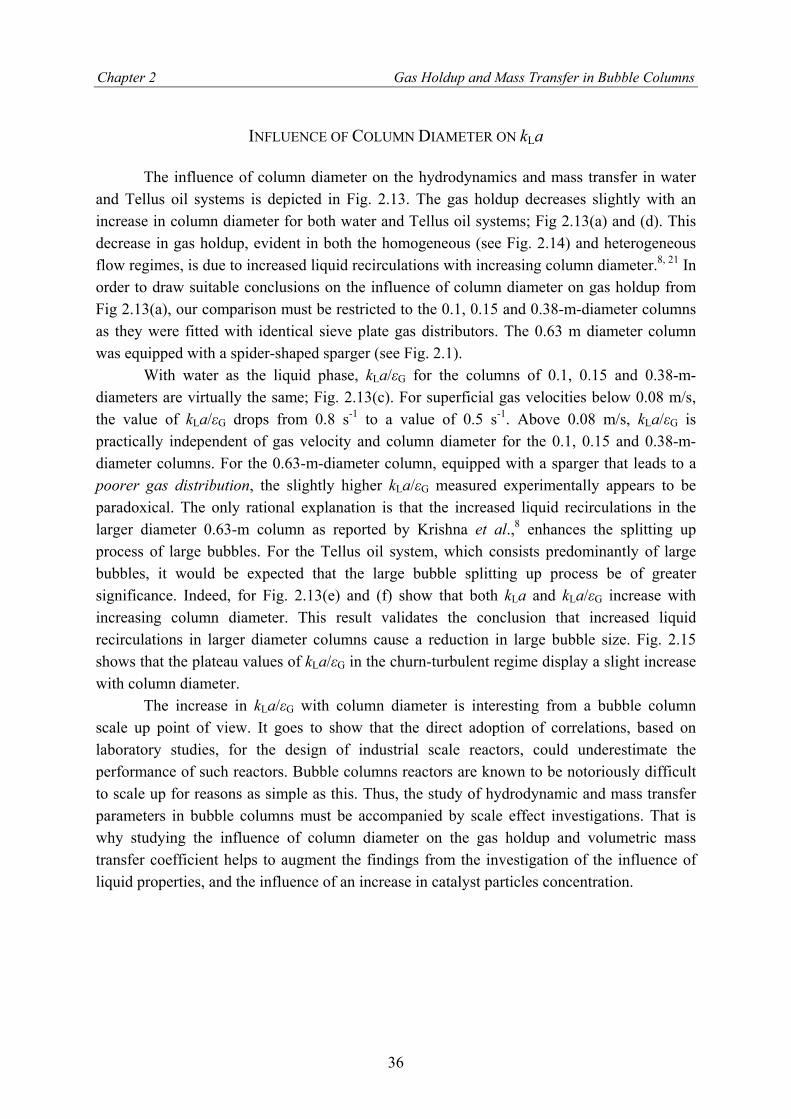
The plateau values of kLa/εG show a dependence on thSc = µL/(ρL ÐL), following Sc-1/3, as shown in Fig. 2.8. Theboundary layer mass transfer theories for the liquid sideVermeer and Krishna19 were the first to point out theheterogeneous flow regime, based on studies in a 0.19-m-nitrogen as the gas phase and turpentine 5 as the liquid phasekLa/εG computations. Here, it is clearly shown that the paplateau kLa/εG depends on the properties of the gas and liquidSchmidt number.
Liquid phase Schmidt num
102 103 104
(kLa
/εG) /
[s-1
]
0.01
0.1
1
Sc-1/3 dependenceWaterTetradecaneParaffin oil AParaffin oil BTeulls oil
DT = 0.1 m
Figure 2.8: Influence of liquid phase Schmidt number, Sc on the pl
turbulent flow regime.
30
0.3
(b)
bubble column at a superficial gas 0.007 m/s.
e liquid phase Schmidt number, Sc-1/3 dependence is typical of mass transfer coefficient, kL. constancy of kLa/εG in the diameter bubble column, with
, and employing tracer gases for rticular value assumed by the phases in question, through the
ber
105
ateau values of kLa/εG in the churn-

Chapter 2 Gas Holdup and Mass Transfer in Bubble Columns
INFLUENCE OF INCREASED SLURRY CONCENTRATION ON kLa
Fig. 2.9 summarizes the gas holdup and mass transfer data for water and tetradecane
slurries, with silica particles as the solid phase, measured in the 0.1-m-diameter column. Addition of silica catalyst particles tends to reduce the gas holdup to a significant extent, as shown in Fig. 2.9(a) and (d). These results are consistent with the studies of the gas holdup in paraffin slurries reported by Krishna et al.7 In both water-silica and tetradecane-silica slurry systems, the homogeneous regime of operation is virtually non-existent for high slurry concentrations. Increasing the silica catalyst particle concentration causes a significant reduction in the kLa and kLa/εG values (see Fig. 2.9(b), (c), (e) and (f)). The plateau values of kLa/εG are plotted in Fig. 2.10 for water-silica and tetradecane-silica slurry systems. The strong decrease in kLa/εG with increasing εS must be attributed to an increase in the size of fast-rising large bubbles in the churn-turbulent regime. It also appears that the bubble size for water-silica slurries is larger than for tetradecane-silica slurries.
Results obtained from studies with ethanol as the liquid phase, and passivated Raney cobalt particles as the solid phase, in the 0.051-m-diameter bubble column, are shown in Fig. 2.11. Though the superficial gas velocity in these studies only covered a span of 0 to 0.12 m/s, homogeneous and heterogeneous flow regimes were adequately captured. Due to the small diameter of the bubble column employed in these investigations (DT = 0.051 m), operating at higher velocities would have resulted in the highly undesirable slug flow. Gas holdup decreases with an increase in slurry concentration, similar to what was observed with water-silica and tetradecane-silica slurry systems. The sharp maximum observed in the gas holdup curve with no solid particles present, is indicative of regime transition from homogeneous to heterogeneous flow. The effect of solids concentration on kLa is similar to the trend observed for gas holdup – increased solids concentration leads to a lowering in the value of kLa. Above a superficial gas velocity, UG = 0.04 m/s, a constancy in the value of kLa/εG is observed. This constancy of kLa/εG appears to be independent of slurry concentration within the narrow εS range investigated, differing from the findings in the tetradecane-silica slurry system where a clear decrease in kLa/εG was observed when the silica particles concentration was increased from εS = 0 to εS = 0.045.
Fig. 2.12 depicts variations in the total gas holdup, volumetric mass transfer coefficient and kLa/εG for the predominantly C9-C11 paraffin oil B and tetradecane slurry systems, with alumina employed as the solid phase. Gas holdup data presented for paraffin oil B when εS = 0 are for the heterogeneous flow regime (homogeneous and transition regime data have been omitted. They can however be viewed in Fig. 2.6(a)). Interestingly, one observes that kLa shows virtually no dependence on εS for the paraffin oil B-alumina slurry system (Fig. 2.12(b)), with the exception of εS = 0.25, for which an increase in kLa is observed. For tetradecane-alumina slurries, kLa decreases with an increase in εS as seen in Fig. 2.12(e), though the data for εS = 0.15 and εS = 0.25 seem to overlap. The lack of dependence of kLa on εS for paraffin oil B-alumina system stands in contradiction to the findings presented earlier for water-silica, tetradecane-silica and ethanol-Raney cobalt slurry
31

Chapter 2 Gas Holdup and Mass Transfer in Bubble Columns
systems. However, in other published studies on the influence of slurry concentrations on kLa, a variety of trends have been discerned.
Superficial gas velocity, UG /[m/s]
0.0 0.1 0.2 0.3 0.4
Tota
l gas
hol
dup,
εG /[
-]
0.0
0.1
0.2
0.3
0.4
εs = 0
εs = 0.136
εs = 0.213
(a)
Comparison of gas holdupWater-silica slurries
DT = 0.1 m
Superficial gas velocity, UG /[m/s]
0.0 0.1 0.2 0.3 0.4
k La
/[s-1
]
0.00
0.04
0.08
0.12
0.16
(b)
Comparison of kLa
εS= 0
εS= 0.136
εS= 0.213
Water-silica slurriesDT = 0.1 m
Superficial gas velocity, UG /[m/s]
0.0 0.1 0.2 0.3 0.4
(kLa
/εG) /
[s-1
]
0.0
0.2
0.4
0.6
0.8
(c)
Comparison of kLa/εG
εS= 0.136
εS= 0.213
εS= 0
Water-silica slurriesDT = 0.1 m
Superficial gas velocity, UG /[m/s]
0.0 0.1 0.2 0.3 0.4
Tota
l gas
hol
dup,
εG /[
-]
0.00
0.05
0.10
0.15
0.20
0.25
0.30
0.35
0.40
0.45
εs = 0
εs = 0.045
εs = 0.15
εs = 0.25
(d)
Comparison of gas holdupTetradecane-silica slurries
DT = 0.1 m
Superficial gas velocity, UG /[m/s]
0.0 0.1 0.2 0.3 0.4
k La /[
s-1]
0.00
0.05
0.10
0.15
0.20
(e)
Comparison of kLa
εS= 0 εS= 0.045
εS= 0.15
εS= 0.25
Tetradecane-silica slurriesDT = 0.1 m
Superficial gas velocity, UG /[m/s]
0.0 0.1 0.2 0.3 0.4
(kLa
/εG) /
[s-1
]
0.0
0.1
0.2
0.3
0.4
0.5
0.6
(f)
Comparison of kLa/εG
εS= 0
εS= 0.045εS= 0.15
εS= 0.25
Tetradecane-silica slurriesDT = 0.1 m
Figure 2.9: Influence of slurry concentration on gas holdup and mass transfer in water (a-c) and tetradecane (d-f) slurry systems, in the 0.1-m-diameter column. Silica particles were used as the solid
phase.
32

Chapter 2 Gas Holdup and Mass Transfer in Bubble Columns
Volume fraction of catalyst in the liquid phase, εS /[-]
0.00 0.05 0.10 0.15 0.20 0.25
(kLa
/εG) /
[s-1
]
0.0
0.1
0.2
0.3
0.4
0.5
0.6
Water-silica slurryTetradecane-silica slurry
DT = 0.1 m
Figure 2.10: Influence of slurry concentration on the plateau values of kLa/εG in the churn-turbulent flow regime for water-silica and tetradecane-silica slurry systems.
In a 0.14-m-diameter bubble column for air-water system, with glass beads as the solid phase, Shah et al.20 showed that kLa decreases with an increase in solids concentration. With hexane and iron oxides catalyst, as well as C10-C16 oil and glass beads as the liquid and solid phases, it was shown by Behkish et al.12 that kLa generally decreases with an increase in slurry concentration, in a 0.316-m-diameter bubble column. Furthermore, these investigators observed that in the hexane-iron oxides catalyst system, kLa increased with slurry concentration in going from εS = 0 to εS = 0.038, but then decreased with a further increase in catalyst concentration above this value. Thus, while a decrease in kLa with increasing εS had previously been observed, though at much lower gas velocities than were used in this study, the same is not the case for an increase in kLa with increasing εS up to a value of 0.25. Based on these observations, it must be concluded that the nature of the solid particles, and the liquid phase are important determinants on the variation of kLa with εS. It is also clear that the correlation proposed by Behkish et al.12 will not be successful in describing the kLa data for paraffin oil B-alumina system because this correlation anticipates a decrease in kLa with increasing εS.
For superficial gas velocities, UG > 0.1 m/s, the value of kLa/εG is found to be practically independent of UG and has values in the range of 0.36 to 0.55 s-1, for the paraffin oil B-alumina slurry system. Even so, kLa/εG increases with an increase in εS. This is however not the case for tetradecane-alumina slurry system where, even though a degree of scatter is observed for the experimental data, kLa/εG generally appears to decrease with an increase in εS. This buttresses the earlier conclusion that the nature of the solid-liquid system in question largely dictates observable trends in both kLa and kLa/εG as the superficial gas velocity is increased.
33

Chapter 2 Gas Holdup and Mass Transfer in Bubble Columns
Superficial gas velocity, UG /[m/s]
0.00 0.02 0.04 0.06 0.08 0.10 0.12
k La
/[s-1
]
0.00
0.02
0.04
0.06
0.08
0.10
0.12
0.14
εs =0
εs=0.01
εs=0.038
Superficial gas velocity, UG /[m/s]
0.00 0.02 0.04 0.06 0.08 0.10 0.12
(kLa
/εG) /
[s-1
]
0.0
0.2
0.4
0.6
0.8
1.0
εs=0
εs=0.01
εs=0.038
Superficial gas velocity, UG /[m/s]
0.00 0.02 0.04 0.06 0.08 0.10 0.12
Tota
l gas
hol
dup,
εG /[
-]
0.00
0.05
0.10
0.15
0.20
0.25
εs=0
εs=0.01
εs=0.038
(a) (b)
(c)
Comparison of gas holdup Comparison of kLa
Comparison of kLa/εG
Ethanol-Raney cobaltDT = 0.051 m
Ethanol-Raney cobaltDT = 0.051 m
Ethanol-Raney cobaltDT = 0.051 m
Figure 2.11: Influence of slurry concentration on gas holdup and volumetric mass transfer coefficient for ethanol-Raney cobalt slurry system, in the 0.051-m-diameter bubble column.
34

Chapter 2 Gas Holdup and Mass Transfer in Bubble Columns
Superficial gas velocity, UG /[m/s]
0.0 0.1 0.2 0.3 0.4
Tota
l gas
hol
dup,
εG /[
-]
0.00
0.05
0.10
0.15
0.20
0.25
0.30
0.35
0.40
0.45
(a)
Paraffin oil B-alumina slurriesDT = 0.1 m
εS=0
εS=0.05εS=0.10
εS=0.15εS=0.2
εS=0.25
Comparison of gas holdup
Superficial gas velocity, UG /[m/s]
0.0 0.1 0.2 0.3 0.4
k La
/[s-1
]
0.00
0.05
0.10
0.15
0.20
(b)
εS=0
εS=0.05εS=0.10
εS=0.15εS=0.2
εS=0.25
Paraffin oil B-alumina slurriesDT = 0.1 m
Comparison of kLa
Superficial gas velocity, UG /[m/s]
0.1 0.2 0.3 0.4
(kLa
/εG
) /[s
-1]
0.0
0.2
0.4
0.6
(c)
εs= 0 εs= 0.05
εs= 0.1
εs= 0.15
εs= 0.2
εs= 0.25
Paraffin oil B-alumina slurriesDT = 0.1 m
Comparison of kLa/εG
Superficial gas velocity, UG /[m/s]
0.0 0.1 0.2 0.3 0.4
Tota
l gas
hol
dup,
εG /[
-]
0.00
0.05
0.10
0.15
0.20
0.25
0.30
0.35
0.40
0.45
(d)
Tetradecane-alumina slurriesDT = 0.1 m
Comparison of gas holdup
εS=0
εS=0.047
εS=0.15
εS=0.25
(e)
Comparison of kLa
Superficial gas velocity, UG /[m/s]
0.1 0.2 0.3 0.4
(kLa
/εG
) /[s
-1]
0.0
0.2
0.4
0.6
(f)
Comparison of kLa/εG
Tetradecane-alumina slurriesDT = 0.1 m
εs=0
εs=0.047
εs=0.15
εs=0.25
Superficial gas velocity, UG /[m/s]
0.0 0.1 0.2 0.3 0.4
k La
/ [s-1
]
0.00
0.05
0.10
0.15
0.20
0.25εs=0
εs=0.047
εs=0.15
εs=0.25
Tetradecane-alumina slurriesDT = 0.1 m
Figure 2.12: Influence of slurry concentration on gas holdup and mass transfer in paraffin oil B (a-c) and tetradecane (d-f) systems in the 0.1-m-diameter column. Alumina particles were used as the solid
phase.
35
Chapter 2 Gas Holdup and Mass Transfer in Bubble Columns
INFLUENCE OF COLUMN DIAMETER ON kLa
The influence of column diameter on the hydrodynamics and mass transfer in water
and Tellus oil systems is depicted in Fig. 2.13. The gas holdup decreases slightly with an increase in column diameter for both water and Tellus oil systems; Fig 2.13(a) and (d). This decrease in gas holdup, evident in both the homogeneous (see Fig. 2.14) and heterogeneous flow regimes, is due to increased liquid recirculations with increasing column diameter.8, 21 In order to draw suitable conclusions on the influence of column diameter on gas holdup from Fig 2.13(a), our comparison must be restricted to the 0.1, 0.15 and 0.38-m-diameter columns as they were fitted with identical sieve plate gas distributors. The 0.63 m diameter column was equipped with a spider-shaped sparger (see Fig. 2.1).
With water as the liquid phase, kLa/εG for the columns of 0.1, 0.15 and 0.38-m-diameters are virtually the same; Fig. 2.13(c). For superficial gas velocities below 0.08 m/s, the value of kLa/εG drops from 0.8 s-1 to a value of 0.5 s-1. Above 0.08 m/s, kLa/εG is practically independent of gas velocity and column diameter for the 0.1, 0.15 and 0.38-m-diameter columns. For the 0.63-m-diameter column, equipped with a sparger that leads to a poorer gas distribution, the slightly higher kLa/εG measured experimentally appears to be paradoxical. The only rational explanation is that the increased liquid recirculations in the larger diameter 0.63-m column as reported by Krishna et al.,8 enhances the splitting up process of large bubbles. For the Tellus oil system, which consists predominantly of large bubbles, it would be expected that the large bubble splitting up process be of greater significance. Indeed, for Fig. 2.13(e) and (f) show that both kLa and kLa/εG increase with increasing column diameter. This result validates the conclusion that increased liquid recirculations in larger diameter columns cause a reduction in large bubble size. Fig. 2.15 shows that the plateau values of kLa/εG in the churn-turbulent regime display a slight increase with column diameter.
The increase in kLa/εG with column diameter is interesting from a bubble column scale up point of view. It goes to show that the direct adoption of correlations, based on laboratory studies, for the design of industrial scale reactors, could underestimate the performance of such reactors. Bubble columns reactors are known to be notoriously difficult to scale up for reasons as simple as this. Thus, the study of hydrodynamic and mass transfer parameters in bubble columns must be accompanied by scale effect investigations. That is why studying the influence of column diameter on the gas holdup and volumetric mass transfer coefficient helps to augment the findings from the investigation of the influence of liquid properties, and the influence of an increase in catalyst particles concentration.
36

Chapter 2 Gas Holdup and Mass Transfer in Bubble Columns
Superficial gas velocity, UG /[m/s]
0.0 0.1 0.2 0.3 0.4
Tota
l gas
hol
dup,
εG /[
-]
0.0
0.1
0.2
0.3
0.4
DT = 0.1 mDT = 0.15 mDT = 0.38 mDT = 0.63 m
(a)
Comparison of gas holdup
Air-water
Superficial gas velocity, UG /[m/s]
0.0 0.1 0.2 0.3 0.4
k La
/[s-1
]
0.00
0.05
0.10
0.15
DT = 0.1 mDT = 0.15 mDT = 0.38 mDT = 0.63 m
(b)
Comparison of kLa
Air-water
Superficial gas velocity, UG /[m/s]
0.0 0.1 0.2 0.3 0.4
(kLa
/εG) /
[s-1
]
0.0
0.2
0.4
0.6
0.8
DT = 0.1 mDT = 0.15 mDT = 0.38 mDT = 0.63 m
(c)
Comparison of kLa/εG
Air-water
Superficial gas velocity, UG /[m/s]
0.0 0.1 0.2 0.3 0.4
Tota
l gas
hol
dup,
εG /[
-]
0.0
0.1
0.2
0.3
DT = 0.1 mDT = 0.38 m
Comparison of gas holdup
(d)
Air-Tellus oil
Superficial gas velocity, UG /[m/s]
0.0 0.1 0.2 0.3 0.4
k La
/[s-1
]
0.000
0.005
0.010
0.015
0.020
0.025
DT = 0.1 mDT = 0.38 m
Comparison of kLa
Air-Tellus oil
(e)
Superficial gas velocity, UG /[m/s]
0.0 0.1 0.2 0.3 0.4
(kLa
/εG) /
[s-1
]
0.00
0.02
0.04
0.06
0.08
0.10
DT = 0.1 mDT = 0.38 m
Comparison of kLa/εG
Air-Tellus oil
(f)
Figure 2.13: Influence of column diameter on gas holdup and mass transfer in water (a-c) and Tellus oil (d-f) systems.
37

Chapter 2 Gas Holdup and Mass Transfer in Bubble Columns
Superficial gas velocity, UG /[m/s]
0.00 0.01 0.02
Tota
l gas
hol
dup,
εG /[
-]
0.00
0.02
0.04
0.06
0.08
0.10DT = 0.1 mDT = 0.15 mDT = 0.38 m
Comparsion of gas holdup
Air-water
Figure 2.14: Focus on the gas holdup values obtained for air-water system in the 0.1, 0.15 and 0.38-m-diameter columns, at low superficial gas velocities.
Column diameter, DT /[m]
0.0 0.2 0.4 0.6
(kLa
/εG) /
[s-1
]
0.01
0.1
1
WaterTellus oil
Figure 2.15: Influence of column diameter on the plateau values of kLa/εG in the churn-turbulent regime.
38

Chapter 2 Gas Holdup and Mass Transfer in Bubble Columns
2.5 CONCLUSIONS
In this chapter, results obtained from studies of the gas holdup and volumetric mass
transfer coefficient, in bubble columns of various sizes have been presented. Based on the discussions given, the following major conclusions can be drawn:
(1) For all pure liquid systems investigated: water, tetradecane, paraffin oil A,
paraffin oil B and Tellus oil, the volumetric mass transfer coefficient per unit volume of dispersed gas bubbles, kLa/εG is practically independent of the superficial gas velocity in the churn-turbulent regime, i.e., UG > 0.1 m/s. Furthermore, kLa/εG for these liquids, in the churn-turbulent regime shows a Sc-1/3 dependence where Sc is the liquid phase Schmidt number.
(2) The behavior of kLa/εG for slurry systems appears to vary from one system to another. It was discovered that for water-silica, tetradecane-silica and tetradecane-alumina slurry systems, kLa/εG values are significantly reduced by an increase in solids concentration, pointing to larger bubble sizes caused by enhanced coalescence promotion due to the presence of solids. The converse was however the case for paraffin oil B-alumina slurry system, where kLa/εG was observed to increase with an increase in solid particles concentration in the slurry. The most rational conclusion that can be drawn from this is that the nature of the liquid and solid particles used, largely determines the observable trends in kLa and kLa/εG as the gas velocity is increased.
(3) A slight but distinct increase in kLa/εG with column diameter was observed. This is caused by enhanced bubble splitting due to liquid recirculations, which increase sharply with increased column diameter.
The key to successful scale up of slurry bubble column reactors is the estimation of the gas holdup. The kLa values in the churn-turbulent regime can then be estimated by introducing appropriate corrections for the liquid phase properties, via the Schmidt number, and slurry concentrations.
NOTATION a gas-liquid interfacial area per unit dispersion volume, m2/m3
aL gas-liquid interfacial area per unit liquid volume, m2/m3 CL oxygen concentration in the liquid phase, arbitrary units CL
* saturation concentration of oxygen in the liquid, arbitrary units Csensor liquid phase oxygen concentration given by the sensor, arbitrary units ÐL diffusivity of oxygen in the liquid phase, m2/s DT column diameter, m fS volume fraction of catalyst that is (non-porous) skeleton, dimensionless H dispersion height in the column, m
39

Chapter 2 Gas Holdup and Mass Transfer in Bubble Columns
H0 height of the ungassed column, m kL liquid side mass transfer coefficient, m/s ksensor sensor time constant, s-1
t time, s UG superficial gas velocity, m/s Greek Symbols εG total gas holdup, dimensionless εS solids holdup, dimensionless µL liquid viscosity, Pa s ρL liquid density, kg/m3
σ surface tension, N/m Dimensionless Groups Sc liquid phase Schmidt number, µL/(ρL ÐL)
BIBLIOGRAPHY (1) Krishna, R.; van Baten, J. M.; Urseanu, M. I.; Ellenberger, J. Design and scale up of a bubble column slurry reactor for Fischer-Tropsch synthesis. Chemical Engineering Science 2001, 56, 537-545. (2) Krishna, R. A scale-up strategy for a commercial scale bubble column slurry reactor for Fischer-Tropsch synthesis. Oil & Gas Science and Technology-Revue De L Institut Francais Du Petrole 2000, 55, 359-393. (3) Maretto, C.; Krishna, R. Modelling of a bubble column slurry reactor for Fischer-Tropsch synthesis. Catalysis Today 1999, 52, 279-289. (4) Krishna, R.; Ellenberger, J.; Hennephof, D. E. Analogous description of the hydrodynamics of gas-solid fluidized-beds and bubble-columns. Chemical Engineering Journal 1993, 53, 89-101. (5) Ellenberger, J.; Krishna, R. A unified approach to the scale-up of gas-solid fluidized bed and gas-liquid bubble column reactors. Chemical Engineering Science 1994, 49, 5391-5411. (6) Krishna, R.; Ellenberger, J. Gas holdup in bubble column reactors operating in the churn- turbulent flow regime. American Institute of Chemical Engineers Journal 1996, 42, 2627-2634. (7) Krishna, R.; de Swart, J. W. A.; Ellenberger, J.; Martina, G. B.; Maretto, C. Gas holdup in slurry bubble columns: effect of column diameter and slurry concentrations. American Institute of Chemical Engineers Journal 1997, 43, 311-316.
40
Chapter 2 Gas Holdup and Mass Transfer in Bubble Columns
(8) Krishna, R.; Urseanu, M. I.; van Baten, J. M.; Ellenberger, J. Influence of scale on the hydrodynamics of bubble columns operating in the churn-turbulent regime: experiments vs. Eulerian simulations. Chemical Engineering Science 1999, 54, 4903-4911. (9) Krishna, R.; Urseanu, M. I.; van Baten, J. M.; Ellenberger, J. Liquid phase dispersion in bubble columns operating in the churn-turbulent flow regime. Chemical Engineering Journal 2000, 78, 43-51. (10) Urseanu, M. I. Scaling up bubble column reactors. PhD Thesis. University of Amsterdam, Amsterdam, The Netherlands, 2000. (11) Inga, J. R.; Morsi, B. I. Effect of operating variables on the gas holdup in a large- scale slurry bubble column reactor operating with an organic liquid mixture. Industrial & Engineering Chemistry Research 1999, 38, 928-937. (12) Behkish, A.; Men, Z. W.; Inga, J. R.; Morsi, B. I. Mass transfer characteristics in a large-scale slurry bubble column reactor with organic liquid mixtures. Chemical Engineering Science 2002, 57, 3307-3324. (13) Poling, B. E.; Prausnitz, J. M.; O'Connell, J. P., The Properties of Gases and Liquids, McGraw-Hill, New York, 2001. (14) Erkey, C.; Rodden, J. B.; Akgerman, A. A correlation for predicting diffusion coefficients in alkanes. Canadian Journal of Chemical Engineering 1990, 68, 661-665. (15) Marano, J. J.; Holder, G. D. Prediction of bulk properties of Fischer-Tropsch derived liquids. Industrial & Engineering Chemistry Research 1997, 36, 2409-2420. (16) Vandu, C. O.; Ellenberger, J.; Krishna, R. Slurry bubble column research, University of Amsterdam, Available at URL http://ct-cr4.chem.uva.nl/BubbleColumnExpt/, accessed August 2003. (17) Krishna, R.; Urseanu, M. I.; de Swart, J. W. A.; Ellenberger, J. Gas hold-up in bubble columns: operation with concentrated slurries versus high viscosity liquid. Canadian Journal of Chemical Engineering 2000, 78, 442-448. (18) De Swart, J. W. A.; van Vliet, R. E.; Krishna, R. Size, structure and dynamics of ''large'' bubbles in a two- dimensional slurry bubble column. Chemical Engineering Science 1996, 51, 4619-4629. (19) Vermeer, D. J.; Krishna, R. Hydrodynamics and mass transfer in bubble columns in operating in the churn-turbulent regime. Industrial & Engineering Chemistry Process Design and Development 1981, 20, 475-482. (20) Shah, Y. T.; Kelkar, B. G.; Godbole, S. P.; Deckwer, W.-D. Design parameters estimations for bubble column reactors. American Institute of Chemical Engineers Journal 1982, 28, 353-379. (21) Krishna, R.; van Baten, J. M.; Urseanu, M. I. Scale effects on the hydrodynamics of bubble columns operating in the homogeneous flow regime. Chemical Engineering & Technology 2001, 24, 451-458.
41


Chapter 3 Large Bubble Sizes and Rise Velocities in a Bubble Column Slurry Reactor
Chapter 3
LARGE BUBBLE SIZES AND RISE VELOCITIES IN A BUBBLE COLUMN SLURRY REACTOR
3.1 INTRODUCTION
In industrial applications, bubble column slurry reactors are often operated in the churn-turbulent regime, characterized by high superficial gas velocities, UG and a wide range of bubble sizes. One such industrial application is the Fischer-Tropsch synthesis, for which there is currently a great deal of academic and industrial interest, in the context of the conversion of remote natural gas to liquid transportation fuels. It is now widely accepted that the bubble column slurry reactor is the best choice of reactor type for large-scale plants, with capacities in the order of 40,000 bbl/day of liquid hydrocarbon product.1-5 The superficial gas velocity in the Fischer-Tropsch bubble column reactor is in the range of 0.1-0.4 m/s, depending on the catalyst activity and the catalyst concentration in the slurry phase.6 For high reactor productivities, the highest slurry concentrations consistent with catalyst handling should be used. In practice, the volume fraction of catalyst particles in the slurry phase, εS, is of the order of 0.15-0.3.6, 7 At these high slurry concentrations, the gas dispersion consists predominantly of fast-rising “large” bubbles.8 The economic success of the Fischer-Tropsch process largely depends on the ability to achieve high synthesis gas conversions, say exceeding 95 %. Reliable design of the reactor to achieve such high conversion levels, requires reasonably accurate information on the total gas holdup, εG and volumetric mass transfer coefficient, kLa. These two parameters were investigated in the previous chapter.
For the determination of the gas holdup, it is important to have a good estimate of the rise velocity of the large bubbles, VLb. To determine the volumetric mass transfer coefficient, good estimates of large bubble sizes are required. A number of correlations are available in the literature for the estimation of the gas holdup and volumetric mass transfer coefficient in bubble columns.9-12 However, none of these published correlations can be applied with confidence for such estimations. The major objective of the study presented in this chapter is to gain insight into the hydrodynamics of bubble columns operating at gas velocities and slurry concentrations relevant to the Fischer-Tropsch synthesis. In particular, the emphasis is on the size and rise velocity of large bubbles, and video imaging techniques, used to obtain the desired data by means of a “rectangular” bubble column. A predominantly C9-C11 n-paraffin oil fraction and fine alumina catalyst carrier particles were utilized as the liquid and solid phases, respectively. The effects of slurry concentration and superficial gas velocity on gas holdup, bubble diameter and bubble rise velocity were investigated, for superficial gas velocities ranging to 0.2 m/s. Utilizing transition gas holdup, εtrans and transition gas velocity, Utrans data obtained from the rectangular bubble column, the ability of correlations developed
43

Chapter 3 Large Bubble Sizes and Rise Velocities in a Bubble Column Slurry Reactor
by Krishna et al.13 to predict the total gas holdup in a slurry bubble column will be tested. And finally, the significance of all this to gas-liquid mass transfer will be discussed.
The use of two-dimensional (2D) bubble columns in the study of bubble rise characteristics is well known. These columns typically have depths less than 0.005 m. With such narrow depths, results obtained from 2D columns are hardly indicative of what goes on in cylindrical bubble columns, such as those discussed in the previous chapter. The volume for bubble flow in the 2D column is very constrained (as a result of its narrow width) and gives rise to bubbles that are so different from those encountered in cylindrical columns. To overcome this problem, a “rectangular” bubble column was used. This column was essence a wide-depth 2D column, in which bubbles were freer to move, less constrained by the column depth. In such situation, bubble motion, rise characteristics, size and gas-liquid flow regimes are comparable to those obtained in a cylindrical bubble column, provided that similar gas distributors are employed in both columns.
3.2 EXPERIMENTAL SETUP AND PROCEDURE
Experiments were conducted in a 0.95-m-high rectangular bubble column of 0.1-m-width and 0.02-m-depth, shown schematically in Fig. 3.1. The bubble column was fabricated from glass and had a perforated brass plate gas distributor with holes of 0.5 mm arranged on a triangular pitch of 7 mm, yielding a total of 43 holes. Gas was fed into the column with a pre-calibrated Sho-Rate Brooks rotameter and evaporating liquid was safely vented from the top of the column.
An image recording and analysis system was used to obtain and process data from the experimental runs. The image recording system consisted of a Photron Fastcam-ultima 40K high-speed video camera, connected to a 512 MB-memory box and a video monitor display. The high-speed camera had the capability of capturing video movies at rates of between 30 and 4,500 frames per second (fps) in full-frame mode and 90 to 40,500 fps in segmented-frame mode. It was positioned in front of the rectangular bubble column such that it captured a 0.28-m-wide and 0.28-m-high window. The base of this capture window was 0.22 m from the bottom of column (see Fig. 3.1), high enough to ensure that bubble flow was satisfactorily developed and uninfluenced by gas distributor effects. Lighting was provided by a single Dedotec dedocool 250 W Halogen Photo Optic Lamp. This lamp had the unique property of providing sufficient illumination without increasing the ambient temperature. Video movies captured by the high-speed camera were instantaneously stored in the memory box. The video monitor showed in real time what was viewed through the high-speed camera. Data from the memory box were transferred to a personal computer (PC) for later analysis.
Air was employed as the gas phase in all experiments carried out, with paraffin oil B, a predominantly C9-C11 n-paraffin oil cut, used as the liquid phase. Sasol PURALOX ScCa 5/170, an alumina-based catalyst particle carrier was employed as the solid phase, with the slurry concentration, εS varied in the range of 0, 0.05, 0.1, 0.15, 0.2 and 0.25. As in the previous chapter, slurry concentration is defined as the volume fraction of solids in gas-free
44

Chapter 3 Large Bubble Sizes and Rise Velocities in a Bubble Column Slurry Reactor
slurry, with the pore volume of the catalyst particles, liquid filled during experiments, counted as part of the solid phase. The properties of paraffin oil B and the alumina particles utilized are available in Tables 2.2 and 2.3 of the previous chapter, respectively. The properties of paraffin oil B and the catalyst utilized correspond closely to those encountered in the Fischer-Tropsch reactor under reaction conditions. At the start of each experimental run, the clear liquid or slurry height, H0 was set at 0.5 m (for εS = 0 and εS = 0.05 experiments) or 0.55 m (for εS = 0.1, 0.15, 0.2, 0.25 experiments).
flowmeter
to vent
high-speed video camera
memory box
video monitor
PC
0.95 m
0.28 m
0.22 m
gas in
0.02 m
0.1m graduated rule
Figure 3.1: Rectangular slurry bubble column experimental setup.
Gas holdup was determined by visual measurements. For each experimental run, the gas flow rate was adjusted, with sufficient time given for steady state to be reached in the column, after which the increase in dispersion height was recorded. The total gas holdup, εG is defined as:
0G
H HH
ε −= (3.1)
45
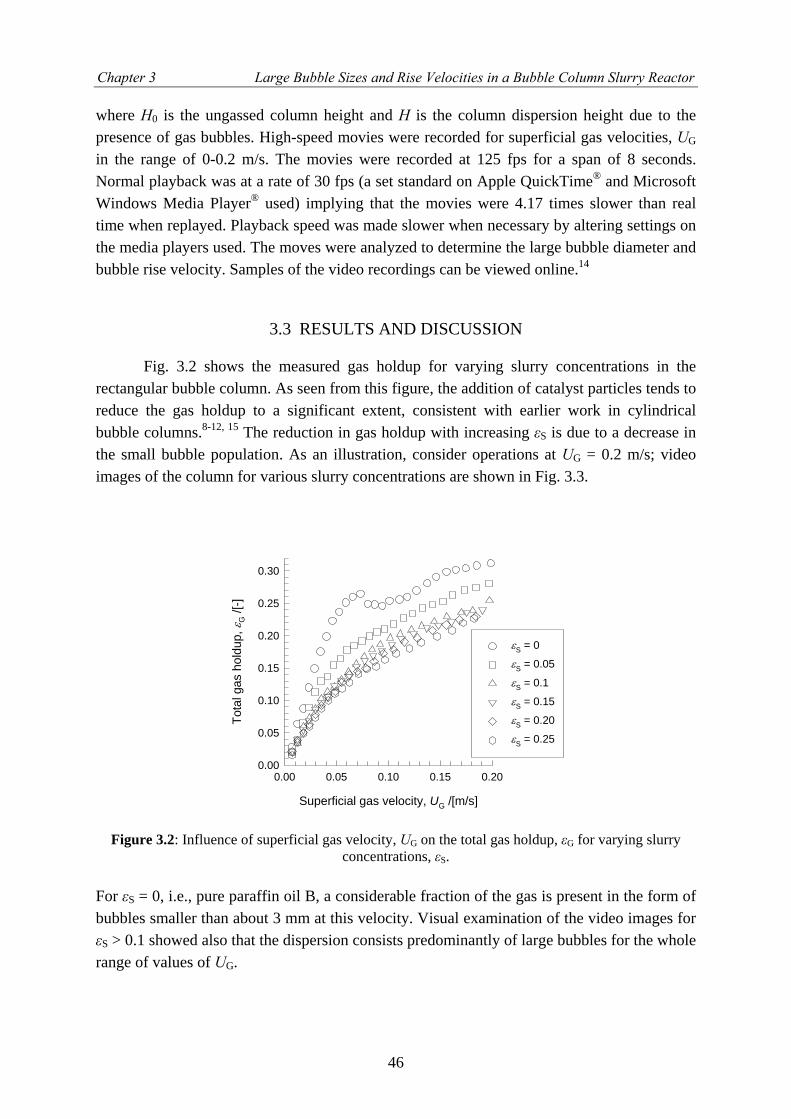
Chapter 3 Large Bubble Sizes and Rise Velocities in a Bubble Column Slurry Reactor
where H0 is the ungassed column height and H is the column dispersion height due to the presence of gas bubbles. High-speed movies were recorded for superficial gas velocities, UG in the range of 0-0.2 m/s. The movies were recorded at 125 fps for a span of 8 seconds. Normal playback was at a rate of 30 fps (a set standard on Apple QuickTime® and Microsoft Windows Media Player® used) implying that the movies were 4.17 times slower than real time when replayed. Playback speed was made slower when necessary by altering settings on the media players used. The moves were analyzed to determine the large bubble diameter and bubble rise velocity. Samples of the video recordings can be viewed online.14
3.3 RESULTS AND DISCUSSION
Fig. 3.2 shows the measured gas holdup for varying slurry concentrations in the rectangular bubble column. As seen from this figure, the addition of catalyst particles tends to reduce the gas holdup to a significant extent, consistent with earlier work in cylindrical bubble columns.8-12, 15 The reduction in gas holdup with increasing εS is due to a decrease in the small bubble population. As an illustration, consider operations at UG = 0.2 m/s; video images of the column for various slurry concentrations are shown in Fig. 3.3.
Superficial gas velocity, UG /[m/s]
0.00 0.05 0.10 0.15 0.20
Tota
l gas
hol
dup,
εG /[
-]
0.00
0.05
0.10
0.15
0.20
0.25
0.30
εS = 0
εS = 0.05
εS = 0.1
εS = 0.15
εS = 0.20
εS = 0.25
Figure 3.2: Influence of superficial gas velocity, UG on the total gas holdup, εG for varying slurry concentrations, εS.
For εS = 0, i.e., pure paraffin oil B, a considerable fraction of the gas is present in the form of bubbles smaller than about 3 mm at this velocity. Visual examination of the video images for εS > 0.1 showed also that the dispersion consists predominantly of large bubbles for the whole range of values of UG.
46

Chapter 3 Large Bubble Sizes and Rise Velocities in a Bubble Column Slurry Reactor
εS = 0 εS = 0.15εS = 0.1εS = 0.05 εS = 0.25εS = 0.20
Figure 3.3: Video images obtained from the rectangular bubble column operating at UG = 0.2 m/s, at various slurry concentrations, showing the traced large bubbles after appropriate thresholding.
The transition gas velocity, Utrans, i.e., the superficial gas velocity at which the first “large” bubble makes its appearance, was determined by examining the video images, frame-by-frame, of the column operation at different gas velocities. The data on Utrans as a function of εS is shown in Fig. 3.4. With an increase in slurry concentration, the “window” of operation of the column in the homogeneous regime becomes progressively narrower. The corresponding gas holdup at the transition point from homogeneous to heterogeneous flow, otherwise known as the regime transition point, εtrans was obtained from the gas holdup data, and the values are shown in Fig. 3.5. The increase in viscosity of the slurry phase with an increase in slurry concentration results in a lowering of εtrans, as small bubbles coalesce more often to form large bubbles in more viscous systems.
Solids volume fraction in oil, εS /[-]
0.00 0.05 0.10 0.15 0.20 0.25
Tran
sitio
n ga
s ve
loci
ty, U
trans
/[m
/s]
0.00
0.02
0.04
0.06
0.08
From frame-by-frameanalysis of video
recordings
Figure 3.4: Influence of slurry concentration, εS on superficial gas velocity at regime transition, Utrans.
47
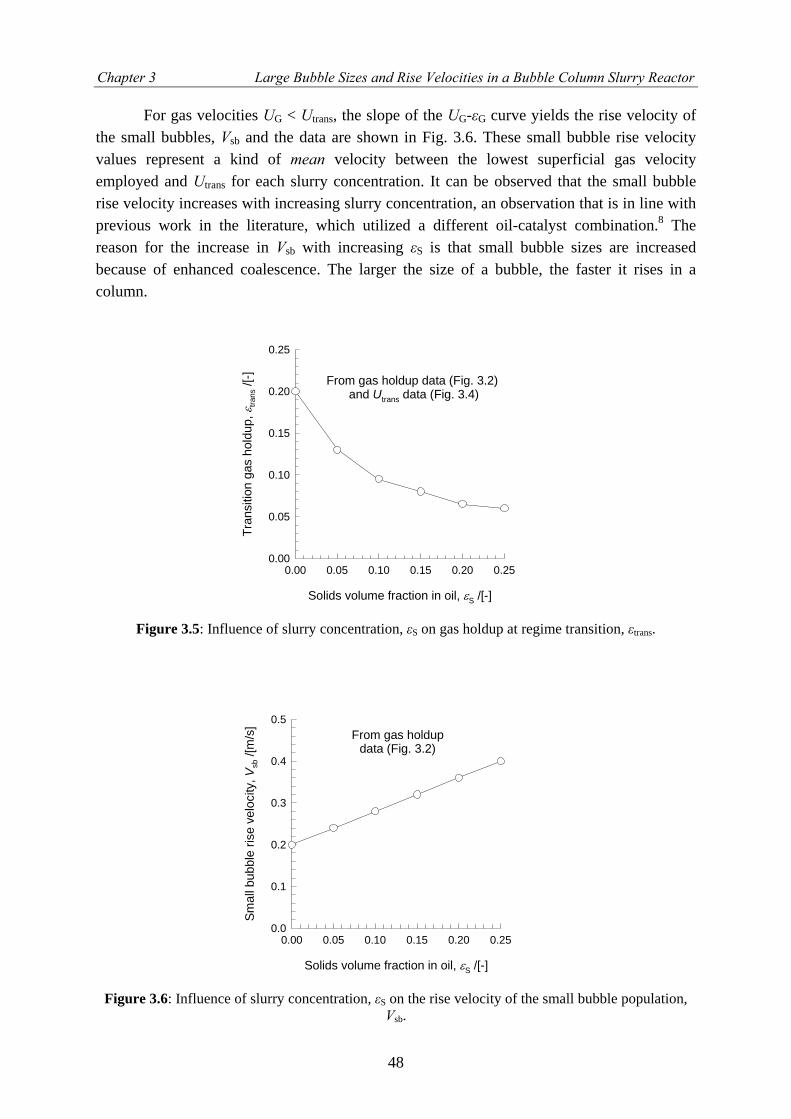
Chapter 3 Large Bubble Sizes and Rise Velocities in a Bubble Column Slurry Reactor
For gas velocities UG < Utrans, the slope of the UG-εG curve yields the rise velocity of the small bubbles, Vsb and the data are shown in Fig. 3.6. These small bubble rise velocity values represent a kind of mean velocity between the lowest superficial gas velocity employed and Utrans for each slurry concentration. It can be observed that the small bubble rise velocity increases with increasing slurry concentration, an observation that is in line with previous work in the literature, which utilized a different oil-catalyst combination.8 The reason for the increase in Vsb with increasing εS is that small bubble sizes are increased because of enhanced coalescence. The larger the size of a bubble, the faster it rises in a column.
Solids volume fraction in oil, εS /[-]
0.00 0.05 0.10 0.15 0.20 0.25
Tran
sitio
n ga
s ho
ldup
, εtra
ns /[
-]
0.00
0.05
0.10
0.15
0.20
0.25
From gas holdup data (Fig. 3.2) and Utrans data (Fig. 3.4)
Figure 3.5: Influence of slurry concentration, εS on gas holdup at regime transition, εtrans.
Solids volume fraction in oil, εS /[-]
0.00 0.05 0.10 0.15 0.20 0.25
Smal
l bub
ble
rise
velo
city
, Vsb
/[m
/s]
0.0
0.1
0.2
0.3
0.4
0.5From gas holdup
data (Fig. 3.2)
Figure 3.6: Influence of slurry concentration, εS on the rise velocity of the small bubble population, Vsb.
48

Chapter 3 Large Bubble Sizes and Rise Velocities in a Bubble Column Slurry Reactor
Attention now focuses on the large bubbles. For each run, a total of ten large bubbles were selected at random, from hundreds of frames available from the movie recordings, and these had their areas computed. This was done by first making bitmap images of the particular movie frames containing the bubbles to be analyzed. Each image was then uploaded into the technical computing and programming software, MATLAB®. Utilizing certain MATLAB® image processing functions, which were coded in a program developed, the bubble image was traced out with a mouse and the area of the resulting polygon determined. Fig. 3.3 shows typical images after the large bubble areas had been identified and traced. From the projection areas, ALb thus determined, the equivalent large bubble diameter, dLb was calculated from:
LbLb
4Adπ
= (3.2)
The bubble diameters thus calculated are shown in Fig. 3.7(a)-(e) as a function of the
superficial gas velocity for various slurry concentrations. The error bars represent the standard deviations of the bubble size determinations for the ten bubbles selected. Though these bubble sizes were obtained from the rectangular bubble column, they give a pretty good indication of actual bubble sizes in a cylindrical column. More so, the fact that similar gas distributors were employed in both the rectangular column shown in Fig. 3.1 and the 0.1-m-diameter cylindrical bubble column described in the previous chapter, allows for a comparison of results from both columns. Fig. 3.8 shows such a comparison, for the total gas holdup in both columns as a function of the superficial gas velocity, at four different slurry concentrations, εS = 0, 0.05, 0.1 and 0.25. The very good correlation obtained for the gas holdup data, especially in the heterogeneous flow regime, indicates that the effective bubble sizes were the same in both columns. This allows for bubble size data obtained from the rectangular column to be used in the 0.1-m-diameter cylindrical column in studying mass transfer phenomena.
From Fig. 3.7(a)-(e), it is noted that for εS > 0.05 and UG > 0.1 m/s, the dLb values show only a weak dependence on UG. It is also noted that the bubble sizes for εS > 0.05 are practically independent of the slurry concentrations. The weak dependence of dLb on the superficial gas velocity when UG > 0.1 m/s, provides an explanation for the constancy of kLa/εG at a given slurry concentration, as observed in the 0.1-m-diameter cylindrical column in chapter 2, for paraffin oil B-alumina system. The experimentally determined dLb values shown in Fig. 3.7 are also in agreement with the empirical correlation of Krishna et al.13 developed for the highly viscous Tellus oil (viscosity of µL = 75 mPa s), indicated by the continuous lines in Fig. 3.7(a)-(e):
( 0.376Lb G trans0.069d U U= − ) (3.3)
49

Chapter 3 Large Bubble Sizes and Rise Velocities in a Bubble Column Slurry Reactor
The equivalence in the hydrodynamics of bubble columns operating with Tellus oil and concentrated paraffin oil slurries has been demonstrated in the literature.16
(a)
Superficial gas velocity, UG /[m/s]
0.00 0.05 0.10 0.15 0.20Equi
vale
nt d
iam
eter
of l
arge
bub
ble,
dLb
/[m
]
0.00
0.01
0.02
0.03
0.04
0.05
0.06 5 % slurry
Eq. (3.3)
Superficial gas velocity, UG /[m/s]
0.00 0.05 0.10 0.15 0.20Equi
vale
nt d
iam
eter
of l
arge
bub
ble,
dLb
/[m
]
0.00
0.01
0.02
0.03
0.04
0.05
0.06 10 % slurry
Eq. (3.3)
(c)
Superficial gas velocity, UG /[m/s]
0.00 0.05 0.10 0.15 0.20Equi
vale
nt d
iam
eter
of l
arge
bub
ble,
dLb
/[m
]
0.00
0.01
0.02
0.03
0.04
0.05
0.06 15 % slurry
Eq. (3.3)
(b)
(d)
Superficial gas velocity, UG /[m/s]
0.00 0.05 0.10 0.15 0.20Equ
ival
ent d
iam
eter
of l
arge
bub
ble,
dLb
/[m
]
0.00
0.01
0.02
0.03
0.04
0.05
0.06 20 % slurry
Eq. (3.3)
(e)
Superficial gas velocity, UG /[m/s]
0.00 0.05 0.10 0.15 0.20Equi
vale
nt d
iam
eter
of l
arge
bub
ble,
dLb
/[m
]
0.00
0.01
0.02
0.03
0.04
0.05
0.0625 % slurry
Eq. (3.3)
Superficial gas velocity, UG /[m/s]
0.00 0.05 0.10 0.15 0.20
Larg
e bu
bble
rise
vel
ocity
, VLb
/ [m
/s]
0.0
0.4
0.8
1.2
εs = 0.05
εs = 0.10
εs = 0.15
εs = 0.20
εs = 0.25
(f)
Eqs. (3.3,3.4,3.5,3.6)
Figure 3.7: Large bubble diameters, dLb for slurry concentrations εS = (a) 0.05 (b) 0.1 (c) 0.15 (d) 0.2 (e) 0.25. (f) Large bubble rise velocity, VLb as a function of UG for various slurry concentrations, εS.
50

Chapter 3 Large Bubble Sizes and Rise Velocities in a Bubble Column Slurry Reactor
Superficial gas velocity, UG /[m/s]
0.0 0.1 0.2 0.3 0.4
Tota
l gas
hol
dup,
εG /[
-]
0.00
0.05
0.10
0.15
0.20
0.25
0.30
0.35
0.40εS = 0
εS = 0.05εS = 0.1εS = 0.25
White shapes = rectangular bubble columnGray shapes = 0.1-m-diameter cylindrical bubble column
Figure 3.8: Total gas holdup, εG as a function of superficial gas velocity, UG in the 0.02-m-deep rectangular bubble column and the 0.1-m-diameter cylindrical bubble column.
The large bubble rise velocity, VLb was determined from the high-speed movies made, by registering the time required for a large bubble to rise the 0.28-m height of the projection window. Each VLb reported is the average of five values taken, and the results are plotted in Fig. 3.7(f) as a function of the superficial gas velocity, for various slurry concentrations. The large bubble rise velocities are in excellent agreement with the extended Davies-Taylor relationship:
( )( )Lb Lb0.71V gd SF= AF (3.4) suggested by Krishna et al.,13 wherein the scale correction factor, SF is defined as:
1SF = for Lb T/ < 0.125;d D
Lb T1.13exp( / )SF d D= − for (3.5) Lb T0.125 / 0.6;d D< <
T Lb0.496 /SF D d= for Lb T/ 0d D > .6
)
and the acceleration factor, AF (also for Tellus oil) is:
( G trans2.25 4.09AF U U= + − (3.6) The acceleration is due to wake interactions, and this factor increases as the distance between the large bubbles decreases. More information on the scale correction factor and the acceleration factor is available in the literature.17 From the knowledge of the large bubble
51

Chapter 3 Large Bubble Sizes and Rise Velocities in a Bubble Column Slurry Reactor
sizes and rise velocities, it is now possible to estimate the total gas holdup, εG for a bubble column slurry reactor in both the homogeneous and heterogeneous flow regimes. In the homogeneous flow regime,
GG G
sb
; < U U UV
ε = trans (3.7)
whereas in the heterogeneous flow regime, assuming two bubble classes, “small” and “large”, the following gas holdup model13 can be used:
( ) ( )G trans G transG Lb sb trans G trans
Lb Lb
1 ; U U U U
U UV V
ε ε ε ε⎡ ⎤− −
= + = + −⎢ ⎥⎣ ⎦
> (3.8)
where εLb and εsb represent the gas holdups for the large and small bubble populations, respectively.
Based on the discussion presented with regard to Fig. 3.8, in which the total gas holdup values in the rectangular bubble column and the cylindrical 0.1-m-diameter column were shown to be similar for paraffin oil B-alumina system, an attempt would now be made to predict the total gas holdup in both columns, by the application of Eqs. (3.3)-(3.8). The required transition gas velocity, Utrans, transition gas holdup, εtrans and small bubble rise velocity, Vsb data are obtained from the rectangular bubble column experiments; these values are plotted in Figs. 3.4-3.6. Gas holdup data for the 0.1-m-diameter column with paraffin oil B as the liquid phase and alumina particles as the solid phase have been presented in the previous chapter (see Fig 2.12(a)). Fig 3.9(a)-(f) shows plots of the experimentally determined gas holdup in the 0.1-m-diameter cylindrical bubble column as a function of superficial gas velocity. Experimental gas holdup data for the rectangular bubble column are also included in these plots. Shown as continuous lines are the predicted gas holdup values by the use of the model equations given by Eqs. (3.3)-(3.8). The agreement between the experimental and model gas holdup for paraffin oil B-alumina system is very good indeed and provides justification for the two-bubble class approach in describing gas holdup.
Fig. 3.9 shows that gas holdup data for Tellus oil obtained in the same 0.1-m-diameter column, agrees very well with the data for paraffin oil B slurries, with catalyst concentrations in excess of 10 %. This hydrodynamic equivalence also extends to tetradecane-silica slurry systems. Fig. 3.10 compares the hydrodynamics and mass transfer of Tellus oil with that of a 25-vol % tetradecane slurry system in the 0.1-m-diameter bubble column (from experiments described in chapter 2). The gas holdups of both systems show an almost identical variation with the superficial gas velocity. As with the paraffin oil B-alumina slurry system, this points to identical bubble sizes and bubble rise velocities.
52

Chapter 3 Large Bubble Sizes and Rise Velocities in a Bubble Column Slurry Reactor
(a)
Superficial gas velocity, UG /[m/s]
0.0 0.1 0.2 0.3 0.4
Tota
l gas
hol
dup,
εG /[
-]
0.0
0.1
0.2
0.3
0.4
Eqs. (3.3)-(3.8)0 % slurry
(c)
(b)
(d)
(e) (f)
Paraffin oil B-alumina
Superficial gas velocity, UG /[m/s]
0.0 0.1 0.2 0.3 0.4
Tota
l gas
hol
dup,
εG /[
-]
0.0
0.1
0.2
0.3
0.4
Eqs. (3.3)-(3.8)5 % slurry
Paraffin oil B-alumina
Superficial gas velocity, UG /[m/s]
0.0 0.1 0.2 0.3 0.4
Tota
l gas
hol
dup,
εG /[
-]
0.0
0.1
0.2
0.3
0.4
Tellus oilEqs. (3.3)-(3.8)10 % slurry
Paraffin oil B-alumina
Superficial gas velocity, UG /[m/s]
0.0 0.1 0.2 0.3 0.4
Tota
l gas
hol
dup,
εG /[
-]
0.0
0.1
0.2
0.3
0.4
Tellus oilEqs. (3.3)-(3.8)15 % slurry
Paraffin oil B-alumina
Superficial gas velocity, UG /[m/s]
0.0 0.1 0.2 0.3 0.4
Tota
l gas
hol
dup,
εG /[
-]
0.0
0.1
0.2
0.3
0.4
Tellus oilEqs. (3.3)-(3.8)20 % slurry
Paraffin oil B-alumina
Superficial gas velocity, UG /[m/s]
0.0 0.1 0.2 0.3 0.4
Tota
l gas
hol
dup,
εG /[
-]
0.0
0.1
0.2
0.3
0.4
Tellus oilEqs. (3.3)-(3.8)25 % slurry
Paraffin oil B-alumina
Figure 3.9: Influence of superficial gas velocity, UG on gas holdup, εG for slurry concentrations, εS = 0, 0.05, 0.1, 0.15, 0.2 and 0.25, with paraffin oil B as the liquid phase and alumina particles as the solid phase, in the 0.1-m-diameter column. Also included are experimental gas holdup data for the
rectangular bubble column. Tellus oil gas holdup data (denoted by cross-hairs) in the 0.1-m-diameter column are also shown.
53

Chapter 3 Large Bubble Sizes and Rise Velocities in a Bubble Column Slurry Reactor
(a)
Superficial gas velocity, UG /[m/s]
0.0 0.1 0.2 0.3 0.4
Tota
l gas
hol
dup,
εG /[
-]
0.0
0.1
0.2
0.3
0.4
25 % Tetradecane slurryTellus oil
(c)
Tetradecane-silica and Tellus oilDT = 0.1 m
Superficial gas velocity, UG /[m/s]
0.0 0.1 0.2 0.3 0.4
k La
/[s-1
]
0.00
0.02
0.04
0.06
0.08
0.10Tetradecane-silica and Tellus oil
DT = 0.1 m
Superficial gas velocity, UG /[m/s]
0.0 0.1 0.2 0.3 0.4
k La/ε G
/[s-1
]
0.0
0.1
0.2
0.3
25 % Tetradecane slurryTellus oil
Tetradecane-silica and Tellus oilDT = 0.1 m
Comparison of gas holdup Comparison of kLa
Comparison of kLa/εG
Figure 3.10: Comparison of the hydrodynamics and mass transfer in 25-vol % tetradecane slurry and Tellus oil systems.
Interestingly however, a comparison of the volumetric mass transfer coefficient, kLa and kLa/εG reveals a significantly lower kLa and plateau value of kLa/εG for Tellus oil than for the 25-vol % tetradecane slurry system. This lower value is attributed to the liquid phase properties. Thus, while Tellus oil is adequately able to capture the hydrodynamics of paraffin oil slurry, the mass transfer behavior of the slurry remains largely dictated by the liquid phase properties than by bubble size. In other words, the higher diffusivity of oxygen into the tetradecane slurry phase than into Tellus oil, accounts for its higher kLa and kLa/εG values, as seen in Fig. 3.10.
The use of Eq. (3.3) to predict the large bubble diameter helps provide some insight into mass transfer in the heterogeneous flow regime. For this, use is made of the data from the paraffin oil B-alumina system presented in Fig 2.12 of chapter 2. With the bubble diameter estimated with Eq. (3.3), the large bubbles interfacial area can be calculated from:
54

Chapter 3 Large Bubble Sizes and Rise Velocities in a Bubble Column Slurry Reactor
GLb
Lb
6adε
= (3.9)
and the mass transfer coefficient, kL back calculated from the volumetric mass transfer coefficient, kLa, noting that in the heterogeneous flow regime, the bulk of gas-liquid mass transfer occurs from the large bubbles making aLb≈a. The kL values for large bubbles are practically independent of the superficial gas velocity, seemingly showing a slight increase with UG, and have values in the range of 0.002-0.004 m/s.; see Fig. 3.11. These kL values are about one order of magnitude higher than that estimated from literature correlations.9, 10
Superficial gas velocity, UG /[m/s]
0.1 0.2 0.3 0.4
"Lar
ge" b
ubbl
e m
ass
trans
fer c
oeffi
cien
t, k L
/[m
/s]
10-4
10-3
10-2
10-1
Paraffin oil B-aluminaDT = 0.1 m
εs = 0εs = 0.05
εs = 0.1
εs = 0.15
εs = 0.2
εs = 0.25
Figure 3.11: Influence of superficial gas velocity, UG on the large bubble mass transfer coefficient, kL, for slurry concentrations, εS = 0, 0.05, 0.1, 0.15, 0.2 and 0.25, with paraffin oil B as the liquid phase
and alumina particles as the solid phase in the 0.1-m-diameter bubble column.
These high mass transfer coefficient values can be attributed to the frequent breakup and coalescence phenomena demonstrated by De Swart et al.18 Thus, the paradoxically high kL values obtained in the churn-turbulent regime can be attributed to the fact that large bubbles continuously breakup and coalesce as they rise up in a bubble column. This makes kL values in the churn-turbulent regime estimated from classical mass transfer models, such as the penetration model, much lower than what obtains in reality. The churn-turbulent regime should therefore be the preferred regime for operating slurry bubble columns for mass transfer limited reactions, as the highest mass transfer rates are obtained in this regime. When consideration is taken of the fact that both εG and kLa/εG show only slight dependence on column diameter in the churn-turbulent regime, as demonstrated in the previous chapter, the results presented in Fig. 3.11 can be employed in scaling up slurry bubble column reactors for a wide range of processes.
55

Chapter 3 Large Bubble Sizes and Rise Velocities in a Bubble Column Slurry Reactor
3.4 CONCLUSIONS
Large bubble sizes and rise velocities in a rectangular bubble column using paraffin
oil B and alumina catalyst particles as the liquid and solid phases have been investigated in this chapter. Both paraffin oil B and the alumina particles have properties similar to the liquid and solid phases encountered in the Fischer-Tropsch gas-to-liquids process, under industrial operating conditions. The results obtained from the rectangular column were used to gain further insight into previous studies in a 0.1-m-diameter cylindrical bubble column. From the studies carried out and discussions presented, the following conclusions are hereby drawn:
(1) The total gas holdup, εG is significantly reduced when the concentration of catalyst particles is increased, based on studies in the 0.02-m-deep rectangular bubble column and 0.1-m-diameter cylindrical bubble column. This reduction in total gas holdup is primarily due to a reduction in the gas holdup of the small bubble population. Also, both the transition gas holdup, εtrans and transition gas velocity, Utrans are reduced by an increase in slurry concentration, from studies in the rectangular bubble column. These reductions are more pronounced at lower solid holdups, evening out as εS is increased.
(2) From studies in both the rectangular and cylindrical bubble columns, the effect of εS on total gas holdup becomes diminished as slurry concentration increases. For εS = 0.15, 0.2 and 0.25 in the rectangular bubble column, only a slight change in εG is observed. This in effect means that the window of operation of a slurry bubble column is made considerably narrower when the slurry concentration is increased.
(3) Video imaging in the rectangular bubble column showed that the large bubble diameter, dLb is practically independent of the superficial gas velocity, UG for εS > 0.05 and UG > 0.1 m/s. Eq. (3.3) provides a reasonably good estimate of the large bubble size.
(4) The rise velocity of large bubbles in slurries, VLb can be accurately predicted with the extended Davies-Taylor relationship (Eq. (3.4)) using the appropriate scale correction factor (Eq. (3.5)) and acceleration factor (Eq. (3.6)).
(5) The variation in the gas holdup of paraffin oil B-alumina slurry system in the 0.02-m-deep rectangular bubble column and the 0.1-m-diameter cylindrical bubble column is very well represented by the model of Krishna et al.,13 summarized in Eqs. (3.3)-(3.8). For this estimation, it is important to have reliable information on the transition gas velocity, Utrans and the corresponding gas holdup at the regime transition point, εtrans.
(6) The highly viscous Tellus oil (viscosity of µL = 75 mPa s) is adequately able to mimic the hydrodynamic behavior of slurry systems. Figs. 3.9 and 3.10 show that Tellus oil suitably predicts the gas holdup in the heterogeneous flow regime in the 0.1-m-diameter bubble column for both paraffin oil B-alumina and tetradecane-silica systems. However, for the gas-liquid mass transfer coefficient, kLa and kLa/εG, the liquid phase properties and not the gas-liquid interfacial area is dominant, accounting for the much higher values obtained in the tetradecane-alumina slurry system with εS = 0.25, than with Tellus oil.
56

Chapter 3 Large Bubble Sizes and Rise Velocities in a Bubble Column Slurry Reactor
(7) Estimates of the mass transfer coefficient, kL for large bubbles for the paraffin oil B-alumina system in the 0.1-m-diameter bubble column, result in values that are about one order of magnitude larger than those predicted on the basis of literature correlations.9, 10 This is due to frequent breakup and coalescence phenomena, observed by De Swart et al.18 Interesting also is the fact that these large bubble kL values show such a weak dependence on the superficial gas velocity in the heterogeneous flow regime, a dependence that can be ignored for practical purposes.
NOTATION a gas-liquid interfacial area per unit dispersion volume, m2/m3
aLb large bubble interfacial area per unit dispersion volume, m2/m3
ALb projected area of large bubble from video images, m2
AF acceleration factor, dimensionless dLb diameter of large bubble, m DT column diameter, m g gravitational constant, m/s2
H dispersion height in the column, m H0 height of the ungassed column, m kL liquid side mass transfer coefficient, m/s SF scale correction factor, dimensionless UG superficial gas velocity, m/s Utrans superficial gas velocity at regime transition point, m/s VLb rise velocity of large bubbles, m/s Vsb rise velocity of small bubbles, m/s Greek Symbols εG total gas holdup, dimensionless εLb gas holdup for large bubbles, dimensionless εsb gas holdup for small bubbles, dimensionless εS solids holdup, dimensionless εtrans total gas holdup at regime transition point, dimensionless µL liquid viscosity, Pa s
57

Chapter 3 Large Bubble Sizes and Rise Velocities in a Bubble Column Slurry Reactor
BIBLIOGRAPHY
(1) Eisenberg, B.; Fiato, R. A.; Kaufmann, T. G.; Bauman, R. F. The evolution of advanced gas-to-liquids technology. Chemtech 1999, 29, 32-37. (2) Espinoza, R. L.; Steynberg, A. P.; Jager, B.; Vosloo, A. C. Low temperature Fischer-Tropsch synthesis from a Sasol perspective. Applied Catalysis A 1999, 186, 13-26. (3) Davis, B. H. Overview of reactors for liquid phase Fischer-Tropsch synthesis. Catalysis Today 2002, 71, 249-300. (4) Sie, S. T.; Krishna, R. Fundamentals and selection of advanced Fischer-Tropsch reactors. Applied Catalysis A-General 1999, 186, 55-70. (5) Krishna, R.; Sie, S. T. Design and scale-up of the Fischer-Tropsch bubble column slurry reactor. Fuel Processing Technology 2000, 64, 73-105. (6) Maretto, C.; Krishna, R. Modelling of a bubble column slurry reactor for Fischer-Tropsch synthesis. Catalysis Today 1999, 52, 279-289. (7) Maretto, C.; Krishna, R. Design and optimisation of a multi-stage bubble column slurry reactor for Fischer-Tropsch synthesis. Catalysis Today 2001, 66, 241-248. (8) Krishna, R.; de Swart, J. W. A.; Ellenberger, J.; Martina, G. B.; Maretto, C. Gas holdup in slurry bubble columns: Effect of column diameter and slurry concentrations. American Institute of Chemical Engineers Journal 1997, 43, 311-316. (9) Akita, K.; Yoshida, F. Gas holdup and volumetric mass transfer coefficient in bubble columns. Effects of liquid properties. Industrial & Engineering Chemistry Process Design and Development 1973, 12, 76-80. (10) Akita, K.; Yoshida, F. Bubble size, interfacial area, and liquid-phase mass transfer coefficient in bubble columns. Industrial & Engineering Chemistry Process Design and Development 1974, 13, 84-91. (11) Inga, J. R.; Morsi, B. I. Effect of catalyst loading on gas/liquid mass transfer in a slurry reactor: A statistical experimental approach. Canadian Journal of Chemical Engineering 1997, 75, 872-881. (12) Inga, J. R.; Morsi, B. I. Effect of operating variables on the gas holdup in a large- scale slurry bubble column reactor operating with an organic liquid mixture. Industrial & Engineering Chemistry Research 1999, 38, 928-937. (13) Krishna, R.; Urseanu, M. I.; van Baten, J. M.; Ellenberger, J. Rise velocity of a swarm of large gas bubbles in liquids. Chemical Engineering Science 1999, 54, 171-183. (14) Vandu, C. O.; Koop, K.; Ellenberger, J.; Krishna, R. Hydrodynamic studies in a rectangular slurry bubble column, University of Amsterdam, Available at URL http://ct-cr4.chem.uva.nl/RectBubbleColumn/, accessed January 2004. (15) Vandu, C. O.; Krishna, R. Gas holdup and volumetric mass transfer coefficient in a slurry bubble column. Chemical Engineering & Technology 2003, 26, 779-782. (16) Krishna, R.; Urseanu, M. I.; de Swart, J. W. A.; Ellenberger, J. Gas hold-up in bubble columns: operation with concentrated slurries versus high viscosity liquid. Canadian Journal of Chemical Engineering 2000, 78, 442-448.
58

Chapter 3 Large Bubble Sizes and Rise Velocities in a Bubble Column Slurry Reactor
(17) Urseanu, M. I. Scaling up bubble column reactors. PhD Thesis. University of Amsterdam, Amsterdam, The Netherlands, 2000. (18) De Swart, J. W. A.; van Vliet, R. E.; Krishna, R. Size, structure and dynamics of ''large'' bubbles in a two- dimensional slurry bubble column. Chemical Engineering Science 1996, 51, 4619-4629.
59


Chapter 4 Hydrodynamics and Mass Transfer in an Upflow Monolith Loop Reactor
Chapter 4
HYDRODYNAMICS AND MASS TRANSFER IN AN UPFLOW MONOLITH LOOP REACTOR
4.1 INTRODUCTION
Monolith reactors are gaining considerable attention from academia and industry alike for carrying out solid-catalyzed gas-liquid reactions.1-4 The use of monolith reactors for three-phase applications is a novel phenomenon. They are however widely employed as gas-solid catalytic reactors, better known as three-way catalytic converters, in automobiles, where they help mitigate the effect of noxious gases such as carbon monoxide, nitrogen oxides and volatile organic compounds. The history of the development of monolith reactors as catalytic converters is interesting, in light of the fact that it represents a good example of a situation in which government policy on the environment helped drive technological development. In 1970, the United States Congress passed the First Clean Air Act, which required among others, severe reductions in emissions of hazardous gases from automobiles. This helped spur the development of catalytic converters, which in the early days, were fixed bed reactors. However, because catalytic converters are placed in the exhaust lines of automobiles, and often experience severe vibrations, the fixed bed reactor turned out to be a poor choice of reactor type as a result of catalyst attrition. Furthermore, particulate matter from the automobile exhaust quickly clogged the catalyst bed in the fixed bed reactor. These limitations were overcome by the development of a structured reactor with the required mechanical rigidity and durability. The “structure” in this reactor is a monolith block. Monolithic three-way catalytic converters can be found in all automobiles produced since 1994 in industrialized countries.
Being structured reactors, monolith reactors are able to overcome some of the problems faced by the more commonly employed bubble column and trickle bed reactors. For instance, since catalyst particles are firmly coated on the walls of a monolith block, difficulties associated with separating liquid products from catalyst particles as observed in bubble columns are minimized in monolith reactors. Other potential advantages monolith reactors have over trickle bed, slurry bubble column and airlift reactors include low-pressure drop, high mass transfer rates and ease of scale up.5-7 These advantages account for the increasing application of monolith reactors in laboratory studies and commercial practice for carrying out reactions such as hydrogenations,5, 8, 9 hydrodesulfurization,10 oxidations,11, 12 bioremediation13 and the Fischer-Tropsch synthesis.14, 15 The improved performance of the monolith reactor meant that it could play a significant role in the development of intensified chemical processes. Stankiewicz7 provides an example of a process for which an in-line
61

Chapter 4 Hydrodynamics and Mass Transfer in an Upflow Monolith Loop Reactor
monolith reactor is 100 times smaller in size than a conventional reactor, and therefore represents a truly intensified process.
Monolith reactors can typically be operated in the upflow mode or downflow mode. In the upflow mode of operation, gas and liquid are fed from the bottom of the monolith reactor, rising up along the reactor height. The converse is the case for the downflow mode, in which gas and liquid are fed from the top of the column. Most of the published experimental studies relate to downflow of both gas and liquid phases6, 9, 16-20 and very little information is available on the upflow operation of gas and liquid.2 In both upflow and downflow operations of monolith reactors, there needs to be a uniform distribution of gas and liquid phases through the various channels.
The first major objective of the work presented in this chapter is the study of the hydrodynamics and mass transfer in an upflow monolith loop reactor, obtaining data on the gas holdup, εG and volumetric mass transfer coefficient, kLa. The second objective is the development of the corresponding gas holdup and volumetric mass transfer coefficient data for a bubble column and an internal airlift loop reactor, using the same column geometry and gas distribution device. In this study, upflow monolith loop reactors of two different heights were employed. The data generated in this work will be helpful in choosing the right reactor type for a given process.
4.2 EXPERIMENTAL SETUP
Experimental studies were carried out in two different monolith loop reactor configurations, an airlift loop reactor and a bubble column. In addition to these, studies were carried out in a single capillary channel. The experimental details are described next.
MONOLITH LOOP REACTOR
Experiments were performed in two upflow monolith loop reactor column configurations, schematically represented in Fig. 4.1. The setup shown on the left in Fig 4.1 has a taller monolith riser section (with a height of 2.1 m) than the setup shown in the inset, which has a monolith riser of a height of 0.65 m. For convenience, these setups will be referred to as tall and short monolith reactors, respectively. Hydrodynamic and mass transfer studies were carried out in both setups. The idea of the short monolith reactor came into being due to the possibility of saturation of the upflowing liquid phase in the tall monolith reactor during mass transfer experiments (a detailed discussion on this is presented later). Each reactor comprised of an outer column, a riser column and a gas-liquid separation unit. The outer column and gas-liquid separator were constructed of polyacrylate, with the riser column fabricated from glass. The riser column was concentrically position in the outer column, with a clearance of 0.05 m. The annular space between the riser and outer columns
62

Chapter 4 Hydrodynamics and Mass Transfer in an Upflow Monolith Loop Reactor
formed the downcomer section of the reactor. The riser column, outer column and gas-liquid separator had internal diameters of 0.104, 0.15 and 0.38 m, respectively.
0.05
m
0.38 m
0.104 m
0.15 m
2.08
m
0.44
m
1.0
m
0 .05
m
0.38 m
0.104 m
0.15 m
0.10
5 m
nitrogen
tracer injection point
downcomer
outer columncordierite monolithbundleriser column
ammeter
conductivity meternitrogen
rota
met
ers
air from compressor
oxygen probe
conductivity probe
gas-liquid separator
1.0
m0.
62 m
air
PC
Figure 4.1: Experimental setup for the tall and short monolith loop reactors (the details of the latter are shown in the inset to the figure).
A monolith bundle consisting of symmetrically aligned cordierite monolith pieces (Corning GmbH, Germany) each with 48 cells per square inch (cpsi), was inserted in the riser tube of each reactor. Each monolith piece had square-shaped channels with sides of approximately 3 mm and an estimated void fraction of 67 %. In the tall reactor, the monolith bundle consisted of seven monolith pieces with a combined height of 2.05 m. The monolith bundle in the short reactor comprised of two monolith pieces with a combined height of 0.6 m. Fig. 4.2 shows a schematic representation of the monolith cross section.
Both monolith reactors had a 0.1-m-diameter, 1-mm-thick brass plate gas distributor with perforated holes of 0.5-mm-diameter, on a triangular pitch of 7 mm. Gas flow was
63

Chapter 4 Hydrodynamics and Mass Transfer in an Upflow Monolith Loop Reactor
regulated by the use of pre-calibrated rotameters (Sho-Rate Brooks Instruments BV, The Netherlands), aligned in parallel or by manually operated control valves. Further details of the monolith setups, including photographs and video recordings of the hydrodynamics are available online.21
3 mm
3 mm
10.4 cm
Figure 4.2: Schematic representation of the 48-cpsi square-channel cordierite monolith used in this study.
AIRLIFT LOOP REACTOR AND BUBBLE COLUMN REACTOR
Corresponding experimental studies were also carried out in an internal airlift loop reactor and a bubble column. The setup of the airlift loop reactor was a modification of the tall monolith loop reactor in which the glass riser column of the latter and its monolith bundle were replaced by a 0.1-m-diameter polyacrylate riser tube. Thus, like the monolith loop reactor, the airlift loop reactor comprised of an outer column, a riser column and a gas-liquid separation unit. The same gas distributor was employed in both the monolith and airlift loop reactor configurations. Photographic details as well as video recordings on the hydrodynamics of the airlift loop reactor setup are available online.22
The bubble column, with an internal diameter of 0.15 m and a height of 4 m was made of polyacrylate. It however had a 0.15-m-diameter, 1-mm-thick brass plate gas distributor, with perforated holes 5 mm in diameter on a 7 mm triangular pitch. Pressure taps, used in the determination of gas holdup, were installed along the height of the bubble column. Two of these taps were connected to pressure ports on a Validyne DP15 pressure
64

Chapter 4 Hydrodynamics and Mass Transfer in an Upflow Monolith Loop Reactor
transducer, which was in turn coupled to a personal computer (PC) via an analog-to-digital (AD) converter system made up of the pressure transducer, a voltmeter and an analog-to-digital converter card on the PC. A schematic representation of the bubble column experimental setup is given in Fig. 2.1 of chapter 2. Further details such as photographs and video recordings of the bubble column hydrodynamics are available online.23
Table 4.1 gives a summary of the principal dimensions of the four reactors employed in this study.
Table 4.1: Dimensions of the reactor configurations employed
Height of riser column (m)
Inner diameter of riser column (m)
Outer diameter of riser column (m)
Inner diameter of outer column (m)
Height of monolith segments (m)
Tall monolith loop: square- channel
2.1 0.104 0.111 0.15
2.05
Short monolith loop: square- channel
0.65 0.104 0.111 0.15
0.6
Airlift loop reactor 2.1 0.1 0.11 0.15 -
Bubble column reactor - - - 0.15 -
SINGLE CAPILLARY EXPERIMENTS
The channels of the monolith blocks employed in the experiments carried out can be viewed as a combination of square-shaped capillaries, with gas and liquid flowing upward independently in each capillary. Therefore, in order to gain further understanding on the gas-liquid flow, experiments were performed in an upflow single capillary setup. A schematic description of this setup is shown in Fig. 4.3. As seen from this figure, the setup consists of (1) a vertically mounted 3-mm-diameter, 1.4-m-high square capillary made of glass and (2) an image recording and analysis system. Gas and liquid were fed to the bottom of the capillary through a 3-mm-diameter polyvinyl chloride (PVC) tee-junction connection. Compressed air was fed through a pre-calibrated gas flowmeter to the tee-junction. Two manually operated control valves were used to regulate the gas flow rate. The first of these valves was placed between the compressed air flow line and the flowmeter, and was set to give a constant gauge pressure of 30 kPa. The second valve, placed between the gas flowmeter and the tee, was solely used to regulate the volumetric gas flow rate into the capillary. Liquid was fed from an elevated 10-L storage vessel into a pre-calibrated liquid flowmeter with the flow rate also adjusted by the use of a manually operated valve. Gravity provided the driving force for the flow of liquid from the storage vessel into the liquid
65

Chapter 4 Hydrodynamics and Mass Transfer in an Upflow Monolith Loop Reactor
flowmeter. This flow arrangement provided for an independent alteration of the gas and liquid flow rates. Liquid was discharged from the capillary into a 33-m-wide, 40-mm-high disengagement zone at the top of the capillary.
The image recording system consisted of a Photron Fastcam-ultima 40K high-speed video camera, a memory box and a CRT monitor display. Video movies captured by the high-speed camera were instantaneously stored in the memory box. The high-speed camera can typically be set to capture movies at rates of between 30 and 4,500 frames per second (fps) in full-frame mode. Through the CRT video monitor display, what was viewed through the high-speed camera could be seen in real time. Data from the memory box were transferred to the PC for later analysis.
gas flowmeter
liquid flowmeter
high-speed camera
memory box
CRT display
PC
gas in liquid in
capillary
disengagementzone
tee-junctioncontrol valvecontrol valve
gas bubble
1.4
m40
mm
33 mm
control valve
Fig. 4.3: Schematic representation of the setup used in carrying out single capillary experiments.
66

Chapter 4 Hydrodynamics and Mass Transfer in an Upflow Monolith Loop Reactor
4.3 EXPERIMENTAL PROCEDURE
Air was used as the gas phase and demineralized water as the liquid phase in all
experiments carried out. Measurements were made of the gas holdup, εG and volumetric mass transfer coefficient, kLa in each of the reactor configurations studied. Downcomer liquid velocity, ULD measurements were also made in the monolith and airlift loop reactors. At the start of each experimental run, the liquid height was set at 0.105 m in the gas-liquid separator of the short monolith loop reactor and 0.44 m in the gas-liquid separator of the tall monolith and airlift loop reactors. The liquid height in the bubble column was set at 1.6 m. The monolith and airlift loop reactors were operated in such a way that gas bubbles leaving the gas distributor traversed the riser and disengaged at the gas-liquid separator without entering the downcomer. This meant that the downcomer sections of these reactors were left free for liquid recirculation. Gas-liquid hydrodynamic experiments were carried out in the upflow single capillary setup.
GAS HOLDUP MEASUREMENTS
Gas holdup measurements were made in the risers of the monolith and airlift loop reactors. In both the tall and short monolith loop reactors, the riser gas holdup was measured by trapping gas from the monolith channels into a measuring cylinder 6.3 cm in diameter and 1 m in height; see Fig. 4.4(a). To achieve this, a hollow cylindrical metal rod with an inner diameter of 4 mm was fixed through a base plate consisting of a 9-mm-thick rubber pad glued underneath a 4-mm-thick plastic plate. The base plate had a diameter of 16 cm. The cylindrical metal rod was connected to the measuring cylinder via a manually operated ‘release’ valve. Before the start of each holdup experiment, the measuring cylinder was filled with demineralized water by opening the suction valve located at its top and activating a venturi pump to which this suction valve was connected.
Both the measuring cylinder and hollow metal rod were vertically positioned in the gas-liquid separator using a system of clamps. The base plate of the hollow metal rod was also pre-positioned about 15 cm above the monolith riser tube. At the moment the gas flow into the column was shut, the hollow metal rod was instantaneously displaced so that the rubber pad on its base plate rested on the riser tube. In this way, gas bubbles were trapped in the monolith channels of the riser. By opening the release valve, the trapped bubbles were transferred to the measuring cylinder. Based on the volume of trapped gas, the riser gas holdup was determined. The gas holdup experiments were done in duplicate, and found to be consistent. Average values are reported.
The gas holdup in the riser section of the airlift loop reactor was measured by sealing the top of its riser column with a pre-calibrated plastic stopper the moment gas flow into the column was shut; see Fig. 4.4(b). In this way, gas was trapped in the riser. The height of the trapped gas was read using a graduated rule affixed on the riser tube, from which the volume
67

Chapter 4 Hydrodynamics and Mass Transfer in an Upflow Monolith Loop Reactor
of gas and thus, the gas holdup were determined. For each gas flow rate in the airlift loop reactor, the gas holdup experiments were done twice with the mean holdup value presented.
monolithgas bubbles
calibrated measuring cylinder
suction valve (closed)
release valve (closed)
release valve (opened) gas from monolith bundle discharges into measuring cylinder
hollow metal rod clamp system
plastic plate
rubber pad
1 m
gas bubbles
calibrated plastic stopper
metal rod
trapped gas
plastic stopper seals top of riser tube as gas flow is shut
clamp system
(a)
(b)
Figure 4.4: Schematic representation of the procedures for determining the riser gas holdup in (a) the monolith loop reactors and (b) the airlift loop reactor.
Gas holdup values in the bubble column were obtained by a pressure difference method. For each gas flow rate, sufficient time was given for steady state to be reached after which the increase in liquid pressure at the higher of two pressure taps used was recorded. This increase occurred due to the presence of gas bubbles in the column, causing the upward displacement of liquid. The measured pressure signals, obtained in the form of voltage readings were interpreted to obtain information on the gas holdups.
68

Chapter 4 Hydrodynamics and Mass Transfer in an Upflow Monolith Loop Reactor
DOWNCOMER LIQUID VELOCITY MEASUREMENTS
Liquid velocity measurements were carried out in the downcomers of the monolith
and airlift loop reactors. To do this, a pulse injection of a tracer was made just beneath the top of the downcomer, at a height of 0.54 m above the base of the short monolith reactor and 2.04 m above the base of the tall monolith and airlift reactors. Detection of the tracer was done using a conductivity probe placed at a height, Htracer = 0.46 m and 1.99 m below in the short monolith and tall monolith/airlift setups, respectively. The tracer used was saturated NaCl solution and between 0.3 and 0.5 mL was injected depending on the setup and experimental operating conditions. The conductivity probe used consisted of two copper wires, which were connected to a conductivity meter (Consort K920) and a PC. The tracer concentration detected by the conductivity probe was reflected as a voltage reading on the conductivity meter. Typical response curves are shown in Fig. 4.5(a)-(c) for the monolith and airlift loop reactors at three superficial gas velocities.
Time /[s]
0 5 10 15 20 25
Nor
mal
ized
vol
tage
read
ing
/[-]
0.0
0.2
0.4
0.6
0.8
1.0
0.025 m/s0.058 m/s0.114 m/s
Tall monolith
Time /[s]
0 1 2 3 4 5 6
Nor
mal
ized
vol
tage
read
ing
/[-]
0.0
0.2
0.4
0.6
0.8
1.0
0.027 m/s0.063 m/s0.121 m/s
Short monolith
Time /[s]
0 2 4 6 8
Nor
mal
ized
vol
tage
read
ing
/[-]
0.0
0.2
0.4
0.6
0.8
1.0
0.024 m/s0.062 m/s0.11 m/s
Airlift
(a) (b)
(c)
Figure 4.5: Response data to tracer pulse input for specified superficial gas velocities, UG in the (a) tall monolith loop reactor, (b) short monolith loop reactor and (c) airlift reactor.
69

Chapter 4 Hydrodynamics and Mass Transfer in an Upflow Monolith Loop Reactor
Time zero on the plots shown in Fig. 4.5 corresponds to the exact moment at which tracer injection occurred. For a given superficial gas velocity, UG, the liquid mean residence time, τL was obtained from the response curve using the relationship:
( )
( )0
L
0
d
d
tV t t
V t tτ
∞
∞=∫
∫ (4.1)
where V(t) is the voltage reading as a function of time. The mean liquid velocity in the downcomer, ULD was then calculated from:
tracerLD
L
HUτ
= (4.2)
For each gas velocity, three liquid velocity measurements were carried out with the average ULD values reported.
VOLUMETRIC MASS TRANSFER COEFFICIENT MEASUREMENTS
The volumetric mass transfer coefficient, kLa was determined by means of a dynamic oxygen absorption technique, described in section 2.3 of chapter 2. A Yellow Springs Incorporated Model 5331 oxygen electrode was used to measure the change in dissolved oxygen concentration. The electrode was inserted 0.27 m above the base of the short monolith loop reactor and 0.35 m above the base of the tall monolith and airlift loop reactors. It was inserted 0.05 m above the base of the bubble column. The actual measuring point in the monolith and airlift loop reactors was in their downcomer sections (refer to Fig. 4.1). Readings from the electrode were fed to a PC through an ammeter and an AD card. The change in dissolved oxygen concentration was reflected as a change in electrical current on the ammeter. The electrode only came in contact with the liquid phase in both the monolith and airlift loop reactors (recall that they were operated in such a way that no gas bubbles were present in their downcomer sections) while in the bubble column, it encountered both the liquid phase and rising gas bubbles. Since the electrode is only able to detect the presence of dissolved oxygen, the continuous presence of a gas bubble on its tip yields a null reading. However, gas bubbles in the bubble column were in constant motion and the sampling frequency for oxygen absorption data from the electrode was set at 5 Hz in all experiments carried out. This frequency was low enough to ensure that the oxygen electrode gave no null readings when placed in the bubble column, but also high enough to ensure that a continuous oxygen response curve was obtained from which the mass transfer coefficient could be estimated.
70

Chapter 4 Hydrodynamics and Mass Transfer in an Upflow Monolith Loop Reactor
In determining the volumetric mass transfer coefficient, dissolved oxygen was stripped from the liquid phase to a negligible concentration by the use of nitrogen sparged through the gas distributor. After the stripping operation, a step input of air was introduced into the reactor, with the uptake of oxygen into the liquid phase continuously monitored by the oxygen sensor. Sufficient time was given in each experimental run for the oxygen saturation concentration in the liquid, CL
* to be reached. Prior to conducting mass transfer experiments, the time constant of the oxygen sensor, ksensor was determined by the method described in section 2.3 of chapter 2. The value of ksensor was found to vary in the range 0.4-0.51 s-1 for all experiments carried out. This range is typical for the use of air as the gas phase and demineralized water as the liquid phase, for the oxygen sensor employed. Fig 4.6 shows a typical dynamic response for the oxygen sensor, from which the sensor constant was determined to be 0.5 s-1 using the relation:
sensorsensor*L
1 k tC eC
−= − (4.3)
Time /[s]
0 2 4 6 8 10 12 14 16
(Cse
nsor
-Cse
nsor
,0)/(
CL*
-Cse
nsor
,0)
0.0
0.2
0.4
0.6
0.8
1.0
Experimental dataFit, Eq. (4.3), ksensor = 0.5 s-1
Figure 4.6: Oxygen absorption dynamic response obtained in determining the sensor constant.
SINGLE CAPILLARY EXPERIMENTS
Gas and liquid flows in the channels of the monolith reactor are different from what obtains in the airlift and bubble column reactors. Here, a flow pattern in which plugs of gas bubbles rise along each channel separated from each other by liquid slugs occurs. This flow pattern is known as Taylor flow. In chapter 6, details of this and other flow patterns in monolith channels will be investigated in-depth. For now, it suffices to investigate the rise characteristics of Taylor bubbles in the square capillary system, which mimics a single channel of the monolith block. In determining these rise characteristics, the air and water
71

Chapter 4 Hydrodynamics and Mass Transfer in an Upflow Monolith Loop Reactor
flow rates in the capillary were independently adjusted such that the superficial gas, UG and liquid, ULR velocities corresponded to values obtained in the upflow monolith loop reactors previously discussed. The high-speed camera was positioned midway along the capillary height and adequately focused, enabling it to capture rising air bubbles and liquid slugs within a vertical window 0.2-m-high. At the start of each experimental investigation, the gas and liquid control valves were regulated to obtain desired flow velocities. Once steady flow had been achieved, high-speed movies were made for a time span of 3 s at a capture rate of 2250 fps. By carrying out a frame-by-frame analysis of each movie, the bubble frequency, fb defined as the number of bubbles traversing the halfway point of the capillary per unit time, was determined. The bubble rise velocity, Vb was also determined from the movie analysis by registering the time required for a gas bubble to rise 0.2 m along the capillary height. For each gas and liquid flow rate, the Vb reported is the average obtained from five randomly selected bubbles. The mean unit cell length, LUC for each UG and ULR combination was obtained from:
bUC
b
VLf
= (4.4)
A unit cell is the basic block of Taylor flow, consisting of a gas bubble and its corresponding liquid slug. Fig 4.7 shows a representation of gas bubbles rising in a capillary, and indicates a unit cell.
unit cell length
liquid slug
Taylor gas bubble
single capillary
Figure 4.7: Representation of gas bubbles rising in a single capillary. The unit cell length, LUC is shown as the distance occupied by a gas bubble and its associated liquid slug, in this case taken to be
the accompanying liquid slug beneath it.
72

Chapter 4 Hydrodynamics and Mass Transfer in an Upflow Monolith Loop Reactor
4.4 MODELS FOR DETERMINING kLa
MONOLITH AND AIRLIFT LOOP REACTORS
A common reactor model was developed for the monolith and airlift loop reactors for obtaining volumetric mass transfer coefficient values from experimental dynamic oxygen absorption curves based on the following assumptions: Plug flow of gas and liquid in the riser section of the reactor. For the monolith
reactors, tall and short, the minimum number of unit cells was 11 and this rose to values in excess of 50, based on studies in the single capillary. Therefore, the assumption of plug flow is justified.
Plug flow of liquid in the downcomer section. A well-mixed gas-liquid separator section.
The riser section of the reactor is assumed to extend to the dispersion height. This
means that gas bubbles in the gas-liquid separator constitute a part of the riser, i.e. no gas bubbles are assumed to be present in the gas-liquid separator. The gas free gas-liquid separator is referred to as the top section in the model developed. A diagram of the model is shown in Fig. 4.8.
kLaplug flow of gas in the riser
plug flow of liquid in the riser
well-mixed top section
plug flow of liquidin the downcomer
oxygen sensor
UG
ULR ULD
ULT
Figure 4.8: Schematic representation of the reactor model used to determine kLa in the monolith and airlift loop reactors.
73

Chapter 4 Hydrodynamics and Mass Transfer in an Upflow Monolith Loop Reactor
The governing oxygen mass balance equations for the reactor model are: Plug flow of gas in the riser:
G G GG G L
C C CU k a Ct h m
ε ∂ ∂ ⎛= − − −⎜∂ ∂ ⎝ ⎠LR⎞⎟ (4.5)
Plug flow of liquid in the riser:
GLR LRL LR L
CC CU k a Ct h m
ε ∂ ∂ ⎛= − + −⎜∂ ∂ ⎝ ⎠LR⎞⎟ (4.6)
Well-mixed gas-liquid separator section at the top:
( )LTLTLT
T
dd
CC Ut H
∆= − (4.7)
Plug flow of liquid in the downcomer:
LD LDLD
C Ut h
∂ ∂=
∂ ∂C (4.8)
Sensor correction equation:
(sensorsensor LD sensor
dd
C k C Ct
= − ) (4.9)
εG and εL are the gas and liquid holdups in the riser section of the monolith and airlift loop reactors. kLa is the volumetric mass transfer coefficient per unit volume of dispersion (gas + liquid) in the riser section of the monolith and airlift loop reactors. UG is the superficial gas velocity with respect to the riser section of the reactor (based on the open area available for flow of gas and liquid phases in the case of monolith configurations), while ULR, ULT and ULD are the superficial liquid velocities in the riser, top section and downcomer, respectively. The values of ULD as determined experimentally were used in the reactor model. Fig. 4.9(a) and (b) show the experimentally determined ULD values as a function of UG and gas flow rate for the monolith and airlift reactors. For a given UG, ULD is the same for the short and tall monolith loop reactors, signifying similar hydrodynamic behavior in both reactors. Once ULD was known, the ULR and ULT values were determined from geometry considerations, using the known cross sectional areas. HT is the dispersion height of the top section and m, the solubility coefficient of oxygen in water at ambient conditions; m = 28. Eqs. (4.5)-(4.9) are subject to the following boundary conditions: At time t = 0, CG = CG,inlet At time t = 0, CLR = CLD = CLT = 0 CLR,in = CLD,out CLD,in = CLT,out CLT,in = CLR,out
74

Chapter 4 Hydrodynamics and Mass Transfer in an Upflow Monolith Loop Reactor
Superficial gas velocity, UG /[m/s]
0.00 0.05 0.10 0.15
Dow
ncom
er li
quid
vel
ocity
, ULD
/[m
/s]
0.0
0.2
0.4
0.6
0.8
1.0
Short monolithTall monolithAirlift
Gas flow rate /[L/s]
0.00 0.20 0.40 0.60 0.80 1.00
Dow
ncom
er li
quid
vel
ocity
, ULD
/[m
/s]
0.0
0.2
0.4
0.6
0.8
1.0
Short monolithTall monolithAirlift
(a) (b)
Figure 4.9: Variation in measured downcomer liquid velocity, ULD with superficial gas velocity, UG
for tall and short monolith reactors and the airlift reactor.
Solving Eqs. (4.5) to (4.9) involved discretizing their spatial derivatives. A first-order backward difference approximation was used. The Method of Lines solution procedure was adopted with 50 grid points used to represent the total dispersion height in the reactor. A FORTRAN program was written to handle this, utilizing the ODE solver LSODE24 in double precision. Fig. 4.10(a) and (b) show sample kLa fits in the tall and short monolith loop reactors for UG = 0.061 and 0.142 m/s, respectively. The kLa values obtained from these fits are 0.137 and 0.2 s-1, respectively. Also shown in Fig. 4.10(a) and (b) with dashed lines are the dynamic uptake curves if the liquid leaving the top of the monolith section were to be saturated with dissolved oxygen. The maximum possible saturation rate was determined assuming perfect mixing of liquid in the gas-liquid separator and downcomer. The data in Fig. 4.10(a) for operation of the tall monolith reactor at UG = 0.061 m/s shows that the measured dynamic uptake curve is quite close to the saturation value. For the tall monolith reactor operating at superficial gas velocities, UG > 0.07 m/s, the dynamic uptake curve was close to, or indistinguishable from the saturation curve. Therefore, the fitted kLa values for UG > 0.07 m/s are all considered to be suspect. In contrast, all experimental dynamic oxygen absorption curves over the entire range of operating conditions obtained in the short monolith reactor were well below saturation values. This is illustrated by the dynamic oxygen uptake curve shown in Fig. 4.10(b) for operation of the short monolith reactor at UG = 0.142 m/s, the highest gas velocity employed. Even for this case, the measured uptake dynamics lies well below the anticipated uptake curve were the liquid leaving at the top of the monolith block to be saturated, shown by the dashed line. The fitted kLa values for the short monolith reactor are therefore trustworthy for the entire range of UG values. The discussions above underline the need for extreme caution in interpreting oxygen uptake dynamics to obtain kLa in monolith loop systems.
75

Chapter 4 Hydrodynamics and Mass Transfer in an Upflow Monolith Loop Reactor
Fig. 4.10(c) shows a sample fit in the airlift loop reactor. In this case, UG = 0.087 m/s and kLa = 0.103 s-1.
Time /[s]
0 50 100 150 200 250 300
(Cse
nsor
-Cse
nsor
,0)/(
C* L
D-C
sens
or,0) /
[-]
0.0
0.2
0.4
0.6
0.8
1.0
Experimental dataModel fitSaturation curve
Time /[s]
0 20 40 60 80 100 120 140
(Cse
nsor
-Cse
nsor
,0)/(
C* L
D-C
sens
or,0) /
[-]
0.0
0.2
0.4
0.6
0.8
1.0
Experimental dataModel fitSaturation curve
Time /[s]
0 50 100 150 200 250 300
(Cse
nsor
-Cse
nsor
,0)/(
C* L
D-C
sens
or,0) /
[-]
0.0
0.2
0.4
0.6
0.8
1.0
Expterimental dataModel fit
Time /[s]
0 10 20 30 40 50
(Cse
nsor
-Cse
nsor
,0)/(
C* L
-Cse
nsor
,0) /
[-]
0.0
0.2
0.4
0.6
0.8
1.0
Experimental dataModel fit
Tall monolith
UG = 0.061 m/skLa = 0.137 s-1
Short monolith
UG = 0.142 m/skLa = 0.2 s-1
Airlift
UG = 0.087 m/skLa = 0.103 s-1
UG = 0.122 m/skLa = 0.117 s-1
Bubble column
(a) (b)
(c) (d)
Figure 4.10: Oxygen absorption dynamics for the specified superficial gas velocities, UG in the (a) tall monolith loop reactor, (b) short monolith loop reactor, (c) internal airlift loop reactor, (d) bubble
column, as well as the reactor model fits obtained for each case in obtaining kLa values.
BUBBLE COLUMN REACTOR
In interpreting experimental dynamic oxygen absorption curves to obtain kLa values in the bubble column, a model was developed based on the gas phase being in plug flow and a well-mixed liquid phase. The resulting oxygen mass balance equations are:
G G GG G L
C C CU k at h m
ε ∂ ∂ ⎛= − − −⎜∂ ∂ ⎝ ⎠LC ⎞⎟ (4.10)
76

Chapter 4 Hydrodynamics and Mass Transfer in an Upflow Monolith Loop Reactor
GL LL
0
d dd
H CC k a Ct H m
ε ⎛= −⎜⎝ ⎠∫ L h⎞
⎟ (4.11)
(sensorL sensor L
dd
C k C Ct
ε = − )sensor (4.12)
εG and εL are the gas and liquid holdups in the bubble column. kLa is the volumetric mass transfer coefficient per unit volume of dispersion in the bubble column while H is the dispersion height. Eqs. (4.10) to (4.12) were also solved using the Method of Lines with the following boundary conditions: At time t = 0, CG = CG,inlet At time t = 0, CL = 0
A typical bubble column model fit for obtaining the value of kLa is shown in Fig.4.10(d). For this case, UG = 0.122 m/s and the kLa value obtained is 0.117 s-1.
4.5 RESULTS AND DISCUSSION
The measured data on the gas holdup, εG, volumetric mass transfer coefficient, kLa and the ratio kLa/εG, as a function of the superficial gas velocity, UG based on the open area available for flow of the phases, for the reactor configurations investigated, are summarized in Fig.4.11(a)-(c). The gas holdup in the airlift reactor is the lowest of the reactor configurations investigated. This is because of the high liquid circulation velocities in the airlift column (see Fig. 4.9); these high circulation velocities result in a very low slip velocity between the gas and liquid phases in the riser, resulting in a lower gas holdup. The very low slip between the gas and liquid phases also results in a very uniform distribution of gas bubbles with very little coalescence. It is also remarkable to note that the gas holdup in the tall and short monolith loop reactors are virtually identical. This is an important conclusion from a scale up viewpoint.
The monolith reactors show significantly higher values of kLa than the conventionally used bubble column and internal airlift reactor configurations, when comparison is made at the same UG. As discussed earlier, kLa values for the tall monolith reactor operating at UG > 0.07 m/s are not trustworthy due to the possibility of the liquid phase at the top of the monolith riser tube being saturated with dissolved oxygen. Therefore, the doubtful values are encircled within the dashed region marked “saturation”. For UG < 0.07 m/s, there is very good agreement in kLa values for tall and short monoliths. The high liquid level in the gas-liquid separator of the tall monolith reactor in effect meant that a significant amount of gas-liquid mass transfer occurred there in addition to that which occurred in the monolith channels. For the short monolith reactor, the liquid level in the gas-liquid separator was kept as low as possible to obtain a satisfactory operation of the reactor. Thus, results from the
77

Chapter 4 Hydrodynamics and Mass Transfer in an Upflow Monolith Loop Reactor
short monolith reactor generally give a better picture of gas-liquid mass transfer in monolith reactors, for the monolith bundle employed.
The mass transfer coefficient per unit volume of dispersed gas bubbles, kLa/εG is higher for monoliths than for a conventional bubble column, emphasizing the superiority of monoliths for carrying out fast reactions. kLa/εG is also independent of UG in the short monolith reactor taking on a constant value of 0.76 s-1. Interestingly, kLa/εG for the airlift column is higher than that of the monolith. This is due to the fact that the gas holdup in the airlift is considerably lower than in the monolith reactor; at such low gas holdups, the bubbles are uniform and small in size and the bubbles travel upward with very little backmixing of the gas and liquid phases. The highest values of kLa/εG for the bubble column occur at the lowest gas velocities and gas holdups. This is also due to the uniform and small bubble sizes, which allow maximum utilization of the bubble interfacial area for gas-liquid mass transfer. However, such low gas velocities and holdups happen to be of little significance in the operation of bubble columns on an industrial scale where high throughputs are often required.
Superficial gas velocity, UG /[m/s]
0.00 0.05 0.10 0.15
Gas
hol
dup,
εG /[
-]
0.0
0.1
0.2
0.3
0.4Short monolithTall monolithAirliftBubble column
Superficial gas velocity, UG /[m/s]
0.00 0.05 0.10 0.15
k La
/[s-1
]
0.00
0.05
0.10
0.15
0.20
0.25
0.30Short monolithTall monolithAirliftBubble column
Superficial gas velocity, UG /[m/s]
0.00 0.05 0.10 0.15
k La/ε G
/[s-1
]
0.0
0.5
1.0
1.5
2.0Short monolithTall monolithAirliftBubble column
(a) (b)
(c)
saturation
saturation
Figure 4.11: Variation of superficial gas velocity, UG with (a) gas holdup, εG, (b) volumetric mass transfer coefficient, kLa and (c) kLa/εG in each of the reactor configurations investigated.
78

Chapter 4 Hydrodynamics and Mass Transfer in an Upflow Monolith Loop Reactor
In the channels of the monoliths, Taylor flow is expected,2, 4 resulting in trains of bubbles that are separated from each other by liquid slugs25 as shown in Fig.4.7. The bubbles are surrounded by a thin liquid film, that is of the order of 50-200 µm, depending on the gas and liquid superficial velocities, UG and ULR through each monolith channel.19 Fig. 4.12 shows the single capillary data (denoted by circles) on the unit cell length, LUC and bubble rise velocity, Vb obtained from the experiments carried out. The corresponding information obtained by observing the rise of Taylor bubbles through a small crack, 0.13 m high, in one of the outer channels of the tall monolith loop reactor and recording it with the high-speed video camera at 750 fps is also shown (square symbols). Sample high-speed video recordings of the Taylor bubbles rising in the outer channel can be viewed online.21 In the single capillary measurements, for fixed values of UG and ULR, there is practically no variation in the values of LUC and Vb. This is in sharp contrast to the information obtained from the video recordings of the outer channel. Here, there exists a very wide spread in the LUC values as evidenced by the error bars indicating the standard deviation of measurements (about 30-50 unit cells were analyzed for each UG + ULR). The mean values of LUC agree reasonably well with those from the single capillary measurements. If the wide variation of the unit cell lengths as seen in the crack of the outer channel is indicative of what goes on in the entire monolith bundle, this variation has implications for mass transfer from Taylor bubbles in monolith reactors.
(a)
(UG + ULR) /[m/s]
0.20 0.25 0.30 0.35 0.40
Uni
t cel
l len
gth,
LU
C /[
m]
0.00
0.02
0.04
0.06
0.08
0.10
Outer channelSingle capillary
(UG + ULR) /[m/s]
0.20 0.25 0.30 0.35 0.40
Tayl
or b
ubbl
e ris
e ve
loci
ty, V
b /[m
/s]
0.2
0.3
0.4
0.5
Outer channelSingle capillaryParity
(b)
Figure 4.12: (a) Influence of (UG + ULR) on the unit cell length, LUC. (b) The Taylor bubble rise velocity, Vb as a function of (UG + ULR). The round symbols refer to data obtained from single
capillary experiments. The square symbols refer to measurements on the outer channel of the tall monolith loop reactor. The error bars represent standard deviations obtained from frame-by-frame
analysis of the video recordings made.
79

Chapter 4 Hydrodynamics and Mass Transfer in an Upflow Monolith Loop Reactor
From Fig. 4.12(b) we note that the Taylor bubble rise velocity values as measured in the single capillary are lower than the corresponding values in the outer channel. Also shown by the continuous solid line is the parity line with (UG + ULR). The large difference between Vb and (UG + ULR) would suggest increased downflow of liquid in the monolith as compared to the single capillary. A possible reason for this is the non-uniform distribution of gas and liquid phases through the channels of the monolith. Using magnetic resonance imaging, Mantle et al.26 showed that a wide range of bubble sizes exist in a 400-cpsi-downflow-monolith. They also concluded that bubble velocity is not stable with time. These two phenomena have been observed in the outer channel of the 48-cpsi-upflow-monolith reactor studied.
The understanding of gas-liquid mass transfer in the channels of a monolith would be greatly enhanced by fundamental studies in a single capillary. Chapter 7 presents such a study in which the effect of operating parameters as well as capillary configuration and dimension on the rate of gas-liquid mass transfer is investigated. Recently, van Baten and Krishna developed a fundamental model for the calculation of the volumetric mass transfer coefficient from Taylor bubbles rising in circular capillaries.27 Their model recognizes two contributions to mass transfer: (1) from the caps at either end of the bubble rising in the capillary; these caps were assumed to be hemispherical, and (2) from the liquid film surrounding the bubble. They put forward the following relationship for estimating kLa:
L L,cap cap L,film filmk a k a k a= + (4.13) with
L bL,cap 2
c
22 Ð Vkdπ
= (4.14)
and
LL,film
film
2 Ðktπ
≈ (4.15)
where tfilm, the contact time of the liquid film with the rising Taylor gas bubble can be estimated as tfilm = LUCεG/Vb. ÐL, the liquid phase diffusivity of oxygen in water was taken to be 2.11 x 10⁻⁹ m2/s. Also, acap = 4/LUC and afilm =4εG/dc.
The calculations of the cap, film and total (=cap + film) kLa values using Eqs. (4.13)-(4.15), with Vb, εG and LUC data obtained from the outer channel of the monolith, are shown in Fig. 4.13. The experimental kLa values agree very well with the film contribution, kL,filmafilm, which according to the study of van Baten and Krishna, based on computational fluid dynamics (CFD) simulations, is the major contributor to the gas-liquid mass transfer process in a single circular capillary. It is likely that the cap contribution predicted by the
80

Chapter 4 Hydrodynamics and Mass Transfer in an Upflow Monolith Loop Reactor
model is too optimistic, considering the fact that the front and rear ends of the Taylor bubbles are likely more flattened. This would lead to a lower surface area than that afforded by the two hemispherical caps assumed in the model. The plot shown in Fig. 4.13 does serve as a good indication that the volumetric mass transfer coefficient in a monolith loop reactor can be estimated from information on Taylor bubble hydrodynamics. In subsequent chapters, the characteristics of Taylor bubbles in single capillaries as well as gas-liquid mass transfer rates in these capillaries will be investigated. Firstly however, in the next chapter, the effect of low frequency vibrations on gas-liquid mass transfer rates in monolith loop reactors, an airlift loop reactor and a bubble column is investigated.
Experimental values in the short monolith reactor, kLa /[s-1]
0.00 0.05 0.10 0.15 0.20Cal
cula
ted
from
Eqs
. (4.
13)-
(4.1
5), k
La /[
s-1]
0.00
0.05
0.10
0.15
0.20
0.25
0.30ParityCap + filmCapFilm
Figure 4.13: Comparison of the experimentally determined volumetric mass transfer coefficients, kLa obtained in the short monolith loop reactor with the predictions using Eqs. (4.13)-(4.15). The
hydrodynamic data on Vb, εG and LUC were those obtained from the outer channel of the tall monolith loop reactor. The continuous line represents the parity plot.
4.6 CONCLUSIONS
The hydrodynamics and mass transfer characteristics of a monolith loop reactor, with upflow of gas and liquid through the channels, have been investigated in this study and compared with conventional internal airlift reactor and bubble column configurations. The following major conclusions can be drawn from this work:
(1) The volumetric mass transfer coefficient, kLa is significantly higher for monolith reactors than for airlifts and bubble columns. This improvement is due to the superior mass transfer characteristics of Taylor flow in the narrow capillaries of monoliths.
(2) The superior mass transfer of monolith reactors provides interesting opportunities for application to three-phase reaction systems for process intensification.
81

Chapter 4 Hydrodynamics and Mass Transfer in an Upflow Monolith Loop Reactor
(3) The volumetric mass transfer coefficient in monolith reactors can be estimated from information on Taylor bubble hydrodynamics, in particular, values of the bubble rise velocity, Vb, gas holdup, εG and unit cell length, LUC. For such estimation, the dominant mass transfer occurs by the transport of gas from the Taylor bubbles to the liquid film surrounding the bubbles, based on the model proposed by van Baten and Krishna.27
(4) The experiments in the tall monolith reactor also highlight that extreme caution should be taken in interpreting the dynamic oxygen uptake curves for tall monoliths in view of the anticipated problem of the liquid reaching saturation conditions.
NOTATION a gas-liquid interfacial area per unit volume of dispersion; except for the bubble
column, the dispersion within the riser section is considered, m2/m3
CG gas phase oxygen concentration, mol/m3
CL liquid phase oxygen concentration, mol/m3 or arbitrary units CLD liquid phase oxygen concentration in the downcomer, mol/m3 or arbitrary
units CLR liquid phase oxygen concentration in the riser, mol/m3
Csensor liquid phase oxygen concentration indicated by the sensor, arbitrary units CLT liquid phase oxygen concentration in the gas-liquid separator (top section),
mol/m3
dc dimension of capillary or monolith channel, m ÐL liquid phase diffusivity of oxygen, m2/s fb Taylor bubble frequency, s-1
h distance along the reactor height, m H total dispersion height, m HT dispersion height in the gas-liquid separator (top section), m Htracer distance traveled by tracer in downcomer liquid velocity experiments, m kL liquid side mass transfer coefficient, m/s ksensor oxygen sensor time constant, s-1
LUC unit cell length, m m solubility coefficient of oxygen in water, dimensionless t time, s tfilm contact time of liquid film with Taylor gas bubble, s UG superficial gas velocity; for airlift, with regard to the riser cross section; for
monolith, with regard to the cross sectional area available for flow in the riser; for bubble column, with regard to the column cross section, m/s
ULD downcomer superficial liquid velocity, m/s ULR riser or single capillary superficial liquid velocity, m/s ULT top section superficial liquid velocity, m/s
82

Chapter 4 Hydrodynamics and Mass Transfer in an Upflow Monolith Loop Reactor
V voltage reading on the conductivity meter, volts Vb Taylor bubble rise velocity, m/s Greek Symbols εG gas holdup in the riser; for bubble column, gas holdup in the column,
dimensionless εL liquid holdup in the riser; for bubble column, liquid holdup in the column,
dimensionless τL liquid mean residence time in the downcomer, s Subscripts and Superscripts cap refers to the hemispherical cap of a Taylor bubble film refers to the liquid film surrounding a Taylor bubble in refers to conditions into a given section of the reactor inlet refers to conditions at the inlet of the reactor out refers to conditions out of a given section of the reactor 0 initial condition * refers to saturation concentration
BIBLIOGRAPHY (1) Irandoust, S.; Andersson, B. Monolithic catalysts for nonautomobile applications. Catalysis Reviews-Science and Engineering 1988, 30, 341-392. (2) Boger, T.; Roy, S.; Heibel, A. K.; Borchers, O. A monolith loop reactor as an attractive alternative to slurry reactors. Catalysis Today 2003, 79, 441-451. (3) Crynes, L. L.; Cerro, R. L.; Abraham, M. A. Monolith froth reactor - development of a novel 3-Phase catalytic-system. American Institute of Chemical Engineers Journal 1995, 41, 337-345. (4) Kapteijn, F.; Nijhuis, T. A.; Heiszwolf, J. J.; Moulijn, J. A. New non-traditional multiphase catalytic reactors based on monolithic structures. Catalysis Today 2001, 66, 133-144. (5) Edvinsson, R. K.; Cybulski, A. A Comparison between the monolithic reactor and the trickle-bed reactor for liquid-phase hydrogenations. Catalysis Today 1995, 24, 173-179. (6) Nijhuis, T. A.; Kreutzer, M. T.; Romijn, A. C. J.; Kapteijn, F.; Moulijn, J. A. Monolithic catalysts as more efficient three-phase reactors. Catalysis Today 2001, 66, 157-165. (7) Stankiewicz, A. Process intensification in in-line monolithic reactor. Chemical Engineering Science 2001, 56, 359-364.
83

Chapter 4 Hydrodynamics and Mass Transfer in an Upflow Monolith Loop Reactor
(8) Edvinsson, R. K.; Holmgren, A. M.; Irandoust, S. Liquid-phase hydrogenation of acetylene in a monolithic catalyst reactor. Industrial & Engineering Chemistry Research 1995, 34, 94-100. (9) Nijhuis, T. A.; Dautzenberg, F. M.; Moulijn, J. A. Modeling of monolithic and trickle-bed reactors for the hydrogenation of styrene. Chemical Engineering Science 2003, 58, 1113-1124. (10) Irandoust, S.; Gahne, O. Competitive Hydrodesulfurization and hydrogenation in a monolithic reactor. American Institute of Chemical Engineers Journal 1990, 36, 746-752. (11) Klinghoffer, A. A.; Cerro, R. L.; Abraham, M. A. Influence of flow properties on the performance of the monolith froth reactor for catalytic wet oxidation of acetic acid. Industrial & Engineering Chemistry Research 1998, 37, 1203-1210. (12) Kawakami, K.; Kawasaki, K.; Shiraishi, F.; Kusunoki, K. Performance of a honeycomb monolith bioreactor in a gas-liquid-solid three-phase system. Industrial & Engineering Chemistry Research 1989, 28, 394-400. (13) Quan, X. C.; Shi, H. C.; Zhang, Y. M.; Wang, J. L.; Qian, Y. Biodegradation of 2,4-dichlorophenol in an air-lift honeycomb-like ceramic reactor. Process Biochemistry 2003, 38, 1545-1551. (14) de Deugd, R. M.; Chougule, R. B.; Kreutzer, M. T.; Meeuse, F. M.; Grievink, J.; Kapteijn, F.; Moulijn, J. A. Is a monolithic loop reactor a viable option for Fischer- Tropsch synthesis? Chemical Engineering Science 2003, 58, 583-591. (15) de Deugd, R. M.; Kapteijn, F.; Moulijn, J. A. Using monolithic catalysts for highly selective Fischer-Tropsch synthesis. Catalysis Today 2003, 79, 495-501. (16) Heiszwolf, J. J.; Engelvaart, L. B.; van den Eijnden, M. G.; Kreutzer, M. T.; Kapteijn, F.; Moulijn, J. A. Hydrodynamic aspects of the monolith loop reactor. Chemical Engineering Science 2001, 56, 805-812. (17) Heiszwolf, J. J.; Kreutzer, M. T.; van den Eijnden, M. G.; Kapteijn, F.; Moulijn, J. A. Gas-liquid mass transfer of aqueous Taylor flow in monoliths. Catalysis Today 2001, 69, 51-55. (18) Kreutzer, M. T.; Du, P.; Heiszwolf, J. J.; Kapteijn, F.; Moulijn, J. A. Mass transfer characteristics of three-phase monolith reactors. Chemical Engineering Science 2001, 56, 6015-6023. (19) Kreutzer, M. T. Hydrodynamics of Taylor flow in capillaries and monolith reactors. Ph.D. Thesis. Delft University of Technology, Delft, The Netherlands, 2003. (20) Nijhuis, T. A.; Kreutzer, M. T.; Romijn, A. C. J.; Kapteijn, F.; Moulijn, J. A. Monolithic catalysts as efficient three-phase reactors. Chemical Engineering Science 2001, 56, 823-829. (21) Vandu, C. O.; Ellenberger, J.; Krishna, R. Hydrodynamics and mass transfer in an upflow monolith loop reactor, University of Amsterdam, Available at URL http://ct-cr4.chem.uva.nl/Monolith/, accessed November 2003. (22) Vandu, C. O.; Ellenberger, J.; Krishna, R. Hydrodynamics and mass transfer in an internal airlift reactor, University of Amsterdam, Available at URL http://ct-cr4.chem.uva.nl/AirliftExpt/, accessed November 2003.
84

Chapter 4 Hydrodynamics and Mass Transfer in an Upflow Monolith Loop Reactor
(23) Vandu, C. O.; Ellenberger, J.; Krishna, R. Slurry bubble column research, University of Amsterdam, Available at URL http://ct-cr4.chem.uva.nl/BubbleColumnExpt/, accessed August 2003. (24) Hindmarsh, A. C., Livermore solver for Ordinary Differential Equations, Lawrence Livermore National Laboratory, Livermore, California, 2001. (25) Thulasidas, T. C.; Abraham, M. A.; Cerro, R. L. Bubble-train flow in capillaries of circular and square cross- section. Chemical Engineering Science 1995, 50, 183-199. (26) Mantle, M. D.; Sederman, A. J.; Gladden, L. F.; Raymahasay, S.; Winterbottom, J. M.; Stitt, E. H. Dynamic MRI visualization of two-phase flow in a ceramic monolith. American Institute of Chemical Engineers Journal 2002, 48, 909-912. (27) van Baten, J. M.; Krishna, R. CFD simulations of mass transfer from Taylor bubbles rising in circular capillaries. Chemical Engineering Science 2004, 59, 2535-2545.
85


Chapter 5 Upflow Monolith Loop Reactor: Vibration Excitement
Chapter 5
HYDRODYNAMICS AND MASS TRANSFER IN AN UPFLOW MONOLITH LOOP REACTOR: INFLUENCE OF VIBRATION
EXCITEMENT
5.1 INTRODUCTION
In the previous chapter, it was demonstrated that the upflow monolith loop reactor has a superior gas-liquid mass transfer capability than the conventionally used bubble column and airlift loop reactor configurations. This was largely attributed to the unique gas-liquid flow pattern in the monolith channels, in which plugs of rising gas bubbles stand separated from each other by liquid slugs. In this chapter, the focus remains on the upflow monolith loop reactor and the comparison of its performance with those of a bubble column and an internal loop airlift reactor. However, in addition to studying hydrodynamic and mass transfer parameters such as the gas holdup, εG and volumetric mass transfer coefficient, kLa, attention will also be focused on the effect of low frequency vibrations on the performance of these reactors in order to determine to what extent subtle resonance phenomena can improve their performance.
Previous studies in the literature1-3 have shown that the application of low frequency vibrations to the liquid phase of a bubble column can significantly enhance the gas holdup and mass transfer characteristics. These vibrations generally give rise to acoustic waves. Acoustic waves are longitudinal waves i.e., waves in which particles are displaced parallel to the direction of propagation. Being longitudinal waves in which pressure fluctuations occur as a result of the presence of high- and low-pressure regions, they are able to affect both the rise characteristics and breakup rates of bubbles. When subjected to low frequency vibrations, bubble breakage is induced by resonance phenomena as reported by Krishna et al.4 based on studies carried out in a single orifice bubble column. The traditional way of obtaining bubble breakage to enhance gas-liquid mass transfer is by the application of a stirrer.
It can be anticipated that the gas-liquid mass transfer enhancements obtained from the application of low frequency vibrations could provide interesting opportunities in a number of applications. These include severely mass transfer limited two- or three-phase reactions where the application of a stirrer could be detrimental to either the reactants or products, such as in biological and biochemical processes. Also, since stirring causes gas bubbles to be recirculated within a vessel, which ultimately leads to a reduction in the overall driving force for gas-liquid mass transfer, low-frequency vibrations have the advantage of being able to increase the gas-liquid interfacial area while also maintaining the highly desirable plug flow.
The aim of the work presented in this chapter is the study of the influence of low frequency vibrations on the hydrodynamics and gas-liquid volumetric mass transfer
87
Chapter 5 Upflow Monolith Loop Reactor: Vibration Excitement
coefficient in monolith loop reactors of circular and square channels. In addition to this, influence of vibrations on the performance of an internal loop airlift reactor and a bubble column are investigated. The information generated from this work would be useful to the purpose of reactor selection as well as providing valuable information on the effect of subtle resonance phenomena on the performance of the monolith, airlift and bubble column reactor configurations.
5.2 EXPERIMENTAL SETUP
MONOLITH LOOP REACTOR
Experiments were carried out in a setup consisting of an internal loop monolith reactor and a vibration control system. The monolith loop reactor comprised of an outer column, a riser column containing the monolith segments and a gas-liquid separator unit (see Fig. 5.1). The outer column and gas-liquid separator were constructed of polyacrylate. The riser column was placed concentrically inside the outer column, the internal diameter of the latter being 0.1 m. Square-channel cordierite and circular-channel glass monoliths were employed. For the square-channel cordierite monolith setup, the riser column was fabricated from glass and had an internal diameter of 0.068 m. On the other hand, the riser column of the circular-channel monolith setup was made of polyacrylate, with an internal diameter of 0.069 m. The annular space between the outer and riser columns formed the downcomer section of the reactor. The lower end of the riser was supported by means of three metal pins placed at a distance of 0.11 m from the bottom of the reactor. The gas-liquid separator, with an internal diameter of 0.29 m and a height of 0.36 m was mounted at the top of the outer column, a height of 1.58 m from the base of the reactor.
For experiments involving the square-channel monoliths, five identical pieces of cordierite monolith (Corning GmbH, Germany), each with 49 cells per square inch (cpsi), were tightly mounted on one another in the 0.068-m-diameter glass riser column. Each monolith had square-shaped channels with sides of 3 mm and an estimated void fraction of 68.8 %. In order to carry out experiments using the circular-channel monoliths, a 1.47-m-long monolith tube bundle consisting of 204 circular glass capillaries each with inner and outer diameters of 3 and 4 mm, respectively, was inserted in the 0.069-m-diameter polyacrylate riser tube. The capillaries were arranged on a triangular pitch with a pitch distance of 4 mm. The top and bottom of the circular-channel monolith bundle were sealed using a thermoplastic polymer (Crystalbond, 509, Printlas Europa, The Netherlands) and the resulting distribution of open channels was 35 cpsi with an estimated void fraction of 38.6 %. Fig. 5.2(a) and (b) show schematic representations of the circular-channel glass monolith and square-channel cordierite monolith. In this chapter, the square- and circular-channel monolith loop reactors are collectively referred to as ‘monolith loop reactors’.
88

Chapter 5 Upflow Monolith Loop Reactor: Vibration Excitement
0.36
m
vibration
vibration exciter
PC
poweramplifier
0.16
m
0.29 m
0.10 m
membranes
gas inlet
0.049 m
cordierite monolith(49-cpsi channels)glass riser
column
outer column
35 mmliquid
oxygen probe
0.068 m
pressurizedair chamber
downcomer
0.1 m
membranes
gas inlet
0.057 m
glass monolith(35-cpsi channels)
polyacrylate riser column
outer column
35 mmliquid
oxygen probe
0.069 m
pressurizedair chamber
downcomer
0.1 m
0.074 m
49-cpsimonolith
gas-liquidseparator
0.068 m
riser column
0.019 m
0.052 m 35-cpsimonolith
gas-liquid separator0.069 m
riser column
metal discmetal disc1.
58 m
0.11
m
metal pin
0.11
m
metal pin
Figure 5.1: Experimental setup for the monolith loop reactors. The setups for the internal loop airlift reactor and bubble column were derived from the same outer column configuration.
Irrespective of the monolith setup employed, the bottom of the outer column was sealed by means of a 0.4-mm-thick silicon rubber membrane tightly sandwiched between two metal discs each with a diameter of 0.096 m. Below the membrane was a pressurized air chamber. This chamber ensured that the membrane remained in a horizontal position after the column was filled with liquid (a necessary condition for the membrane to be properly displaced by the vibrator) by allowing for pressure compensation. Air was fed into the riser column through 11 of 12 stainless steel capillary gas distributors each with an internal diameter of 0.9 mm; see Fig. 5.2(c). The outlet points on the gas distributor were at a height of 0.12 m from the bottom of the reactor. The rate of air flow into the reactor was controlled using pre-calibrated rotameters (Sho-Rate Brooks Instruments BV, The Netherlands).
An air-cooled vibration exciter (TIRAvib 5220, TIRA Maschinenbau, Germany) was attached to the bottom of the outer column. The vibrator was coupled to a power amplifier. The vibration system was fully automated and controlled from a personal computer (PC) using Signal Calc 550 Vibration Controller Software (Data Physics Corporation, United States). Photographs and sample videos on the vibration exciter and the operation of the circular- and square-channel monolith loop reactors are available online.5
89

Chapter 5 Upflow Monolith Loop Reactor: Vibration Excitement
3 mm
3 mm
68 mm
4 mm
3 mm
69 mm
15mm
100 mm
gas inlet
plastic tubePVC
(a) (b)
(c)
Gas distributor:details
12 stainless steel capillaries of inner diameter 0.9 mm
Figure 5.2: Schematic representation of (a) the 35-cpsi circular-channel glass monolith, (b) the 49-cpsi square-channel cordierite monolith. (c) Details of the gas distribution device.
BUBBLE COLUMN AND AIRLIFT LOOP REACTOR
For comparison purposes, experimental studies were also carried out in an airlift loop reactor and a bubble column. The setup of the airlift was a modification of the 35-cpsi-monolith reactor in which the monolith bundle was removed and the length of the riser column extended by 0.099 m. Thus, like the monolith loop reactors, the airlift loop reactor comprised of an outer column, a riser column and a gas-liquid separator unit.
The bubble column, with an internal diameter of 0.1 m and a height of 3.18 m was made of polyacrylate. Like the monolith loop reactors, both the airlift and bubble column were coupled to the vibration control system. All reactor configurations used the same gas distributor device (see Fig 5.2(c)), consisting of 12 stainless steel capillaries of 0.9-mm inside diameter. Table 5.1 gives a summary of the principal dimensions of the four reactor configurations employed in this study.
Investigations were also carried out in 3-mm-dimension single capillaries of circular and square cross sections. The capillaries were 1.4 m in height. The setup for the single capillary experiments is described in section 4.2 of chapter 4.
90

Chapter 5 Upflow Monolith Loop Reactor: Vibration Excitement
Table 5.1: Dimensions of the reactor configurations employed
Height of riser column (m)
Inner diameter of riser column (m)
Outer diameter of riser column (m)
Inner diameter of outer column (m)
Height of monolith segments (m)
Monolith loop: square-channel
1.57 0.068 0.075 0.1 1.5
Monolith loop: circular-channel
1.53 0.069 0.079 0.1 1.47
Airlift loop reactor 1.63 0.069 0.079 0.1 -
Bubble column reactor - - - 0.1 -
5.3 EXPERIMENTAL PROCEDURE
Air served as the gas phase and demineralized water as the liquid phase in all experiments carried out. For each of the four reactors, the gas holdup, εG was measured as well as the rate of oxygen absorption in water, used in determining the volumetric mass transfer coefficient, kLa. Downcomer liquid velocity, ULD measurements were also made in the monolith loop reactors and the airlift loop reactor. At the start of each experimental run, the liquid height was set at 0.16 m in the gas-liquid separator of the monolith and airlift loop reactors. The liquid height in the bubble column was set at 1.18 m above the gas distributor. Operation of the monolith and airlift loop reactors was such that no gas bubbles were present in their downcomers, which was left free for liquid recirculation.
For every reactor configuration, experiments were first carried out without vibration. This was followed by a corresponding experimental set wherein the vibration control system was utilized. In all vibration experiments, the vibrator was programmed to generate low frequency sine wave oscillations with an amplitude, λ of 0.5 mm and a frequency, f of 60 Hz; the choice of these vibration parameters was made on the basis of studies on bubble columns available in the literature.1-3 Fig 5.3 shows a full cycle of the sine wave oscillation. Note that amplitude is defined as the maximum positive or negative displacement of the vibration exciter from its undisturbed position. During vibration experiments, the vertical displacement motion from the vibration exciter was transferred to the reactor via a rod on the exciter connected to two metal discs in-between which was sandwiched a silicon rubber membrane (see Fig. 5.1). Beneath this silicon rubber membrane was a pressurized air chamber. Being an elastic material, the membrane ensured that the pressurized chamber remained sealed even when the vibration exciter was functional. It was necessary to pressurize the chamber beneath the membrane so as to avoid transferring the weight of the liquid in the reactor onto the vibration exciter, as this would have resulted in a poorer performance of the vibration exciter for a set amplitude and frequency.
91

Chapter 5 Upflow Monolith Loop Reactor: Vibration Excitement
Time /[s]
0.000 0.005 0.010 0.015
Dis
plac
emen
t, /[m
m]
-0.50
-0.25
0.00
0.25
0.50
Figure 5.3: Sine wave oscillation of the type generated by the vibration exciter. Amplitude, λ = 0.5 mm and frequency, f = 60 Hz.
GAS HOLDUP MEASUREMENTS
Gas holdup measurements were made in the riser section of the monolith and airlift loop reactors using a technique similar to that described in the previous chapter. In the monolith loop reactors, the riser gas holdup was measured by trapping gas from the monolith channels in a 0.05-m-diameter, 0.65-m-high measuring cylinder; see Fig. 5.4(a). The measuring cylinder was initially filled with demineralized water using a suction valve located at its top. It was vertically pre-positioned in the gas-liquid separator using clamps and metal rods. At the moment the gas flow into the column was shut, the measuring cylinder was instantaneously displaced to rest above the riser tube. Gas bubbles leaving the riser were then trapped in the measuring cylinder, displacing an equivalent volume of liquid. Based on the volume of trapped gas, the riser gas holdup was determined.
The gas holdup in the riser section of the airlift loop reactor was measured by sealing the top of its riser column with a pre-calibrated plastic stopper at the moment gas flow into the reactor was shut down; see Fig. 5.4(b). In this way, gas was trapped in the riser. The height of trapped gas was read using a graduated rule affixed on the riser tube, from which the volume of gas and thus, the gas holdup were determined. For each gas flow rate in the monolith and airlift loop reactors, the gas holdup experiments were done in triplicate, with the average holdup values reported. Gas holdup values in the bubble column were obtained by visual observation. The gas holdup in this case is defined as:
0G 1 H
Hε = − (5.1)
92

Chapter 5 Upflow Monolith Loop Reactor: Vibration Excitement
where H0 is the initial liquid height above the gas distributor and H, the dispersion height.
calibrated plastic stopper
riser
gas bubbles
plastic stopper seals top of riser tube as gas flow is shut
trapped gas
(a)
(b)
suction valve
calibratedmeasuring cylinder
monolith
gas bubbles
clamp system
gas sucked out to fill cylinder with liquid 0.05 m
0.65 m
gas
Figure 5.4: Procedures for determining the gas holdup in (a) the monolith loop reactors and (b) the airlift loop reactor.
DOWNCOMER LIQUID VELOCITY MEASUREMENTS
Liquid velocity measurements were carried out in the downcomers of the monolith and airlift loop reactors using the salt tracer injection technique described in section 4.3 of chapter 4. For each superficial gas velocity, UG with or without vibration, a pulse injection of a tracer (saturated NaCl) was made at a height of 1.54 m above the base of the reactor, corresponding to a distance of 0.04 m beneath the top of the downcomer, and detected by a
93
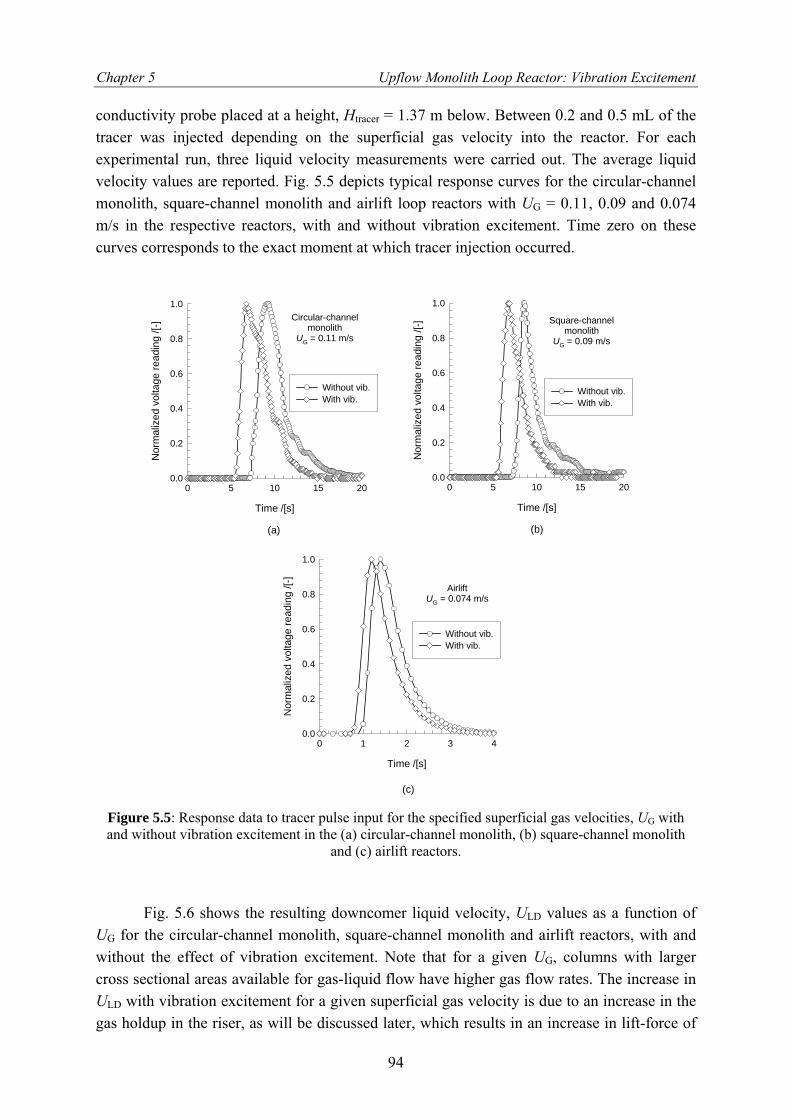
Chapter 5 Upflow Monolith Loop Reactor: Vibration Excitement
conductivity probe placed at a height, Htracer = 1.37 m below. Between 0.2 and 0.5 mL of the tracer was injected depending on the superficial gas velocity into the reactor. For each experimental run, three liquid velocity measurements were carried out. The average liquid velocity values are reported. Fig. 5.5 depicts typical response curves for the circular-channel monolith, square-channel monolith and airlift loop reactors with UG = 0.11, 0.09 and 0.074 m/s in the respective reactors, with and without vibration excitement. Time zero on these curves corresponds to the exact moment at which tracer injection occurred.
Time /[s]
0 5 10 15 20
Nor
mal
ized
vol
tage
read
ing
/[-]
0.0
0.2
0.4
0.6
0.8
1.0
Without vib.With vib.
Time /[s]
0 5 10 15 20
Nor
mal
ized
vol
tage
read
ing
/[-]
0.0
0.2
0.4
0.6
0.8
1.0
Without vib.With vib.
Time /[s]
0 1 2 3 4
Nor
mal
ized
vol
tage
read
ing
/[-]
0.0
0.2
0.4
0.6
0.8
1.0
Without vib.With vib.
Circular-channelmonolith
UG = 0.11 m/s
Square-channelmonolith
UG = 0.09 m/s
AirliftUG = 0.074 m/s
(a) (b)
(c)
Figure 5.5: Response data to tracer pulse input for the specified superficial gas velocities, UG with and without vibration excitement in the (a) circular-channel monolith, (b) square-channel monolith
and (c) airlift reactors.
Fig. 5.6 shows the resulting downcomer liquid velocity, ULD values as a function of UG for the circular-channel monolith, square-channel monolith and airlift reactors, with and without the effect of vibration excitement. Note that for a given UG, columns with larger cross sectional areas available for gas-liquid flow have higher gas flow rates. The increase in ULD with vibration excitement for a given superficial gas velocity is due to an increase in the gas holdup in the riser, as will be discussed later, which results in an increase in lift-force of
94
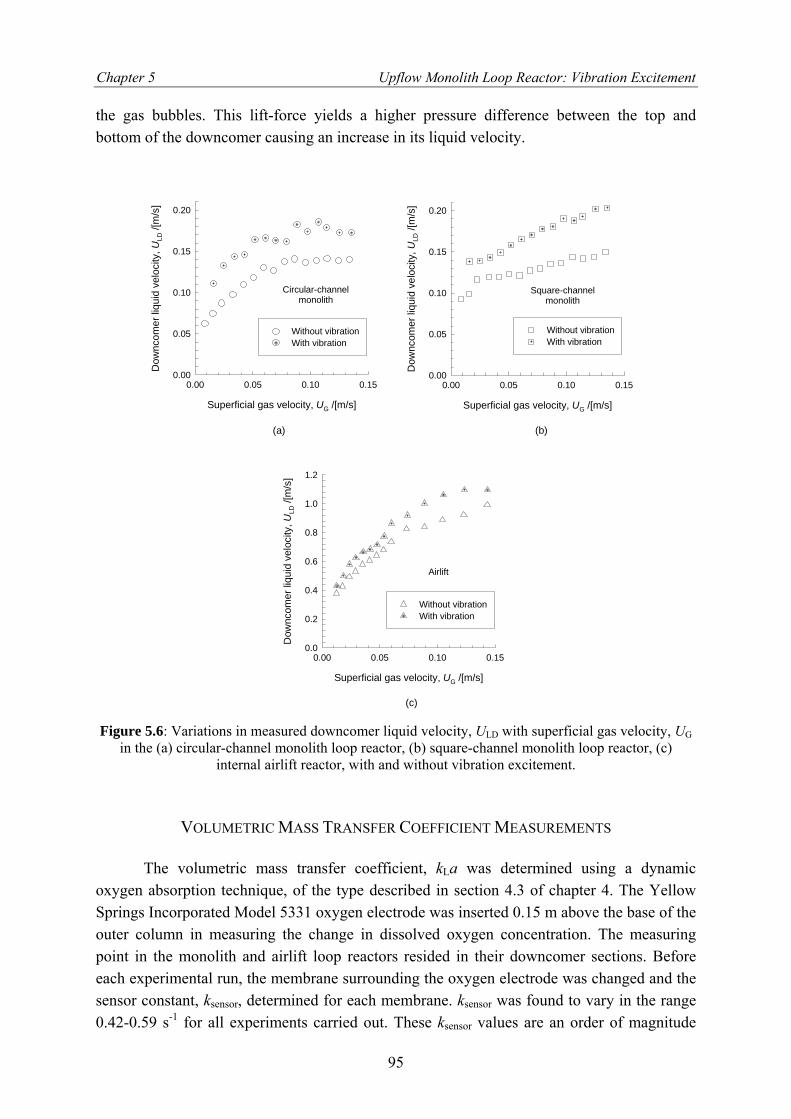
Chapter 5 Upflow Monolith Loop Reactor: Vibration Excitement
the gas bubbles. This lift-force yields a higher pressure difference between the top and bottom of the downcomer causing an increase in its liquid velocity.
Superficial gas velocity, UG /[m/s]
0.00 0.05 0.10 0.15
Dow
ncom
er li
quid
vel
ocity
, ULD
/[m
/s]
0.00
0.05
0.10
0.15
0.20
Without vibrationWith vibration
Superficial gas velocity, UG /[m/s]
0.00 0.05 0.10 0.15
Dow
ncom
er li
quid
vel
ocity
, ULD
/[m
/s]
0.00
0.05
0.10
0.15
0.20
Without vibrationWith vibration
Superficial gas velocity, UG /[m/s]
0.00 0.05 0.10 0.15
Dow
ncom
er li
quid
vel
ocity
, ULD
/[m
/s]
0.0
0.2
0.4
0.6
0.8
1.0
1.2
Without vibrationWith vibration
(a) (b)
(c)
Circular-channelmonolith
Square-channelmonolith
Airlift
Figure 5.6: Variations in measured downcomer liquid velocity, ULD with superficial gas velocity, UG in the (a) circular-channel monolith loop reactor, (b) square-channel monolith loop reactor, (c)
internal airlift reactor, with and without vibration excitement.
VOLUMETRIC MASS TRANSFER COEFFICIENT MEASUREMENTS
The volumetric mass transfer coefficient, kLa was determined using a dynamic oxygen absorption technique, of the type described in section 4.3 of chapter 4. The Yellow Springs Incorporated Model 5331 oxygen electrode was inserted 0.15 m above the base of the outer column in measuring the change in dissolved oxygen concentration. The measuring point in the monolith and airlift loop reactors resided in their downcomer sections. Before each experimental run, the membrane surrounding the oxygen electrode was changed and the sensor constant, ksensor, determined for each membrane. ksensor was found to vary in the range 0.42-0.59 s-1 for all experiments carried out. These ksensor values are an order of magnitude
95
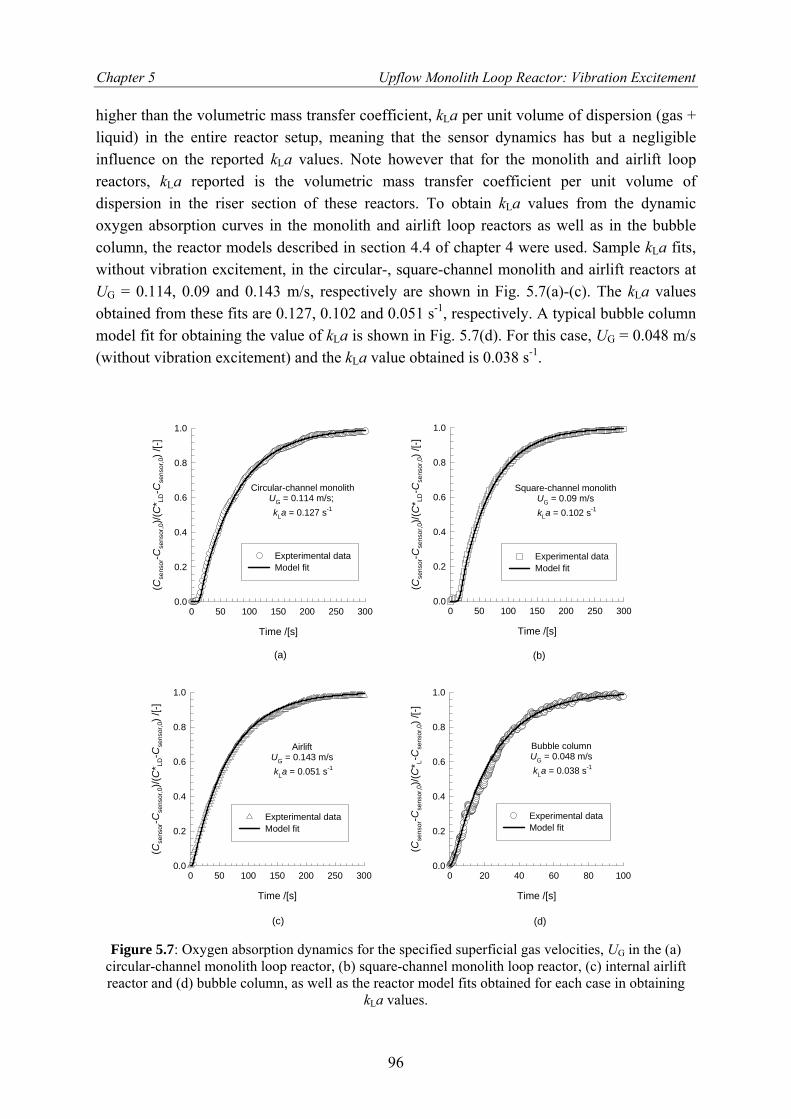
Chapter 5 Upflow Monolith Loop Reactor: Vibration Excitement
higher than the volumetric mass transfer coefficient, kLa per unit volume of dispersion (gas + liquid) in the entire reactor setup, meaning that the sensor dynamics has but a negligible influence on the reported kLa values. Note however that for the monolith and airlift loop reactors, kLa reported is the volumetric mass transfer coefficient per unit volume of dispersion in the riser section of these reactors. To obtain kLa values from the dynamic oxygen absorption curves in the monolith and airlift loop reactors as well as in the bubble column, the reactor models described in section 4.4 of chapter 4 were used. Sample kLa fits, without vibration excitement, in the circular-, square-channel monolith and airlift reactors at UG = 0.114, 0.09 and 0.143 m/s, respectively are shown in Fig. 5.7(a)-(c). The kLa values obtained from these fits are 0.127, 0.102 and 0.051 s-1, respectively. A typical bubble column model fit for obtaining the value of kLa is shown in Fig. 5.7(d). For this case, UG = 0.048 m/s (without vibration excitement) and the kLa value obtained is 0.038 s-1.
Time /[s]
0 50 100 150 200 250 300
(Cse
nsor
-Cse
nsor
,0)/(
C* L
D-C
sens
or,0) /
[-]
0.0
0.2
0.4
0.6
0.8
1.0
Expterimental dataModel fit
Time /[s]
0 50 100 150 200 250 300
(Cse
nsor
-Cse
nsor
,0)/(
C* LD
-Cse
nsor
,0) /
[-]
0.0
0.2
0.4
0.6
0.8
1.0
Experimental dataModel fit
Time /[s]
0 50 100 150 200 250 300
(Cse
nsor
-Cse
nsor
,0)/(
C* L
D-C
sens
or,0) /
[-]
0.0
0.2
0.4
0.6
0.8
1.0
Expterimental dataModel fit
Time /[s]
0 20 40 60 80 100
(Cse
nsor
-Cse
nsor
,0)/(
C* L
-Cse
nsor
,0) /
[-]
0.0
0.2
0.4
0.6
0.8
1.0
Experimental dataModel fit
Circular-channel monolithUG = 0.114 m/s; kLa = 0.127 s-1
Square-channel monolithUG = 0.09 m/s kLa = 0.102 s-1
AirliftUG = 0.143 m/s kLa = 0.051 s-1
Bubble columnUG = 0.048 m/s kLa = 0.038 s-1
(a) (b)
(c) (d)
Figure 5.7: Oxygen absorption dynamics for the specified superficial gas velocities, UG in the (a) circular-channel monolith loop reactor, (b) square-channel monolith loop reactor, (c) internal airlift reactor and (d) bubble column, as well as the reactor model fits obtained for each case in obtaining
kLa values.
96

Chapter 5 Upflow Monolith Loop Reactor: Vibration Excitement
5.4 RESULTS AND DISCUSSION
The measured data on the gas holdup, εG, volumetric mass transfer coefficient, kLa
and kLa/εG as a function of the superficial gas velocity, UG based on the open area available for flow of the phases, for the four reactor configurations investigated, both with and without vibrations, are summarized in Fig. 5.8(a)-(f). For the monolith and airlift loop reactors, the gas holdup refers to the fractional gas holdup in the riser section. For all four reactor configurations, vibrations result in a significant improvement in the gas holdup and volumetric mass transfer coefficient. It has been shown in the literature that low frequency vibrations have the effect of reducing the rise velocity of a bubble swarm due to the creation of standing waves2 and the influence of the Bjerknes force6 that acts on the bubbles. The Bjerknes force occurs when a gas bubble in a liquid is subjected to an acoustic pressure field, such as that resulting from vibrations, and has an effect on the rise velocity of bubbles depending on their sizes. Applying vibrations to the monoliths also serves to improve the distribution of gas and liquid in the monolith channels. A froth consisting of tiny bubbles is created just above the gas distributor enhancing the distribution of gas in the monolith channels. This is demonstrated in Fig. 5.9 using the square-channel monolith loop reactor in which gas bubbles are shown rising from the gas distributor into the monolith channels at two different gas velocities, UG = 0.02 m/s and UG = 0.09 m/s, with and without vibration excitement. The effect is however best appreciated by viewing the video recordings, which are available online.5
The monolith reactors, with either circular or square channels, show a significantly higher value of kLa than the bubble column and airlift loop reactor, when comparison is made at the same UG. It is also observed that the volumetric mass transfer coefficient per unit volume of dispersed gas bubbles, kLa/εG is about a factor two higher for the monoliths than for a conventional bubble column, emphasizing the superiority of monoliths for carrying out fast reactions. When the kLa/εG values shown in Fig. 5.8(c) are compared with those in Fig. 4.11(c) of chapter 4, the values for the airlift and bubble column appear much lower. This is largely due to the difference in gas distributors employed in the reactors. For the reactors from which the data in Fig. 4.11(c) were obtained, a perforated plate distributor was used with holes of 0.5 mm. This resulted in smaller bubbles for a given gas velocity in comparison with the 0.9-mm-diameter holes on the stainless steel capillaries employed for the data in Fig. 5.8(c). Interestingly, kLa/εG for the square-channel monolith improved slightly taking on a constant value of 0.85 s-1 for UG > 0.03 m/s, compared to 0.76 s-1 for the data in Fig. 4.11(c). Therefore, the monolith loop reactor appears to be less influenced by the gas distributor type employed than the bubble column and airlift. Yet, uniform distribution of gas and liquid into the monolith channels is of paramount importance in ensuring optimal performance.
The application of low frequency vibrations improves kLa/εG, suggesting that there is an enhancement in the mass transfer coefficient, kL. It is also likely that by causing bubbles to undergo volume pulsations, vibrations also enhance mass transfer by the creation of more
97

Chapter 5 Upflow Monolith Loop Reactor: Vibration Excitement
frequently renewed gas-liquid interfacial areas than would have been the case without vibrations.
Superficial gas velocity, UG /[m/s]
0.00 0.05 0.10 0.15
Gas
hol
dup,
εG /[
-]
0.00
0.05
0.10
0.15
0.20
0.25Monolith (circular)Monolith (square)AirliftBubble column
Superficial gas velocity, UG /[m/s]
0.00 0.05 0.10 0.15
k La /[
s-1]
0.00
0.05
0.10
0.15
Monolith (circular)Monolith (square)AirliftBubble column
Superficial gas velocity, UG /[m/s]
0.00 0.05 0.10 0.15
k La/ε
G /[
s-1]
0.0
0.5
1.0
1.5Monolith (circular)Monolith (square)AirliftBubble column
Superficial gas velocity, UG /[m/s]
0.00 0.05 0.10 0.15
k La
/[s-1
]
0.00
0.05
0.10
0.15
0.20
0.25Monolith (circular)Monolith (square)AirliftBubble column
Superficial gas velocity, UG /[m/s]
0.00 0.05 0.10 0.15
k La/
ε G /[
s-1]
0.0
0.5
1.0
1.5
2.0
2.5Monolith (circular)Monolith (square)AirliftBubble column
(a) (d)
Superficial gas velocity, UG /[m/s]
0.00 0.05 0.10 0.15
Gas
hol
dup,
εG /[
-]
0.00
0.05
0.10
0.15
0.20
0.25
Monolith (circular)Monolith (square)AirliftBubble column
(b) (e)
(c) (f)
without vibrations
without vibrations
without vibrations
with vibrations:λ = 0.5 mm; f = 60 Hz
with vibrations:λ = 0.5 mm; f = 60 Hz
with vibrations:λ = 0.5 mm; f = 60 Hz
Figure 5.8: Influence of variation in superficial gas velocity, UG on (a) gas holdup, εG, (b) volumetric mass transfer coefficient, kLa and (c) kLa/εG in each of the four reactor configurations investigated without vibrations. Influence of a variation in superficial gas velocity, UG on (d) gas holdup, εG, (e) volumetric mass transfer coefficient, kLa and (f) kLa/εG for the case with vibrations, with λ = 0.5 mm
and f = 60 Hz.
98

Chapter 5 Upflow Monolith Loop Reactor: Vibration Excitement
froth
monolith
(a) (b)
froth
(c) (d) Figure 5.9: Gas bubbles leaving the gas distributor into the channels of the square-channel monolith reactor at (a) UG = 0.02 m/s without vibration, (b) UG = 0.02 m/s with vibration; λ = 0.5 mm, f = 60
Hz, (c) UG = 0.09 m/s without vibration and (d) UG = 0.09 m/s with vibration; λ = 0.5 mm, f = 60 Hz. Observe the froth created by the rising gas bubbles when the liquid phase is vibrated.
In order to understand the gas holdup and mass transfer characteristics of circular and square monoliths, studies were carried out to determine the unit cell lengths, LUC and bubble rise velocities, Vb in the single capillaries described earlier, for various superficial gas velocity, UG and superficial liquid velocity, ULR values as encountered in the monolith loop reactors. The Taylor bubble rise velocities from the single capillary experiments are plotted against (UG + ULR) in Fig. 5.10(a). The Taylor bubble rise velocity is seen to be 10 % higher than the sum of the superficial gas and liquid velocities inside the capillaries, (UG + ULR). The relation Vb = 1.1(UG + ULR) provides and accurate estimate of the Taylor bubble rise velocity within the channels. The unit cell length, LUC is shown as a function of (UG + ULR) in Fig. 5.10(b).
Knowledge of the Taylor bubble rise velocity and unit cell length allows for the estimation of the volumetric mass transfer coefficient based on the model of van Baten and Krishna,7 developed using computational fluid dynamics (CFD) as a basis. This model, described in section 4.5 of chapter 4, assumes two main contributions to gas-liquid mass transfer from Taylor bubbles: (1) from the caps at either end of the bubble, assumed to be hemispherical, (2) from the liquid film surrounding the bubble. The volumetric mass transfer coefficient, kLa is the sum of the cap and film contributions. The film contribution to mass transfer is given by:
99

Chapter 5 Upflow Monolith Loop Reactor: Vibration Excitement
GLL,film film
film c
4Ðk at d
επ
⎛ ⎞= ⎜
⎝ ⎠⎟ (5.2)
where tfilm, the contact time of the liquid film with the rising Taylor bubble, can be estimated as tfilm = LUCεG/Vb. The calculations of the film contribution to gas-liquid mass transfer using Eq. (5.2) with Vb and LUC estimated from the single capillary experimental data, are shown in Fig. 5.10(c). For these kL,filmafilm calculations, the experimentally determined values of the gas holdup in the monolith channels were used. Also, the comparison is made with the no-vibrations kLa in both the circular- and square-channel monolith loop reactors.
(UG + ULR) /[m/s]
0.0 0.1 0.2 0.3 0.4 0.5Tayl
or b
ubbl
e ris
e ve
loci
ty in
cap
illar
y, V
b /[m
/s]
0.0
0.1
0.2
0.3
0.4
0.5
1.1 (UG + ULR)CircularSquare
(UG + ULR) /[m/s]
0.10 0.20 0.30 0.40 0.50
Uni
t cel
l len
gth,
LU
C /[
m]
0.00
0.01
0.02
0.03
0.04
0.05
0.06
CircularSquare
Calculated film transfer coefficient, kL,filmafilm /[s-1]
0.00 0.05 0.10 0.15 0.20Volu
met
ric m
ass
trans
fer c
oeffi
cien
t, k L
a /[s
-1]
0.00
0.05
0.10
0.15
0.20ParityCircularSquare
(a) (b)
(c)
Single capillaryexperiments
Single capillaryexperiments
Figure 5.10: (a) Dependence of Taylor bubble rise velocity, Vb on (UG + ULR) for circular and square capillaries of 3-mm diameter. (b) Unit cell lengths in 3-mm single capillaries of circular and square
cross sections as a function of (UG + ULR). (c) Comparison of the experimentally determined volumetric mass transfer coefficients, kLa in the monolith loop reactors with the predictions obtained using the van Baten and Krishna model. The hydrodynamic data on Vb and LUC were those obtained
from the single-channel experiments.
100

Chapter 5 Upflow Monolith Loop Reactor: Vibration Excitement
A reasonably good agreement is obtained between the experimental kLa values and the calculated film contribution, kL,filmafilm, especially for the square-channel monolith loop reactor. This is in excellent agreement with the findings presented in chapter 4, buttressing the point that the film contribution to gas-liquid mass transfer is dominant in the channels of the monolith. However, calculations using the Berčič and Pintar correlation8 yielded kLa predictions that are about a factor 2.5 higher than the experimental values obtained in the monolith loop reactors without vibration. A possible reason for this discrepancy is that the Berčič-Pintar correlation was developed using experiments in which very large unit cells lengths, up to 0.22 m, were realized. In the experiments presented in this chapter, unit cell lengths were typically in the 0.01- 0.06 m range. Closer attention is given to this discrepancy in chapter 7.
5.5 CONCLUSIONS
From the study of the hydrodynamics and mass transfer characteristics of monolith loop reactors carried out, and comparisons made with an internal loop airlift reactor and a bubble column, the following conclusions can be drawn:
(1) The volumetric mass transfer coefficient per unit volume of dispersed gas bubbles, kLa/εG, is significantly higher for monolith loop reactors than for airlift reactors and bubble columns. This improvement can be attributed to the superior mass transfer characteristics of Taylor flow in the narrow channels of monoliths.
(2) Application of low frequency vibrations (with amplitude, λ = 0.5 mm and frequency, f = 60 Hz) has the effect of significantly improving kLa/εG for all four reactor configurations studied. For the monolith loop reactors, vibrations have the beneficial effect of improving the gas-liquid distribution through the channels.
(3) Both the gas and liquid superficial velocities within the monolith channels influence the hydrodynamics, i.e. Taylor bubble rise velocity and unit cell length. The knowledge of these parameters is essential to the estimation of gas-liquid mass transfer from Taylor bubbles.
(4) The kLa values for the monolith loop reactors, without vibration excitement, can be estimated to a reasonable degree of accuracy using the model developed by van Baten and Krishna,7 with the additional assumption that the film contribution is dominant.
NOTATION a gas-liquid interfacial area per unit volume of dispersion; except for the bubble
column, the dispersion within the riser section is considered, m2/m3
CL liquid phase oxygen concentration, mol/m3 or arbitrary units
101
Chapter 5 Upflow Monolith Loop Reactor: Vibration Excitement
CLD liquid phase oxygen concentration in the downcomer, mol/m3 or arbitrary units
Csensor liquid phase oxygen concentration indicated by the sensor, arbitrary units dc dimension of capillary or monolith channel, m ÐL liquid phase diffusivity of oxygen, m2/s f vibration frequency, Hz H total dispersion height, m Htracer distance traveled by tracer in downcomer liquid velocity experiments, m kL liquid side mass transfer coefficient, m/s ksensor oxygen sensor time constant, s-1
LUC unit cell length, m tfilm contact time of liquid film with Taylor gas bubble, s UG superficial gas velocity; for airlift, with regard to the riser cross section; for
monoliths, with regard to the cross sectional area available for flow in the riser; for bubble column, with regard to the column cross section, m/s
ULD downcomer superficial liquid velocity, m/s ULR riser or single capillary superficial liquid velocity, m/s Vb Taylor bubble rise velocity, m/s Greek Symbols εG gas holdup in the riser; for bubble column, gas holdup in the column,
dimensionless λ amplitude of vibration, mm Subscripts and Superscripts film refers to the liquid film surrounding a Taylor bubble 0 initial condition * refers to saturation concentration
BIBLIOGRAPHY (1) Ellenberger, J.; Krishna, R. Improving mass transfer in gas-liquid dispersions by vibration excitement. Chemical Engineering Science 2002, 57, 4809-4815. (2) Ellenberger, J.; Krishna, R. Shaken, not stirred, bubble column reactors: enhancement of mass transfer by vibration excitement. Chemical Engineering Science 2003, 58, 705-710. (3) Krishna, R.; Ellenberger, J. Improving gas-liquid contacting in bubble columns by vibration excitement. International Journal of Multiphase Flow 2002, 28, 1223-1234.
102

Chapter 5 Upflow Monolith Loop Reactor: Vibration Excitement
(4) Krishna, R.; Ellenberger, J.; Urseanu, M. I.; Keil, F. J. Utilisation of bubble resonance phenomena to improve gas-liquid contact. Naturwissenschaften 2000, 87, 455-459. (5) Vandu, C. O.; Ellenberger, J.; Krishna, R. Hydrodynamics and mass transfer of monoliths, bubble columns and airlifts (with and without vibration excitement), University of Amsterdam, Available at URL http://ct-cr4.chem.uva.nl/BubbleColumnAirliftMonolith/, accessed November 2003. (6) Bjerknes, V., Fields of Force, Columbia University Press, New York, 1906. (7) van Baten, J. M.; Krishna, R. CFD simulations of mass transfer from Taylor bubbles rising in circular capillaries. Chemical Engineering Science 2004, 59, 2535-2545. (8) Berčič, G.; Pintar, A. The role of gas bubbles and liquid slug lengths on mass transport in the Taylor flow through capillaries. Chemical Engineering Science 1997, 52, 3709-3719.
103


Chapter 6 Hydrodynamics of Taylor Flow in Vertical Capillaries
Chapter 6
HYDRODYNAMICS OF TAYLOR FLOW IN VERTICAL CAPILLARIES
6.1 INTRODUCTION
Monolith reactors offer several advantages over conventionally used trickle beds and slurry bubble columns for a host of processes.1-5 These advantages, which include low-pressure drop, high gas-liquid mass transfer rates, and minimum axial dispersion, stem from the uniquely structured multichannel configuration of monoliths. In essence, a monolith block is composed of an array of uniformly structured parallel channels, often of square or circular geometry, typically having hydraulic diameters between 1 and 5 mm. Thus, the monolith can be viewed as a structure that is comprised of many repeating building blocks, where the basic building block is a single channel. It can be argued that data obtained from studies on a single channel, or what may be called a capillary, can be used in scaling up a monolith reactor, provided that a uniform gas and liquid distribution (such as that obtained) occurs in the monolith bundle.6 Certain multiphase flow characteristics in capillaries have been studied by several investigators, such as gas-liquid flow hydrodynamics,2, 7-10 mass transfer2, 11-14 and reaction rates.15, 16 These studies were generally performed in the Taylor flow regime, which has been reported to be an effective regime for the operation of monolith reactors. Taylor flow, which is also known as slug flow or bubble train flow, is characterized by the presence of elongated gas bubbles with lengths greater than the capillary diameter, which rise along the capillary separated from each other by liquid slugs. The gas bubbles occupy most of the capillary cross section, separated from the channel wall by a thin liquid film. This flow arrangement has been reported to yield superior mass transfer performance.7
In addition to being a much sought after regime in the operation of monolith reactors, the Taylor flow regime is also finding increasing application in microfluidic devices, used in the synthesis of nanoparticles, for biochemical analysis and other biological and pharmaceutical applications. Günther et al.,17 for instance, report on the use of Taylor flow (referred to as segmented gas-liquid flow) in a 0.4-mm-wide, 0.15-mm-deep microfluidic device to achieve efficient mixing between two miscible liquid streams. According to their study, the recirculation motion in the liquid slugs of segmented gas-liquid flow enhances advection in straight microchannels without requiring additional fabrication steps, and leading to a 2 to 3-fold reduction in the mixing length when compared to chaotic micromixers often used. The advantages of Taylor flow in nanoparticle synthesis was further demonstrated with the production of silica particles by the Stöber process,18 where it was shown that the enhanced mixing and narrower liquid phase RTD in Taylor flow, when compared to single-
105

Chapter 6 Hydrodynamics of Taylor Flow in Vertical Capillaries
phase laminar flow, results in silica particles of uniform size. In contrast, the use of single-phase laminar flow results in silica particles of a wide size variation.
Within the past decade, several two-phase capillary studies have focused on one or more of flow regimes, bubble velocity and pressure drop. Many of these investigations, which involved the use of horizontal capillaries, were limited to air-water systems19-22 and were geared toward a better understanding of two-phase flow parameters for practical applications in compact heat exchangers, as well as refrigeration and air conditioning systems. Other flow regime, bubble velocity and pressure drop investigations have involved the use of vertically positioned capillaries.23-25 Few investigators have used liquids other than water.2, 7, 9, 26 Taking stock of the various studies that have been undertaken, one observes that limited data are available for capillaries of varying geometry and for fluids with surface tension and viscosity values that differ from those of water.
The objective of the present investigation is the systematic study of the hydrodynamics of gas-liquid flow in vertical capillaries of circular and square cross sections and the development of correlations for the prediction of related flow parameters such as bubble rise velocity, liquid slug length and pressure drop. Air was used as the gas phase, with water, ethanol or an oil mixture being used as the liquid phase. The gas and liquid superficial velocities were varied in the range of 0.008-1 m/s. Within this range, a broad spectrum of flow regimes was encountered. However, particular interest would be focused on the Taylor flow regime, in view of understanding its significance to monolith reactor applications.
6.2 EXPERIMENTAL SECTION
A schematic representation of the experimental setup is depicted in Fig. 6.1. It consists of (1) a capillary setup, (2) an image recording and analysis system and (3) a pressure drop measurement system. The capillary setup is composed of a vertically mounted, 1.4-m-long, single Pyrex glass capillary. Gas and liquid were fed to the bottom of the capillary through a 3-mm-diameter polyvinyl chloride (PVC) tee connection, as shown in Fig. 6.2. Five different capillaries were used in the experiments, and the capillary dimensions and an overview of the experimental systems studied are shown in Table 6.1. Air was used as the gas phase in all experiments, with the liquid phase being demineralized water, ethanol or an oil mixture that was a miscible blend of a light paraffin oil (viscosity of µL = 2.9 mPa s, surface tension of σ = 28 mN/m) and a very viscous hydrocarbon oil (µL = 75 mPa s, σ = 28 mN/m) in a volume ratio of 1:2. All experiments were conducted at room temperature and atmospheric pressure. Physical properties of the liquids used are given in Table 6.2. Liquid densities were determined using a density meter (PAAR model DMA 35, Austria). Liquid viscosities and surface tensions were measured using a Ubbelohde viscosity meter and by the capillary method, respectively. During experiments, compressed air was fed through a pre-calibrated float-type gas flowmeter to the tee connection. Two manually operated control valves were used to regulate the gas flow rate. The first of these valves was placed between the compressed air flow line and the flowmeter and was set to give a constant gauge pressure
106

Chapter 6 Hydrodynamics of Taylor Flow in Vertical Capillaries
of 30 kPa. The second valve, which was placed between the gas flowmeter and the tee connection, was solely used to regulate the volumetric gas flow rate into the capillary.
gas flowmeter
liquid flowmeter
high-speed camera
memory box
CRT display
PC
gas in liquid in
capillary
disengagementzone
tee junctioncontrol valvecontrol valve
gas bubble
+ -
1.4
m40
mm
33 mm
P
1
voltmeter
1
control valve
pressure transducer
Ä
Figure 6.1: Schematic representation of the experimental setup.
Liquid was fed from an elevated 10-L storage vessel into a pre-calibrated liquid flowmeter with the flow rate also adjusted through the use of a manually operated valve. Gravity provided the driving force for the flow of liquid from the storage vessel into the liquid flowmeter. The liquid flowmeter was a float-type flowmeter that had been installed upstream of the tee connection. The gas-liquid flow stream arrangement allowed for an independent alteration of the gas and liquid flow rates. Liquid was discharged from the capillary into a 33-mm-wide, 40-mm-high disengagement zone. The height of liquid in the disengagement zone was ~8 mm.
107
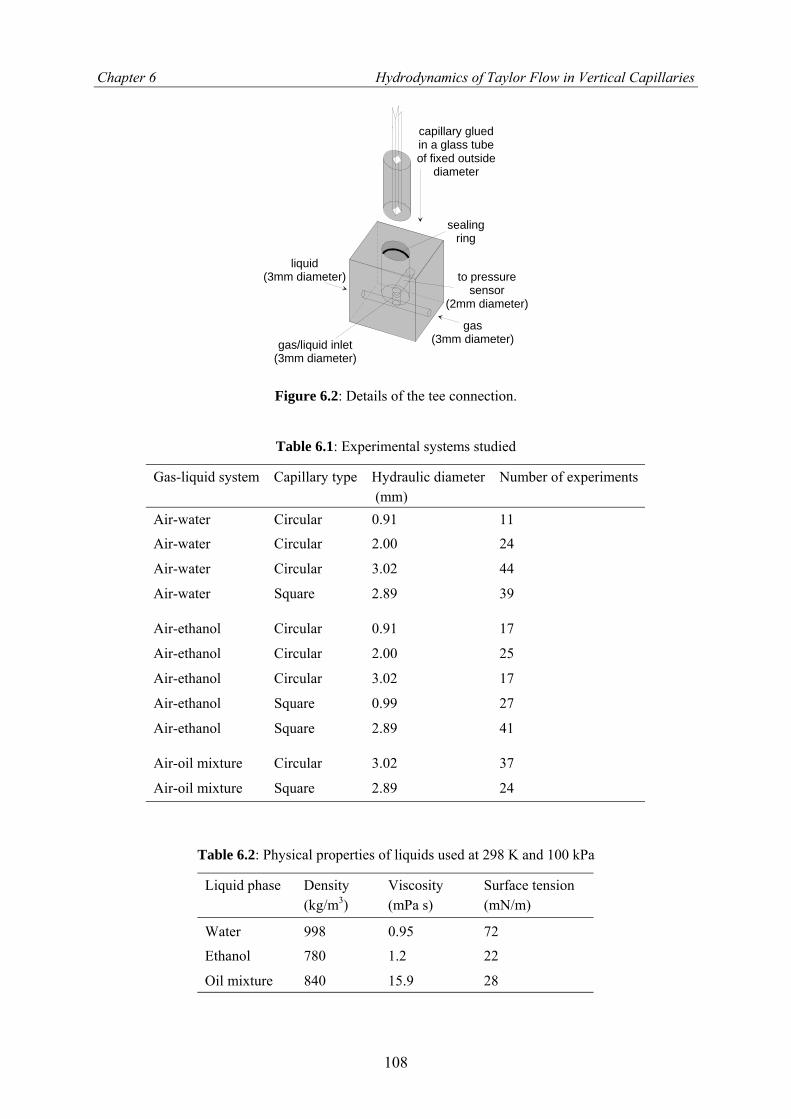
Chapter 6 Hydrodynamics of Taylor Flow in Vertical Capillaries
gas(3mm diameter)
liquid(3mm diameter)
capillary gluedin a glass tube of fixed outside
diameter
to pressuresensor
(2mm diameter)
sealingring
gas/liquid inlet(3mm diameter)
Figure 6.2: Details of the tee connection.
Table 6.1: Experimental systems studied
Gas-liquid system Capillary type Hydraulic diameter (mm)
Number of experiments
Air-water Circular 0.91 11
Air-water Circular 2.00 24
Air-water Circular 3.02 44
Air-water Square 2.89 39
Air-ethanol Circular 0.91 17
Air-ethanol Circular 2.00 25
Air-ethanol Circular 3.02 17
Air-ethanol Square 0.99 27
Air-ethanol Square 2.89 41
Air-oil mixture Circular 3.02 37
Air-oil mixture Square 2.89 24
Table 6.2: Physical properties of liquids used at 298 K and 100 kPa
Liquid phase Density (kg/m3)
Viscosity (mPa s)
Surface tension (mN/m)
Water 998 0.95 72
Ethanol 780 1.2 22
Oil mixture 840 15.9 28
108

Chapter 6 Hydrodynamics of Taylor Flow in Vertical Capillaries
The image recording system consists of a Photron Fastcam-ultima 40K high-speed video camera, a memory box and a CRT monitor display. The high-speed camera system was used for flow regime observations and bubble rise velocity measurements. Video movies captured by the high-speed camera were instantaneously stored in the memory box. The camera could be set to capture movies at rates of 30-4,500 frames per second (fps) in full-frame mode and 9,000-40,500 fps in segmented-frame mode. The CRT display showed, in real time, what was viewed through the high-speed camera. Data from the memory box were transferred to a personal computer (PC) for later analysis. During the experiments, the high-speed camera was positioned midway along the capillary height with its focus adjusted in such a way that it captured rising air bubbles and liquid slugs within a distance of 0.035-0.2 m, depending on the particular operating gas and liquid velocities. After steady state was achieved, movies were made for a certain time span, which varied with bubble velocity, at capture rates of 250-4,500 fps, depending on the gas and liquid velocities, to obtain suitable movie time intervals. By performing a frame-by-frame analysis of each movie, the bubble frequency, fb, which is defined as the number of bubbles that traverse a given point in the capillary per unit time, was determined. The bubble rise velocity, Vb was also determined from the movies by registering the time required for a gas bubble to rise a known distance along the capillary height. Each Vb value reported is an average of three to five values that were taken. Nevertheless, hardly any of the values differed from the mean by > 4 %, indicating that flow was steady. With the bubble rise velocity known, the gas holdup, εG was determined as follows:
GG
b
UV
ε = (6.1)
where UG is the superficial gas velocity.
In the Taylor flow regime of a vertical upflow capillary, a gas bubble rises along the capillary height sandwiched between liquid slugs. Between the gas bubble and the wall of the capillary is a thin downflowing liquid film. We define a unit cell as consisting of a gas bubble and the accompanying liquid slug beneath it. Furthermore, it is assumed that, on average, all unit cells have the same length. The average unit cell length, LUC can be estimated from:
bUC
b
VLf
= (6.2)
Assuming that the volume of liquid in the film between the gas bubble and capillary wall is negligible, the average liquid slug length, Lslug can be estimated from the relationship:
(slug UC G1L L )ε= − (6.3)
109
Chapter 6 Hydrodynamics of Taylor Flow in Vertical Capillaries
The pressure drop in the capillary was measured using a differential pressure transducer. Two liquid taps, at the base and top of the capillary, were connected to pressure ports on a Validyne DP15 pressure transducer, which was, in turn, connected to an analog-to-digital converter card on a PC via a voltmeter (refer to Fig. 6.1). For each liquid used, a calibration curve showing the linear relationship between pressure difference and the voltmeter readings was made. When the capillary was full of a stationary liquid phase, the pressure difference was zero (provided that the same liquid as that used in the capillary also fills the tubes that are connected to the pressure transducer) with a zero voltage reading displayed on the voltmeter as well as being fed to the PC. When only air was present in the capillary, however, pressure difference became equal to the 1.4-m height of the liquid in the tubes that were connected to the pressure transducer. In this case, the span of the voltmeter was set to 10 V. During experiments, pressure drop measurements were performed for a couple of minutes at a sampling frequency of 10 Hz. The experimental system was tested by comparing experimental liquid-only frictional pressure drop data with theoretical frictional pressure drops for laminar flow. For single-phase laminar flow in a vertical capillary, the total pressure drop, ∆PT is composed of two contributions: (1) the pressure drop due to frictional effects of the liquid flow, ∆Pf and (2) the hydrostatic pressure drop of the liquid. Experimental ∆Pf values were obtained by subtracting the hydrostatic contribution from the measured total pressure drop. The theoretical ∆Pf value was computed, noting that, for laminar flow, the Fanning friction factor, fL is related to the liquid-phase Reynolds number, ReL by the relation:
LL
CfRe
= (6.4)
where C is a constant that is dependent on channel geometry and has values of 14.2 and 16 for square and circular channels, respectively. The Fanning friction factor is related to the frictional pressure drop by the relation:
( )f c
L 2L L c
/1 4 /2
P LfU dρ∆
= (6.5)
where dc and Lc are the diameter and length of the capillary, UL is the superficial liquid velocity and ρL is the liquid density. Fig. 6.3 shows the experimental single-phase frictional pressure drop with predictions obtained using the fL values for laminar flow. A very good agreement is obtained, verifying the accuracy of the setup and also helping to ascertain that inlet and outlet effects are negligible.
110

Chapter 6 Hydrodynamics of Taylor Flow in Vertical Capillaries
Reynolds number, ReL /[-]
0 500 1000 1500
Fric
tiona
l pre
ssur
e dr
op, ∆
Pf
/[kPa
]
0.0
0.5
1.0
1.5
2.0
ExperimentalTheoretical
Reynolds number, ReL /[-]
0 200 400 600 800 1000
Fric
tiona
l pre
ssur
e dr
op, ∆
P f /
[kPa
]
0
2
4
6
8
10
ExperimentalTheoretical
Reynolds number, ReL /[-]
0 50 100 150
Fric
tiona
l pre
ssur
e dr
op, ∆
Pf
/[kPa
]
0
2
4
6
8
10
12
ExperimentalTheoretical
(a) (b)
(c)
2.89-mm square Water
0.99-mm square Ethanol
2-mm circular Ethanol
Figure 6.3: Experimental and theoretical single-phase frictional pressure drop for the (a) 2.89-mm square capillary (water), (b) 2-mm circular capillary (ethanol) and. (c) 0.99-mm square capillary
(ethanol).
6.3 RESULTS AND DISCUSSION
TWO-PHASE FLOW REGIMES
Typical images of flow regimes observed during experiments are shown in Fig 6.4 for air-water, air-ethanol and air-oil mixture systems in the 3.02-mm-diameter circular capillary. A total of five distinct flow patterns were observed and are labeled bubbly flow, Taylor flow, slug-bubbly flow, churn flow and annular flow. A basic description of each flow regime follows.
Bubbly Flow Regime: This flow pattern typically occurs at relatively high liquid velocities and low gas velocities. It is characterized by the presence of fast rising bubbles with diameters less than or equal to the capillary diameter. The bubbles are often spherical or spheroidal in shape. Gas holdups are generally very low in this regime.
111

Chapter 6 Hydrodynamics of Taylor Flow in Vertical Capillaries
(i) (ii) (iii) (iv) (v)
air-water
air-oil mixture
air-ethanol
(i) (ii) (iii) (iv) (v)
air-water
air-oil mixture
air-ethanol
Figure 6.4: Flow regimes encountered during the experiments carried out for air-water, air-ethanol and air-oil mixture. Regimes shown are (i) bubbly, (ii) slug-bubbly, (iii) Taylor, (iv) churn and (v)
annular flow. High-speed video recordings of the various flow regimes can be viewed online.27
Taylor Flow Regime: Also known as slug flow or bubble train flow, Taylor flow consists of gas bubbles with lengths greater than the tube diameter that move along the capillary separated from each other by liquid slugs. Depending on the gas and liquid flow rates and properties, the bubbles often have hemispherically shaped tops and flattened bottoms.
Slug-Bubbly Flow Regime: This is a transition regime that occurs between bubbly and Taylor flows. Similar to that observed in Taylor flow, bubble slugs are present, separated from each other by liquid slugs. However, in the slug-bubbly regime, small bubbles are also present in the liquid slugs; this is a feature that is not observed in Taylor flow. The transition from Taylor flow to slug-bubbly flow occurs by increasing the liquid flow rate with the gas flow rate being kept constant.
Churn Flow Regime: Churn flow occurs at very high gas velocities. It consists of very long gas bubbles and relatively small liquid slugs. Because of the high gas velocity, a wave or ripple motion is often observed in the liquid slug. Further increases in gas flow rate result in annular flow.
112

Chapter 6 Hydrodynamics of Taylor Flow in Vertical Capillaries
Annular Flow Regime: At excessively high gas velocities and very low liquid velocities, annular flow results. Here, a continuous gas phase is present in the central core of the capillary with the liquid phase being displaced to form an annulus between the capillary wall and the gas phase.
These flow regimes are what may be called “clear-cut” regimes, because they are easily identifiable. Other investigators have observed somewhat similar patterns in vertical and horizontal capillaries.19, 23, 25, 28 A degree of complexity becomes involved when identifying flow patterns that fail to fall into any of the typical regimes depicted in Fig. 6.4. Such patterns can be expected to occur when transitioning from one regime to another, and, in such cases, the discretion of the investigator is heavily relied upon. The slug-bubbly flow regime was not observed for the viscous oil mixture used in this study. Annular flow was not encountered within the range of gas and liquid superficial velocities for which experimental data are presented. Also, all experimental liquid slug lengths reported in this work are for the Taylor flow regime. Movies of the flow regimes depicted in Fig. 6.4 can be viewed online.27
The flow regime map for the 3.02-mm-diamter circular capillary air-water system obtained from the experiments that have been performed is shown in Fig. 6.5, with the superficial gas and superficial liquid velocities as the x- and y-axes. Furthermore, comparisons are made with some flow regime maps available in the literature. Zhao and Bi25 studied flow regimes in vertical triangular capillaries for co-current upward air-water two-phase flow. Their experimental data for a 2.886-mm hydraulic diameter capillary is presented for comparison of the bubbly-slug and slug-churn transitions. As can be seen, the slug-churn transition occurs at very close superficial gas and liquid velocities in both capillaries. However, a significant difference exists in the bubbly-slug transition, a discrepancy that could largely be due to the different gas-liquid distributors used. Although a tee gas-liquid inlet was used in this study, they used a fine plastic-packed porous mixer to ensure that the gas and liquid were well mixed before entering the capillary.
Superficial gas velocity, UG /[m/s]
0.001 0.01 0.1 1 10
Supe
rfici
al li
quid
vel
ocity
, UL /
[m/s
]
0.001
0.01
0.1
1
10
TaylorSlug-bubblyBubblyChurnBubbly-slug transition by theory (Suo, 1964)Bubbly-slug transition by theory (Mishima, 1984)Bubbly-slug transition by data (Zhao, 2001)Slug-churn transition bytheory (Mishima, 1984)Slug-churn transition by data (Zhao, 2001)
3.02-mm circularAir-water
Figure 6.5: Flow regime map for the 3.02-mm circular capillary air-water system.
113

Chapter 6 Hydrodynamics of Taylor Flow in Vertical Capillaries
Correlations provided by Mishima and Ishii29 for predicting flow regime transitions for upward two-phase flow in vertical capillaries are also compared with the experimental data from this study in Fig. 6.5. Neither the bubbly-slug transition nor slug-churn transition correlations predict the experimental data obtained from this study satisfactorily, with the former showing much larger deviation. Interestingly, they also found that, although these correlations predicted the experimental data of a few investigators, they were not suitable at all for predicting the experimental data of other investigators, partially attributing this to different methods of observation and definitions of flow regimes as well as the fact that transition phenomena develop gradually. The bubbly-slug transition line, based on the correlation of Suo30 from studies in a horizontally positioned capillary for air-water flow, is also depicted in Fig. 6.5. It qualitatively predicts the trend for transition from the bubbly to slug (Taylor) flow regime.
GAS HOLDUP AND BUBBLE RISE VELOCITY
Variation of Gas Holdup and Bubble Rise Velocity
The variation of gas holdup, εG with superficial gas velocity, UG for varying superficial liquid velocities, UL is shown in Fig 6.6(a) for the 2.89-mm square capillary air-ethanol system. An increase in εG results from an increase in UG and a decrease in UL. At lower values of UL, local maximums in εG are observed. This behavior is often seen in bubble columns and is generally associated with flow regime transition. A parameter that is often used in two-phase flow analysis – called the slip ratio, S – helps provide some insight into the relationship between the observed trends in εG and flow regime transition. The slip ratio, S, which is defined as
b G G
L L G
//(1 )
V USV U
εε
= =−
(6.6)
is a measure of the relative velocity between the gas and liquid phases (where VL is the liquid phase velocity). At this point, we can speak of two main classes of flow: homogeneous and non-homogeneous flow. Based on the five different flow regimes previously discussed, it can be expected that bubbly flows are typically homogeneous, because discrete gas bubbles are entrained in a continuous liquid phase, which, provided that the liquid velocity is not too high, maintains a Hagen-Poiseuille flow pattern. On the other hand, Taylor, churn and annular flows are generally non-homogeneous, with slug-bubbly flow bordering the homogeneous and non-homogeneous regimes. From Eq. (6.6), we note that, if S ≈ 1, homogeneous flow is obtained, because, under this condition, Vb ≈ VL, which is a situation that can only occur when gas and liquid rise uniformly in the capillary with no downflow of the liquid phase. When S > 1, bubbles rise with higher velocities than the liquid phase. This
114

Chapter 6 Hydrodynamics of Taylor Flow in Vertical Capillaries
can be expected when downflow of the liquid phase occurs in the liquid film surrounding the bubbles, such as that observed in the Taylor and churn flow regimes.
Superficial gas velocity, UG /[m/s]
0.0 0.1 0.2 0.3 0.4 0.5 0.6
Gas
hol
dup,
εG /[
-]
0.0
0.2
0.4
0.6
0.8
UL=0.012 m/sUL=0.043 m/sUL=0.145 m/sUL=0.247 m/sUL=0.346 m/s
UG/UTP /[-]
0.0 0.2 0.4 0.6 0.8 1.0G
as h
oldu
p, ε
G /[
-]0.0
0.2
0.4
0.6
0.8
1.0UL=0.012 m/sUL=0.043 m/sUL=0.145 m/sUL=0.247 m/sUL=0.346 m/s
UG/UTP /[-]
0.0 0.2 0.4 0.6 0.8 1.0
Slip
ratio
, S /[
-]
1
10
100UL=0.012 m/sUL=0.043 m/sUL=0.145 m/sUL=0.247 m/sUL=0.346 m/s
(a) (b)
(c)
2.89-mm squareAir-ethanol
2.89-mm squareAir-ethanol
2.89-mm squareAir-ethanol
(d)
Superficial gas velocity, UG /[m/s]
0.001 0.01 0.1 1
Supe
rfici
al li
quid
vel
ocity
, UL /
[m/s
]
0.01
0.1
1
TaylorSlug-bubblyBubblyChurnUG/UTP=0.2UG/UTP=0.5UG/UTP=0.8
2.89-mm squareAir-ethanol
Figure 6.6: (a) Variation of gas holdup, εG with superficial gas velocity, UG and superficial liquid velocity, UL in the 2.89-mm square capillary air-ethanol system. (b) UG/UTP versus εG for the 2.89-mm
square capillary air-ethanol system at different liquid velocities. (c) Variation of slip ratio, S with UG/UTP for the 2.89-mm square capillary air-ethanol system at different liquid velocities. (d) Flow
regime map for the 2.89-mm square capillary air-ethanol system. In a nutshell, S can serve as an indication of when a two-phase flow deviates from the homogeneous flow regime. To buttress this point, Fig. 6.6(a) was re-plotted using UG/UTP and εG as coordinates in Fig. 6.6(b) and UG/UTP and S as coordinates in Fig. 6.6(c). UTP is the two-phase superficial velocity, which is defined as:
TP G LU U U= + (6.7)
From these plots, it is seen that, for UL = 0.012 m/s and UL = 0.043 m/s, both of which belong to the Taylor flow regime, deviation from homogeneous flow is most significant,
115

Chapter 6 Hydrodynamics of Taylor Flow in Vertical Capillaries
judging by the great increase in S. At higher liquid velocities, the flows gradually approach homogeneous flow, with S values approaching unity. Another characteristic of the large deviation from homogeneous flow is that it occurs at high gas holdups (εG > 0.5), as observed from a comparison of Fig. 6.6(b) and 6.6(c). For εG = 0.1-0.5, the mean S value is ~1.4. Also, the local maximums in εG shown in Fig. 6.6(a) can be attributed to the significant increase in slip between phases. In Fig. 6.6(d), the flow regime map for the system is shown; lines that correspond to UG/UTP values of 0.2, 0.5 and 0.8 are also depicted. From this map, it is clear that the increase in S occurs near the churn flow regime and in the Taylor flow regime. The high S operation is predominantly in the Taylor flow regime, whereas a constant S value is observed in the bubbly and slug-bubbly flow regimes.
Plots of two-phase superficial velocity versus the bubble rise velocity are shown in Fig. 6.7, to demonstrate the effect of certain operating parameters and conditions on the bubble rise velocity. Fig 6.7(a) shows that a linear dependence exists between UTP and Vb. Moreover, although Vb shows a strong dependence on UTP (i.e., the combined gas and liquid superficial velocities), it shows no dependence on the individual gas and liquid superficial velocities. The effect of capillary geometry on bubble rise velocity is shown in Fig. 6.7(b), using air-water data for the 2.89-mm square and 3.02-mm circular capillaries. All data points seem to collapse to a single line, indicating the negligible effect of capillary geometry on bubble rise velocity. Data from the 0.91-mm and 3.02-mm circular capillaries for the air-ethanol system are plotted in Fig. 6.7(c), to understand the effect of capillary scale on bubble rise velocity. From this plot, bubbles seem to rise more slowly in the smaller-diameter capillary. This is likely due to an increase in surface tension effect with a decrease in capillary size. In Fig. 6.7(d), the effect of liquid viscosity on bubble rise velocity is explored using data from the 3.02-mm circular capillary for air-ethanol and air-oil mixture systems. The oil mixture has a viscosity that is 13 times greater than that of ethanol, whereas the two liquids have similar surface tension values (refer to Table 6.2) The higher the liquid viscosity, the higher the bubble rise velocity for the same UTP. A similar result was reported by Kreutzer2 for a 2.3-mm-diameter circular capillary with air and tetradecane as the gas and liquid phases. Tetradecane has a viscosity that is 3 times greater than that of water. The effect of surface tension is depicted in Fig. 6.7(e) for air-ethanol and air-water systems in the 2-mm-diameter circular capillary. Ethanol has a surface tension that is approximately a third of that for water, whereas both liquids have approximately the same viscosity (refer to Table 6.2). This plot shows that the surface tension effect only seems noticeable for UTP > 0.6 m/s, where the higher surface tension liquid results in a lower bubble rise velocity, although this effect seems to be only slightly pronounced.
116

Chapter 6 Hydrodynamics of Taylor Flow in Vertical Capillaries
Two-phase superficial velocity, UTP /[m/s]
0.0 0.2 0.4 0.6 0.8 1.0
Bubb
le ri
se v
eloc
ity, V
b /[m
/s]
0.0
0.2
0.4
0.6
0.8
1.0
UL=0.012 m/sUL=0.043 m/sUL=0.145 m/sUL=0.247 m/sUL=0.346 m/s
2.89-mm squareAir-ethanol
Two-phase superficial velocity, UTP /[m/s]
0.0 0.5 1.0 1.5
Bubb
le ri
se v
eloc
ity, V
b /[m
/s]
0.0
0.2
0.4
0.6
0.8
1.0
1.2
1.4
2.89-mm square 3.02-mm circular
Air-water
Two-phase superficial velocity, UTP /[m/s]
0.0 0.2 0.4 0.6 0.8 1.0
Bubb
le ri
se v
eloc
ity, V
b /[m
/s]
0.0
0.2
0.4
0.6
0.8
1.0
0.91-mm circular 3.02-mm circular
Air-ethanol
(a) (b)
(c)
Two-phase superficial velocity, UTP /[m/s]
0.0 0.2 0.4 0.6 0.8 1.0
Bubb
le ri
se v
eloc
ity, V
b /[m
/s]
0.0
0.2
0.4
0.6
0.8
1.0
1.2
1.4
Air-ethanolAir-oil mixture
3.02-mm circular
(d)
Two-phase superficial velocity, UTP /[m/s]
0.0 0.2 0.4 0.6 0.8 1.0
Bubb
le ri
se v
eloc
ity, V
b /[m
/s]
0.0
0.2
0.4
0.6
0.8
1.0
1.2
Air-ethanolAir-water
2-mm circular
(e)
Figure 6.7: (a) Two-phase superficial velocity, UTP versus bubble rise velocity, Vb for the 2.89-mm square capillary air-ethanol system. (b) Influence of capillary geometry on Vb, using air-water data. (c) Influence of capillary scale on Vb, using air-ethanol data. (d) Influence of liquid viscosity on Vb in the
3.02-mm circular capillary. (e) Influence of surface tension on Vb in the 2-mm circular capillary.
Correlating the Taylor Bubble Rise Velocity
Many approaches have been proposed in the literature for estimating bubble rise velocities in a capillary tube. One of these, which is similar to the drift flux model used for
117

Chapter 6 Hydrodynamics of Taylor Flow in Vertical Capillaries
studies in larger channels, involves relating the bubble rise velocity to the two-phase superficial velocity:23, 31
2b 1 TP
CV C U= (6.8) where C1 and C2 are arbitrary constants. However, these arbitrary constants are dependent on such parameters as the tube diameter and liquid properties, serving as a drawback to this method. Another method for estimating the bubble rise velocity involves conducting a mass balance about a unit cell for a fully developed Taylor flow, resulting in the relationship:
( )Lf b f b TPV V V Uε − = − (6.9) where εLf and Vf are the liquid film holdup and liquid film velocity, respectively. Based on the works of Thulasidas et al.7 and Barnea,32 independent estimations of εLf and Vf can be made from which the bubble rise velocity can, in turn, be determined. However, this approach is cumbersome, because it requires that the bubble diameter, which is a very difficult hydrodynamic parameter to measure, be estimated.
To overcome difficulties associated with estimating the bubble diameter, as well as accounting for the effect of liquid properties on bubble rise velocity, the following practical relationship was derived from the correlation of all the experimental data obtained in this study:
b0.33
TP
11 0.61
VU C
=− a
(6.10)
Ca is the capillary number, which is defined as µLUTP/σ. Fig.6.8 shows plots of experimental bubble rise velocities, as well as predictions obtained using Eq. (6.10) for capillaries of circular and square geometries and different liquids. The fits seem to be very good. The correlation given by Eq. (6.10) is valid for predicting Vb in a Ca range of 0.0002-0.39.
LIQUID SLUG LENGTH
The liquid slug length is an important hydrodynamic parameter that has been reported to have a very significant effect on gas-liquid mass transfer in capillaries.11 It has a very complicated relationship to system parameters such as the superficial gas and liquid velocities and fluid properties. To date, only a few experimental correlations for evaluating liquid slug lengths in Taylor flow are available in the literature.
118

Chapter 6 Hydrodynamics of Taylor Flow in Vertical Capillaries
Two phase superficial velocity, UTP /[m/s]
0.0 0.2 0.4 0.6 0.8 1.0
Bubb
le ri
se v
eloc
ity, V
b /[m
/s]
0.0
0.2
0.4
0.6
0.8
1.0
1.2
ExperimentalEq. (6.10)
2-mm circularAir-water
Two phase superficial velocity, UTP /[m/s]
0.0 0.2 0.4 0.6 0.8 1.0 1.2
Bubb
le ri
se v
eloc
ity, V
b /[m
/s]
0.0
0.2
0.4
0.6
0.8
1.0
1.2
1.4
1.6
ExperimentalEq. (6.10)
3.02-mm circularAir-water
Two phase superficial velocity, UTP /[m/s]
0.0 0.2 0.4 0.6 0.8
Bubb
le ri
se v
eloc
ity, V
b /[m
/s]
0.0
0.2
0.4
0.6
0.8
1.0
ExperimentalEq. (6.10)
2.89-mm squareAir-water
Two phase superficial velocity, UTP /[m/s]
0.0 0.2 0.4 0.6 0.8
Bubb
le ri
se v
eloc
ity, V
b /[m
/s]
0.0
0.2
0.4
0.6
0.8
1.0
ExperimentalEq. (6.10)
3.02-mm circularAir-ethanol
Two phase superficial velocity, UTP /[m/s]
0.0 0.2 0.4 0.6 0.8
Bub
ble
rise
velo
city
, Vb /
[m/s
]
0.0
0.2
0.4
0.6
0.8
1.0
ExperimentalEq. (6.10)
2.89-mm squareAir-ethanol
Two phase superficial velocity, UTP /[m/s]
0.0 0.1 0.2 0.3 0.4
Bub
ble
rise
velo
city
, Vb /
[m/s
]
0.0
0.1
0.2
0.3
0.4
0.5
0.6
ExperimentalEq. (6.10)
2.89-mm squareAir-oil mixture
(a) (b)
(c) (d)
(e) (f)
Figure 6.8: Experimental and predicted bubble rise velocity, Vb values for different capillary geometries and liquids used: (a) 2-mm circular capillary, air-water; (b) 3.02-mm circular capillary, air-water; (c) 2.89-mm square capillary, air-water; (d) 3.02-mm circular capillary, air-ethanol; (e)
2.89-mm square capillary, air-ethanol; and (f) 2.89-mm square capillary, air-oil mixture.
119

Chapter 6 Hydrodynamics of Taylor Flow in Vertical Capillaries
One of these, as suggested by Kreutzer2 and based on the experimental work of Heiszwolf et al.33 in a 200-cpsi monolith reactor, is:
( )L
slug 2L L0.00141 1.556 ln
εε ε
Ψ =− −
(6.11)
where Ψslug is the dimensionless liquid slug length (Ψslug = Lslug/dc) and εL is the liquid holdup. Laborie et al.9 studied gas-liquid flow in vertical capillaries and correlated the liquid slug length data using the following formula:
1.2688
slugG
13451Re Eö
⎛ ⎞Ψ = ⎜ ⎟′⎝ ⎠
(6.12)
where Re′G is a gas phase Reynolds number and Eö is the Eötvös number. From observations made during this study, as well as information available in the literature,2 the liquid slug length would also seem to be influenced by the gas-liquid feed system used. That is to say, for a given superficial gas and liquid velocity, variation in the configuration of the gas-liquid nozzle results in a change in the liquid slug length on the same setup. Such complexity makes the development of a generally applicable theoretical model for the prediction of the liquid slug length difficult. However, a correlation would be developed based on the Taylor-flow-regime experimental data obtained in this study and comparisons made with the literature correlations of Eqs. (6.11) and (6.12). As a first step in doing this, reference is made to the vertical capillary mass transfer study of Berčič et al.,11 in which the gas-liquid mass transfer coefficient, kLa is expressed as:
1.19TP
L 0.57slug
0.111Uk aL
= (6.13)
Inspection of Eq. (6.13) reveals that the relationship between kLa, UTP and Lslug can approximately be expressed as:
TPL
slug
~ Uk aL
(6.14)
kLa can in turn, be correlated to the gas phase and liquid phase Reynolds numbers. By replacing kLa with the right-hand term of Eq. (6.14), and based on the regression of experimental data, the following correlation was obtained:
0.72 0.19TPG L
slug
0.088U Re ReL
= (6.15)
120

Chapter 6 Hydrodynamics of Taylor Flow in Vertical Capillaries
Fig. 6.9 shows plots of experimentally determined liquid slug lengths at varying gas and liquid superficial velocities, as well as predicted slug lengths using Eq. (6.15). The predictions seem to be good, although noticeable deviations can be observed in a few cases. Notwithstanding, the predicted slug lengths generally follow the same trends as the experimentally measured values.
(a) (b)
(c) (d)
(e) (f)
Superficial gas velocity, UG /[m/s]
0.01 0.1 1
Liqu
id s
lug
leng
th, L
slug
/[m
]
0.001
0.01
0.1
1UL=0.029 m/sUL=0.138 m/sUL=0.309 m/sUL=0.029 m/sUL=0.138 m/sUL=0.309 m/s
2-mm circularAir-water
Superficial gas velocity, UG /[m/s]
0.001 0.01 0.1 1
Liqu
id s
lug
leng
th, L
slug
/[m
]0.001
0.01
0.1
1UL=0.009 m/sUL=0.054 m/sUL=0.159 m/sUL=0.009 m/sUL=0.054 m/sUL=0.159 m/s
3.02-mm circularAir-water
Superficial gas velocity, UG /[m/s]
0.001 0.01 0.1 1
Liqu
id s
lug
leng
th, L
slug
/[m
]
0.001
0.01
0.1
1 UL=0.008 m/sUL=0.046 m/sUL=0.136 m/sUL=0.008 m/sUL=0.046 m/sUL=0.136 m/s
2.89-mm squareAir-water
Superficial gas velocity, UG /[m/s]
0.1 1
Liqu
id s
lug
leng
th, L
slug
/[m
]
0.01
0.1
1 UL=0.036 m/sUL=0.093 m/sUL=0.167 m/sUL=0.036 m/sUL=0.093 m/sUL=0.167 m/s
0.91-mm circularAir-ethanol
Superficial gas velocity, UG /[m/s]
0.01 0.1 1
Liqu
id s
lug
leng
th, L
slug
/[m
]
0.001
0.01
0.1
1UL=0.021 m/sUL=0.124 m/sUL=0.021 m/sUL=0.124 m/s
2-mm circularAir-ethanol
Superficial gas velocity, UG /[m/s]
0.1 1
Liqu
id s
lug
leng
th, L
slug
/[m
]
0.01
0.1
1 UL=0.035 m/sUL=0.103 m/sUL=0.219 m/sUL=0.035 m/sUL=0.103 m/sUL=0.219 m/s
0.99-mm squareAir-ethanol
Figure 6.9: Experimental and predicted liquid slug length, Lslug as a function of superficial gas and liquid velocities: (a) 2-mm circular capillary, air-water; (b) 3.02-mm circular capillary, air-water; (c) 2.89-mm square capillary, air-water; (d) 0.91-mm circular capillary, air-ethanol; (e) 2-mm circular
capillary, air-ethanol; and (f) 0.99-mm square capillary, air-ethanol. The closed shapes are experimental data points, whereas the lines represent predicted values using Eq. (6.15).
121
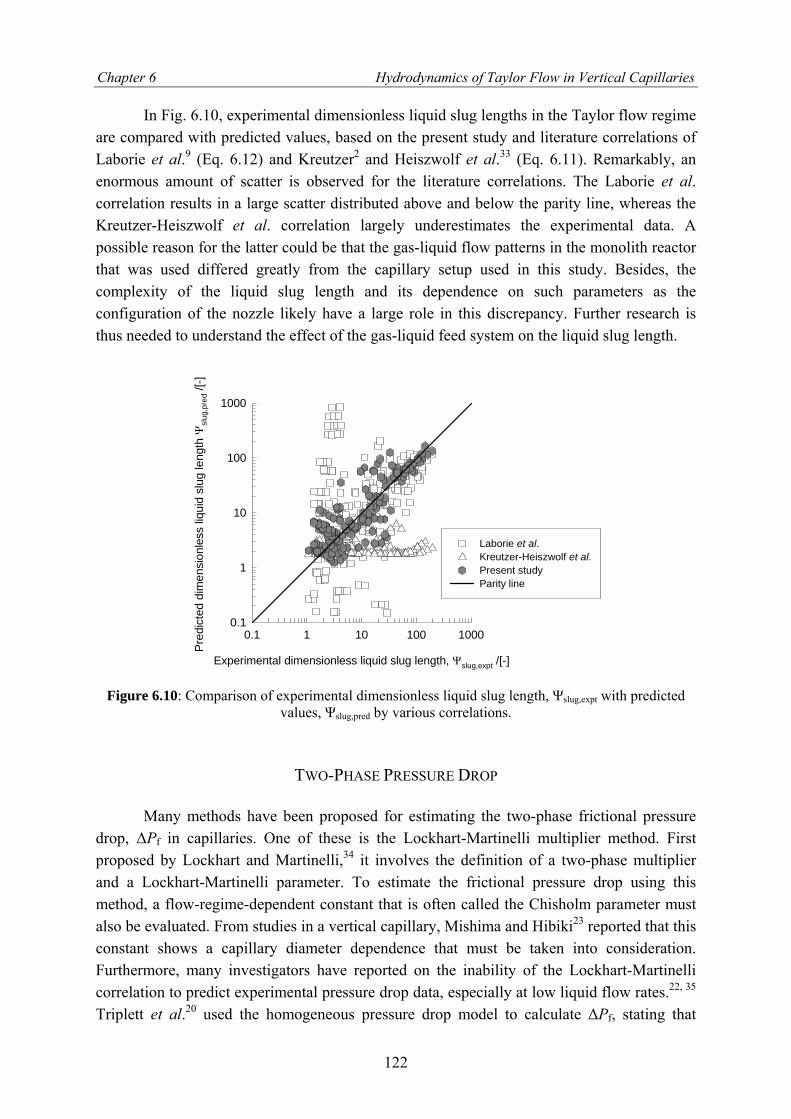
Chapter 6 Hydrodynamics of Taylor Flow in Vertical Capillaries
In Fig. 6.10, experimental dimensionless liquid slug lengths in the Taylor flow regime are compared with predicted values, based on the present study and literature correlations of Laborie et al.9 (Eq. 6.12) and Kreutzer2 and Heiszwolf et al.33 (Eq. 6.11). Remarkably, an enormous amount of scatter is observed for the literature correlations. The Laborie et al. correlation results in a large scatter distributed above and below the parity line, whereas the Kreutzer-Heiszwolf et al. correlation largely underestimates the experimental data. A possible reason for the latter could be that the gas-liquid flow patterns in the monolith reactor that was used differed greatly from the capillary setup used in this study. Besides, the complexity of the liquid slug length and its dependence on such parameters as the configuration of the nozzle likely have a large role in this discrepancy. Further research is thus needed to understand the effect of the gas-liquid feed system on the liquid slug length.
Experimental dimensionless liquid slug length, Ψslug,expt /[-]
0.1 1 10 100 1000
Pred
icte
d di
men
sion
less
liqu
id s
lug
leng
th Ψ
slug
,pre
d /[-]
0.1
1
10
100
1000
Laborie et al.Kreutzer-Heiszwolf et al.Present studyParity line
Figure 6.10: Comparison of experimental dimensionless liquid slug length, Ψslug,expt with predicted values, Ψslug,pred by various correlations.
TWO-PHASE PRESSURE DROP
Many methods have been proposed for estimating the two-phase frictional pressure drop, ∆Pf in capillaries. One of these is the Lockhart-Martinelli multiplier method. First proposed by Lockhart and Martinelli,34 it involves the definition of a two-phase multiplier and a Lockhart-Martinelli parameter. To estimate the frictional pressure drop using this method, a flow-regime-dependent constant that is often called the Chisholm parameter must also be evaluated. From studies in a vertical capillary, Mishima and Hibiki23 reported that this constant shows a capillary diameter dependence that must be taken into consideration. Furthermore, many investigators have reported on the inability of the Lockhart-Martinelli correlation to predict experimental pressure drop data, especially at low liquid flow rates.22, 35 Triplett et al.20 used the homogeneous pressure drop model to calculate ∆Pf, stating that
122

Chapter 6 Hydrodynamics of Taylor Flow in Vertical Capillaries
predictions were good in the bubbly and Taylor flow regimes at high ReL, where, as claimed, the homogeneous flow assumption is applicable. However, significant deviations were reported for slug-annular flow, annular flow and Taylor flow at relatively low ReL. One drawback of the Lockhart-Martinelli and homogeneous pressure drop models is the fact that they are flow-regime-independent correlations. This could, to a large extent, account for why they have generally been observed to fail at low liquid flow rates, where, provided an appreciable gas flow ensues (such as in Taylor flow), significant deviation from homogeneous flow occurs. Interestingly, however, it is often at these low liquid flow rates that monolith reactors would typically be operated, i.e., 0.05 < UL < 0.2 m/s, depending on the process in question. In view of this, a flow-regime-dependent pressure drop model would be developed based on the data obtained from the experimental study undertaken, beginning with a discussion of ∆Pf.
General Observations of Frictional Pressure Drop
For co-current upward two-phase flow in a vertical capillary, the frictional pressure drop can be calculated from the measured total pressure drop, given by:
T f L LP P g cLε ρ∆ = ∆ + (6.16) Fig. 6.11(a) depicts the frictional pressure drop over the 1.4 m height of the 3.02-mm circular capillary for air-water system at different gas and liquid superficial velocities. Two notable features can be observed from the figure: (1) pressure drop values are negative at low liquid flow rates, which correspond to the Taylor flow regime; and (2) at higher liquid flow rates, the two-phase frictional pressure drop increases as UG and UL increase, but, in the lower-liquid-flow-rate region, changes in the pressure drop do not seem to be regular. Similar tends were observed for other systems that have been investigated. Negative frictional pressure drops in two-phase flows have scarcely been reported in open literature. In the study carried out, the bulk of the negative frictional pressure drops correspond to experimental data at very low liquid velocities. In an attempt to understand this phenomenon, experiments were conducted under a zero net liquid flow condition, i.e., liquid was fed batchwise into the capillary while the gas feed was continuous. The result is shown in Fig. 6.11(b) for air-oil mixture system in the 3.02-mm circular capillary. Observe that, over the range investigated, all frictional pressure drops are negative. As noted by Nicklin,36 a negative frictional pressure drop means that the total pressure drop is less than the hydrostatic pressure drop, because slip between phases can result in local down flows of liquid, resulting in wall shear stresses that act opposite to the usual sense.
123

Chapter 6 Hydrodynamics of Taylor Flow in Vertical Capillaries
(a) (b)
Superficial gas velocity, UG /[m/s]
0.0 0.2 0.4 0.6 0.8
Fric
tiona
l pre
ssur
e dr
op, ∆
Pf /[
kPa]
-4
-2
0
2
4
6
8
10
12
14
UL=0.009 m/sUL=0.054 m/sUL=0.159 m/sUL=0.268 m/sUL=0.363 m/sUL=0.455 m/s
3.02-mm circular Air-water
Superficial gas velocity, UG /[m/s]
0.0 0.1 0.2 0.3 0.4 0.5 0.6
Fric
tiona
l pre
ssur
e dr
op, ∆
Pf /[
kPa]
-3.5
-3.0
-2.5
-2.0
-1.5
UL=0 m/s
3.02-mm circular Air-oil mixture
Figure 6.11: (a) Effect of superficial gas and liquid velocities on frictional pressure drop for air-water system in the 3.02-mm circular capillary. (b) Frictional pressure drop at zero net liquid flow condition
for air-oil mixture system in the 3.02-mm circular capillary.
Theoretical Considerations
The apparently complicated behavior of the frictional pressure drop, as evidenced previously, requires that, in the development of a correlation for predicting the total pressure drop, ∆PT, negative frictional pressure drop data are taken into account. The extent to which two-phase pressure drops are influenced by flow regimes, fluid properties and channel geometries must also be considered. With these in mind, the following analysis is provided. Consider for example, a single-phase vertical tube with liquid flowing in the laminar regime. The total pressure drop is the sum of frictional and static components and can be represented as:
T f LP P g cLρ∆ = ∆ + (6.17) In this situation, the frictional pressure drop is given by the Hagen-Poiseuille equation:
L L cf 2
c
32 U LPdµ
∆ = (6.18)
Substitution of Eq. (6.18) into Eq. (6.17) and rearranging yields:
2L c c
T L2c L
3232
L dP Udµ ρ
µ⎛ ⎞⎛ ⎞
∆ = +⎜ ⎜ ⎟⎜ ⎝ ⎠⎝ ⎠L g ⎟⎟ (6.19)
124
Chapter 6 Hydrodynamics of Taylor Flow in Vertical Capillaries
By comparing Eqs. (6.18) and (6.19), an equivalent velocity with respect to the total pressure drop, may be defined as:
2c
eL32
dU L gρµ
⎛ ⎞= ⎜ ⎟⎝ ⎠
(6.20)
In subsequent discussions, this velocity will be called the gravity-equivalent velocity. It can be considered as the liquid velocity in the capillary that would result in a pressure loss equivalent to the hydrostatic pressure exerted by the liquid phase. Assuming laminar flow for both the gas and liquid phases, the two-phase gravity-equivalent velocity becomes:
2c
eL32
dU L L gε ρµ
⎛ ⎞= ⎜ ⎟⎝ ⎠
(6.21)
and a two-phase mixture velocity, UE, which is defined as the sum of the two-phase superficial velocity, UTP and the gravity-equivalent velocity is:
E TPU U U= + e (6.22) A dimensionless two-phase pressure factor, FE can further be defined, analogous to the Fanning friction factor of Eq.(6.5):
( )T c
E 2L E c
/1 4 /2
P LFU dρ
∆= (6.23)
Correlation of Pressure Drop Data
In a situation where both the gas and liquid phase flows are laminar, the pressure factor can be expected to take on a form similar to the Fanning friction factor, i.e.,
EE
CFRe
= (6.24)
where ReE, which is the modified Reynolds number, is defined as:
L E cE
L
U dRe ρµ
= (6.25)
Under this condition, the gas and liquid phases can be viewed as a homogeneous mixture. Based on the discussion of the slip ratio, S presented previously, it was shown that
125

Chapter 6 Hydrodynamics of Taylor Flow in Vertical Capillaries
homogeneous flow generally occurs when UG/UTP < 0.5, which is characterized by a slip ratio, S close to unity. A slip ratio of S > 1 was shown to indicate deviation from homogeneous flow. Therefore, it can be postulated that a relation between FE/(C/ReE) and UG/UTP (or, equivalently, UG/UL) could allow for determination of the transition from homogeneous to non-homogeneous flow for pressure drop computations. The plot in Fig. 6.12 shows such a relationship from which the following observations can be made:
(1) For UG/UL < 0.5, FE/(C/ReE) data approach a single line that approximately corresponds to FE/(16/ReE) = 1 and FE/(14.2/ReE) = 1 for the circular and square capillaries, respectively, with an uncertainty of approximately ± 9 %, indicating that the gas and liquid phases can be approximately viewed as a homogeneous mixture. The converse is the case for UG/UL > 0.5, where significant deviation from homogeneous flow can be observed.
(2) The capillary diameter and liquid viscosity were observed to influence the parameter FE/(C/ReE) significantly for UG/UL > 0.5. This is evidenced by comparing the data of the 0.91-mm, 2-mm and 3.02-mm circular capillaries for air-ethanol, as well as the data of the 3.02-mm circular and 2.89-mm square capillaries for both the air-oil mixture and air-water system.
UG/UL /[-]
0.01 0.1 1 10 100
F E/(C
/Re E
) /[-]
0.01
0.1
1
10
0.91-mm circular; air-water2-mm circular; air-water3.02-mm circular; air-water2.89-mm square; air-water0.91-mm circular; air-ethanol2-mm circular; air-ethanol3.02-mm circular; air-ethanol0.99-mm square; air-ethanol2.89-mm square; air-ethanol3.02-mm circular; air-oil mixture2.89-mm square; air-oil mixtureTransition: UG/UL=0.5
Homogeneousregime
Non-homogeneousregime
Figure 6.12: UG/UL versus FE/(C/ReE), showing that, when UG/UL > 0.5, the two-phase flow deviates
from the homogeneous regime.
Therefore, for homogeneous flow (UG/UL < 0.5), the total pressure drop can be predicted using Eq. (6.24) to first estimate the pressure factor and Eq. (6.23) for computing the pressure drop. To predict the total pressure drop when UG/UL > 0.5, wherein flows deviate from the homogeneous regime, the following analysis was performed. A plot of S versus FE/(C/ReE) for UG/UL > 0.5 is shown in Fig. 6.13(a), from which the following dependence was deduced:
126

Chapter 6 Hydrodynamics of Taylor Flow in Vertical Capillaries
0.5E
E/F S
C Re−∝ (6.26)
Through further data analysis, utilizing the parameter FES0.5/(C/ReE) as shown in Fig. 6.13(b), the following correlation was obtained:
0.5 0.34E E
E
exp( 0.02 ) 0.07CF S Re ReRe
− ⎡= − +⎣ E ⎤⎦ (6.27)
Slip ratio, S /[-]
0.1 1 10 100
F E/(C
/Re E
) /[-]
0.001
0.01
0.1
1
10
Experimental pressure factor, FE,expt /[-]
0.001 0.01 0.1 1
Pre
dict
ed p
ress
ure
fact
or, F
E,pr
ed /[
-]
0.001
0.01
0.1
1
ExperimentalParity line
(a)
(c)
Data for UG/UL > 0.5(Non-homogeneous regime)
All experimental data
Modified Reynolds number, ReE /[-]
10 100 1000 10000
F ES
0.5 /(C
/Re E
) /[-]
0.0
0.5
1.0
1.5
2.0
2.5ExperimentalEq. (6.27)
(b)
Data for UG/UL > 0.5(Non-homogeneous regime)
Figure 6.13: (a) Relationship between the slip ratio, S and FE/(C/ReE) for UG/UL > 0.5. (b) Correlation of experimental data for UG/UL > 0.5 for predicting the pressure factor, FE. (c) Comparison of
pressure factors calculated from experimental pressure drop data, FE,expt with predicted pressure factors, FE,pred.
Eq. (6.27) provides a convenient way of estimating the non-homogeneous regime pressure factor, which, when combined with Eq. (6.23), allows for the prediction of the total pressure drop. Fig. 6.13(c) illustrates the comparison of the experimental and correlation-predicted pressure factors, utilizing all experimental data. Note that the predicted pressure factors for
127

Chapter 6 Hydrodynamics of Taylor Flow in Vertical Capillaries
UG/UL < 0.5 were computed with Eq. (6.24), whereas Eq. (6.27) was used to compute the predicted pressure factors for UG/UL > 0.5. Fig. 6.14 shows typical experimental and predicted total pressure drop values. The predictions seem to be very good, especially at low and moderate liquid velocities, where Taylor flow occurs. It is also worthy to note that it is at such low liquid velocities that the Lockhart-Martinelli and homogeneous pressure drop models fail to predict the pressure drop, verifying the need for a flow-regime-dependent approach to pressure drop estimation.
Superficial gas velocity, UG /[m/s]
0.01 0.1 1
Tota
l pre
ssur
e dr
op, ∆
P T /[
kPa]
1
10
UL=0.029 m/sUL=0.138 m/sUL=0.309 m/sUL=0.492 m/sUL=0.664 m/sUL=0.029 m/sUL=0.138 m/sUL=0.309 m/sUL=0.492 m/sUL=0.664 m/s
2-mm circularAir-water
50
Superficial gas velocity, UG /[m/s]0.01 0.1 1
Tota
l pre
ssur
e dr
op, ∆
P T /[
kPa]
1
10
UL=0.009 m/sUL=0.054 m/sUL=0.159 m/sUL=0.268 m/sUL=0.363 m/sUL=0.455 m/sUL=0.009 m/sUL=0.054 m/sUL=0.159 m/sUL=0.268 m/sUL=0.363 m/sUL=0.455 m/s
3.02-mm circularAir-water
50
(a) (b)
Superficial gas velocity, UG /[m/s]
0.01 0.1 1
Tota
l pre
ssur
e dr
op, ∆
P T /[
kPa]
1
10
UL=0.021 m/sUL=0.124 m/sUL=0.343 m/sUL=0.537 m/sUL=0.021 m/sUL=0.124 m/sUL=0.343 m/sUL=0.537 m/s
2-mm circularAir-ethanol
50
(c)
Superficial gas velocity, UG /[m/s]
0.01 0.1 1
Tota
l pre
ssur
e dr
op, ∆
PT
/[kP
a]
1
10
UL=0.043 m/sUL=0.145 m/sUL=0.247 m/sUL=0.346 m/sUL=0.043 m/sUL=0.145 m/sUL=0.247 m/sUL=0.346 m/s
2.89-mm squareAir-ethanol
50
(d)
Figure 6.14: Variation of the experimental and predicted total pressure drop, ∆PT with varying superficial gas and liquid velocities: (a) 2-mm circular capillary, air-water; (b) 3.02-mm circular
capillary, air-water; (c) 2-mm circular capillary, air-ethanol; and (d) 2.89-mm square capillary, air-ethanol. The closed shapes represent experimental data points, whereas the lines represent predicted
values.
6.4 CONCLUSIONS
Two-phase flow hydrodynamics in vertical capillaries with circular and square cross sections that have hydraulic diameters from 0.9 to 3 mm were experimentally studied, using air as the gas phase and water, ethanol or an oil mixture as the liquid phase. Flow regimes,
128

Chapter 6 Hydrodynamics of Taylor Flow in Vertical Capillaries
bubble rise velocity, liquid slug length and pressure drop were investigated, with the gas and liquid superficial velocities being varied in the range of 0.008-1 m/s. Based on the work performed, the following major conclusions can be drawn:
(1) Within the gas and liquid velocity range under which experiments were conducted, four distinct flow regimes were observed: bubbly, slug-bubbly, Taylor and churn. A fifth regime, the annular flow regime, occurred at excessively high gas and low liquid velocities.
(2) The slip ratio, S was determined to be a useful parameter for gauging the transition from homogeneous to non-homogeneous flow. It was demonstrated that, when UG/UTP < 0.5, S approaches a value of unity, indicating homogeneous flow. For UG/UTP 0.5, a significant increase in S was observed, indicating deviation from homogeneous flow. Moreover, high S values occurred predominantly in the Taylor flow regime.
≥
(3) The influences of capillary geometry, capillary hydraulic diameter and fluid properties on bubble rise velocity were determined to be of little significance.
(4) A new and simplified correlation for predicting bubble rise velocity and, by implication, the gas holdup in vertical capillary two-phase flow was proposed.
(5) A correlation for estimating the liquid slug length was developed and was satisfactorily able to predict the experimental liquid slug lengths obtained in this study. However, the fact that existing literature correlations showed an enormous amount of scatter and deviation, when compared to the correlation proposed in the study, leaves open the question as to what extent the configuration of the gas-liquid nozzle (an experimental setup dependent parameter) affects liquid slug lengths in a given setup.
(6) For the prediction of the total pressure drop in a vertical capillary two-phase flow, a method was proposed based on the definition of the dimensionless pressure factor. Two pressure factor correlations were presented: one for homogeneous flow and the other for non-homogeneous flow. Based on the analysis of experimental data, a value of UG/UL = 0.5 was determined to indicate the transition point from homogeneous to non-homogeneous flow for pressure drop computation. Very good pressure drop predictions were obtained as shown.
ADDITIONAL INFORMATION
Additional information on the work presented in this chapter is available in a PDF document entitled: Hydrodynamics of Taylor flow in vertical capillaries: flow regimes; bubble rise velocity; liquid slug length; and pressure drop. This material is available free of charge via the Internet at http://pubs.acs.org. Simply select the “Search the Journals” option and type in the name of the document. You will then be able to access the Supporting Information PDF file, which contains the relevant data. Appendix I contains the raw experimental data of this study, whereas Appendix II contains further information on correlations for predicting bubble rise velocity.
129
Chapter 6 Hydrodynamics of Taylor Flow in Vertical Capillaries
NOTATION
C constant relating the Fanning friction factor to laminar flow Reynolds number
(also relates the pressure factor to the modified Reynolds number) dc capillary hydraulic diameter, m fb bubble frequency, s-1
g gravitational constant, m/s2
kLa gas-liquid mass transfer coefficient, s-1
Lc length of capillary, m Lslug liquid slug length, m LUC unit cell length, m Pf frictional pressure, Pa PT total pressure, Pa S slip ratio, dimensionless Ue gravity-equivalent velocity, m/s UE two-phase mixture velocity (UTP + Ue), m/s UG superficial gas velocity, m/s UL superficial liquid velocity, m/s UTP two-phase superficial velocity (UG + UL), m/s Vb bubble rise velocity, m/s Vf liquid film velocity, m/s VL liquid phase velocity, m/s Greek Symbols εL liquid holdup, dimensionless εLf film liquid holdup, dimensionless εG gas holdup, dimensionless µG gas viscosity, Pa s µL liquid viscosity, Pa s ρG gas density, kg/m3
ρL liquid density, kg/m3
σ surface tension, N/m Ψslug dimensionless liquid slug length Dimensionless Groups Ca capillary number, µLUTP/σ Eö Eötvös number, (ρL - ρG)dc
2g/σ FE pressure factor, ∆PTdc/(2LcρLUE
2) fL Fanning friction factor, ∆Pfdc/(2LcρLUL
2)
130

Chapter 6 Hydrodynamics of Taylor Flow in Vertical Capillaries
ReE modified Reynolds number, ρLUEdc/µL
ReG gas phase Reynolds number, ρGUGdc/µG
Re′G gas phase Reynolds number of Laborie et al.,9 ρLUGdc/µL
ReL liquid phase Reynolds number, ρLULdc/µL
Subscripts expt experimental pred predicted
BIBLIOGRAPHY (1) Boger, T.; Heibel, A. K.; Sorensen, C. M. Monolithic catalysts for the chemical industry. Industrial & Engineering Chemistry Research 2004, 43, 4602-4611. (2) Kreutzer, M. T. Hydrodynamics of Taylor flow in capillaries and monolith reactors. Ph.D. Thesis. Delft University of Technology, Delft, The Netherlands, 2003. (3) Roy, S.; Bauer, T.; Al-Dahhan, M. Monoliths as multiphase reactors: a review. American Institute of Chemical Engineers Journal 2004, 50, 2918-2938. (4) Kapteijn, F.; Nijhuis, T. A.; Heiszwolf, J. J.; Moulijn, J. A. New non-traditional multiphase catalytic reactors based on monolithic structures. Catalysis Today 2001, 66, 133-144. (5) Dudukovic, M. P.; Larachi, F.; Mills, P. L. Multiphase catalytic reactors: a perspective on current knowledge and future trends. Catalysis Reviews-Science and Engineering 2002, 44, 123-246. (6) Heibel, A. K.; Scheenen, T. W. J.; Heiszwolf, J. J.; Van As, H.; Kapteijn, F.; Moulijn, J. A. Gas and liquid phase distribution and their effect on reactor performance in the monolith film flow reactor. Chemical Engineering Science 2001, 56, 5935-5944. (7) Thulasidas, T. C.; Abraham, M. A.; Cerro, R. L. Bubble-train flow in capillaries of circular and square cross- section. Chemical Engineering Science 1995, 50, 183-199. (8) Thulasidas, T. C.; Abraham, M. A.; Cerro, R. L. Dispersion during bubble-train flow in capillaries. Chemical Engineering Science 1999, 54, 61-76. (9) Laborie, S.; Cabassud, C.; Durand-Bourlier, L.; Laine, J. M. Characterisation of gas-liquid two-phase flow inside capillaries. Chemical Engineering Science 1999, 54, 5723-5735. (10) Irandoust, S.; Andersson, B.; Bengtsson, E.; Siverstrom, M. Scaling up of a monolithic catalyst reactor with two-phase flow. Industrial & Engineering Chemistry Research 1989, 28, 1489-1493. (11) Berčič, G.; Pintar, A. The role of gas bubbles and liquid slug lengths on mass transport in the Taylor flow through capillaries. Chemical Engineering Science 1997, 52, 3709-3719.
131

Chapter 6 Hydrodynamics of Taylor Flow in Vertical Capillaries
(12) Kreutzer, M. T.; Du, P.; Heiszwolf, J. J.; Kapteijn, F.; Moulijn, J. A. Mass transfer characteristics of three-phase monolith reactors. Chemical Engineering Science 2001, 56, 6015-6023. (13) Irandoust, S.; Andersson, B. Mass-Transfer and liquid-phase reactions in a segmented two-phase flow monolithic catalyst reactor. Chemical Engineering Science 1988, 43, 1983-1988. (14) van Baten, J. M.; Krishna, R. CFD simulations of mass transfer from Taylor bubbles rising in circular capillaries. Chemical Engineering Science 2004, 59, 2535-2545. (15) Boger, T.; Zieverink, M. M. P.; Kreutzer, M. T.; Kapteijn, F.; Moulijn, J.; Addiego, W. P. Monolithic catalysts as an alternative to slurry systems: hydrogenation of edible oil. Industrial & Engineering Chemistry Research 2004, 43, 2337-2344. (16) Berčič, G. Influence of operating conditions on the observed reaction rate in the single channel monolith reactor. Catalysis Today 2001, 69, 147-152. (17) Günther, A.; Jhunjhunwala, M.; Thalmann, M.; Schmidt, M. A.; Jensen, K. F. Micromixing of miscible liquids in segmented gas-liquid flow. Langmuir ASAP 2005, (18) Günther, A.; Khan, S. A.; Thalmann, M.; Trachsel, F.; Jensen, K. F. Transport and reaction in microscale segmented gas-liquid flow. Lab on a Chip 2004, 4, 278-286. (19) Triplett, K. A.; Ghiaasiaan, S. M.; Abdel-Khalik, S. I.; Sadowski, D. L. Gas-liquid two-phase flow in microchannels - Part I: two-phase flow patterns. International Journal of Multiphase Flow 1999, 25, 377-394. (20) Triplett, K. A.; Ghiaasiaan, S. M.; Abdel-Khalik, S. I.; LeMouel, A.; McCord, B. N. Gas-liquid two-phase flow in microchannels - Part II: void fraction and pressure drop. International Journal of Multiphase Flow 1999, 25, 395-410. (21) Coleman, J. W.; Garimella, S. Characterization of two-phase flow patterns in small diameter round and rectangular tubes. International Journal of Heat and Mass Transfer 1999, 42, 2869-2881. (22) Lee, H. J.; Lee, S. Y. Pressure drop correlations for two-phase flow within horizontal rectangular channels with small heights. International Journal of Multiphase Flow 2001, 27, 783-796. (23) Mishima, K.; Hibiki, T. Some characteristics of air-water two-phase flow in small diameter vertical tubes. International Journal of Multiphase Flow 1996, 22, 703-712. (24) Wolk, G.; Dreyer, M.; Rath, H. J. Flow patterns in small diameter vertical non-circular channels. International Journal of Multiphase Flow 2000, 26, 1037-1061. (25) Zhao, T. S.; Bi, Q. C. Co-current air-water two-phase flow patterns in vertical triangular microchannels. International Journal of Multiphase Flow 2001, 27, 765-782. (26) Chen, I. Y.; Yang, K. S.; Chang, Y. J.; Wang, C. C. Two-phase pressure drop of air–water and R-410A in small horizontal tubes. International Journal of Multiphase Flow 2001, 27, 1293-1299. (27) Vandu, C. O.; Liu, H.; Krishna, R. Taylor bubble rise in circular and square capillaries, University of Amsterdam, Available at URL http://ct-cr4.chem.uva.nl/SingleCapillary/, accessed June 2004.
132

Chapter 6 Hydrodynamics of Taylor Flow in Vertical Capillaries
(28) Chen, W. L.; Twu, M. C.; Pan, C. Gas–liquid two-phase flow in micro-channels. International Journal of Multiphase Flow 2002, 28, 1235-1247. (29) Mishima, K.; Ishii, M. Flow regime transition criteria for upward two-phase flow in vertical tubes. International Journal of Heat and Mass Transfer 1984, 27, 723-737. (30) Suo, M. Two phase flow in capillary tubes. D.Sc. Thesis. Massachusetts Institute of Technology, Cambridge, MA, United States, 1963. (31) Fukano, T.; Kariyasaki, A. Characteristics of gas-liquid 2-phase flow in a capillary-tube. Nuclear Engineering and Design 1993, 141, 59-68. (32) Barnea, D. Effect of bubble shape on pressure drop calculations in vertical slug flow. International Journal of Multiphase Flow 1990, 16, 79-89. (33) Heiszwolf, J. J.; Kreutzer, M. T.; van den Eijnden, M. G.; Kapteijn, F.; Moulijn, J. A. Gas-liquid mass transfer of aqueous Taylor flow in monoliths. Catalysis Today 2001, 69, 51-55. (34) Lockhart, R. W.; Martinelli, R. C. Proposed correlation of data for isothermal two-phase, two-component flow in pipes. Chemical Engineering Progress 1949, 45, 39-48. (35) Zhao, T. S.; Bi, Q. C. Pressure drop characteristics of gas-liquid two-phase flow in vertical miniature triangular channels. International Journal of Heat and Mass Transfer 2001, 44, 2523-2534. (36) Nicklin, D. J. Two-phase bubble flow. Chemical Engineering Science 1962, 17, 693-702.
133


Chapter 7 Mass Transfer from Taylor Bubbles rising in Single Capillaries
Chapter 7
MASS TRANSFER FROM TAYLOR BUBBLES RISING IN SINGLE CAPILLARIES
7.1 INTRODUCTION
In designing monolith reactors, it is essential that the rate of mass transfer from the bubbles in the monolith channels to the surrounding liquid phase be reliably estimated. This is particularly important for fast reactions, where mass transfer from the bubbles to the surrounding liquid phase could become a limiting factor. As stated in the previous chapter, the Taylor flow regime, also known as the slug flow or bubble train flow regime is of particular interest in the operation of monolith reactors. In this regime of operation, elongated gas bubbles, with lengths greater than the channel diameter, rise along the channel separated from each other by liquid slugs. Since a monolith block is composed of an array of uniformly structured parallel channels, gas-liquid mass transfer data obtained from studies on a single channel will prove to be of immense value in scaling up a monolith reactor, provided of course that a uniform distribution of gas and liquid phases occurs in the various channels of the monolith block.
A number of investigators have studied Taylor flow gas-liquid mass transfer in single channels.1-4 Berčič and Pintar1 put forward the following empirical correlation for the estimation of the gas-liquid volumetric mass transfer coefficient, kLa in single channels, based on experimental studies of the absorption of methane in water using circular capillaries of 1.5, 2.5 and 3.1-mm diameters:
( )( )
1.19G L
L 0.57G UC
0.111(1 )
U Uk a
Lε
+=
− (7.1)
UG and UL are the superficial velocities of the gas and liquid phases, εG is the gas holdup and LUC is the unit cell length. Though the channel diameter, dc in the Berčič-Pintar experiments was doubled, one remarkably observes that Eq. (7.1) shows no dependence on it. Since the gas and liquid phases were not changed in their experiments, the liquid phase diffusivity, ÐL does not appear in Eq. (7.1).
Irandoust et al.,2, 5 Kreutzer3 and van Baten and Krishna4 have adopted a more fundamental approach to the estimation of kLa. They consider the separate contributions of mass transfer from the two hemispherical caps, and the transfer to the liquid flowing down the sides of the Taylor bubble; Fig 7.1 depicts this with the vertical arrows indicating transfer
135

Chapter 7 Mass Transfer from Taylor Bubbles rising in Single Capillaries
of gas into the liquid from the hemispherical bubble caps and the horizontal arrows showing transfer into the liquid film.
hemispherical cap
1
2
liquid film
2
1
liquid slug
Figure 7.1: Representation of gas-liquid mass transfer from a Taylor bubble rising in a capillary. (1)
Transfer from the hemispherically shaped bubble caps into the liquid slugs above and below the bubble. (2) Transfer to the liquid film surrounding the bubble.
Furthermore, in these approaches, the channel diameter does influence the kLa of both cap and film contributions, in contrast to the expectations of Eq. (7.1). Irandoust et al.2 for instance, concluded that gas-liquid mass transfer in Taylor flow in a capillary is very much dependent on the gas-liquid contact area, which in turn is affected only by the channel diameter and gas holdup. Using extensive CFD simulations of mass transfer in circular capillaries of 1.5, 2 and 3-mm inner diameters, van Baten and Krishna4 further concluded that the dominant contribution to mass transfer was from the Taylor bubbles to the thin film between the bubbles and the wall.
In this chapter, the results of a comprehensive set of experiments on gas-liquid mass transfer from Taylor bubbles rising in capillaries in the 1-3 mm range, of both circular and square geometries, is presented. The applicability of the model of van Baten and Krishna4 for predicting kLa will be verified. The dependence of kLa on capillary diameter will also be demonstrated.
7.2 EXPERIMENTAL SETUP AND PROCEDURE
Experiments were carried out in capillaries of square and circular cross sections listed in Table 7.1. Seven distinct capillaries were employed, having five different inner dimensions: 1, 2, 3-mm circular and 1, 3-mm square. All capillaries were made of Pyrex glass. The experimental setup, shown in Fig 7.2, consists of (1) the capillary setup with an external liquid recirculation loop and (2) an image recording and analysis system. Air was
136

Chapter 7 Mass Transfer from Taylor Bubbles rising in Single Capillaries
used as the gas phase in all experimental runs with the liquid phase being demineralized water (density of ρL = 998 kg/m3; viscosity of µL = 1 mPa s; surface tension of σ = 72 mN/m).
gas flowmeter
liquid flowmeter
high-speed camera
memory box
CRT display
PC
air in
capillary
disengagementzone
control valves
gas bubble1
cm
4.5 cm
control valve
liquid flowcontrolvalve
nitrogen in
1
ammeter1
oxygen sensor air
liquid
nitrogen
U gas-liquid inlet
tee gas-liquid inlet
liquid recirculation
loop
Figure 7.2: Schematic representation of the experimental setup. Air and nitrogen were fed to the bottom of the capillary through a tee or U bend inlet (refer to Fig. 7.2 for schematic descriptions). Nitrogen was employed for stripping out dissolved oxygen. All experiments were carried out at room temperature and atmospheric pressure. During experiments, compressed air was fed through a pre-calibrated float-type gas flowmeter. The gas flow provided the driving force for closed-loop liquid recirculation within the system. For a given gas flow rate, the liquid recirculation rate was regulated using a valve placed above a pre-calibrated float-type liquid flowmeter installed within the loop. Gas disengagement occurred in a zone above the capillary. The volume of liquid in the disengagement zone was kept constant at 10 mL at the start of each experimental run,
137

Chapter 7 Mass Transfer from Taylor Bubbles rising in Single Capillaries
corresponding to a liquid height of 1 cm. A Yellow Springs Incorporated Model 5331 oxygen electrode, employed for mass transfer measurements, was placed in the gas-liquid disengagement zone. The electrode was connected to a personal computer (PC) via an ammeter and an analog-to-digital converter card.
Table 7.1: Capillaries used in this study
Geometry Hydraulic diameter, dc (mm)
Length of capillary, Lc (m)
Inlet nozzle used†
Number of experiments
Circular 1 0.2 1-mm U 13
Circular 1 0.47 1-mm U 16
Circular 2 0.45 3-mm U 40
Circular 3 0.45 3-mm U 33
Circular 3 1.4 3-mm tee 29
Square 1 0.2 1-mm U 7
Square 3 0.45 3-mm tee 38 †The dimensions indicated refer to the approximate inner diameters of the gas and liquid nozzles.
The image recording system consisting of a Photron Fastcam-ultima 40K high-speed video camera, a memory box and a CRT monitor display has been described in detail in section 6.2 of chapter 6. During experiments, the high-speed camera was positioned midway along the capillary height in such a way that it captured rising air bubbles within a convenient vertical distance.
GAS HOLDUP AND UNIT CELL LENGTH The gas holdup, εG and unit cell length, LUC were determined by analyzing the high-
speed movies made during experiments. Once steady flow had been achieved during a given experimental run, video movies were made at capture rates of between 750 and 4,500 frames per second (fps). By analyzing each movie made, the bubble frequency, fb and bubble rise velocity, Vb were determined. Each Vb reported in this study is the average of five values taken. However, deviations from the mean of more than 4 % were hardly observed. For each superficial gas velocity, UG, the gas holdup was calculated thus, once the bubble rise velocity had been determined:
GG
b
UV
ε = (7.2)
138
Chapter 7 Mass Transfer from Taylor Bubbles rising in Single Capillaries
And based on the assumption that all unit cells have the same length, the average unit cell length, LUC was calculated from:
bUC
b
VLf
= (7.3)
The average liquid slug length, Lslug was then determined from the unit cell length and gas holdup, assuming that the volume of liquid in the film between a gas bubble and the capillary wall is negligible in comparison to the volume of liquid in the slug:
(slug UC G1L L )ε= − (7.4) From observations made during the experiments carried out, the assumption of a uniform Lslug was found to be justified. This happened to be the case once steady flow was achieved, which often took about a minute or two.
MASS TRANSFER COEFFICIENT
The volumetric mass transfer coefficient, kLa was determined by a dynamic oxygen absorption technique, previously described in section 2.3 of chapter 2. The oxygen electrode, placed in the gas-liquid disengagement zone of the setup used, was used to measure the change in dissolved oxygen concentration. The sensor time constant, ksensor was typically in the range of 0.45-0.55 s-1, an order of magnitude higher than the determined kLa per unit volume of dispersion (gas + liquid) in the entire capillary setup. Thus, the sensor delay had no noticeable effect on the accuracy of the kLa values reported. To determine kLa, dissolved oxygen was stripped from the liquid phase to a negligible concentration by the use of nitrogen. After the stripping operation, air was introduced into the capillary with the uptake of oxygen into the liquid phase continuously monitored till the liquid phase oxygen saturation concentration, CL
* was reached. To obtain kLa values form the experimental oxygen absorption curves, a model of the
capillary setup was developed based on the following assumptions: Well-mixed gas and liquid phases in each unit cell. In each unit cell, recirculation of
liquid in the slug allows for a great deal of mixing,2 especially when Lslug is not much greater than dc. As this was the case for the experimental system studied, with the average Lslug being four times the value of dc, this assumption is justified.
Plug flow of liquid in the recirculation loop. Well-mixed liquid phase in the disengagement zone
The unit cells were assumed to extend to the dispersion height. This meant that gas bubbles and their corresponding volumes of liquid in the gas-liquid disengagement zone were taken
139
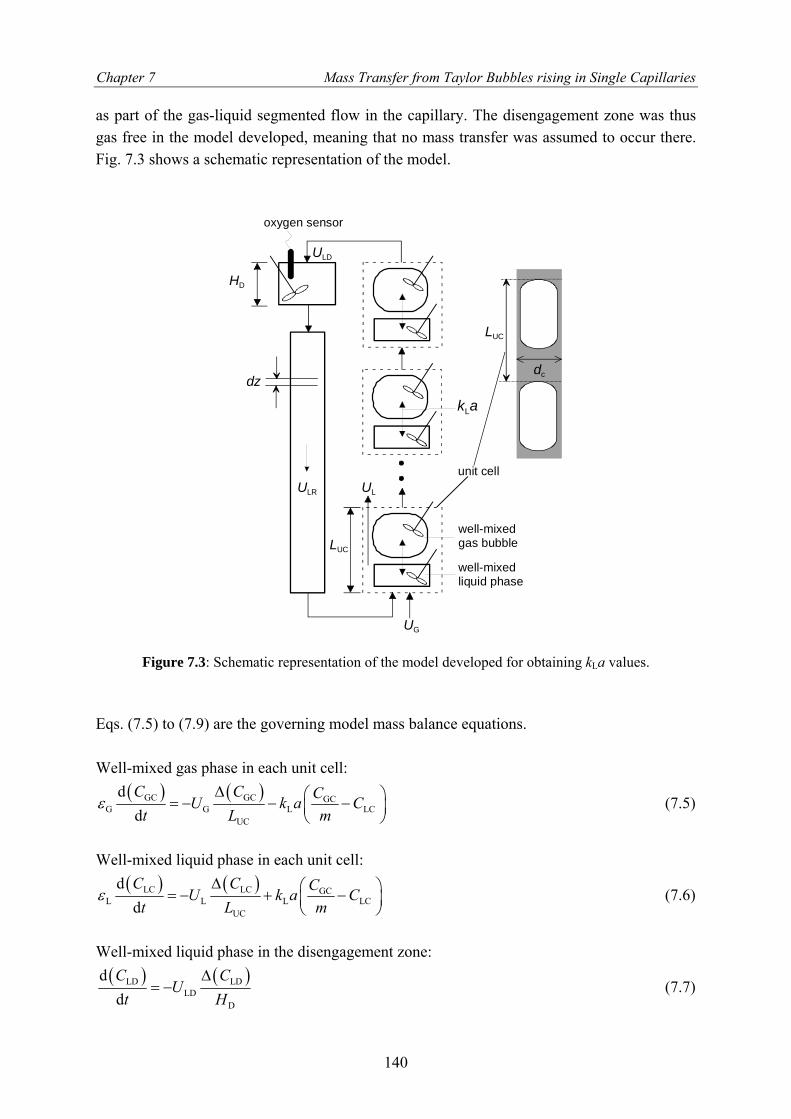
Chapter 7 Mass Transfer from Taylor Bubbles rising in Single Capillaries
as part of the gas-liquid segmented flow in the capillary. The disengagement zone was thus gas free in the model developed, meaning that no mass transfer was assumed to occur there. Fig. 7.3 shows a schematic representation of the model.
oxygen sensor
UG
ULR
unit cell
well-mixedgas bubble
well-mixedliquid phase
dc
LUC
ULD
UL
kLa
LUC
HD
dz
Figure 7.3: Schematic representation of the model developed for obtaining kLa values. Eqs. (7.5) to (7.9) are the governing model mass balance equations. Well-mixed gas phase in each unit cell:
( ) ( )GC GC GCG G L
UC
ddC C CU k a
t L mε
∆ ⎛= − − −⎜⎝ ⎠
LCC ⎞⎟ (7.5)
Well-mixed liquid phase in each unit cell:
( ) ( )LC LC GCL L L
UC
ddC C CU k a
t L mε
∆ ⎛= − + −⎜⎝ ⎠
LCC ⎞⎟ (7.6)
Well-mixed liquid phase in the disengagement zone: ( ) ( )LD LD
LDD
ddC C
Ut H
∆= − (7.7)
140

Chapter 7 Mass Transfer from Taylor Bubbles rising in Single Capillaries
Plug flow of liquid in the recirculation loop: ( ) ( )LR LR
LR
C CU
t z∂ ∂
=∂ ∂
(7.8)
Sensor correction equation: ( ) (sensor
sensor LD sensor
dd
Ck C C
t= − ) (7.9)
εG and εL are the gas and liquid holdups in the capillary section of the setup i.e., excluding the gas-liquid disengagement zone and the liquid recirculation loop volume. kLa is the volumetric mass transfer coefficient per unit volume of dispersion (gas + liquid) in the capillary section, where kL is the liquid side mass transfer coefficient and a is the gas-liquid interfacial area per unit cell volume. UG is the superficial gas velocity with respect to the capillary cross section, while UL, ULD and ULR are the superficial liquid velocities in the capillary, disengagement zone and recirculation loop, respectively. HD is the dispersion height in the disengagement zone and m, the solubility coefficient of oxygen in water; m = 28. Eqs. (7.5) to (7.9) are subject to the following boundary conditions: At time t = 0, CGC = CGC, inlet At time t = 0, CLC = CLD = CLR = 0 CLC,in = CLR,out CLR,in = CLD,out CLD,in = CLC,out
To solve the equations, their spatial derivatives were discretized using a first-order
backward difference approximation. The discretized equations were coded in FORTRAN and solved by the Method of Lines utilizing the ODE solver LSODE6 in double precision. Fig. 7.4 shows a typical oxygen absorption response curve and the fit obtained using the model developed.
Time /[s]
0 500 1000 1500 2000
Cse
nsor
/CL*
/[-]
0.2
0.4
0.6
0.8
1.0
ExperimentalModel
1-mm circularUG = 0.099 m/sUL = 0.085 m/skLa = 0.382 s-1
Figure 7.4: Typical oxygen absorption dynamics curve and model fit. Data from the 1-mm circular capillary with LC = 0.2 m.
141
Chapter 7 Mass Transfer from Taylor Bubbles rising in Single Capillaries
This plot is from an experimental run in the 0.2-m-long, 1-mm-diameter circular capillary with the superficial gas and liquid velocities set at UG = 0.099 m/s and UL = 0.085 m/s, respectively. kLa obtained is 0.382 s-1. The small bump observed in Fig. 7.4 at about 350 s in both the experimental and model-predicted curves is due to the first full circulation of the liquid in the capillary setup.
7.3 RESULTS AND DISCUSSION
In Fig. 7.5, a comparison of the experimental kLa data obtained in the 1, 2 and 3-mm capillaries with that obtained using the Berčič-Pintar correlation given by Eq. (7.1), is depicted. The diffusivity of methane in water, the system used by Berčič and Pintar was estimated as being ÐL = 1.89 x 10⁻⁹ m2/s, with that of oxygen in water being ÐL = 2.11 x 10⁻⁹ m2/s. kLa is related to the diffusivity, ÐL by the relationship:
( ) ( )( )( )
2
2 4
4
L OL LO CH
L CH
nÐ
k a k aÐ
⎛ ⎞⎜=⎜⎝ ⎠
⎟⎟
(7.10)
The exponent n generally varies in the range 0.5 to 1. For simplicity, Heiszwolf et al.7 recommend a value of 1. While the Berčič-Pintar correlation underestimates the experimental kLa values obtained in this study in the 1-mm capillaries, it overestimates these for the 2 and 3-mm capillaries. The reasons for the poor predictions due to Eq. (7.1) are as follows. Firstly, Eq. (7.1) anticipates no dependence of kLa on channel dimension. Secondly, the Berčič-Pintar experimental studies were conducted with relatively large unit cell lengths of up to 0.22 m, and for values of (UG + UL) generally less than 0.16 m/s, i.e., in studying the effect of gas bubble and liquid slug lengths on kLa, a study which formed the basis for the development of Eq. (7.1). In contrast, in the present study, LUC ranged from 0.005-0.06 m. 87 % of the data were obtained for LUC values < 0.025 m. Furthermore, (UG + UL) spanned the much wider range of 0.09 to 0.65 m/s. When these conditions are compared against the large unit cell lengths employed in the Berčič-Pintar experiments, one can anticipate that the liquid film surrounding a Taylor bubble reaches saturation in many of their experiments and is not as effective as the short liquid films used in the present study.
In order to underline the dependence of kLa on the channel dimension, a select set of data from the circular capillaries, for which the unit cell lengths vary in a relatively narrow range of 0.017-0.021 m, is shown in Fig. 7.6. The experimental kLa values are plotted against
for this restricted data set. And the data clearly demonstrate the strong decrease in k1/2GU La
with increased channel dimension. This finding logically stems from the fact that the gas-liquid volumetric mass transfer coefficient is dependent on the gas-liquid contact area, which in turn increases with a decrease in channel dimension.
142

Chapter 7 Mass Transfer from Taylor Bubbles rising in Single Capillaries
0.124(UG+UL)1.19((1-εG)LUC)0.57 /[s-1]
0.0 0.2 0.4 0.6 0.8 1.0
Expe
rimen
tally
det
erm
ined
kLa
/[s-1
]
0.0
0.2
0.4
0.6
0.8
Eq. (7.1)CircularSquare
0.124(UG+UL)1.19((1-εG)LUC)0.57 /[s-1]
0.0 0.2 0.4 0.6 0.8 1.0
Expe
rimen
tally
det
erm
ined
kLa
/[s-1
]
0.0
0.2
0.4
0.6
0.8
Eq. (7.1)Circular
0.124(UG+UL)1.19((1-εG)LUC)0.57 /[s-1]
0.0 0.2 0.4 0.6 0.8 1.0
Expe
rimen
tally
det
erm
ined
kLa
/[s-1
]
0.0
0.2
0.4
0.6
0.8
Eq. (7.1)CircularSquare
1-mm capillary
2-mm capillary
3-mm capillary
(a) (b)
(c)
Figure 7.5: Comparison of the experimental kLa data with the correlation of Berčič and Pintar1 given by Eq. (7.1). The coefficient of Eq. (7.1) has been corrected to account for the difference in the
diffusivity of methane (used in the Berčič -Pintar experiments) and oxygen in water.
(UG)1/2 /[m0.5 s-0.5]
0.0 0.2 0.4 0.6 0.8
Expe
rimen
tally
det
erm
ined
kLa
/[s-1
]
0.0
0.2
0.4
0.6
0.8
Eq. (7.17)1 mm2 mm3 mm
Circular capillaries;LUC = 0.017 - 0.021 m
Figure 7.6: Experimental kLa values for the 1, 2 and 3-mm circular capillaries plotted against . In the chosen data set, the unit cell lengths were in the range L
1/2GU
UC =0.017-0.021 m. The straight lines are plotted using Eq. (7.17) taking C = 4.5.
143

Chapter 7 Mass Transfer from Taylor Bubbles rising in Single Capillaries
Attention will now be focused on the more fundamental approach for describing mass transfer from Taylor bubbles developed by van Baten and Krishna.4 Their model considers two contributions to mass transfer: (1) the caps, assumed to be hemispherical, at either end of the bubble and (2) the liquid film surrounding the bubble. They put forward the following relationship for the overall volumetric mass transfer coefficient:
L L,cap cap L,film film k a k a k a= + (7.11) In describing mass transfer from the caps and film of the Taylor bubble, the Higbie penetration mass transfer model was used. The following physical picture of mass transfer was also provided: A Taylor bubble rising up along a capillary will be sandwiched between liquid slugs. Between the side of the bubble and the wall of the capillary will be a thin downflowing liquid film. Now, for the top cap of the Taylor bubble, a packet of liquid arriving at the wall will travel upward along the surface of the bubble cap right to the nose before being engulfed in the bulk liquid slug; see Fig. 7.7(a). In a similar way, for the bottom bubble cap, a liquid element arriving at the nose from the bulk liquid slug will be swept upward along the cap surface right up to the liquid film at the wall. At this juncture, the liquid element will be swept downward and away from the bubble surface by the downflowing liquid; see Fig. 7.7(b). The average distance traveled by the liquid packet in both the top and bottom bubble caps will be half the bubble circumference, i.e. (πdb/2) ≈ (πdc/2), and the average contact time with the bubble, rising with a velocity Vb is (πdc/2Vb). The penetration model for mass transfer then yields the following relationship for the gas-liquid mass transfer coefficient for the bubble cap, kL,cap and the liquid film surrounding the bubble, kL,film:
L bL,cap 2
c
22 Ð Vkdπ
= (7.12)
LL,film
film
2 Ðktπ
= (7.13)
tfilm , the contact time of the liquid film with the gas bubble can be approximately estimated by the relationship LUCεG/Vb. The specific interfacial area of the two hemispherical caps is given by:
capUC
4aL
= (7.14)
while the film specific interfacial area is:
Gfilm
c
4adε
= (7.15)
144
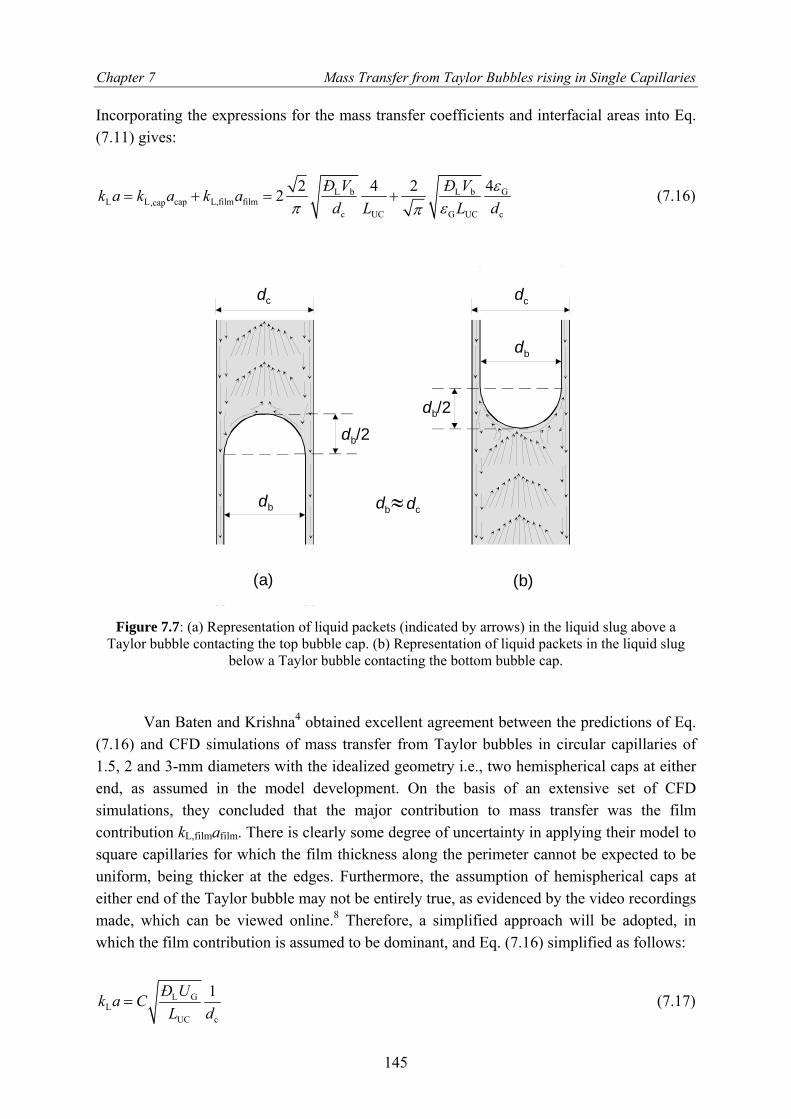
Chapter 7 Mass Transfer from Taylor Bubbles rising in Single Capillaries
Incorporating the expressions for the mass transfer coefficients and interfacial areas into Eq. (7.11) gives:
L b L b GL L cap L,film film,cap
c UC G UC c
42 4 22 Ð V Ð Vk a k a k ad L L d
επ επ
= + = + (7.16)
db/2
dc
db
db/2
dc
db
db dc≈
(a) (b)
Figure 7.7: (a) Representation of liquid packets (indicated by arrows) in the liquid slug above a
Taylor bubble contacting the top bubble cap. (b) Representation of liquid packets in the liquid slug below a Taylor bubble contacting the bottom bubble cap.
Van Baten and Krishna4 obtained excellent agreement between the predictions of Eq. (7.16) and CFD simulations of mass transfer from Taylor bubbles in circular capillaries of 1.5, 2 and 3-mm diameters with the idealized geometry i.e., two hemispherical caps at either end, as assumed in the model development. On the basis of an extensive set of CFD simulations, they concluded that the major contribution to mass transfer was the film contribution kL,filmafilm. There is clearly some degree of uncertainty in applying their model to square capillaries for which the film thickness along the perimeter cannot be expected to be uniform, being thicker at the edges. Furthermore, the assumption of hemispherical caps at either end of the Taylor bubble may not be entirely true, as evidenced by the video recordings made, which can be viewed online.8 Therefore, a simplified approach will be adopted, in which the film contribution is assumed to be dominant, and Eq. (7.16) simplified as follows:
L GL
UC c
1Ð Uk a CL d
= (7.17)
145

Chapter 7 Mass Transfer from Taylor Bubbles rising in Single Capillaries
where Eq. (7.2) has been used to eliminate the bubble rise velocity, Vb in the film contribution, by replacing it with UG/εG. The constant C has also been introduced. The experimental data for the 1, 2 and 3-mm capillaries are plotted against the right-hand term of Eq. (7.17) in Fig. 7.8. The straight lines represent calculations following Eq. (7.17), taking C = 4.5, the best fit value on the basis of a regression of the complete data set; coincidentally, this value of C is almost precisely the theoretical value from the model for the film contribution, i.e. 8 / π . The agreement between the model and the experiments is reasonably good for both the circular and square capillaries for all three dimensions. The maximum deviation between the model and the experiments is ± 30 %, with most of the data lying within 20 %. The good agreement between the experimental k± La data and kL,filmafilm confirms that this contribution is the dominant one for the range of conditions investigated in this study. Furthermore, the theoretical model is able to capture the dependence of kLa on dc; this can be verified from Fig. 7.6 wherein straight lines are drawn following Eq. (7.17).
(ÐLUG/LUC)1/2/dc /[s-1]
0.00 0.05 0.10 0.15 0.20
Expe
rimen
tally
det
erm
ined
kLa
/[s-1
]
0.0
0.2
0.4
0.6
0.8
Eq. (7.17)CircularSquare
(ÐLUG/LUC)1/2/dc /[s-1]
0.00 0.05 0.10 0.15 0.20
Expe
rimen
tally
det
erm
ined
kLa
/[s-1
]
0.0
0.2
0.4
0.6
0.8
Eq. (7.17)Circular
(ÐLUG/LUC)1/2/dc /[s-1]
0.00 0.05 0.10 0.15
Expe
rimen
tally
det
erm
ined
kLa
/[s-1
]
0.0
0.1
0.2
0.3
0.4
0.5
0.6
Eq. (7.17)CircularSquare
1-mm capillary 2-mm capillary
3-mm capillary
(a) (b)
(c)
Figure 7.8: Experimental volumetric mass transfer coefficient, kLa plotted as function of (ÐLUG/LUC)1/2/dc for (a) 1-mm, (b) 2-mm and (c) 3-mm capillaries. The straight lines are drawn using
Eq. (7.17) taking C = 4.5.
146

Chapter 7 Mass Transfer from Taylor Bubbles rising in Single Capillaries
In an attempt to find the range of applicability of Eq. (7.17), use is made of the parameter (UG+UL)/Lslug, which is the ratio of the combined gas and liquid velocity to the liquid slug length. In Fig. 7.9, a logarithmic plot of [(UG+UL)/Lslug]0.5 versus the liquid film contact time, tfilm is depicted for all experimental data points obtained in this study as well as those from the work of Berčič and Pintar.1 In order to compute tfilm, the bubble rise velocity is required. Since it was not measured in the Berčič-Pintar experiments, it was estimated using a correlation developed in chapter 6 for estimating Vb:
( )b G L 0.33
11 0.61
V U UCa
⎛= + ⎜ −⎝ ⎠⎞⎟ (7.18)
where Ca, the capillary number = (µL(UG+UL)/σ). µL is the liquid density and σ, the liquid surface tension.
tfilm /[s]
0.001 0.01 0.1 1 10
((U
G+U
L)/L
slug
)0.5 /[s
-0.5]
0.1
1
10
This studyBercic-Pintar
Figure 7.9: Comparison of the experimental results obtained in this study with those of Berčič and Pintar1 based on a plot of the estimated film contact time versus the parameter [(UG+UL)/Lslug]0.5.
From Fig. 7.9, it is observed that the bulk of the data points from the experimental study undertaken relate to short film contact times of tfilm < 0.1 s. For the Berčič-Pintar experiments, tfilm > 0.1 s for all but four data points, extending all the way up to 4 s. [(UG+UL)/Lslug]0.5 < 3 s-0.5 relates to the region of large film contact times and a diminished role of the film in the gas-liquid mass transfer process. This is the region where the Berčič-Pintar experiments predominate. The high degree of linearity displayed by the Berčič-Pintar data is as a result of the fact that Lslug and LUC were controlled in their experiments.
The findings presented above indicate how misleading it could be to simply estimate kLa in Taylor flow by the use of literature correlations without an understanding of the range of applicability of such correlations.
147

Chapter 7 Mass Transfer from Taylor Bubbles rising in Single Capillaries
7.4 CONCLUSIONS
In this chapter, gas-liquid mass transfer from Taylor bubbles rising in capillaries of
circular and square cross sections was investigated, with the volumetric mass transfer coefficients, kLa computed from dynamic oxygen absorption curves. The following major conclusions can be drawn from the work done:
(1) The empirical correlation of Berčič and Pintar1 given by Eq. (7.1) shows large
deviations when compared with the experimental data from the study carried out. Firstly, the Berčič-Pintar correlation does not include the influence of channel dimension. Secondly, it was set up using experimental data wherein large unit cells were realized and the rise velocity was restricted to values below about 0.16 m/s. This would suggest that for many of the Bercic-Pintar experiments, the film reaches saturation and is not very effective. The experiments in this study were carried out with shorter films and high rise velocities and in all cases the film was not saturated.
(2) The experimental kLa values from this study are described reasonably well with the model of van Baten and Krishna,4 assuming that the dominant contribution is due to the film surrounding the Taylor bubble. Furthermore the model was found to be applicable when [(UG+UL)/Lslug]0.5 > 3 s-0.5. Below this range a diminished film contribution to mass transfer occurs as the liquid in the film begins approaching saturation.
The use of Eq. (7.17) is recommended for the practical estimation of kLa in the range described. To use this correlation, estimates of the unit cell length, LUC, gas holdup, εG and bubble rise velocity, Vb as a function of the operating conditions and system properties are required. The estimation of these parameters was the subject of chapter 6. The conclusions reached from the studies in chapters 4 and 5, where gas-liquid mass transfer in monolith reactors was investigated, go to show that the Eq. (7.17) can be applied for estimating kLa for a monolith bundle of capillaries. In both the monolith loop reactors investigated in chapters 4 and 5, and the single capillary investigated in this chapter, the film contribution to gas-liquid mass transfer was found to be dominant.
ACKNOWLEDGEMENT Thanks to Dr. G. Berčič for providing the experimental data reported in his 1997 paper1 in electronic format.
148
Chapter 7 Mass Transfer from Taylor Bubbles rising in Single Capillaries
NOTATION
a gas-liquid interfacial area per unit cell volume, m2/m3
C dimensionless constant in Eq. (7.17) CL
* saturation liquid concentration, mol/m3 or arbitrary units CGC gas phase oxygen concentration in the capillary, mol/m3
CLC liquid phase oxygen concentration in the capillary, mol/m3
CLD liquid phase oxygen concentration in the disengagement zone, mol/m3
CLR liquid phase oxygen concentration in the recirculation loop, mol/m3
Csensor liquid phase oxygen concentration indicated by the sensor, arbitrary units db bubble diameter, m dc capillary hydraulic diameter, m ÐL liquid phase diffusivity, m2/s fb bubble frequency, s-1
HD dispersion height in the disengagement zone, m kL liquid side mass transfer coefficient, m/s ksensor sensor time constant, m/s Lc length of capillary, m Lslug liquid slug length, m LUC unit cell length, m m solubility coefficient of oxygen in water, dimensionless t time, s UG superficial gas velocity (with respect to the capillary cross section), m/s UL superficial liquid velocity in the capillary, m/s ULD superficial liquid velocity in the disengagement zone, m/s ULR superficial liquid velocity in the recirculation loop, m/s Vb bubble rise velocity, m/s Greek Symbols εG gas holdup in the capillary, dimensionless εL liquid holdup in the capillary, dimensionless µL liquid viscosity, Pa s ρL liquid density, kg/m3
σ surface tension, N/m Dimensionless Groups Ca capillary number, µL(UG + UL)/σ
149

Chapter 7 Mass Transfer from Taylor Bubbles rising in Single Capillaries
Subscripts and superscripts b refers to Taylor bubble c refers to capillary cap refers to hemispherical bubble cap D refers to gas-liquid disengagement zone film refers to liquid film G refers to gas phase in refers to conditions into a given section of the setup inlet refers to conditions at the inlet of the capillary L refers to liquid phase out refers to conditions out of a given section of the setup R refers to liquid recirculation loop UC refers to unit cell * refers to saturation concentration
BIBLIOGRAPHY (1) Berčič, G.; Pintar, A. The role of gas bubbles and liquid slug lengths on mass transport in the Taylor flow through capillaries. Chemical Engineering Science 1997, 52, 3709-3719. (2) Irandoust, S.; Ertle, S.; Andersson, B. Gas-liquid mass-transfer in Taylor flow through a capillary. Canadian Journal of Chemical Engineering 1992, 70, 115-119. (3) Kreutzer, M. T. Hydrodynamics of Taylor flow in capillaries and monolith reactors. Ph.D. Thesis. Delft University of Technology, Delft, The Netherlands, 2003. (4) van Baten, J. M.; Krishna, R. CFD simulations of mass transfer from Taylor bubbles rising in circular capillaries. Chemical Engineering Science 2004, 59, 2535-2545. (5) Irandoust, S.; Andersson, B. Mass-transfer and liquid-phase reactions in a segmented two-phase flow monolithic catalyst reactor. Chemical Engineering Science 1988, 43, 1983-1988. (6) Hindmarsh, A. C., Livermore solver for Ordinary Differential Equations, Lawrence Livermore National Laboratory, Livermore, California, 2001. (7) Heiszwolf, J. J.; Kreutzer, M. T.; van den Eijnden, M. G.; Kapteijn, F.; Moulijn, J. A. Gas-liquid mass transfer of aqueous Taylor flow in monoliths. Catalysis Today 2001, 69, 51-55. (8) Vandu, C. O.; Liu, H.; Krishna, R. Taylor bubble rise in circular and square capillaries, University of Amsterdam, Available at URL http://ct-cr4.chem.uva.nl/SingleCapillary/, accessed June 2004.
150

Chapter 8 Conclusions
Chapter 8
CONCLUSIONS
8.1 INTRODUCTION
The objective of the work presented in this dissertation has been the investigation of the hydrodynamics and the mass transfer characteristics of multiphase reactors, focusing on the slurry bubble column, internal loop airlift reactor and the monolith loop reactor. Such an investigation provides valuable information, by comparing the performance of these reactors, which is useful for reactor selection and scale up. Greater insight was gained into the hydrodynamics and mass transfer characteristics of the monolith reactor from studies in single capillaries. A summary of the main contributions resulting from the work done follows.
8.2 SLURRY BUBBLE COLUMN
Investigation of the gas holdup, εG and volumetric mass transfer coefficient, kLa for pure liquid systems in bubble columns revealed that the quantity kLa/εG, which can be viewed as the volumetric mass transfer coefficient per unit volume of dispersed gas bubbles, is independent of the superficial gas velocity, UG in the churn-turbulent regime i.e., UG > 0.1 m/s. Furthermore, for liquids in the churn-turbulent regime, kLa/εG was shown to have a Sc-1/3 dependency, where Sc is the liquid phase Schmidt number. kLa/εG was found not to follow a specific trend for slurry systems. For air-water-silica, air-tetradecane-silica and air-tetradecane-alumina systems, an increase in the slurry concentration, εS led to a decrease in kLa/εG for a given value of UG. The converse was the case for air-paraffin oil B-alumina system. While the exact reason for these different behaviors remains unclear, it does appear that the nature of the solid particles used affects gas-liquid mass transfer to a significant extent. The following ‘simple’ strategy was proposed for estimating the gas-liquid volumetric mass transfer coefficient in slurry bubble columns for the industrially relevant churn-turbulent regime of operation:
Estimate the gas
holdup,εG Use value topredict kLa in thepure liquid based
on the liquidphase Sc number
(see Fig. 2.8)Fig. 2.6(a) for ofdifferent liquids. Fig.
2.13(a) and (d) for columndiameter effect on
εG
εG
εG Correct for column
diameter effectwith known kLa/(see Fig. 2.15)
εG
Account for effect ofslurry concentration
on kLa/(see Figs. 2.9, 2.11.
2.12)
εG
151
Chapter 8 Conclusions
Video imaging techniques were used to study the hydrodynamics of a Fischer-Tropsch like slurry system i.e., paraffin oil B-alumina, in a rectangular slurry bubble column. This study revealed that the large bubble diameter is practically independent of the superficial gas velocity in the churn-turbulent regime of operation for slurry concentrations greater than 5-vol % and superficial gas velocities in excess of 0.1 m/s. The validity of the extended Davies-Taylor relationship for predicting the rise velocity of large bubbles in a slurry system, through the incorporation of a scale correction factor, SF and an acceleration factor, AF was ascertained. Estimates of the liquid side mass transfer coefficient, kL resulted in values that were an order of magnitude higher than those predicted on the basis of literature correlations. The reason for this is the frequent breakup and coalescence of large bubbles, which occurs in the churn-turbulent regime of operation.
8.3 MONOLITH LOOP REACTOR
The study of the gas-liquid mass transfer coefficient in an upflow monolith loop reactor, an internal loop airlift reactor and a bubble column, revealed a superior mass transfer performance of the monolith. This better performance, ascribed to the unique gas-liquid flow pattern in the channels of the monolith reactor, known as Taylor flow, provides interesting opportunities for mass transfer-limited three-phase applications and process intensification. Preliminary predictions of the gas-liquid volumetric mass transfer coefficient, based on hydrodynamic parameters obtained from studies in a single capillary, showed that the bulk of mass transfer occurred to the liquid film surrounding a Taylor bubble as it rose in the monolith channel. For these predictions, a mass transfer model, accounting for the separate contributions of gas-liquid mass transfer from the bubble cap and liquid film surrounding the bubble, was used.
Low frequency vibrations (amplitude of 0.5 mm and frequency of 60 Hz) were found to improve the gas-liquid mass transfer in multiphase systems. For monolith reactors, significant improvements in the volumetric mass transfer coefficient per unit volume of gas bubbles, kLa/εG was achieved. Better gas-liquid distribution into the monolith channels also resulted from the application of these low frequency vibrations.
8.4 SINGLE CAPILLARIES
HYDRODYNAMICS
To facilitate the understanding of flow conditions in the channels of a monolith reactor, extensive studies were carried out in single capillaries to investigate hydrodynamic and mass transfer parameters. Employing circular and square capillaries in the 1 to 3-mm dimension range, as well as different liquids, the Taylor flow regime was studied in depth.
152
Chapter 8 Conclusions
A parameter called the slip ratio was demonstrated to be very useful and practicable for gauging the transition from homogeneous to non-homogeneous flow in single capillary two-phase flow. The Taylor flow regime, which happens to be of interest in the operation of monolith reactors, is non-homogeneous.
A new and simplified correlation was postulated for estimating the rise velocity of a Taylor bubble in a single channel. The beauty of this correlation is that in addition to being a function of the gas and liquid superficial velocities, it is also dependent only on the Capillary number, Ca. Excellent agreement between the correlation and experimental rise velocity data were obtained.
Predicting the liquid slug length remains problematic. Though an attempt was made to develop a correlation for doing this, the fact remains that the liquid slug length is heavily dependent on the configuration of the gas-liquid inlet nozzle used in a single capillary setup. More research is thus needed to understand the complex interplay of gas-liquid feed system and the liquid slug length.
A flow regime dependent pressure drop model was developed for predicting the total pressure drop in capillary two-phase flow systems, and invariably, in the channels of a monolith reactor. This approach differed from others in the literature by considering pressure drop to be heavily influenced by the particular flow regime, which results from gas-liquid flow in the capillary.
MASS TRANSFER
The study of the Taylor flow regime gas-liquid volumetric mass transfer coefficient, kLa revealed two very important findings. Firstly, a strong dependence of channel dimension on kLa was observed. And secondly, the bulk of gas-liquid mass transfer occurred around the liquid film surrounding the gas bubble. The second conclusion was reached based on the application of a literature model for predicting kLa, a model formulated on the basis of Higbie’s penetration theory for mass transfer and backed by extensive computational fluid dynamics (CFD) simulations.
At low gas and liquid velocities and with long Taylor bubble lengths, the liquid film surrounding a gas bubble could quickly become saturated with dissolved gas, meaning that its contribution to mass transfer will be diminished, as was the case with a literature study presented in chapter 7. The parameter ((UG+UL)/Lslug) was used to provide information on what range mass transfer from a Taylor bubble to the liquid film surrounding the bubble will be dominant. This range corresponded to ((UG+UL)/Lslug)0.5 > 3 s-0.5. Once this criteria is met, the overall volumetric mass transfer coefficient can be estimated from the film contribution i.e., kLa ≈ kL,filmafilm.
For gas-liquid mass transfer limited two- or three-phase reactions, the monolith loop reactor is a better choice compared to the slurry bubble column. From exploring
153

Chapter 8 Conclusions
hydrodynamics and mass transfer in a bubble column, this dissertation delved into studying both the airlift and monolith loop reactors, with greater emphasis on the latter. The single capillary studies helped provide a much better picture of what goes on in the channels of the monolith from a hydrodynamic and mass transfer point of view – a useful vantage point when designing and scaling up monolith reactors for a wide range of applications.
154

Samenvatting
SAMENVATTING (DUTCH SUMMARY)
INLEIDING
Meerfasen reactoren zoals (slurry)-bellenkolommen, internal loop airlift reactoren en monolith reactoren worden toegepast in vele industriële processen en vormen daarmee de basis voor de bereiding van een groot aantal producten. Voor de twee- en drie-fasen reacties die worden uitgevoerd in deze reactoren is de voeding meestal een gas dat naar de vloeistoffase moet worden overgebracht, en in sommige gevallen ook nog naar de vaste fase, om de reactie te laten plaatsvinden. Daarom is een grondig inzicht vereist in de gas-vloeistof stofoverdracht en de hydrodynamica van elk van deze drie typen reactoren. Dit niet alleen om voor een bepaald proces de juiste reactor te kiezen maar ook voor het opschalen ervan. De stromingspatronen in de bellenkolom en in de internal airlift reactor verschillen veel ten opzichte van de monolith reactor. In Fig. 0.1 is te zien dat er veel variatie is in de grootte van de bellen in de bellenkolom en de airlift reactor, waarbij deze variatie in de airlift reactor kleiner is. In de monolith loop reactor volgen de bellen een ander patron, ook wel bekend als Taylor flow, waarbij de afzonderlijke gasbellen, van elkaar gescheiden door de vloeistof, door de monolith kanaaltjes stijgen. Deze verschillen in stromingspatronen geven interessante mogelijkheden voor het bestuderen van de reactor hydrodynamica en de gas-vloeistof stofoverdracht.
(a) (b)
large gas bubble
small gas bubble
gas bubble (knownas Taylor bubble)
liquid
monolithchannel wall
Figuur 0.1: Gas-vloeistof stromingspatronen in een (a) bellenkolom en een airlift reactor en (b) monolith reactor.
SLURRY BELLENKOLOMMEN
Het experimentele onderzoek is gestart met (slurry)-bellenkolommen, gebruik makend van kolommen met een interne diameter DT van 0.051 m tot 0.63 m. Hierbij was de aandacht gericht naar het effect van vloeistofeigenschappen, katalysator concentratie en de kolom diameter op de gasfractie εG en de gas-vloeistof stofoverdrachts coëfficiënt, kLa. Hiervoor zijn een groot aantal experimenten uitgevoerd waarbij kLa bepaald is met een dynamische zuurstof absorbtie methode. Interessant is dat in het in de industrie veel gebruikte
155
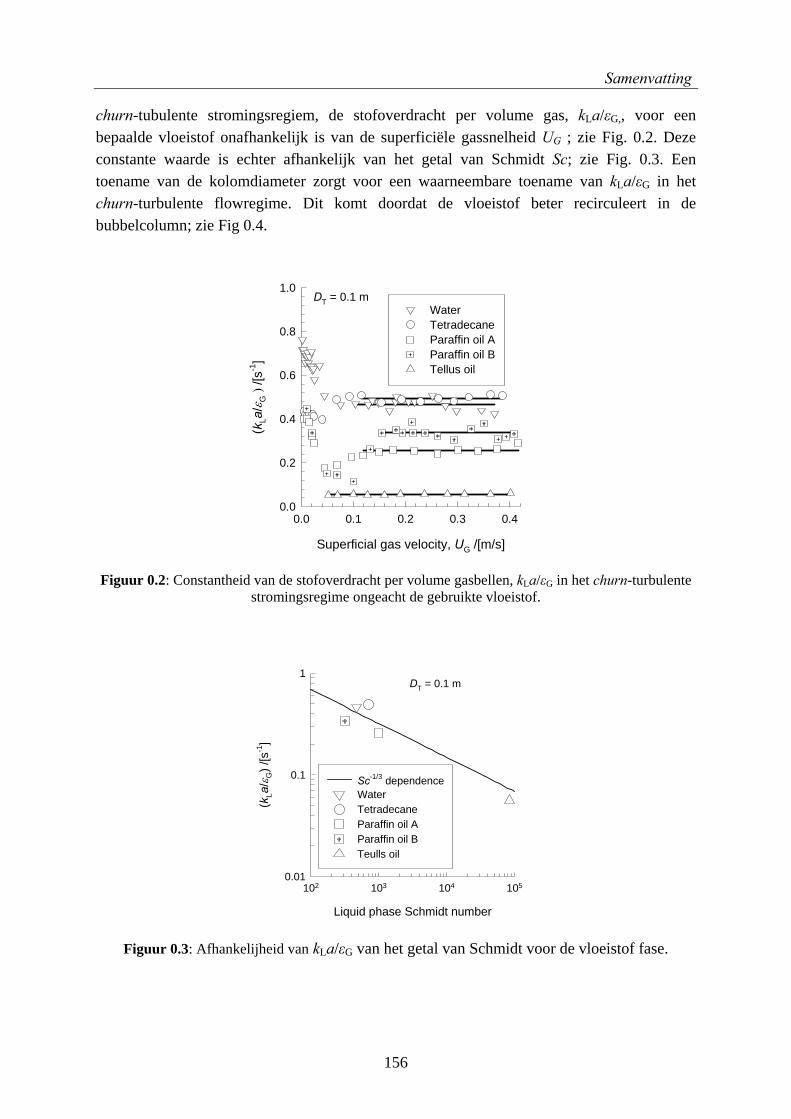
Samenvatting
churn-tubulente stromingsregiem, de stofoverdracht per volume gas, kLa/εG,, voor een bepaalde vloeistof onafhankelijk is van de superficiële gassnelheid UG ; zie Fig. 0.2. Deze constante waarde is echter afhankelijk van het getal van Schmidt Sc; zie Fig. 0.3. Een toename van de kolomdiameter zorgt voor een waarneembare toename van kLa/εG in het churn-turbulente flowregime. Dit komt doordat de vloeistof beter recirculeert in de bubbelcolumn; zie Fig 0.4.
Superficial gas velocity, UG /[m/s]
0.0 0.1 0.2 0.3 0.4
(kLa
/εG
) /[s
-1]
0.0
0.2
0.4
0.6
0.8
1.0
WaterTetradecaneParaffin oil AParaffin oil BTellus oil
DT = 0.1 m
Figuur 0.2: Constantheid van de stofoverdracht per volume gasbellen, kLa/εG in het churn-turbulente stromingsregime ongeacht de gebruikte vloeistof.
Liquid phase Schmidt number
102 103 104 105
(kLa
/εG) /
[s-1
]
0.01
0.1
1
Sc-1/3 dependenceWaterTetradecaneParaffin oil AParaffin oil BTeulls oil
DT = 0.1 m
Figuur 0.3: Afhankelijheid van kLa/εG van het getal van Schmidt voor de vloeistof fase.
156
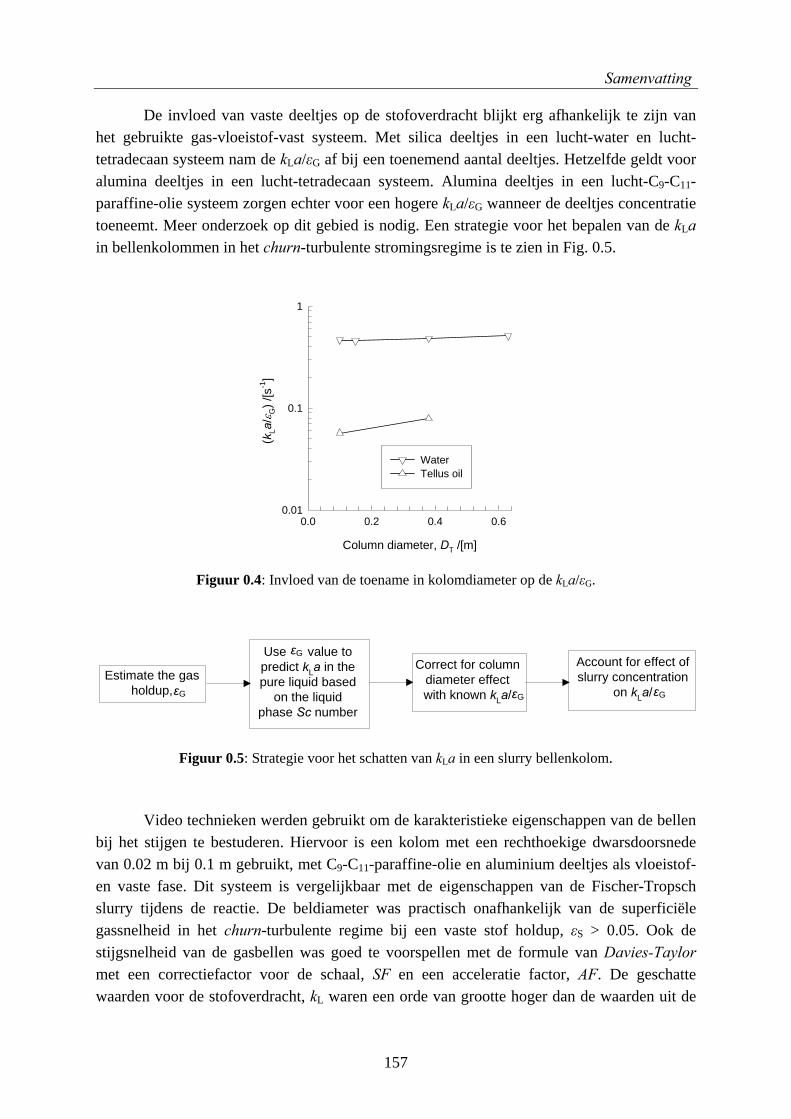
Samenvatting
De invloed van vaste deeltjes op de stofoverdracht blijkt erg afhankelijk te zijn van het gebruikte gas-vloeistof-vast systeem. Met silica deeltjes in een lucht-water en lucht-tetradecaan systeem nam de kLa/εG af bij een toenemend aantal deeltjes. Hetzelfde geldt voor alumina deeltjes in een lucht-tetradecaan systeem. Alumina deeltjes in een lucht-C9-C11-paraffine-olie systeem zorgen echter voor een hogere kLa/εG wanneer de deeltjes concentratie toeneemt. Meer onderzoek op dit gebied is nodig. Een strategie voor het bepalen van de kLa in bellenkolommen in het churn-turbulente stromingsregime is te zien in Fig. 0.5.
Column diameter, DT /[m]
0.0 0.2 0.4 0.6
(kLa
/εG) /
[s-1
]
0.01
0.1
1
WaterTellus oil
Figuur 0.4: Invloed van de toename in kolomdiameter op de kLa/εG.
Estimate the gasholdup,εG
Use value topredict kLa in thepure liquid based
on the liquidphase Sc number
εG Correct for column
diameter effectwith known kLa/εG
Account for effect ofslurry concentration
on kLa/εG
Figuur 0.5: Strategie voor het schatten van kLa in een slurry bellenkolom.
Video technieken werden gebruikt om de karakteristieke eigenschappen van de bellen bij het stijgen te bestuderen. Hiervoor is een kolom met een rechthoekige dwarsdoorsnede van 0.02 m bij 0.1 m gebruikt, met C9-C11-paraffine-olie en aluminium deeltjes als vloeistof- en vaste fase. Dit systeem is vergelijkbaar met de eigenschappen van de Fischer-Tropsch slurry tijdens de reactie. De beldiameter was practisch onafhankelijk van de superficiële gassnelheid in het churn-turbulente regime bij een vaste stof holdup, εS > 0.05. Ook de stijgsnelheid van de gasbellen was goed te voorspellen met de formule van Davies-Taylor met een correctiefactor voor de schaal, SF en een acceleratie factor, AF. De geschatte waarden voor de stofoverdracht, kL waren een orde van grootte hoger dan de waarden uit de
157

Samenvatting
literatuur. De reden hiervan is het frequent opbreken en samengroeien van de bellen in het turbulente stromingsregime.
MONOLITH LOOP REACTOR
Het onderzoek werd voortgezet met gas-vloeistof stofoverdrachtsmetingen in een internal loop upflow monolith reactor en een internal loop airlift reactor. De resultaten hiervan zijn vergeleken met die van de eerder bestudeerde bellenkolommen. De monolith reactor is opgebouwd uit segmenten van keramisch monolith met vierkante kanalen, zoals te zien is in Fig. 0.6 in de stijgsectie, waar het gas en de vloeistof opstijgen.
Figuur 0.6: Keramisch monolith segment met vierkante kanaaltjes gebruikt in de monolith reactor experimenten.
Bij een zekere superficiële gassnelheid, UG, is de stofoverdrachtscoëfficiënt, kLa veel hoger in een monolith reactor dan in een airlift reactor of bellenkolom zoals te zien is in Fig. 0.7. kLa/εG is het hoogst in de airlift reactor maar de monolith presteert nog steeds veel beter dan een bellenkolom. Voor de resultaten in Fig. 0.7, zijn gelijkwaardige gasverdelers met gaatjes van 0.5 mm diameter gebruikt voor alle reactoren. De hogere kLa waarden in de monolith reactor zijn het gevolg van het unieke gas-vloeistof stromingspatroon door de monolith kanalen, de zogenaamde Taylor flow; zie Fig. 0.1.
Voorspellingen van de gas-vloeistof overdrachtscoëfficiënt gebaseerd op resultaten verkregen uit experimenten in een afzonderlijk kanaaltje toonden aan dat het grootste gedeelte van het massatransport plaatsvond in de vloeistoffilm rondom de Taylor bel tijdens het stijgen in het monolith kanaal. Voor deze voorspellingen is een model gebruikt waarbij afzonderlijk rekening is gehouden met de gas-vloeistof stofoverdracht bij de bubble cap en bij de vloeistof film om de bel. Verder is de invloed van laag frequente trillingen (amplitude van λ = 0.5 mm en frequentie f = 60 Hz) op de hydrodynamica en de stofoverdracht in monolith loop reactoren met vierkante en ronde kanalen, een airlift loop reactor en een bellenkolom experimenteel onderzocht. Voor deze experimenten is een gasverdeler gebruikt bestaande uit 0.9 mm diameter capillairen. Zoals te zien is in Fig. 0.8, zijn kLa en kLa/εG veel hoger voor monolith reactoren.
158

Samenvatting
Superficial gas velocity, UG /[m/s]
0.00 0.05 0.10 0.15
k La
/[s-1
]
0.00
0.05
0.10
0.15
0.20
0.25
0.30MonolithAirliftBubble column
Superficial gas velocity, UG /[m/s]
0.00 0.05 0.10 0.15
k La/
ε G /[
s-1]
0.0
0.5
1.0
1.5
2.0MonolithAirliftBubble column
(a) (b)
Figuur 0.7: Vergelijking van de prestaties van de monolith-, airlift- en bellenkolom reactoren.
Superficial gas velocity, UG /[m/s]
0.00 0.05 0.10 0.15
k La
/[s-1
]
0.00
0.05
0.10
0.15
Monolith (circular)Monolith (square)AirliftBubble column
Superficial gas velocity, UG /[m/s]
0.00 0.05 0.10 0.15
k La/ε
G /[
s-1]
0.0
0.5
1.0
1.5Monolith (circular)Monolith (square)AirliftBubble column
Superficial gas velocity, UG /[m/s]
0.00 0.05 0.10 0.15
k La
/[s-1
]
0.00
0.05
0.10
0.15
0.20
0.25Monolith (circular)Monolith (square)AirliftBubble column
Superficial gas velocity, UG /[m/s]
0.00 0.05 0.10 0.15
k La/
ε G /[
s-1]
0.0
0.5
1.0
1.5
2.0
2.5Monolith (circular)Monolith (square)AirliftBubble column
(a) (b)
(c) (d)
without vibrations without vibrations
with vibrations:λ = 0.5 mm; f = 60 Hz with vibrations:
λ = 0.5 mm; f = 60 Hz
Figuur 0.8: Vergelijking van kLa en kLa/εG van de monolith reactor (ronde en vierkante kanalen) met de airlift reactor en de bellenkolom.
159

Samenvatting
Verder vergroot het toepassen van laag frequente trillingen de waarden van kLa en kLa/εG. Ook zorgt de vibratie in de monolith reactoren voor een betere gas-vloeistof distributie in de monolith kanalen. Door de betere stofoverdracht is de monolith reactor een goede kandidaat voor stofoverdrachts gelimiteerde reacties. Stofoverdrachtslimitatie wordt vaak verkleind door mechanisch roeren met backmixing als gevolg waardoor de reactiesnelheid afneemt en de reactor productiviteit beperkt wordt. De monolith reactor biedt het unieke voordeel van niet alleen hoge stofoverdracht maar ook de gewenste propstroming, waarmee de nadelen ten opzichte van roeren wegvallen. Om een beter inzicht te krijgen in de verhoogde stofoverdracht bij Taylor flow, zijn uitgebreide experimenten uitgevoerd in afzonderlijke capillairen.
AFZONDERLIJKE CAPILLAIREN
Er zijn twee soorten onderzoek gedaan in afzonderlijke capillairen: ten eerste is de hydrodynamica van de Taylor flow onderzocht en is gelet op de stromingsregiems en de regiem overgangen alsmede de ontwikkeling van praktisch toepasbare correlaties voor de voorspelling van de stijgsnelheid van de gasbellen, de lengte van de vloeistof slugs en de totale drukval. Ten tweede zijn gas-vloeistof stofoverdrachts expeirmenten uitgevoerd.
Voor de bestudering van de hydrodynamica zijn ronde en vierkante capillairen gebruikt met een hydraulische diameter variërend van 0.9 mm tot 3mm. Water, ethanol of een olie mengsel zijn gebruikt als vloeistoffase. Belangrijk resultaat van dit onderzoek is de karakterisering van de stromingsregiems, bruikbaar voor het voorspellen onder welke condities Taylor flow zal optreden in de kanaaltjes van een monolith reactor. Tevens is er een eenvoudige, praktisch toepasbare correlatie ontwikkeld voor het schatten van de stijgsnelheid van de gasbel in een afzonderlijk kanaaltje. De kracht van deze correlatie is dat zij alleen afhankelijk is van de gas- en vloeistofsnelheden en het Capillair getal, Ca, dat een functie is van de vloeistof eigenschappen. In Fig. 0.9 is voor een aantal systemen te zien, dat er een zeer geode overeenstemming is tussen de voorspelde en de gemeten stijgsnelheden van de gasbellen. De voorspelling van de lengte van de vloeistof slugs, Lslug, is lastig omdat deze lengte mede afhankelijk is van het gas-vloeistof injectie system.
Verder is er een van het stromingsregiem afhankelijk model opgesteld voor de voorspelling van de drukval van tweefasen systemen in capillairen, overeenkomend met de kanalen van de monolith reactor. Dit model steunt op de aanname van dimensieloze drukfactoren. Er zijn correlaties ontwikkeld voor drukfactoren in het homogene en het heterogene stromingsregiem. De voorspellingen van dit nieuwe drukval model komen goed overeen met de gemeten waarden zoals te zien is in Fig. 0.10.
Een groot aantal experimenten zijn uitgevoerd in afzonderlijke capillairen om een beter inzicht te krijgen in het stoftransport van de Taylor bellen naar de omringende vloeistoffase. De experimentele resultaten werden vergeleken met een theoretisch stofoverdrachts model van van Baten en Krishna, waarin de afzonderlijke bijdragen van de stofoverdracht van de bubble cap en van de dunne vloeistoffilm welke de gasbel omringt zijn
160

Samenvatting
opgenomen. Dit model is ontwikkeld op basis van de Higbie stofoverdrachts theorie en getest met uitgebreide computer (CFD) simulaties. De basis van dit model is weergegeven in Fig. 0.11.
Two phase superficial velocity, UTP /[m/s]
0.0 0.2 0.4 0.6 0.8 1.0 1.2
Bubb
le ri
se v
eloc
ity, V
b /[m
/s]
0.0
0.2
0.4
0.6
0.8
1.0
1.2
1.4
1.6
ExperimentalCorrelation
3.02-mm circularAir-water
Two phase superficial velocity, UTP /[m/s]
0.0 0.2 0.4 0.6 0.8
Bubb
le ri
se v
eloc
ity, V
b /[m
/s]
0.0
0.2
0.4
0.6
0.8
1.0
ExperimentalCorrelation
2.89-mm squareAir-water
Two phase superficial velocity, UTP /[m/s]
0.0 0.2 0.4 0.6 0.8
Bub
ble
rise
velo
city
, Vb /
[m/s
]
0.0
0.2
0.4
0.6
0.8
1.0
ExperimentalCorrelation
3.02-mm circularAir-ethanol
Two phase superficial velocity, UTP /[m/s]
0.0 0.1 0.2 0.3 0.4
Bubb
le ri
se v
eloc
ity, V
b /[m
/s]
0.0
0.1
0.2
0.3
0.4
0.5
0.6
ExperimentalCorrelation
2.89-mm squareAir-oil mixture
(a) (b)
(c) (d)
Figuur 0.9: Experimenteel bepaalde stijgsnelheden Vb van de gasbellen samen met de voorspelde waarden van de opgestelde correlaties.
50
Superficial gas velocity, UG /[m/s]0.01 0.1 1
Tota
l pre
ssur
e dr
op, ∆
PT
/[kPa
]
1
10
UL=0.009 m/sUL=0.054 m/sUL=0.159 m/sUL=0.268 m/sUL=0.363 m/sUL=0.455 m/sUL=0.009 m/sUL=0.054 m/sUL=0.159 m/sUL=0.268 m/sUL=0.363 m/sUL=0.455 m/s
3.02-mm circularAir-water
50
(a) (b)
Superficial gas velocity, UG /[m/s]
0.01 0.1 1
Tota
l pre
ssur
e dr
op, ∆
PT
/[kPa
]
1
10
UL=0.021 m/sUL=0.124 m/sUL=0.343 m/sUL=0.537 m/sUL=0.021 m/sUL=0.124 m/sUL=0.343 m/sUL=0.537 m/s
2-mm circularAir-ethanol
Figuur 0.10: Voorspelde en experimenteel bepaalde waarden van de totale drukval.
161

Samenvatting
hemispherical cap
1
2
liquid film
2
1
liquid slug1
2
bubble cap mass transfer coefficient, kL,capacap
liquid film mass transfer coefficient, kL,filmafilm
Key:
overall volumetric mass transfer coeffiient:kLa = kL,capacap + kL,filmafilm
Figuur 0.11: Gas-vloeistof stofoverdracht van een Taylor bel volgens het model van van Baten en Krishna.
Het experimenteel onderzoek naar de stofoverdracht van de gasfase naar de vloeistoffase in Taylor flow heeft geleid tot twee belangrijke conclusies. Ten eerste is een sterke afhankelijkheid vastgesteld van de afmetingen van het capillair op de volumetrische stofoverdrachts coëfficiënt kLa; zie Fig. 0.12. Ten tweede bleek dat de vloeistoffilm rondom de Taylor bel een overheersende bijdrage aan het stoftransport levert. Een vergelijking met een studie uit de literatuur liet zien dat de parameter (UG + UL)/Lslug bruikbare informatie levert over het gebied waarin de filmbijdrage aan het stoftransport overheerst. Als [(UG + UL)/Lslug]0.5 > 3 s-0.5 kan de volumetrische stofovergangs coëfficiënt worden geschat uit de film bijdrage, kLa = kL,filmafilm. Beneden dit gebied wordt de bijdrage van de bubble cap steeds belangrijker terwijl die van de film steed geringer wordt. Het is interessant om te vermelden dat ook in de onderzochte monolith reactoren kL,filmafilm dominant was en kLa kan worden benaderd door kL,filmafilm.
Samenvattend levert het werk vervat in dit proefschrift nieuwe inzichten m.b.t. de gas-vloeistof stofoverdracht in bellenkolommen, de airlift loop reactor en de monolith loop reactor en laat zien dat de stofoverdracht in de monolith reactor groter is dan in de slurry bellenkolom. Dit opent perspectieven voor de toepassing van de monolith reactor bij nieuwe processen. De opgedane kennis omtrent de monolith reactor is mede verkregen door middel van onderzoek aan afzonderlijke capillairen.
162
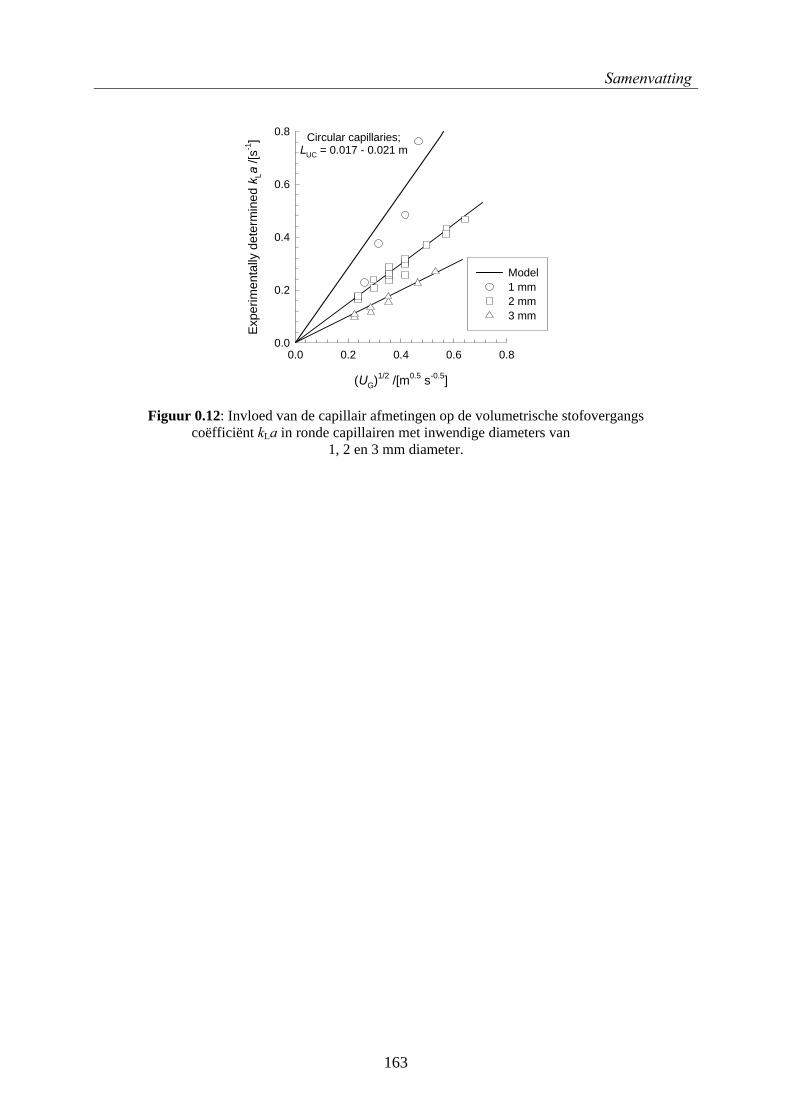
Samenvatting
(UG)1/2 /[m0.5 s-0.5]
0.0 0.2 0.4 0.6 0.8
Expe
rimen
tally
det
erm
ined
kLa
/[s-1
]
0.0
0.2
0.4
0.6
0.8
Model1 mm2 mm3 mm
Circular capillaries;LUC = 0.017 - 0.021 m
Figuur 0.12: Invloed van de capillair afmetingen op de volumetrische stofovergangs coëfficiënt kLa in ronde capillairen met inwendige diameters van
1, 2 en 3 mm diameter.
163

Publications and Presentations
PUBLICATIONS AND PRESENTATIONS
PUBLICATIONS
(1) C.O. Vandu, J. Ellenberger and R. Krishna, Hydrodynamics and mass transfer in an upflow monolith loop reactor, Chemical Engineering & Processing 2005, 44, 363-374.
(2) C.O. Vandu, K. Koop and R. Krishna, Volumetric mass transfer coefficient in a slurry bubble column operating in the heterogeneous flow regime, Chemical Engineering Science 2004, 59, 5417-5423.
(3) C.O. Vandu, J. Ellenberger and R. Krishna, Hydrodynamics and mass transfer in an upflow monolith loop reactor: influence of vibration excitement, Chemical Engineering Science 2004, 59, 4999-5008.
(4) C.O. Vandu, K. Koop and R. Krishna, Large bubble sizes and rise velocities in a bubble column slurry reactor, Chemical Engineering & Technology 2004, 27, 1195-1199.
(5) C.O. Vandu and R. Krishna, Volumetric mass transfer coefficients in slurry bubble columns operating in the churn-turbulent flow regime, Chemical Engineering & Processing 2004, 43, 987-995.
(6) C.O. Vandu and R. Krishna, Influence of scale on the volumetric mass transfer coefficients in bubble columns, Chemical Engineering & Processing 2004, 43, 575-579.
(7) C.O. Vandu and R. Krishna, Gas holdup and volumetric mass transfer coefficient in a slurry bubble column, Chemical Engineering & Technology 2003, 26, 779-782.
(8) H. Liu, C.O. Vandu and R. Krishna, Hydrodynamics of Taylor flow in vertical capillaries: flow regimes, bubble rise velocity, liquid slug length and pressure drop, Industrial & Engineering Chemistry Research, (in press, available online December 2004).
(9) C.O. Vandu, H. Liu and R. Krishna, Mass transfer from Taylor bubbles rising in single capillaries, Chemical Engineering Science, (accepted for publication).
ORAL PRESENTATION
(1) C.O. Vandu, K. Koop and R. Krishna, Volumetric mass transfer coefficients in slurry bubble columns operating in the heterogeneous flow regime. Presented at the 18th International Symposium on Chemical Reaction Engineering (ISCRE), Chicago IL, United States, 2004.
165

Publications and Presentations
POSTER PRESENTATION
(1) C.O. Vandu, J. Ellenberger and R. Krishna, Hydrodynamics and mass transfer in
an upflow monolith loop reactor. Presented at the 18th International Symposium on Chemical Reaction Engineering (ISCRE), Chicago IL, United States, 2004.
166

Acknowledgements
ACKNOWLEDGEMENTS
My heartfelt thanks goes to my advisor, Professor Rajamani Krishna for the
opportunity to undergo my doctoral study in his research group, as well as under his direct supervision. From him, I have learnt so much. The past two and a half years have indeed been fulfilling and truly remarkable. Thanks also to Dr. Jürg Ellenberger. Dr. Ellenberger was of immense assistance in ensuring that the setups used for my experiments were properly functional. He always seemed to have time to listen to my suggestions, requests or questions. He is truly irreplaceable in the group.
I will also like to extend my gratitude to Dr. Berthold Breman and Dr. Wim Brilman of Sasol Research, Enschede, The Netherlands. During the course of my doctoral research work, I had the opportunity of interacting with them quite often. They assisted in providing some of the materials used in my research experiments, as well as granting partial financial support to my work. I had several useful discussions with them. Dr. Thorsten Boger of Corning, Germany is acknowledged for providing the cordierite monoliths used in my research.
My colleagues at Professor Krishna’s research group, Dr. Jasper van Baten, Dr. Richard Baur, Jose Ojeda Nava and Dr. Martijn Springer, have also been truly helpful. They have been very nice people to work with as well as engage in a wide range of discussion topics during lunch breaks. I also had the privilege of supervising or working with two students. From both of them, I got to learn something new. They are Jarno Kuijvenhoven, whose M.Sc. project on Monolith Reactors I supervised, and Klaas Koop, a visiting research student from Sasol, Enschede with whom I performed some slurry bubble column experimental study.
The ability to successfully conduct experiments would simply not have been possible without the kind assistance of Wietze Buster, Theo Nass, Co Zoutberg and Daan de Zwarte of the Mechanical Workshop at the University of Amsterdam. They were involved in fabricating some of the columns used in my experiments and I would hereby like to express my gratitude to them. Bert van Groen and Gerrie Braspenning of the Glass Department helped in fabricating the single capillaries, rectangular bubble column and circular-channel glass monolith block as well as doing the machining on the cordierite monolith blocks. Thanks to you both. Thanks also to Hans Agema and Paul Collignon of the Electronics Workshop for their assistance in ensuring that the electrical equipment used in my research functioned properly.
Thanks to Fred van den Aardweg, the institute manager, who oversaw the procedure of my employment as a PhD researcher at the University of Amsterdam. And to Britta Duiker and Renate Hippert of the Institute Secretariat and Maureen Sabandar of the Accounts Department, I would like to say thank you very much for your immense assistance during my period of study. I also had a number of very useful discussions with Dr. Gadi Rothenberg, an assistant professor in the Catalysis Group at the University of Amsterdam, and would like to express my gratitude to him.
167

Acknowledgements
I got to know some truly nice people in the Netherlands, who have been helpful in one way or another. They are: Professor Dirk Feil and his wife Annet, Arnout Roos, René Waggeveld, Praveen Lawrence Samuel, Olja Stanimirovic, Intan Ambari, Vinit Chilekar, Andrea Acuña and her husband Michael Colijn, Susana Cruz and Nabil Khalil. Thanks to you all.
Dr. Hui Liu, a visiting scholar from Beijing University of Chemical Technology, China spent some time working with Professor Krishna, and I had the opportunity of working with him during this period on two-phase flow in single capillaries. Thanks to him for the critical assessment he gave to my work as well as the opportunity to work together.
Thanks to Ben van den Berg and Dr. Jürg Ellenberger, once again, for translating the summary of this thesis to Dutch (the Samenvatting).
Finally, I would very much like to thank my wonderful parents, Celine and Simon Vandu for their support and encouragement all through my education, and for teaching a six-year old child to aspire to what he can become, to have no fear, but to dream and reach out to that dream.
_________________________________________________________________
The author acknowledges a grant from the Netherlands Foundation for Scientific Research, Chemical Sciences Division (NWO-CW).
168