UUNNIIVVEERRSSIITTYY OOFF...
23
UNIVERSITY OF NAIROBI COLLEGE OF BIOLOGICAL AND PHYSICAL SCIENCES School of Physical Sciences Post Graduate Diploma in Aviation Meteorology Aviation Weather (SMR 525) Practical Manual for Academic Year 2015/16 (SECOND SEMESTER) January-April 2016 Written By: Prof. Ininda J. M Department of Meteorology University of Nairobi
Transcript of UUNNIIVVEERRSSIITTYY OOFF...

UUNNIIVVEERRSSIITTYY OOFF NNAAIIRROOBBII
CCOOLLLLEEGGEE OOFF BBIIOOLLOOGGIICCAALL AANNDD PPHHYYSSIICCAALL SSCCIIEENNCCEESS
SScchhooooll ooff PPhhyyssiiccaall SScciieenncceess
PPoosstt GGrraadduuaattee DDiipplloommaa iinn AAvviiaattiioonn MMeetteeoorroollooggyy
AAvviiaattiioonn WWeeaatthheerr
((SSMMRR 552255))
PPrraaccttiiccaall MMaannuuaall ffoorr AAccaaddeemmiicc YYeeaarr 22001155//1166
((SSEECCOONNDD SSEEMMEESSTTEERR))
JJaannuuaarryy--AApprriill 22001166
WWrriitttteenn BByy::
PPrrooff.. IInniinnddaa JJ.. MM DDeeppaarrttmmeenntt ooff MMeetteeoorroollooggyy
UUnniivveerrssiittyy ooff NNaaiirroobbii

INTRODUCTION TO PRACTICALS IN AVIATION WEATHER
The series of practical in AVIATION WEATHER are aimed at equipping the students with
practical skills in current practices of weather analysis and computational skills.
PRACTICAL TIME TABLE (SMR 204 2014/15)
SERIAL NO. DESCRIPTION DATE DUE FOR
HANDING IN
Allocation of
percentage
Marks
Practical - 01 Decoding the weather
message
23rd
February, 2016 10
Practical - 02 Plotting SYNOP report on the
weather Chart
1st March, 2016 10
Practical - 03 Coding upper air data
8th
March 2016 10
Practical - 04 Plotting the sounding on a
T
15th
March 2016 15
Practical - 05 Writing and interpretation of
METAR
22nd
March 2016 15
Practical - 06 Writing and interpretation of
SIGMET
29th
March 2016 15
CAT
15th
March 2016
25
TOTAL MARKS
100
Useful websites
http://www.wmo.int/pages/prog/www/WMOCodes/Manual/Volume-I-selection/Sel2.pdf
http://www.metoffice.gov.uk/media/pdf/e/a/No._13_-_Upper_Air_Measurements.pdf
http://www.ofcm.gov/fmh3/pdf/13-app-e.pdf (For upper air wind and Temperature coding)
PRACTICAL 1: DECODING THE WEATHER MESSAGE
Objective:
The practical is aimed at enabling the student decode the weather messages

a) A table of coded weather messages
b) The lecture notes
Procedure:
Decode the weather message for the assigned data
TABLE 1 The data assigned to each student .
S/N STUDENT
REG NO.
DATA
1 I50/78854/2015 AAXX 15004 96091 11457 70000 10246 20243 30073 40097
51012 60024 71622 84878 333 20245 50380 55014 56000
57802 59006 82613 83817 86280=
AAXX 15124 96109 01456 70000 10256 20229 30033 40070
52016 69941 71396 84931 333 10334 56000 57901 58000
81915 83617 85360 80960=
AAXX 07064 63717 11980 32301 10162 20141 48558 60014
70244 83050 333 20120 59004 83358=
AAXX 07064 63793 12580 61610 10247 20213 40158 69904
8653/ 333 20210 58001 86620=
2 I50/81309/2015 AAXX 14064 96009 01440 80102 10256 20244 30060 40095
58006 60091 79596 8692/ 333 56009 57901 60097 82914
84615 85460 80965=
AAXX 15004 96015 01450 80704 10234 20231 30096 40101
52011 60514 72196 8552/ 333 20230 50970 55056 56009
58010 60017 85612 85457=
AAXX 02064 03008 11482 60210 10044 21030 40164 60002
71511 868// 333 20017 31101 79999 81818 85645=
AAXX 02184 03068 12782 51214 10073 21040 30108 40117
56014 60002 85500 333 10095 85650=
PRACTICAL 2: PLOTTING THE WEATHER INFORMATION ON A CHART
Objective:
The practical is aimed at enabling the student plot on a weather chart.
Tools

a) A table of coded weather messages
b) Lecture Notes
c) A chart (map) with station indicated on it
Procedure:
Plot the weather messages for the stations over Kenya at 15GMT on figure 1. For the dates
assigned
(N B. You will need to print out the figure1)
1. Code the data assigned to you.
S/N STUDENT
REG NO.
DATE
1 I50/78854/2015 15TH
NOVEMBER 2015
2 I50/81309/2015 10TH
JANUARY, 2016

Figure 1: The Synoptic stations over Kenya

PRACTICAL 3: CODING THE UPPER AIR OBSERVED WEATHER
Objective:
The practical is aimed at enabling the student code the observed weather
a) A table of observed weather
b) The lecture notes
Procedure:
Code the weather message give in table 2 and 3
Tools
a) WMO MANNUAL ON CODING
b) Upper air DATA
Instructions
2. Code the data assigned to you.
S/N STUDENT
REG NO.
DATA
1 I50/78854/2015 Table 2A and Table 3B
2 I50/81309/2015 Table 2b and Table 3A

TABLE 2A: STATION 63612 DATE 14-02-2016 TIME 09 GMT
LEVEL (mb) HEIGHT (m) SPEED (kts) DIR
(Surface) 955 515 3 18
925 635 6 12
850 1320 10 27
800 2050 12 42
750 2560 19 38
700 3201 23 32
650 3835 25 25
600 4468 15 23
550 5197 12 63
500 5926 18 136
450 6790 28 153
400 7654 22 192
350 8420 20 211
300 11023 17 198
250 12500 24 164
200 14311 26 93
170 14570 25 81
150 15199 21 39
120 16984 23 60
100 18443 25 20
90 19288 24 0
80 20232 23 350
70 21296 26 342
60 22526 23 330
50 23991 20 340
40 25774 21 320
30 28076 28 344
20 31317 26 325
10 36865 20 352

TABLE 2B: STATION 63820 DATE 22-01-2016 TIME 18 GMT
LEVEL (mb) HEIGHT (m) SPEED (kts) DIR
(Surface) 932 515 5 192
925 635 7 174
850 1320 7 156
800 2050 12 142
750 2560 16 146
700 3201 18 151
650 3835 21 187
600 4468 15 207
550 5197 11 241
500 5926 18 313
450 6790 22 330
400 7654 22 352
350 8420 20 338
300 11023 17 351
250 12500 26 344
200 14311 25 272
170 14570 27 263
150 15199 22 212
120 16984 24 241
100 18443 27 212
90 19288 27 180
80 20232 23 177
70 21296 25 144
60 22526 24 150
50 23991 20 146
40 25774 22 322
30 28076 22 301
20 31317 25 316
10 36865 20 298

TABLE 3A Sounding for station 67982 0n 24-04-2012 at 15hr local time and the station is located at 60OE . The radio sonde launched at 14hr 30min local time.
Pressure level(mb)
Geopotential Height (m)
Temperature
Co
Dew point
Temp Co
Wind speed
Kt
Direction
1012 45 23.2 18.6 4 108
1000 112 24.5 20.4 6 163
940 495 25.3 17.5 8 180
925 615 23.8 14.3 12 144
850 1520 22.6 12.4 34 122
800 2030 20.1 15.8 40 100
750 2640 16.0 11.9 60 84
700 3186 10.3 10.7 50 48
650 3819 6.3 5.6 76 53
600 4458 2.4 -2.2 84 70
500 5904 0.5 -8.2 90 95
400 7634 -3.2 -15.4 100 122
300 9743 -8.4 112 150
250 11002 -15.7 120 140
200 12480 -25.8 125 203
170 14290 -32.3 130 140
150 14550 -51.4 120 206
120 15600 -51.1 110 295
100 16680 -62.6 90 300
90 17280 -71.2 95 326
70 18703 -82.0 80 310
50 20722 -75.1 82 313
30 23400 -72.4 60 292
20 25800 -66.5 50 330
10 29710 -62.8 45 310

TABLE 3B Sounding for station 63980 0n 15-10-2015 at 14hr local time and the station is located at 75OE . The radio sonde launched at 14hr 15min local time.
Pressure level(mb)
Geopotential Height (m)
Temperature
Co
Dew point
Temp Co
Wind speed 1ms
Direction
1016 40 24.2 18.6 3 112
1000 112 25.5 19.4 5 160
940 495 24.3 17.5 8 180
925 615 23.8 14.3 12 144
850 1520 22.6 12.4 17 120
800 2030 18.1 15.8 20 103
750 2640 14.3 11.9 30 87
700 3186 10.3 10.7 25 51
650 3819 6.3 5.6 37 54
600 4458 2.4 -2.2 42 70
500 5904 0.5 -8.2 45 93
400 7634 -3.2 -15.4 50 120
300 9743 -8.4 -14.1 56 150
250 11002 -13.7 60 140
200 12480 -22.8 62 200
170 14290 -31.3 66 140
150 14550 -48.4 61 212
120 15600 -51.1 55 295
100 16680 -62.6 45 302
90 17280 -71.2 44 325
70 18703 -82.0 40 310
50 20722 -75.2 42 306
30 23400 -72.4 30 290
20 25800 -66.5 25 307
10 29710 -62.8 22 310
PRACTICAL NO. 4: PLOTTING THE SOUNDING ON A T
Objective:
The practical is aimed at enabling the student to plot the sounding on T
And compute the convective parameters.
Tools
a) Extract the TEMP data for the station and date allocated to you at 00 GMT.
For example to obtain data for 00GMT for 25th
Sep 2014 enter the information as shown.
COUNTRY OR TERRITORY (*) TYPE SORT ORDER NIL REPORTS FORMAT
Indonesia
ALL, (TEMP and PILOT)
Oldest the first
NIL reports included
TXT
TIME INTERVAL Year Month Day Hour
BEGIN: 2014
September
24
23
END: 2014
September
25
00

send
Clean
b) Using a T
(i) Plot the given temperature and dew point temperature a T gram and Indicate the layers
that experienced warming/ cooling and moistening / drying.
(ii) Determine the LCL, equivalent potential temperature, lifted Index, K-Index
(iii) Find the mixing ratio, specific humidity, ,relative humidity and vapour pressure at surface,
800mb, and 700mb
STUDENT
REG NO. Station and Date
I50/78854/2015 Darwin-Australia (21st and 22
nd Sep, 2015)
I50/81309/2015 Jarkata-Indonesia(1st and 2
nd Jan, 2016)
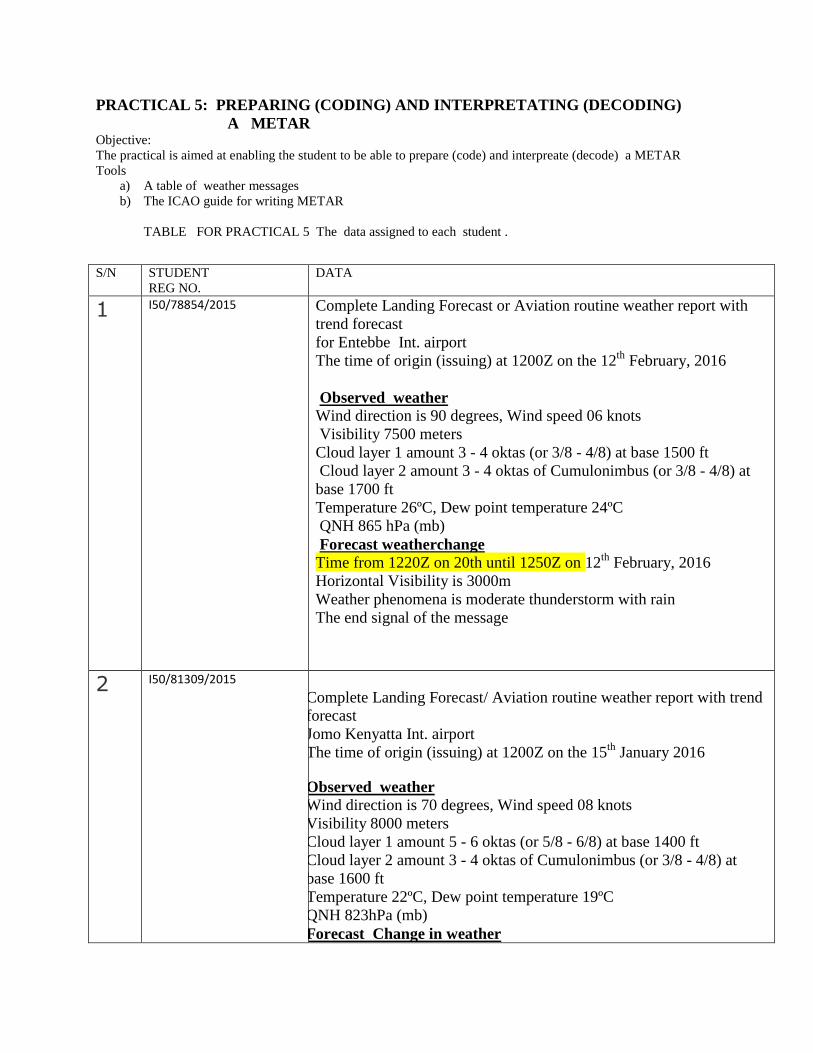
PRACTICAL 5: PREPARING (CODING) AND INTERPRETATING (DECODING)
A METAR Objective:
The practical is aimed at enabling the student to be able to prepare (code) and interpreate (decode) a METAR
Tools
a) A table of weather messages
b) The ICAO guide for writing METAR
TABLE FOR PRACTICAL 5 The data assigned to each student .
S/N STUDENT
REG NO.
DATA
1 I50/78854/2015 Complete Landing Forecast or Aviation routine weather report with
trend forecast
for Entebbe Int. airport
The time of origin (issuing) at 1200Z on the 12th
February, 2016
Observed weather
Wind direction is 90 degrees, Wind speed 06 knots
Visibility 7500 meters
Cloud layer 1 amount 3 - 4 oktas (or 3/8 - 4/8) at base 1500 ft
Cloud layer 2 amount 3 - 4 oktas of Cumulonimbus (or 3/8 - 4/8) at
base 1700 ft
Temperature 26ºC, Dew point temperature 24ºC
QNH 865 hPa (mb)
Forecast weatherchange Time from 1220Z on 20th until 1250Z on 12
th February, 2016
Horizontal Visibility is 3000m
Weather phenomena is moderate thunderstorm with rain
The end signal of the message
2 I50/81309/2015
Complete Landing Forecast/ Aviation routine weather report with trend
forecast
Jomo Kenyatta Int. airport
The time of origin (issuing) at 1200Z on the 15th
January 2016
Observed weather Wind direction is 70 degrees, Wind speed 08 knots
Visibility 8000 meters
Cloud layer 1 amount 5 - 6 oktas (or 5/8 - 6/8) at base 1400 ft
Cloud layer 2 amount 3 - 4 oktas of Cumulonimbus (or 3/8 - 4/8) at
base 1600 ft
Temperature 22ºC, Dew point temperature 19ºC
QNH 823hPa (mb)
Forecast Change in weather

Time from 1200Z on 20th until 1220Z on 20th
Horizontal Visibility is 4000m
Weather phenomena is moderate thunderstorm with rain
The end signal of the message
S/N STUDENT
REG NO.
DATA
1 I50/78854/2015 METAR HTMT 160400Z 27005KT 9999 FEW021 FEW022CB BKN080
26/25 Q1014=
METAR HTDA 160400Z 31004KT 9999 BKN020 26/24 Q1014
NOSIG=
METAR HKJK 160400Z 08005KT 050V110 9999 FEW018 15/12
Q1024=
METAR HKML 160400Z 00000KT 9999 FEW019 25/23 Q1014=
2 I50/81309/2015
METAR HKEL 160400Z 07003KT CAVOK 11/09 Q1026=
METAR HKKI 160400Z 07005KT CAVOK 17/13 Q1018=
METAR HTSO 160400Z 00000KT 9999 SCT018 FEW020CB BKN070
20/20 Q1019=
METAR HTTB 160400Z 00000KT 9999 FEW017 19/18 Q1020=
PRACTICAL 6: PREPARING A SIGMET Objective:
The practical is aimed at enabling the student to be able to write and interpreate a SIGMET
Tools
a) A table of weather messages
b) The ICAO guide for writing SIGMET
TABLE FOR PRACTICAL 6 The data assigned to each student .
S/N STUDENT
REG NO.
DATA
1 I50/78854/2015 WSSG31 GOOY 312005
GOOO SIGMET C4 VALID 312005/312400 GOOY-
GOOO DAKAR OCEANIC FIR/UIR ISOL EMBD TS OBS AT 1955Z
WI N0536 W02745 - N0707 W02448 - N0743 W02140 - N0502
W02045 - N0352 W02514 TOP FL450 MOV W 05KT NC=

WSMA31 FIMP 010830
FIMM SIGMET 03 VALID 010830/011230 FIMP-
FIMM MAURITIUS FIR EMBD TS OBS AT 0800Z WI S1000 E06000
- S1000 E06600 - S1300 E06700 - S1700 E05800 - S1300
E05500 - S1000 E06000 TOP ABV FL410 STNR NC=
2 I50/81309/2015 WSCG31 FCBB 011005
FCCC SIGMET A2 VALID 011005/011405 FCBB-
FCCC BRAZZAVILLE FIR/UIR EMBD TS OBS AT 0930Z
W OF LINE N0315 E00933 - S0149 E00919
S OF LINE S0325 E01006 - S0320 E00639
TOP FL430 MOV W 10KT NC=
WSZA31 FAOR 010600
FAOR SIGMET B01 VALID 010600/011000 FAOR-
FAJO JOHANNESBURG OCEANIC FIR EMBD TS FCST WI
S2730 E01424 - S2730 E01500 - S2854 E01500 TOP FL350=
TABLE 1 The data assigned to each student for preparing SIGMET
S/N STUDENT
REG NO.
DATA
1 I50/78854/2015 The SIGMET for forecasted embedded thunderstorm
extending above 3,5000ft was issued by Johannesburg on

1st of January 2016 at 06.55z which was expected to be
used between 6.00z to 11.00z. The thunder cell was
expected within the oceanic area.
),4214,0327( ES oo ),0015,0327( ES oo ),0015,4528( ES oo This
was the first SIGMET of the day.
2 I50/81309/2015
The SIGMET for observed embedded thunderstorm extending
above 4,5000ft was issued by Brazzaville in the Republic
of Congo on 1st of January 2016 at 05.30Z which was
expected to be used between 6.05z to 10.05z. The thunder
cell was observed west of the line from )149,022( EN oo
to )2111,504( EN oo The thunder cell was moving west
with a speed of 10knots and the intensity was not
changing. This was the first SEGMET of the day.


http://www.esrl.noaa.gov/psd/cgi-bin/data/timeseries/timeseries.pl

‘Synop’ of a landstation The basic form of the SYNOP bulletin for a landstation is:
AAXX YYGGiw IIiii
iRiXhVV Nddff 1snTTT 2snTdTdTd 4PPPP 5appp
6RRRtR 7wwW1W2 8NhCLCMCH
The rain group (6RRRtR) is not plotted. All other groups will be plotted using the plot model in