FFuunnccttiioonnaall LLiimmiittaattiioonnss ooff ... · FFuunnccttiioonnaall LLiimmiittaattiioonnss...
60
U U U . . . S S S . . . D D D E E E P P P A A A R R R T T T M M M E E E N N N T T T O O O F F F E E E D D D U U U C C C A A A T T T I I I O O O N N N F F F u u u n n n c c c t t t i i i o o o n n n a a a l l l L L L i i i m m m i i i t t t a a a t t t i i i o o o n n n s s s o o o f f f V V V o o c c c a a a t t t i i i o o o n n n a a a l l l R R R e e e h h h a a a b b b i i i l l l i i i t t t a a a t t t i i i o o o n n n ( ( ( V V V R R R ) ) ) C C C o o o n n n s s s u u u m m m e e e r r r s s s o F F F i i i n n n a a a l l l R R R e e e p p p o o o r r r t t t
Transcript of FFuunnccttiioonnaall LLiimmiittaattiioonnss ooff ... · FFuunnccttiioonnaall LLiimmiittaattiioonnss...

UUU...SSS... DDDEEEPPPAAARRRTTTMMMEEENNNTTT OOOFFF EEEDDDUUUCCCAAATTTIIIOOONNN
FFFuuunnnccctttiiiooonnnaaalll LLLiiimmmiiitttaaatttiiiooonnnsss ooofff VVVoocccaaatttiiiooonnnaaalll RRReeehhhaaabbbiiillliiitttaaatttiiiooonnn (((VVVRRR))) CCCooonnnsssuuummmeeerrrsss o
FFFiiinnnaaalll RRReeepppooorrrttt

Functional Limitations of Vocational Rehabilitation (VR) Consumers
Final Report
Submitted to:
U.S. Department of Education Office of Special Education and Rehabilitative Services
Rehabilitation Services Administration
Prepared by:
Beth Overman Holly Schmidt-Davis
Research Triangle Institute
Research Triangle Park, N.C.
2006

This report was produced under U.S. Department of Education Contract No. HR 92022001 with the Research Triangle Institute. Harold Kay served as the contracting officer’s representative. The views expressed herein do not necessarily represent the positions or policies of the Department of Education. No official endorsement by the U.S. Department of Education of any product, commodity, service or enterprise mentioned in this publication is intended or should be inferred. U.S. Department of Education Margaret Spellings Secretary Office of Special Education and Rehabilitative Services John H. Hager Assistant Secretary Rehabilitation Services Administration Edward Anthony Acting Commissioner January 2006 This report is in the public domain. Authorization to reproduce it in whole or in part is granted. While permission to reprint this publication is not necessary, the citation should be: U.S. Department of Education, Office of Special Education and Rehabilitative Services, Rehabilitation Services Administration. Functional Limitations of Vocational Rehabilitation (VR) Consumers Final Report. Washington, D.C., 2006. To order copies of this report: write to: ED Pubs, Education Publications Center, U.S. Department of Education, P.O. Box 1398, Jessup, MD 20794-1398; or fax your request to: 301-470-1244; or e-mail your request to: [email protected]; or call in your request toll-free: (877)-433-7827 (1-877-4-ED-PUBS). If 877 service is not yet available in your area, call (800)-872-5327 (1-800-USA-LEARN). Those who use a telecommunications device for the deaf (TDD) or a teletypewriter (TTY), should call (877)-576-7734; or order online at: www.edpubs.org. On request, this document is available in accessible formats, such as Braille, large print, and computer diskette. For more information, please contact the U.S. Department of Education’s Alternative Format Center at (202) 260-0852 or (202) 260-0818.

Contents
Figures............................................................................................................................................ iv
Tables...............................................................................................................................................v
Summary of Findings.................................................................................................................... vii
Introduction......................................................................................................................................1
Study Methods .................................................................................................................................5
Study Findings .................................................................................................................................9
Conclusion .....................................................................................................................................27
References......................................................................................................................................29
Appendix A: Theoretical Background and Scale Development ....................................................31
iii
Figures
1. Employment outcome ...........................................................................................................23
2. Competitive employment outcome.......................................................................................24
iv

Tables
1. Functional status by service group.......................................................................................9 2. Functional status by disability type (NHIS-D) ..................................................................10 3. Functional status by disability type (Longitudinal Study).................................................11 4. Functional status by demographic characteristics..............................................................12 5. Functional status by education attainment.........................................................................13 6. Functional status of transitional youths (youths with disabilities between
the ages of 18 and 25) by receipt of special education services ........................................13 7. Functional status by work status at application to VR.......................................................14 8. Functional status by receipt of SSI/SSDI...........................................................................14 9. Functional status by significance of disability...................................................................15 10. Functional status by automatic significance designation...................................................15 11. Functional status by vocational goal..................................................................................16 12. Gross motor function by receipt of selected services (individuals with
orthopedic disabilities).......................................................................................................18 13. Cognitive function by receipt of selected services (individuals with
orthopedic disabilities).......................................................................................................18 14. Personal care function by receipt of selected services (individuals with
orthopedic disabilities).......................................................................................................19 15. Gross motor function by receipt of selected services (individuals with
mental retardation) .............................................................................................................19 16. Cognitive function by receipt of selected services (individuals with
mental retardation) .............................................................................................................20 17. Personal care function by receipt of selected services (individuals with
mental retardation) .............................................................................................................20 18. Overall functional status by average cost of services ........................................................20 19. Functional status by closure status.....................................................................................21 20. Regression models of consumer outcomes ........................................................................22 21. Functional status by earnings levels ..................................................................................25 22. Functional status by supported employment and disability type .......................................25 23. Functional status by sheltered workshop versus competitive employment .......................26 24. Functional status by retention of employment over time (competitively
employed only) ..................................................................................................................26 A-1. Review of functional status literature ................................................................................35 A-2. Exploratory factor analysis of selected ADL and IADL questions
from NHIS-D* ...................................................................................................................40 A-3. Interfactor correlations among NHIS-D functional status scales ......................................41 A-4. Reliability coefficients for NHIS-D functional status scales.............................................41 A-5. Factor analysis of Longitudinal Study ADL and IADL items...........................................43 A-6. Interfactor correlations among Longitudinal Study functional status scales .....................43 A-7. Reliability coefficients for Longitudinal Study functional status scales ...........................44
v

vi

Summary of Findings In response to a request from the Rehabilitation Services Administration (RSA), the
Research Triangle Institute (RTI) conducted a study to examine the feasibility of developing
functional status measures for planning and implementing services to consumers in the State-
Federal Vocational Rehabilitation (VR) Services Program.
To investigate this issue, RTI used the 1994–95 National Health Interview Survey-
Disability Followback (NHIS-D) and data available from the ongoing Longitudinal Study of the
VR Services Program to develop composite measures of functional status in three areas: 1) gross
motor function; 2) personal care function; and 3) cognitive function. We then conducted
analyses to address the study’s questions regarding the robustness of these measures in
comparison with traditional definitions of “significance of disability” for describing VR
consumers’ status and predicting outcomes of VR services.
In this summary, we have organized our findings by the eight questions that RSA
developed for the study.
1. What functional limitations do VR consumers have?
• VR consumers had more functional limitations in all three areas—gross motor, cognitive and personal care functioning—than did persons with disabilities who did not receive any VR services (NHIS-D).
2. What is the relationship between functional limitations and selected consumer characteristics?
Type of disability:
Gross motor function
• Individuals with hearing impairment, learning disabilities or disabilities associated with substance abuse had particularly high gross motor functioning.
Cognitive function
• Individuals with disabilities associated with substance abuse had the highest cognitive functioning.
• Individuals with mental retardation had the lowest cognitive function.
vii

Functional Limitations of Vocational Rehabilitation (VR) Consumers
Personal care function
• Individuals with learning disabilities, hearing impairment or disabilities associated with substance abuse had particularly high personal care functioning.
Age:
• Individuals under 26 had significantly fewer gross motor limitations than those who were over 55.
• Individuals over 55 had significantly fewer personal care limitations than those who were under 26.
Sex:
• Males had fewer limitations than females in gross motor functioning.
Education:
• Consumers with less than a high school diploma ranked significantly higher than other consumers on gross motor function and significantly lower than other consumers on cognitive function.
• Consumers with at least a high school diploma had higher cognitive function than other consumers.
• Consumers with more than a high school education ranked lower on gross motor function than other consumers.
• Consumers who did not receive special education services in high school had fewer cognitive limitations than those who did receive such services.
Employment experience:
• Individuals who were working at application to VR had fewer limitations in gross motor and personal care functioning than did applicants who were not employed.
Receipt of public assistance, including SSI/SSDI:
• Consumers who received financial assistance at application to VR had more functional limitations on all three dimensions than other consumers with significant or most significant disabilities.
viii

Functional Limitations of Vocational Rehabilitation (VR) Consumers
Race and ethnicity:
• White consumers had significantly fewer limitations in cognitive and personal care functioning than consumers of other races.
3. What are the interrelationships between functional limitations and the designation of individuals as: a) most significantly disabled; b) significantly disabled; c) nonsignificantly disabled; and d) Social Security recipients who “automatically” meet the first of the three criteria in the definition of “significant disability”? Are persons with these different designations of disability significance different from each other in terms of their functional limitations?
• On all three dimensions (gross motor, cognitive and personal care functioning), persons classified as having nonsignificant disabilities were significantly higher functioning than those with either significant or most significant disabilities.
• Consumers with significant disabilities averaged higher in cognitive functioning than persons with most significant disabilities, but these two groups did not differ significantly on the other two dimensions of function.
• Consumers who received financial assistance (e.g., SSI/SSDI, public assistance) at application to VR were more limited on all three dimensions of function than other consumers with significant or most significant disabilities.
4. What are the relationships between consumers’ functional limitations and each of the following areas?
Vocational goals:
• Consumers whose vocational goal was structural work had the fewest gross motor limitations. Those with vocational goals in the service industry also had fewer gross motor limitations than average.
• Consumers with homemaker as their vocational goal had many more gross motor limitations than other consumers.
• The highest level of cognitive function occurred among consumers with professional, managerial or technical vocational goals. Individuals with clerical or sales goals; agricultural, fishing or forestry goals; structural work goals; or miscellaneous goals also had higher than average cognitive function.
• The lowest level of cognitive function occurred among consumers with homemaker goals. Those with machine trades, benchwork or other goals also had lower than average cognitive function.
ix

Functional Limitations of Vocational Rehabilitation (VR) Consumers
• Consumers with structural work as their vocational goal had the highest personal care function. Those with service as their vocational goal also had higher than average personal care function.
• The lowest levels of functioning occurred among individuals with homemaker as their vocational goal.
Services received (e.g., type, duration and cost):
• Among individuals with orthopedic disabilities, those who received assistive technology assessments, devices or services ranked lower on all three functional status scales than other individuals. Those who received medical services or occupational therapy ranked lower on gross motor function.
• Among individuals with mental retardation, VR consumers who received supported employment services had higher levels of gross motor function but lower levels of cognitive function. Those who received maintenance services had higher levels of personal care function than did consumers who did not receive this service.
• Individuals with low levels of functioning in all three areas were likely to have higher average costs of purchased services and to have spent more time in VR.
• The average cost of services for individuals with low functional status in all three areas was over twice that of individuals with high functional status.
• The average number of services that individuals with low functional status in all three areas received was also significantly higher than that of individuals with high functional status.
5. Are there differences in functional limitations for consumers whose cases were closed: a) without receiving services; b) despite the fact that they were nonrehabilitated after receiving services; c) when they were rehabilitated into noncompetitive employment; or d) when they were rehabilitated into competitive employment?
• VR consumers who achieved competitive employment outcomes were the highest functioning of all consumers on all three functional status scales.
• Consumers who achieved a noncompetitive employment outcome, those who were eligible but did not receive services, and those who achieved noncompetitive employment outcomes having particularly low cognitive function were ranked lowest in terms of functional status.
x

Functional Limitations of Vocational Rehabilitation (VR) Consumers
6. Are functional limitations a more consistent predictor of vocational outcome than: a) severity of disability designation; or b) other consumer characteristics, including type of disability, age, sex, education, employment experience, receipt of public assistance, and race and ethnic group?
• When we included functional status scales in models of employment outcomes, disability significance was not a statistically important predictor of either employment outcome or competitive employment outcome. Functional status was a significant predictor of both outcomes, even after the model accounted for important consumer characteristics.
7. What is the relationship between functional limitations and: a) the earnings levels of persons closed into competitive employment; b) other rehabilitants by category (e.g., homemaker, unpaid family worker); and c) stability of employment over time?
• Among individuals who achieved competitive employment outcomes, those who earned more than $9.00 per hour had a significantly higher cognitive function than those who earned $5.00 or less per hour.
• Consumers who exited into extended employment did not differ significantly from those who exited into competitive employment on gross motor and personal care function, but they ranked significantly lower on cognitive function.
8. Do functional limitations change over time, especially with receipt of VR services?
• To examine changes over time, we compared consumers’ functional status at entry to VR and at exit from VR. We found no significant differences, even among consumers who exited more than three years after they entered VR.
In conclusion, because the functional status scales are based on Activities of Daily Living (ADL) and Instrumental Activities of Daily Living (IADL) items, their utility for certain disabilities may be limited. For example, these items, while in widespread use on national surveys of individuals with disabilities, are not sensitive indicators of functional status among persons with mental illnesses or visual impairments. Therefore, as this report shows, this approach to measurement of functional status more accurately predicts outcomes; it may be appropriate to conduct further research designed to improve the utility of these measures of functional limitations for specific types of disabilities (e.g., vision impairments and mental illnesses).
xi

xii

Introduction In the more than 30 years since the enactment of the Rehabilitation Act of 1973, Congress
has consistently emphasized targeting VR services to persons whose disabilities are significant1.
This pattern culminated in the requirement of the Rehabilitation Amendments of 1992, which
mandated that Designated State Units (DSUs) target services to the individuals whose disabilities
are “most significant,” and charged each of the 83 DSUs responsible for implementing the VR
service program with defining “most significant” within its jurisdiction. Three years after this
statutory change, the distribution of VR consumers in terms of severity of disability reflected the
new requirement, with over one-quarter of consumers classified as having a “most significant
disability,” about half classified as “significantly disabled” and less than 20 percent determined
to be “nonsignificantly disabled” (Hayward and Tashjian, 1996).
The fact that Congress assigned DSUs the responsibility to establish the criteria for
determining a disability as “most significant” has implications for how they address one of the
critical challenges in the VR system—the difficulty in assessing precisely what aspects of a
sensory, physical or cognitive impairment result in specific functional limitations and how those
limitations constrain an individual’s ability to obtain and retain employment.
At present, the Rehabilitation Services Administration’s (RSA) reporting system contains
approximately 212 disability codes, along with specialized provisions for many of these codes
(e.g., codes covering mental illness). Based on the medical model of disability, these codes
require rehabilitation counselors to classify the disability according to the single code that best
fits the individual’s condition. Once the counselor determines the type of disability based on
medical records or assessments, he or she must then establish whether the individual has a
significant disability. According to Section 7(21) of the Rehabilitation Act of 1973, as amended,
an “individual with a significant disability” is someone:
• Who has a severe physical or mental impairment which seriously limits one or more functional capacities (such as mobility, communication, self-care, self-direction,
1With the 1998 Amendments to the Rehabilitation Act, the statutory language changed from “severity” to “significance” of
disability. We use the current term in this report.
1

Functional Limitations of Vocational Rehabilitation (VR) Consumers
interpersonal skills, work tolerance, or work skills) in terms of an employment outcome;
• Whose vocational rehabilitation can be expected to require multiple VR services over an extended period of time; and
• Who has one or more physical or mental disabilities … or combination of disabilities determined … to cause comparable substantial limitation.
Most states, in defining most significant disability, have simply increased the number of
functional limitations a person must have to be considered most significantly disabled. Without
accurate information on the relationships between functional measures and vocational outcomes,
DSUs have had little basis on which to develop more appropriate criteria for targeting services.
While the state of the art in assessment in functional status (as it relates to vocational
rehabilitation) has matured in the past 10 to 15 years, the perception persists that the VR system
may not be fully accessible to persons most in need of services. Although persons with
significant or most significant disabilities do gain access to the VR system, constituents,
advocates and Congress raise the concern that counselors may not be very effective in matching
persons’ functional abilities and limitations to the appropriate vocational goals, services and jobs,
hence reducing the potential effectiveness of services in terms of employment and earnings
outcomes.
Information available from the Longitudinal Study of the Vocational Rehabilitation
Services Program permits us to examine these issues and to contribute to a better understanding
of the relationships among disability classification, functional status and other factors that can be
expected to affect an individual’s likelihood both to seek, and to benefit from, VR services.
These findings will, in turn, be helpful to RSA and Congress in deliberations regarding the
reauthorization of the program, and to DSUs in their ongoing efforts to provide high-quality
services leading to positive employment outcomes for persons with significant or most
significant disabilities. Among the issues addressed in this report are:
• What functional limitations do VR consumers share?
• What is the relationship between functional limitations and selected consumer characteristics?
2

Functional Limitations of Vocational Rehabilitation (VR) Consumers
• What are the interrelationships between functional limitations and the designation of individuals as: a) most significantly disabled; b) significantly disabled; c) nonsignificantly disabled; and d) Social Security recipients who “automatically” meet the first of the three criteria in the definition of significant disability? Are persons with these different designations of disability significance different from each other in terms of their functional limitations?
• What are the relationships between consumers’ functional limitations and vocational goals and services received (including type, duration and cost of services)?
• Are there differences in functional limitations for consumers whose cases were closed: a) without receiving services; b) nonrehabilitated after receiving services; c) rehabilitated into noncompetitive employment; or d) rehabilitated into competitive employment?
• Are functional limitations a more consistent predictor of vocational outcome than: a) severity of disability designation; or b) other consumer characteristics, including type of disability, age, sex, education, employment experience, receipt of public assistance and race and ethnic group?
• What is the relationship between functional limitations and: a) the earnings levels of persons closed into competitive employment; b) other rehabilitants by category (e.g., homemaker, unpaid family worker); and c) stability of employment over time?
• Do functional limitations change over time, especially with receipt of VR services?
3

4

Study Methods New paradigms of disability are typically distinguished among impairments, functional
limitations and disabilities. Impairments refer to “anatomical, physical, or mental abnormalities
or losses in one physical system” (Spector and Fleishman, 1998), while functional limitations,
such as difficulty reaching, affect the performance of the whole person. Disabilities, on the other
hand, are limitations in the performance of roles or tasks in the context of the social, cultural and
physical environments, such as difficulty bathing. Therefore, the concept of functional disability
refers to limitations in basic activities that are necessary to function in the community. These are
often divided into Activities of Daily Living (ADLs), which include basic activities such as
hygiene and personal care, and Instrumental Activities of Daily Living (IADLs), which include
activities necessary to live in the community, such as shopping and managing money (Spector
and Fleishman, 1998).
Surveys of elderly persons and of individuals with disabilities frequently include ADL
and IADL items. The Survey of Income and Program Participation (SIPP), the National Health
Interview Survey (NHIS) and the National Long-Term Care Survey (NLTCS) regularly collect
responses to these items and provide valuable information to program planners, researchers and
practitioners about individuals’ functional status. While the survey items individually are useful
for estimates of overall levels of functioning on specific activities, composite measures of
functional status incorporating these items both facilitate comparisons among groups and reduce
the number of variables needed for statistical modeling. Furthermore, practitioners who work
with individuals with disabilities may find such measures useful for decisions about how best to
inform consumers of their services and to assist them in minimizing the effects of functional
limitations through assistive technology or other types of accommodations. In particular, such
measures would be highly relevant to programs that serve individuals with disabilities, especially
those that must identify the nature and significance of individuals’ disabilities to make eligibility
decisions, to develop feasible employment goals, and to plan appropriate services. The VR
Services Program, whose goal is to help individuals with disabilities achieve appropriate
employment outcomes, is one such program.
Section 7(20) of the Rehabilitation Act defines an individual with a disability as “any
individual who has a physical or mental impairment which for such individual constitutes or
5

Functional Limitations of Vocational Rehabilitation (VR) Consumers
results in a substantial impediment to employment; and can benefit in terms of an employment
outcome from vocational rehabilitation services.” As stated earlier, an individual with a
significant disability is defined by Section 7(21) of the Rehabilitation Act as an individual with a
disability who, among other things, has a severe physical or mental impairment that seriously
limits one or more functional capacities in terms of an employment outcome and whose
vocational rehabilitation can be expected to require multiple services over an extended period of
time. Finally, an individual with a most significant disability is defined as “an individual with a
significant disability who meets criteria established by the State” (Section 7(21) of the
Rehabilitation Act Amendments).
Traditionally, the VR system has relied on medical documentation and counselors’
assessments of the significance or severity of individuals’ disabilities to determine their
eligibility for VR services. Although counselors use the federally mandated definition to
determine if a disability is significant, each state determines its own criteria for deciding if a
disability is most significant. In determining whether a disability is most significant, most DSUs
have expanded the federal definition of significant by increasing the number of limitations from
“one or more” to “three or more.” These determinations lack the precision and sensitivity that
the system needs to serve consumers as effectively as possible.
We used two data sources for the analyses in this report: the 1994–95 National Health
Interview Survey-Disability Supplement (NHIS-D), and the Longitudinal Study of the
Vocational Rehabilitation Services Program. Both surveys contain ADL and IADL items.
NHIS-D contains two parts, one of which was administered along with the core survey to a
sample designed to represent the civilian noninstitutionalized population of the United States.
The second part, the Disability Followback Survey, was administered later only to those
individuals whose responses indicated that they met the NHIS definition of “disability.” The
Longitudinal Study of the VR Services Program is a national impact evaluation that investigates
the effects of VR services on economic and other outcomes for individuals with disabilities who
receive such services. The Longitudinal Study drew a nationally representative sample of more
than 8,000 respondents, including applicants for VR services (some of whom were not accepted
for services), VR consumers, and former VR consumers.
6

Functional Limitations of Vocational Rehabilitation (VR) Consumers
Based on statistical techniques and a review of the functional status literature, we
developed three functional status scales using ADL and IADL items from these surveys. The
first scale, gross motor function, includes items such as “walking for a quarter of a mile” and
“walking up a flight of stairs.” The cognitive function scale includes “managing your money”
and “shopping for personal items,” and the personal care scale includes “bathing or showering”
and “dressing.” Values on each scale range from one to two, with a high score indicating a
higher level of functioning.
7

8
Study Findings In this section we organize study findings around the questions that formed the basis for
the study.
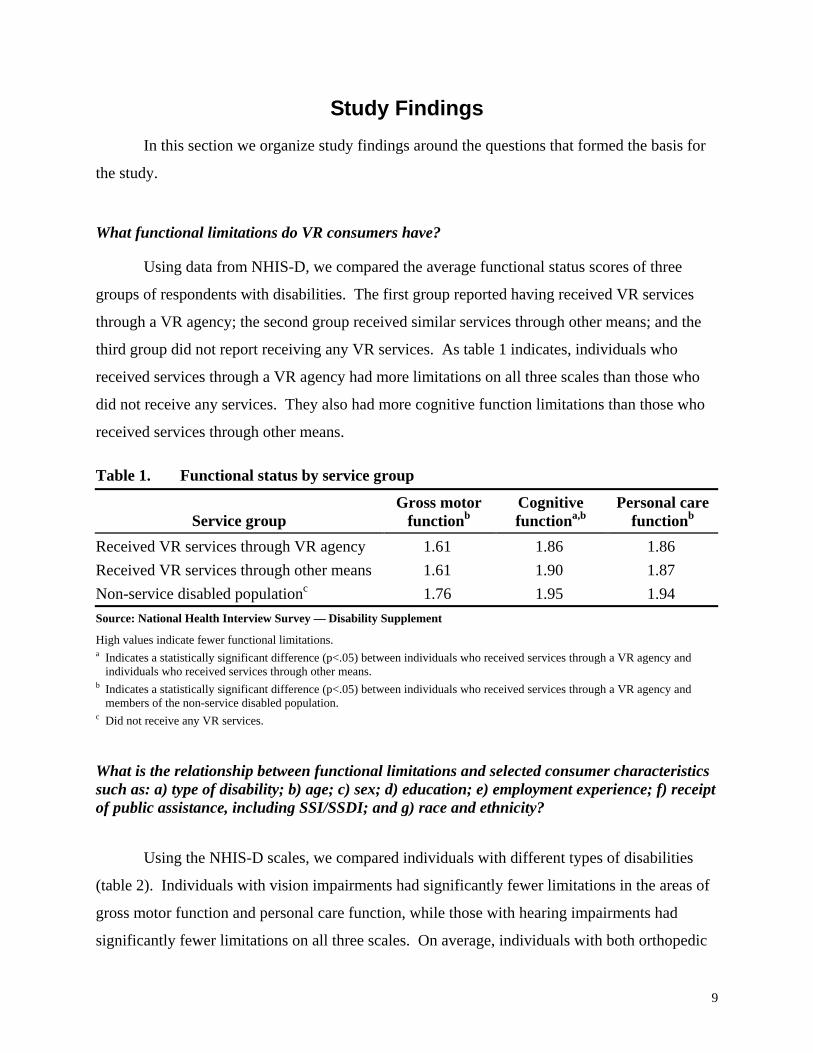
What functional limitations do VR consumers have?
Using data from NHIS-D, we compared the average functional status scores of three
groups of respondents with disabilities. The first group reported having received VR services
through a VR agency; the second group received similar services through other means; and the
third group did not report receiving any VR services. As table 1 indicates, individuals who
received services through a VR agency had more limitations on all three scales than those who
did not receive any services. They also had more cognitive function limitations than those who
received services through other means.
Table 1. Functional status by service group
Service group Gross motor
functionbCognitive functiona,b
Personal carefunctionb
Received VR services through VR agency 1.61 1.86 1.86 Received VR services through other means 1.61 1.90 1.87 Non-service disabled populationc 1.76 1.95 1.94 Source: National Health Interview Survey — Disability Supplement
High values indicate fewer functional limitations. a Indicates a statistically significant difference (p<.05) between individuals who received services through a VR agency and
individuals who received services through other means. b Indicates a statistically significant difference (p<.05) between individuals who received services through a VR agency and
members of the non-service disabled population. c Did not receive any VR services.
What is the relationship between functional limitations and selected consumer characteristics such as: a) type of disability; b) age; c) sex; d) education; e) employment experience; f) receipt of public assistance, including SSI/SSDI; and g) race and ethnicity?
Using the NHIS-D scales, we compared individuals with different types of disabilities
(table 2). Individuals with vision impairments had significantly fewer limitations in the areas of
gross motor function and personal care function, while those with hearing impairments had
significantly fewer limitations on all three scales. On average, individuals with both orthopedic
9

Functional Limitations of Vocational Rehabilitation (VR) Consumers
and nonorthopedic physical disabilities had significantly more limitations on gross motor
function and personal care function. Those with orthopedic disabilities had fewer cognitive
limitations. The number of limitations for individuals with mental illnesses, learning disabilities
or disabilities associated with substance abuse was lower than average on all three scales.
Individuals with mental retardation had more than the average number of limitations in cognitive
function, and fewer than average gross motor limitations.
Table 2. Functional status by disability type (NHIS-D)
Disability type Gross motor
function Cognitive function
Personal carefunction
Vision impairment 1.80b * 1.96b
Hearing impairment 1.91b 1.97b 1.99b
Orthopedic, including amputation 1.53a 1.90b 1.85a
Nonorthopedic physical 1.55a 1.88 1.88a
Mental illness 1.80b 1.92b 1.96b
Mental retardation 1.82b 1.58a 1.91 Substance abuse 1.92b 1.98b 1.98b
Learning disability 1.93b 1.92b 2.00b
All disabled persons 1.62 1.89 1.89 Source: National Health Interview Survey — Disability Supplement
High values indicate fewer functional limitations.a Individuals with this type of disability function significantly (p<.05) lower on this dimension than individuals with all other disabilities. b Individuals with this type of disability function significantly (p<.05) higher on this dimension than individuals with all other disabilities. * As noted in Appendix A, individuals with vision impairments are excluded from the cognitive function scale.
Similarly, table 3 presents a comparison of functional status across disability type for
participants in the Longitudinal Study. Consumers with hearing impairments ranked significantly
higher than others on all three dimensions. Individuals with orthopedic and nonorthopedic physical
disabilities ranked higher than other consumers on cognitive function; however, while those with
orthopedic disabilities ranked lower than other consumers on gross motor function, there was no
significant difference between consumers with nonorthopedic physical disabilities and other
consumers on this dimension. Furthermore, while consumers with orthopedic disabilities ranked
lower than average on personal care functioning, those with nonorthopedic disabilities ranked higher
than average. Individuals with mental illnesses and disabilities associated with substance abuse
ranked higher on all three functional status measures than those with other disabilities. Individuals
10

Functional Limitations of Vocational Rehabilitation (VR) Consumers
with mental retardation ranked higher than average on gross motor function and lower than average
on cognitive function. Consumers with learning disabilities ranked significantly higher than other
consumers on both gross motor function and personal care function.
Table 3. Functional status by disability type (Longitudinal Study)
Disability type Gross motor
function Cognitive function
Personal carefunction
Vision impairment 1.74 N/A* 1.96
Hearing impairment 1.93b 1.92b 1.99b Orthopedic, including amputation 1.64a 1.89b 1.93a Nonorthopedic physical 1.80 1.92b 1.99b Mental illness 1.91b 1.90b 1.99b Mental retardation 1.92b 1.56a 1.98 Substance abuse 1.93b 1.94b 2.00b Learning disability 1.96b 1.85 2.00b Traumatic brain injury 1.84 1.81 1.94 All other conditions 1.92b 1.82 1.98 All consumers 1.82 1.85 1.97 Source: VR Longitudinal Study
High values indicate fewer functional limitations. a Individuals with this type of disability function significantly (p<.05) lower on this dimension than individuals with all other disabilities. b Individuals with this type of disability function significantly (p<.05) higher on this dimension than individuals with all other disabilities. * As noted in Appendix A, individuals with vision impairments are excluded from the cognitive function scale.
These two sets of analyses reveal common trends in levels of functioning across disability
type. Individuals with hearing impairments, learning disabilities and disabilities associated with
substance abuse had particularly high gross motor function in both data sets, while individuals with
orthopedic disabilities had very low gross motor function in both data sets. However, while
individuals with nonorthopedic disabilities in the Longitudinal Study were closer in rank to the
overall average on gross motor function, individuals with this same type of disability in NHIS-D
ranked much lower on this dimension. In both data sets, individuals with disabilities associated
with substance abuse had the highest cognitive function, while individuals with mental retardation
had the lowest. Individuals in both data sets with learning disabilities, hearing impairments and
disabilities associated with substance abuse had particularly high personal care function, while
those with orthopedic disabilities had particularly low personal care function. Individuals with
11
Functional Limitations of Vocational Rehabilitation (VR) Consumers
nonorthopedic disabilities in the Longitudinal Study had lower than average personal care function,
while those in NHIS-D had higher than average personal care function. These differences may be
due to differences in the questions that make up the scales or to differences in the populations
studied in the two data sets. (For more information, see Overman and Schmidt-Davis, 2000.)
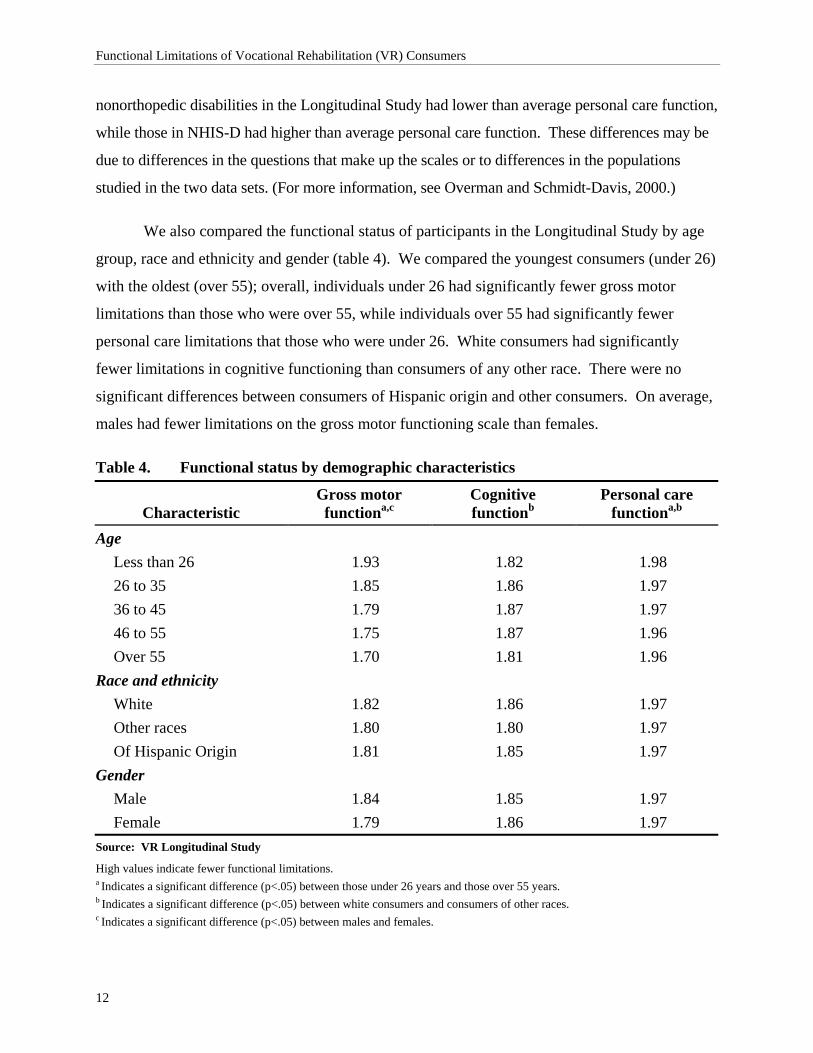
We also compared the functional status of participants in the Longitudinal Study by age
group, race and ethnicity and gender (table 4). We compared the youngest consumers (under 26)
with the oldest (over 55); overall, individuals under 26 had significantly fewer gross motor
limitations than those who were over 55, while individuals over 55 had significantly fewer
personal care limitations that those who were under 26. White consumers had significantly
fewer limitations in cognitive functioning than consumers of any other race. There were no
significant differences between consumers of Hispanic origin and other consumers. On average,
males had fewer limitations on the gross motor functioning scale than females.
Table 4. Functional status by demographic characteristics
Characteristic Gross motor
functiona,c Cognitive functionb
Personal care functiona,b
Age Less than 26 1.93 1.82 1.98 26 to 35 1.85 1.86 1.97 36 to 45 1.79 1.87 1.97 46 to 55 1.75 1.87 1.96 Over 55 1.70 1.81 1.96
Race and ethnicity White 1.82 1.86 1.97 Other races 1.80 1.80 1.97 Of Hispanic Origin 1.81 1.85 1.97
Gender Male 1.84 1.85 1.97 Female 1.79 1.86 1.97
Source: VR Longitudinal Study
High values indicate fewer functional limitations. a Indicates a significant difference (p<.05) between those under 26 years and those over 55 years. b Indicates a significant difference (p<.05) between white consumers and consumers of other races. c Indicates a significant difference (p<.05) between males and females.
12

Functional Limitations of Vocational Rehabilitation (VR) Consumers
Table 5 compares functional status across educational level. Consumers without a high
school diploma were significantly higher than other consumers on gross motor function and
significantly lower than other consumers on cognitive function. Those with high school
diplomas or higher levels of education had higher cognitive function than other consumers.
Individuals with more than a high school education ranked lower on gross motor function than
other consumers.
Table 5. Functional status by education attainment
Education level Gross motor
function Cognitive function
Personal care function
Less than high school 1.84a 1.81a 1.98 High school diploma/GED 1.82 1.89a 1.97 More than high school 1.80a 1.89a 1.97 All consumers 1.82 1.87 1.97 Source: VR Longitudinal Study High values indicate fewer functional limitations. a Indicates a significant difference (p<.05) between those at this educational level and other consumers.
In a separate report (Hayward and Schmidt-Davis, 1999), we analyzed the functional
status of VR consumers between the ages of 18 and 25 by receipt of special education services.
As table 6 shows, while they did not differ significantly in terms of gross motor and personal
care function, individuals who did not receive special education services in high school had
fewer cognitive limitations.
Table 6. Functional status of transitional youths (youths with disabilities between the ages of 18 and 25) by receipt of special education services
Received special education services in high school Functional limitation Yes No Total
Gross motor function 1.94 1.93 1.93 Cognitive functiona 1.73 1.94 1.82 Personal care function 1.98 1.99 1.98 Source: VR Longitudinal Study High values indicate fewer functional limitations. a Indicates a significant difference (p<.05) between those who received special education services in high school and those who
did not.
13

Functional Limitations of Vocational Rehabilitation (VR) Consumers
As table 7 shows, individuals who were working at application to VR had fewer
limitations on the gross motor scale and on the personal care scale.
Table 7. Functional status by work status at application to VR
Work status at application to VR
Gross motor functiona
Cognitive function
Personal care functiona
Working 1.88 1.89 1.98 Not working 1.81 1.89 1.97 Source: VR Longitudinal Study High values indicate fewer functional limitations. a Indicates a significant difference (p<.05) between those working at application to VR and those not working at application to VR.
As table 8 indicates, individuals who received SSI or SSDI at entry to VR ranked much
lower on all three functional status scales.
Table 8. Functional status by receipt of SSI/SSDI
Received SSI/SSDI
Gross motor functiona
Cognitive functiona
Personal care functiona
Yes 1.79 1.78 1.96 No 1.84 1.90 1.98
Source: VR Longitudinal Study
High values indicate fewer functional limitations. a Indicates a significant difference (p<.05) between those who received SSI/SSDI and those who did not.
What are the interrelationships between functional limitations and the designation of individuals as: a) most significantly disabled; b) significantly disabled; c) nonsignificantly disabled; and d) Social Security recipients who are presumed to be individuals with a significant disability? Are persons with these different designations of disability significance different from each other in terms of their functional limitations?
As table 9 indicates, all three functional status scales differentiate between: 1) consumers
with significant disabilities and those with nonsignificant disabilities; and 2) between consumers
with most significant disabilities and those with nonsignificant disabilities. Only the cognitive
functioning scale distinguishes between those with significant disabilities and those with most
significant disabilities. On all three dimensions, those with nonsignificant disabilities ranked
significantly higher than those with significant disabilities and those with most significant
disabilities. Consumers with significant disabilities ranked higher on the cognitive functioning
14

Functional Limitations of Vocational Rehabilitation (VR) Consumers
scale than those with most significant disabilities, but these two groups did not differ
significantly on the other two scales.
Table 9. Functional status by significance of disability
Significance of disability
Gross motor functionab
Cognitive functionabc
Personal care functionab
Not significant 1.86 1.92 1.99 Significant 1.81 1.86 1.97 Most significant 1.81 1.80 1.96 Source: VR Longitudinal Study
High values indicate fewer functional limitations. a Indicates a significant difference (p<.05) between those with nonsignificant disabilities and those with most significant disabilities. b Indicates a significant difference (p<.05) between those with nonsignificant disabilities and those with significant disabilities. c Indicates a significant difference (p<.05) between those with most significant disabilities and those with significant disabilities.
Table 10 presents a comparison between the functional status of individuals who received
SSI or SSDI at entry to VR and of other individuals with significant or most significant
disabilities. Overall, consumers who received financial assistance had more functional
limitations on all three dimensions.
Table 10. Functional status by automatic significance designation
Recipient Gross motor
functiona Cognitive functiona
Personal care functiona
SSI/SSDI recipient 1.79 1.78 1.96 Other significantly or most
significantly disabled 1.83 1.89 1.97 Source: VR Longitudinal Study High values indicate fewer functional limitations. a Indicates a significant difference (p<.05) between SSI/SSDI recipients and other individuals with significant/most significant designations.
What are the relationships between consumers’ functional limitations and: a) vocational goals; and b) services received (type, duration and cost)?
As table 11 indicates, consumers whose vocational goal is structural work had the fewest
gross motor limitations. Those with vocational goals in the service industry also had fewer gross
motor limitations than average. Consumers with homemaker as their vocational goal had many
more gross motor limitations than other consumers.
15

Functional Limitations of Vocational Rehabilitation (VR) Consumers
Table 11. Functional status by vocational goal
Vocational goal
Gross motor function
Cognitive function
Personal care function
Professional/managerial/technical 1.83 1.92a 1.97 Clerical/sales 1.79 1.88a 1.97 Service 1.87a 1.80 1.98a Agriculture/fishing/forestry 1.87 1.87a 1.98 Processing 1.76 1.76 1.93 Machine trades 1.83 1.85 a 1.97 Benchwork 1.83 1.71a 1.97 Structural work 1.91a 1.88a 1.99a Homemaker 1.49a 1.29a 1.92a Miscellaneous 1.85 1.89a 1.97 Other 1.79 1.85a 1.96 All consumers 1.83 1.86 1.97 Source: VR Longitudinal Study
High values indicate fewer functional limitations. a Indicates a significant difference (p<.05) between those with this vocational goal and those with all other vocational goals.
The highest level of cognitive function occurred among consumers with professional,
managerial or technical vocational goals. Individuals with clerical or sales goals; agricultural,
fishing, or forestry goals; structural work goals; and miscellaneous goals also had higher than
average cognitive function. The lowest level of cognitive function occurred among consumers
with homemaker goals. Those with machine trades, benchwork and other goals also had lower
than average cognitive function.
Consumers with structural work as their vocational goal had the highest personal care
function. Those with service as their vocational goal also had higher than average personal care
function. Again, the lowest levels of functioning occurred among individuals with homemaker
as their vocational goal.
To investigate the relationship between consumers’ functional status and the services
they receive, we focused on two groups of consumers: those with orthopedic disabilities and
those with mental retardation. We selected these two groups because they represent a large
subset of the VR population (28.9 percent of Longitudinal Study participants had orthopedic
16

Functional Limitations of Vocational Rehabilitation (VR) Consumers
disabilities; 8.4 percent had mental retardation) and because of the differences in their
functioning levels. As discussed earlier, individuals with orthopedic disabilities had higher than
average cognitive function but lower than average gross motor function, while the reverse was
true for individuals with mental retardation. For each group, we selected services that are
relevant to consumers’ functional status and compared individuals who received that service with
those who did not. Next, we examined: 1) the relationship between functional status measures
and the number of months an individual received VR services; 2) the relationship between these
measures; and 3) the cost of VR services by calculating correlation coefficients for each group.
Among individuals with orthopedic disabilities, those who received assistive technology
assessments, devices or services ranked lower on all three functional status scales than other
individuals (tables 12, 13 and 14). Those who received medical services or occupational therapy
ranked lower on gross motor function.
Among individuals with mental retardation, those who received supported employment
services had higher levels of gross motor function (table 15), but lower levels of cognitive
function (table 16). Those who received maintenance services had higher levels of personal care
function than those who did not (table 17).
While a correlational analysis of all consumers revealed no significant correlations
between: 1) functional status measures individually and throughout their time in VR; 2) the cost
of VR services; or 3) the number of services, there was a small but significant relationship
between an overall measure of functional status2 and their time in VR, the cost of VR services
and the number of services received. In all three cases, the correlation was negative (-.06 for
cost of services; -.03 for time in VR; and -.05 for number of services), indicating that individuals
with low levels of functioning were likely to have higher costs and more time in VR.
Furthermore, the average cost of services for individuals with low functional status was over
twice that of individuals with high functional status, and the average number of services for
2 To create an overall measure of functional status, we standardized values on the three functional status scales (to put them on the same metric) and then averaged the three values. Because we did not assign values on the cognitive function scale for individuals with vision impairments (see Appendix A), they are not included in this analysis.
17

Functional Limitations of Vocational Rehabilitation (VR) Consumers
individuals with low functional status was also significantly higher than that of individuals with
high functional status (table 18).
Table 12. Gross motor function by receipt of selected services (individuals with orthopedic disabilities)
Service Received service Did not receive serviceAssistive technology assessmenta 1.34 1.66 Assistive technology devicesa 1.47 1.68 Assistive technology servicesa 1.37 1.65 Medical servicesa 1.61 1.65 Physical therapy 1.60 1.65 Occupational therapya 1.42 1.65 In-house vocational evaluation 1.69 1.64 Off-site vocational evaluation 1.66 1.64 Source: VR Longitudinal Study
High values indicate fewer functional limitations. a Indicates a significant difference (p<.05) between individuals who received the service and those who did not.
Table 13. Cognitive function by receipt of selected services (individuals with orthopedic disabilities)
Service Received service Did not receive service
Assistive technology assessmenta 1.71 1.90 Assistive technology devicesa 1.81 1.90 Assistive technology servicesa 1.72 1.89 Medical services 1.88 1.89 Physical therapy 1.88 1.89 Occupational therapy 1.79 1.89 In-house vocational evaluation 1.90 1.89 Off-site vocational evaluation 1.88 1.89 Source: VR Longitudinal Study High values indicate fewer functional limitations. a Indicates a significant difference (p<.05) between individuals who received the service and those who did not.
18

Functional Limitations of Vocational Rehabilitation (VR) Consumers
Table 14. Personal care function by receipt of selected services (individuals with orthopedic disabilities)
Service Received service Did not receive service
Assistive technology assessmenta 1.73 1.94 Assistive technology devicesa 1.84 1.94 Assistive technology servicesa 1.70 1.93 Medical services 1.93 1.93 Physical therapy 1.92 1.93 Occupational therapy 1.83 1.93 In-house vocational evaluation 1.93 1.93 Off-site vocational evaluation 1.93 1.93 Source: VR Longitudinal Study High values indicate fewer functional limitations. a Indicates a significant difference (p<.05) between individuals who received the service and those who did not.
Table 15. Gross motor function by receipt of selected services (individuals with mental retardation)
Service Received service Did not receive serviceWork adjustment 1.92 1.92 Supported employment a 1.95 1.91 Maintenance 1.93 1.92 Transportation 1.92 1.92 In-house vocational evaluation 1.92 1.92 Off-site vocational evaluation a 1.90 1.92 Source: VR Longitudinal Study High values indicate fewer functional limitations. a Indicates a significant difference (p<.05) between individuals who received the service and those who did not.
19

Functional Limitations of Vocational Rehabilitation (VR) Consumers
Table 16. Cognitive function by receipt of selected services (individuals with mental retardation)
Service Received service Did not receive service
Work adjustment 1.51 1.58 Supported employment a 1.48 1.59 Maintenance 1.59 1.56 Transportation 1.55 1.57 In-house vocational evaluation a 1.62 1.56 Off-site vocational evaluation 1.51 1.59 Source: VR Longitudinal Study
High values indicate fewer functional limitations. a Indicates a significant difference (p<.05) between individuals who received the service and those who did not.
Table 17. Personal care function by receipt of selected services (individuals with mental retardation)
Service Received service Did not receive service
Work adjustment 1.99 1.98 Supported employment 1.99 1.98 Maintenancea 2.00 1.98 Transportation 1.98 1.98 In-house vocational evaluation 2.00 1.98 Off-site vocational evaluation 1.96 1.99 Source: VR Longitudinal Study
High values indicate fewer functional limitations. a Indicates a significant difference (p<.05) between individuals who received the service and those who did not.
Table 18. Overall functional status by average cost of services
Overall functional status Average cost of services Average number of services
High $4,667 8.8
Middle $5,796 9.0
Low $11,213 10.1 Source: VR Longitudinal Study
20

Functional Limitations of Vocational Rehabilitation (VR) Consumers
Are there differences in functional limitations for consumers whose cases were closed: a) without receiving services; b) nonrehabilitated after receiving services; c) rehabilitated into noncompetitive employment; and d) rehabilitated into competitive employment?
As table 19 shows, the highest functioning levels on all three functional status scales
were for consumers who achieved competitive employment outcomes. Individuals who were
ineligible for services had the second highest level on all three scales (although their personal
care function did not differ significantly from consumers who achieved a competitive
employment outcome), followed by those who received services but failed to achieve an
employment outcome. Consumers who achieved a noncompetitive employment outcome and
those who were eligible but did not receive services were the lowest-scoring groups, with those
who achieved noncompetitive employment outcomes having particularly low cognitive function.
Table 19. Functional status by closure status
Gross motor
function Cognitive function
Personal care function
Achieved a competitive employment outcome 1.87 1.89 1.98
Achieved a noncompetitive employment outcome 1.79a 1.67a 1.96a
Received services, but failed to achieve an employment outcome 1.80a 1.85a 1.97a
Eligible, but did not receive services 1.77a 1.85a 1.96a Ineligible for services 1.80a 1.86a 1.97 Source: VR Longitudinal Study
High values indicate fewer functional limitations. a Indicates a significant difference (p<.05) between those in this category and those who achieved a competitive employment outcome.
Are functional limitations a more consistent predictor of vocational outcome than: a) severity of disability designation; or b) other consumer characteristics, including type of disability, age, sex, education, employment experience, receipt of public assistance and race and ethnic group?
We conducted two regression analyses to investigate the effect of functional status on
employment outcomes. In both analyses, we included the following variables: disability type,
age, sex, years of education, work status at application, receipt of SSI or SSDI, race (white or
nonwhite), and the three functional status scales. Table 20 shows which of these factors
significantly predict whether consumers achieved an employment outcome at closure and if they
did, whether this outcome was competitive. Figures 1 and 2 present these results graphically.
21

Functional Limitations of Vocational Rehabilitation (VR) Consumers
Individuals with visual or hearing impairments and those with mental retardation were
more likely than individuals with orthopedic disabilities to achieve an employment outcome at
closure, while consumers with mental illnesses were less likely than those with orthopedic
disabilities. Working at application of VR services increased the odds of achieving an
employment outcome, while receiving SSI or SSDI and being nonwhite decreased the odds.
Higher levels of gross motor function were associated with achieving an employment outcome.
Having either a visual impairment, mental illness or mental retardation decreased the
likelihood of achieving a competitive employment outcome. Older individuals and those who
received SSI or SSDI were also less likely to achieve a competitive employment outcome.
Higher levels of gross motor function and cognitive function were associated with achieving a
competitive employment outcome.
Table 20. Regression models of consumer outcomes*
Model Influencing factor
Unstandardized weight p
Employment Outcome (R2 = .06) Vision (versus orthopedic physical) 0.80 .0013 Hearing (versus orthopedic physical) 0.62 .0003 Mental illness (versus orthopedic physical) -0.21 .0392
Mental retardation (versus orthopedic physical) 0.62 <.0001 Working at application for VR services 0.79 <.0001 Receipt of SSI/SSDI -0.41 <.0001 Nonwhite -0.26 .0029 High gross motor function 0.77 <.0001
Competitive Employment Outcome (R2 = .17)
Vision (versus orthopedic physical) -0.71 .0229 Mental illness (versus orthopedic physical) -0.79 <.0001 Mental retardation (versus orthopedic physical) -1.36 <.0001 Age (older) -0.03 <.0001 Receipt of SSI/SSDI -0.63 <.0001 High gross motor function 1.00 .0004 High cognitive function 2.08 <.0001Source: VR Longitudinal Study
* We used unweighted stepwise logistic regression techniques to create these two models.
22

Functional Limitations of Vocational Rehabilitation (VR) Consumers
After including the functional limitation scales in the analysis, we found that in these two
models, disability significance was not a statistically important predictor of either employment
outcome or competitive employment outcome. While information about individuals’ functional
limitations contributed to our understanding of employment outcomes, information about the
significance of their disabilities was decidedly less useful in this regard.
In a related analysis, we tested the combined effect of all three functional status measures
on these two outcomes after including all of the aforementioned factors. The effect of functional
status was significant for both outcomes, indicating that functional status had a relationship with
employment outcomes even after other important characteristics were considered.
Figure 1. Employment outcome (R2 = .06)
Type of Disability
Vision
Hearing
Mentalillness
Mentalretardation
Consumer Characteristics
Working atapplication forVR services
Receipt ofSSI/SSDI
Nonwhite
Functional Status
High grossmotorfunction
Likelihood ofachieving anemploymentoutcome++
Type of Disability
Vision
Hearing
Mentalillness
Mentalretardation
Consumer Characteristics
Working atapplication forVR services
Receipt ofSSI/SSDI
Nonwhite
Functional Status
High grossmotorfunction
Likelihood ofachieving anemploymentoutcome++
23

Functional Limitations of Vocational Rehabilitation (VR) Consumers
Figure 2. Competitive employment outcome (R2 = .17)
Type of Disability
Vision
Mentalillness
Mentalretardation
Consumer Characteristics
Age (older)
Receipt ofSSI/SSDI
Functional Status
High grossmotorfunction
Highcognitivefunction
Likelihood ofachieving acompetitiveemployment
outcome++ =
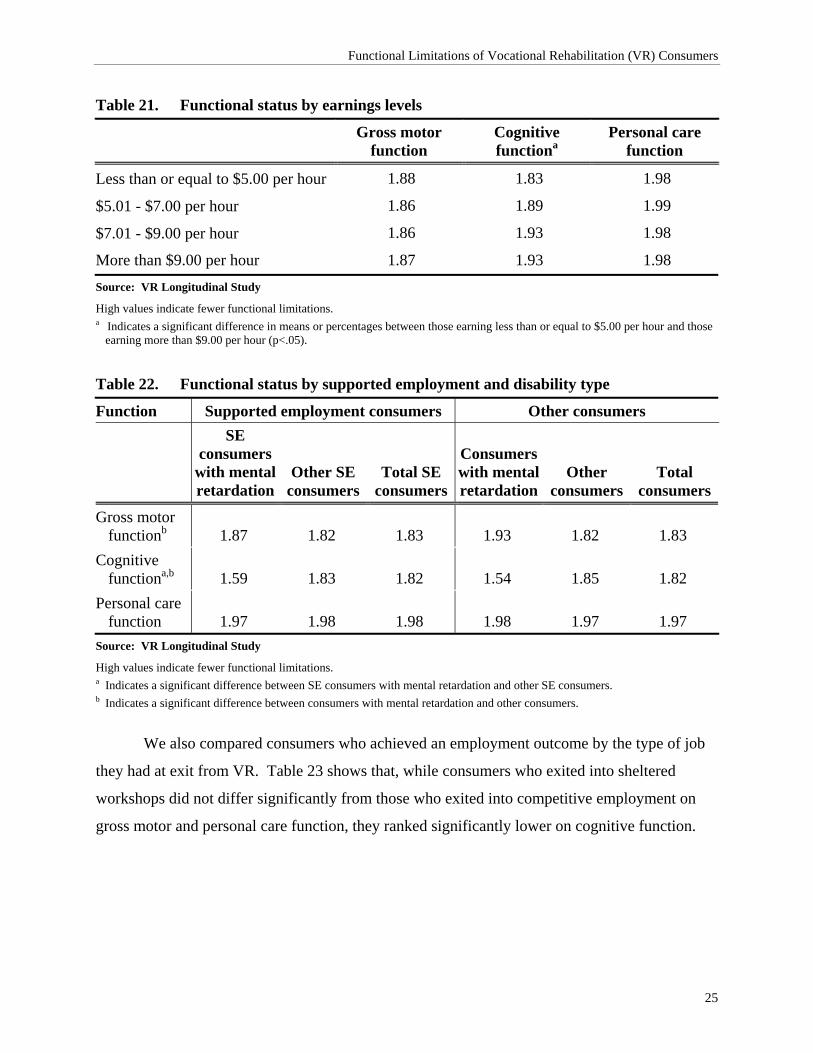
What is the relationship between functional limitations and: a) the earnings levels of persons closed into competitive employment; b) other rehabilitants by category (e.g., homemaker, unpaid family worker); and c) stability of employment over time?
Among individuals who achieved a competitive employment outcome, those who earned
more than $9.00 per hour had significantly higher cognitive function than those who earned up to
$5.00 per hour. There were no significant differences on the other two functional status scales
(table 21).
Tashjian and Schmidt-Davis (2000) looked at the functional status of consumers who
exited VR into supported employment (SE) and compared them with other consumers who
achieved an employment outcome at exit (table 22). To separate the effect of disability type
from the effect of type of employment at exit, we compared individuals with mental retardation
who achieved a supported employment outcome with other individuals who achieved a
supported employment outcome. We discovered that consumers with mental retardation had
more cognitive limitations than other SE consumers. Next, we compared consumers with mental
retardation who achieved an employment outcome other than by supported employment with
consumers with other types of disabilities who achieved a nonsupported employment outcome.
The data showed that consumers with mental retardation in this group had fewer gross motor
limitations and more cognitive limitations than other consumers in this group.
24
Functional Limitations of Vocational Rehabilitation (VR) Consumers
Table 21. Functional status by earnings levels
Gross motor
function Cognitive functiona
Personal care function
Less than or equal to $5.00 per hour 1.88 1.83 1.98
$5.01 - $7.00 per hour 1.86 1.89 1.99
$7.01 - $9.00 per hour 1.86 1.93 1.98
More than $9.00 per hour 1.87 1.93 1.98 Source: VR Longitudinal Study
High values indicate fewer functional limitations. a Indicates a significant difference in means or percentages between those earning less than or equal to $5.00 per hour and those
earning more than $9.00 per hour (p<.05).
Table 22. Functional status by supported employment and disability type
Function Supported employment consumers Other consumers
SE consumers
with mental retardation
Other SE consumers
Total SE consumers
Consumers with mental retardation
Other consumers
Total consumers
Gross motor functionb 1.87 1.82 1.83 1.93 1.82 1.83
Cognitive functiona,b 1.59 1.83 1.82 1.54 1.85 1.82
Personal care function 1.97 1.98 1.98 1.98 1.97 1.97
Source: VR Longitudinal Study
High values indicate fewer functional limitations. a Indicates a significant difference between SE consumers with mental retardation and other SE consumers. b Indicates a significant difference between consumers with mental retardation and other consumers.
We also compared consumers who achieved an employment outcome by the type of job
they had at exit from VR. Table 23 shows that, while consumers who exited into sheltered
workshops did not differ significantly from those who exited into competitive employment on
gross motor and personal care function, they ranked significantly lower on cognitive function.
25

Functional Limitations of Vocational Rehabilitation (VR) Consumers
Table 23. Functional status by sheltered workshop versus competitive employment
Function Consumers closed into sheltered workshops
Consumers closed into competitive employment
Gross motor function 1.81 1.86 Cognitive functiona 1.67 1.91 Personal care function 1.95 1.98 Source: VR Longitudinal Study High values indicate fewer functional limitations. a Indicates a significant difference between consumers closed into sheltered workshops and consumers closed into competitive
employment.
Table 24 presents a comparison of functional status of consumers who were employed at
closure only with those who were employed up to three years later. This analysis revealed no
significant differences on any of the three scales.
Table 24. Functional status by retention of employment over time (competitively employed only)
Length of time employed Gross motor
functiona Cognitive function
Personal care function
Employed at exit from VR, not employed in subsequent years 1.85 1.89 1.98
Employed at 1-year follow-up, not employed in subsequent years 1.86 1.90 1.99
Employed at 2-year follow-up, not employed in subsequent years 1.88 1.89 1.99
Employed at 3-year follow-up, not employed in subsequent years 1.89 1.89 1.98
Source: VR Longitudinal Study
High values indicate fewer functional limitations. a Indicates a significant difference (p<.05) between those employed at closure and up to their one year follow-up and those who
were employed at the time of their two- or three-year follow-up.
Do functional limitations change over time, especially with receipt of VR services?
To examine changes over time, we compared consumers’ functional status scores at entry
to VR and at exit from VR. We found no significant differences, even among consumers who
closed more than three years after they entered VR.
26

Conclusion Functional status scales provide more comprehensive information about the nature of
consumers’ impairments and about how these impairments constrain their abilities to obtain and
retain employment than the traditional classification of disabilities as nonsignificant, significant
or most significant. These scales offer efficient ways of capturing differences between groups.
As our analyses have shown, VR consumers differ on these three dimensions across disability,
demographic, vocational characteristics, type of services received and employment outcomes.
Furthermore, functional status scales are much more powerful predictors of employment
outcomes and of competitive employment outcomes than the significance designation set forth in
the Rehabilitation Act. We plan to use these scales in more complex structural equation and path
analysis models that will provide better information about the effect of initial functional status
over time and the effect of receipt of services on functional status.
In conclusion, because the functional status scales are based on Activities of Daily Living
(ADL) and Instrumental Activities of Daily Living (IADL) items, their utility for certain
disabilities may be limited. These items, while in widespread use on national surveys of
individuals with disabilities, are not sensitive indicators of functional status among persons with
mental illness or visual impairments, for example. Therefore, since this approach to the
measurement of functional status has promise, it may be appropriate to conduct further research
designed to improve the utility of these measures for specific types of disabilities.
27

28

References Clark, D.O., T.W. Stump, and F.D. Wolinsky. 1997. “A race- and gender-specific replication of
five dimensions of functional limitation and disability.” Journal of Aging and Health 9 (1): 28-42.
Fitzgerald, J.F., D.M. Smith, D.K. Martin, J.A. Freedman, and F.D. Wolinsky. 1993.
“Replication of the multidimensionality of activities of daily living.” Journal of Gerontology 48 (1): S28-S31.
Hayward, B.J. and H.A. Schmidt-Davis. 1999. A longitudinal study of the Vocational
Rehabilitation Service Program: Fourth interim report. Research Triangle Park, NC: Research Triangle Institute.
Hayward, B.J. and M.D. Tashjian. 1996. A longitudinal study of the Vocational Rehabilitation
Service Program: Second interim report. Research Triangle Park, NC: Research Triangle Institute.
Johnson, R.J. and F.D. Wolinsky. 1993. “The structure of health status among older adults:
Disease, disability, functional limitation, and perceived health.” Journal of Health and Social Behavior 34 (2): 105-121.
Overman, B.M. and H.A. Schmidt-Davis. 2000. “Analysis of the National Health Interview
Survey: The vocational rehabilitation perspective.” Research Triangle Park, NC: Research Triangle Institute.
Spector, W.D. and J.A. Fleishman. 1998. “Combining activities of daily living with instrumental
activities of daily living to measure functional disability.” Journal of Gerontology 53B (1): S46-S57.
Tashjian, M.D. and H.A. Schmidt-Davis. 2000. Vocational Rehabilitation experiences among
individuals who achieved a supported employment outcome. Research Triangle Park, NC: Research Triangle Institute.
Thomas, V.S., K. Rockwood, and I. McDowell. 1998. “Multidimensionality in instrumental and
basic activities of daily living.” Journal of Clinical Epidemiology 51 (4): 315-321. Wolinsky, F.D. and R.J. Johnson. 1991. “The use of health services by older adults.” Journal of
Gerontology 46 (6): S345-357.
29

30

Appendix A:
Theoretical Background and Scale Development

32

Theoretical Background Gerontology researchers have used factor analysis to explore the number of underlying
dimensions in ADL and IADL items with differing results (table A-1). Johnson and Wolinsky
(1993) identified five factors—Basic ADL, Household ADL, Advanced ADL, and Lower and
Upper Body Limitations3—that seemed to summarize the functional status of individuals aged 70
or older. In a study of hospital patients aged 45 or older, Fitzgerald et al. also identified the
Basic, Advanced and Household ADL dimensions in addition to a fourth dimension,
incontinence. Clark, Stump and Wolinsky (1997) found further evidence for these first three
factors. Using data from the National Long-Term Care Survey, they identified three factors:
Self-care (similar to Basic ADL), Home-care (similar to Household ADL), and Cognitive
function (similar to Advanced ADL).
However, using the same data source but different analysis techniques, Spector and
Fleishman (1998) concluded that only one dimension underlies these items. Thomas, Rockwood
and McDowell (1998) found three factors that they labeled basic self-care, intermediate self-care
and complex self-management. These factors do not correspond very closely to the factors that
earlier researchers identified.
Overall, Wolinsky and his colleagues seem to have found a stable set of three factors
within the ADL and IADL items. Differences between their results and the results of Spector
and Fleishman and Thomas and his colleagues are attributable to: different populations; different
analysis techniques (principal components analysis versus principal axis factor analysis;
tetrachoric correlations versus Pearson correlations); slightly different sets of items (i.e., Spector
and Fleishman used “going outside of walking distance” while other researchers did not); and
different assumptions about the structure of these items (for example, Clark et al. attempted to
confirm Johnson and Wolinsky’s model rather than to conduct an exploratory analysis).
None of this research, however, has examined the dimensionality of functional status in
the nonelderly population. Thus, it is unclear if the factor structure underlying older adults’
3In this study, Johnson and Wolinsky used items from Nagi’s disability scale. These items make up the Lower and Upper Body Limitations Scales and do not appear in the other models we discuss.
33

Functional Limitations of Vocational Rehabilitation (VR) Consumers
responses to these items is similar to that of younger individuals. To address this issue, we used
data from the 1994–95 National Health Interview Survey-Disability Supplement (NHIS-D) and
the Longitudinal Study of the Vocational Rehabilitation Services Program.4 Both of these
surveys include ADL and IADL items. NHIS-D contains two parts, one of which was
administered along with the core survey to a sample designed to represent the civilian noninstitu-
tionalized population of the United States. The second part, the Disability Followback Survey,
was administered later only to those individuals whose responses indicated that they met the
NHIS definition of disability. The National Center for Health Statistics used a variety of
questions from the Core Questionnaire and the Disability Supplement to select respondents for
the Disability Followback Survey, including questions about limitations in major life activities,
use of assistive devices, selected physical or mental health conditions, receipt of or application
for public assistance, participation in employment services or other programs, difficulty in social
functioning, and ADL and IADL questions. The ADL and IADL items used in our analysis
appear on the Disability Followback Survey.
The Longitudinal Study of the VR Services Program is a national impact evaluation
that investigates the effects of VR services on economic and other outcomes for individuals
with disabilities who receive such services. The Longitudinal Study drew a nationally
representative sample of more than 8,000 respondents, including applicants for VR services
(some of whom were not accepted for services), VR consumers, and former VR consumers.
The data used in our analysis come from an interview conducted with applicants and VR
consumers at entry into the study.
4 Under contract to the Rehabilitation Services Administration, U.S. Department of Education, the Research Triangle Institute is conducting this congressionally mandated impact evaluation of the State-Federal VR Services Program. The study is scheduled for completion in 2002.
34

Table A-1. Review of functional status literature Source Population Data source Factors
Johnson, Robert J., and Wolinsky, Fredric D. (1993). “The Structure of Health Status Among Older Adults: Disease, Disability, Functional Limitation, and Perceived Health.” Journal of Health and Social Behavior, 34(2): 105-121.
5,151 individuals aged 70 or older
1984 Longitudinal Study on Aging (a supplement to the 1984 Health Interview Survey)
Basic ADL (Bathing, dressing, getting out of bed, walking, toileting)
Household ADL (Meal preparation, shopping, light housework, heavy housework)
Advanced ADL (Managing money, using the telephone, eating)
Lower body limitations (Walking a quarter of a mile; walking up 10 steps without rest; standing or being on your feet for two hours; stooping, crouching or kneeling; and lifting or carrying 25 pounds)
Upper body limitations (Sitting for two hours; reaching up over your head; reaching out as if to shake hands; and using fingers to grasp objects)
35

36 Table A-1. (continued)
Source Population Data source Factors
Fitzgerald, John F., Smith, David M., Martin, Douglas K., Freedman, Jay A., and Wolinsky, Fredric D. (1993). “Replication of the Multidimensionality of Activities of Daily Living.” Journal of Gerontology, 48(1): S28-S31.
668 hospital patients aged 45 years or older
A randomized controlled trial of an intervention using case managers to reduce hospital utilization at a Veterans Administration medical center in Indianapolis, Ind.
Advanced ADL (Using the telephone, managing money, eating, and taking medications)
Basic ADL (Dressing, transferring, walking, and bathing)
Household ADL (Preparing meals, shopping, performing housework, and traveling to places out of walking distance)
Incontinence
Clark, Daniel O., Stump, Timothy W., and Wolinsky, Fredric D. (1997). “A Race- and Gender- Specific Replication of Five Dimensions of Functional Limitation and Disability.” Journal of Aging and Health, 9(1): 28-42.
14,415 community-dwelling individuals aged 65 or older who identified themselves as Black or White (for some analyses, the authors used data from 4,297 of these individuals who reported an ADL- or IADL-based disability)
1989 National Long-Term Care Survey
Self-care (Getting in/out of bed, getting around inside, bathing, toileting)
Home-care (Light housework, laundry, grocery shopping, meal preparation)
Cognitive (Managing money, using telephone, taking medication)

37
Table A-1. (continued)
Source Population Data source Factors
Spector, William D. and Fleishman, John A. (1998). “Combining Activities of Daily Living With Instrumental Activities of Daily Living to Measure Functional Disability.” Journal of Gerontology, 53B (1): S46-S57.
2,977 individuals aged 65 or older with functional disabilities in at least one of 16 ADLs or IADLs
1989 National Long-Term Care Survey
One overall factor (Going outside of walking distance; shopping; doing laundry; bathing; getting around outside; preparing meals; taking medications; managing money; getting around inside; light housework; dressing; transferring; toileting; using the telephone; help with incontinence; feeding)
Thomas, Vince S., Rockwood, Kenneth, and McDowell, Ian (1998). “Multidimensionality in Instrumental and Basic Activities of Daily Living.” Journal of Clinical Epidemiology, 51(4): 315-321.
9,008 noninstitutionalized individuals over 65
1991–92 Canadian Study of Health and Aging
Basic self-care (toileting, dressing, eating, transferring, grooming)
Intermediate self-care (bathing, walking, housework, meal preparation, shopping, walking outside)
Complex self-management (handling money, phone use, self-medicating)

38

Scale Development
National Health Interview Survey
To discover underlying traits that influence respondents’ answers to ADL and IADL
questions, we conducted two sets of exploratory factor analyses, one with data from NHIS-D and
one with data from the Longitudinal Study. The NHIS-D analysis revealed three underlying
dimensions, as shown in table A-2.5 The first dimension corresponds to gross motor function;
the second contains items related to personal care function; and the third set of items involves
cognitive function. The gross motor dimension corresponds somewhat to Johnson and
Wolinsky’s Lower Body Limitation Scale, while the personal care dimension matches their
Basic ADL Scale and the cognitive dimension is similar to the Advanced ADL Scale. All but
three items load heavily on only one factor. Where items loaded heavily on more than one
factor, we grouped them with the factor on which their loading was highest. Table A-3 presents
the correlations among these factors. As expected, gross motor function and cognitive function
are moderately correlated (.52). Personal care function is more strongly related to gross motor
function and to cognitive function (.58 and .65 respectively).
To create scales for these items, we assigned a value of one for each response that
indicates a limitation and a value of two for each response that does not indicate a limitation.
Next, we took the mean score on all items for each respondent. Therefore, a high score means a
higher level of functioning, with a maximum score of two, while a low score means a lower level
of functioning, with a minimum score of one.
To confirm that these three scales have acceptable levels of reliability, we calculated
Cronbach’s alpha for each of them. We present these results in table A-4. Although the reliability
coefficient is highest for the gross motor function (.89), all three are within acceptable limits.
5 We specified an oblique promax rotation for these analyses. We determined the number of factors based on the
number of eigenvalues greater than one.
39

Functional Limitations of Vocational Rehabilitation (VR) Consumers
Table A-2. Exploratory factor analysis of selected ADL and IADL questions from NHIS-D*
Question Gross motor
function Cognitive function
Personal care function
By yourself and without using aids, do you have any difficulty:
Standing or being on your feet for about two hours?
.86 - -
Walking for a quarter of a mile (that is about two or three blocks)?
.86 - -
Walking up 10 steps without resting? .85 - - Lifting or carrying something as heavy
as 25 pounds (such as two full bags of groceries)?
.83 - -
Stooping, crouching or kneeling? .81 - -
Because of a health or physical problem, do you have any difficulty:
Doing heavy housework, like scrubbing floors or washing windows?
.76 - -
Managing your money, such as keeping track of expenses or paying bills?
- .94 -
Managing your medication? - .90 - Preparing your own meals? - .77 - Shopping for groceries and personal
items, such as toiletries or medicines? .60 .74 -
Getting to places outside of walking distance?
.59 .70 -
Getting into or out of bed or chairs? - - .72 Dressing? - - .68 Using the toilet, including getting to the
toilet? - - .65
Bathing or showering? .57 - .58 Source: National Health Interview Survey-Disability Supplement
* Loadings less than .55 are omitted from this table.
40

Functional Limitations of Vocational Rehabilitation (VR) Consumers
Table A-3. Interfactor correlations among NHIS-D functional status scales
Scale Gross motor
function Cognitive function
Personal care function
Gross motor function 1.00 0.52 0.58 Cognitive function 0.52 1.00 0.65 Personal care function 0.58 0.65 1.00 Source: National Health Interview Survey-Disability Supplement
Table A-4. Reliability coefficients for NHIS-D functional status scales
Scale Cronbach’s alpha
Gross motor function .89 Personal care function .84 Cognitive function .85 Source: National Health Interview Survey-Disability Supplement
Longitudinal Study of the Vocational Rehabilitation Services Program
The factor analysis in which we used data from the Longitudinal Study also uncovered
three underlying dimensions, as shown in table A-5. The first dimension corresponds to gross
motor function; the second contains items related to personal care function; and the third set of
items involves cognitive function. While the resulting scales did not include exactly the same
items as the NHIS-D scales, they appear to measure similar constructs. The Longitudinal
Study’s gross motor scale includes four of the same items as the NHIS-D gross motor scale, but
does not include “standing or being on your feet for about two hours” or “stooping, crouching or
kneeling.” Likewise, the NHIS-D gross motor scale does not include “getting around outside the
house,” which is not included in the follow-back survey. While “eating” appears on both
instruments, in the NHIS-D survey this item did not load heavily on any of the three factors, so
we did not include it in these scales. However, in the Longitudinal Study this item loaded on the
41

Functional Limitations of Vocational Rehabilitation (VR) Consumers
personal care factor, so it is included in this scale. Four items in the Longitudinal Study’s
cognitive scale, “reading and understanding the newspaper,” “writing,” “driving” and “using
public transportation,” appear in the Longitudinal Study questionnaire but not in the NHIS-D
survey, while two items, “preparing your own meals” and “getting to places outside of walking
distance,” appear in the NHIS-D survey but not in the Longitudinal Study instrument. As shown
in table A-6, these factors are also correlated with each other. Cognitive function is only
moderately related to gross motor function and to personal care function (.31 and .36
respectively). Personal care function is more strongly related to gross motor function (.58).
42

Functional Limitations of Vocational Rehabilitation (VR) Consumers
Table A-5. Factor analysis of Longitudinal Study ADL and IADL items*
Item Gross motor
function Cognitive function
Personal care function
Are you able to do this by yourself? The activity is Walking for a quarter of a mile—about three
city blocks 0.77 - -
Walking up a flight of stairs without resting 0.70 - - Doing heavy housework (such as scrubbing
floors or washing windows) 0.62 - -
Lifting and carrying something as heavy as 10 pounds (such as a full bag of groceries)
0.54 - -
Getting around outside the house 0.52 - - Reading and understanding the newspaper - 0.69 - Writing - 0.58 - Managing your money (such as keeping
track of expenses or paying bills) - 0.61 -
Shopping for personal items (such as toilet items or medicines)
- 0.58 -
Driving - 0.57 - Using public transportation - 0.50 - Using the toilet, including getting to the
toilet - - 0.73
Dressing - - 0.65 Bathing or showering - - 0.64 Getting into and out of bed - - 0.64 Eating - - 0.50 Source: VR Longitudinal Study
* Loadings less than .40 are omitted from this table. Table A-6. Interfactor correlations among Longitudinal Study functional status scales
Scale Gross motor
function Cognitive function
Personal carefunction
Gross motor function 1.00 0.31 0.58 Cognitive function 0.31 1.00 0.31 Personal care function 0.58 0.36 1.00 Source: VR Longitudinal Study
43

Functional Limitations of Vocational Rehabilitation (VR) Consumers
Based on a review of the items in each scale, we questioned the appropriateness of the
items in the cognitive function scale for individuals with visual impairments. Consequently, we
tested whether the factor loadings of items on the cognitive scale for individuals with visual
impairments differs from the loadings for other individuals by using a confirmatory factor
analysis for each group of cognitive function. The loadings for “driving” were significantly
different, with a lower loading (.562) for individuals with visual impairments than for other
individuals (1.183). As this analysis confirms, the characteristics of vision impairment confound
our ability to discriminate based on cognitive function. Therefore, we omitted individuals with
visual impairments from our analysis of the reliability of this measure and we do not report
cognitive functioning for this subgroup. The results of the reliability analysis for these scales
appear in table A-7. All three reliability coefficients are within acceptable limits.
Table A-7. Reliability coefficients for Longitudinal Study functional status scales
Scale Cronbach’s alpha
Gross motor function .80 Personal care function .81 Cognitive function .82 Source: VR Longitudinal Study
To create the scales for the longitudinal study, we assigned a value of one for each
response that indicates a limitation and a value of two for each response that does not indicate a
limitation. Next, we took the mean score on all items for each respondent. Therefore, a high
score means a higher level of functioning, with a maximum score of two, while a low score
means a lower level of functioning, with a minimum score of one.
44


Our mission is to ensure equal access to education and to promote
educational excellence throughout the nation.
www.ed.gov