
Utilization of renewable raw materials in Germany Martina Haase, Rebecca Ilsen, Magnus Fröhling...
17
Utilization of renewable raw materials in Germany Martina Haase, Rebecca Ilsen , Magnus Fröhling Institute for Industrial Production, Universität Karlsruhe (TH), Germany II P Institute for Industrial Production (IIP) ord. Prof. Dr. rer. nat. O. Rentz
-
date post
21-Dec-2015 -
Category
Documents
-
view
214 -
download
0
Transcript of Utilization of renewable raw materials in Germany Martina Haase, Rebecca Ilsen, Magnus Fröhling...

Utilization of renewable raw materials in Germany
Martina Haase, Rebecca Ilsen, Magnus Fröhling
Institute for Industrial Production, Universität Karlsruhe (TH), Germany
IIP Institute for Industrial Production (IIP)ord. Prof. Dr. rer. nat. O. Rentz
2
Overview of the use of renewable resources in Germany– Energetic use– Non-energetic use
Motivation and general framework for the increasing use of biomass– Usage competition– Legal framework– Techno-economic and ecological evaluation of biomass
utilization pathways
Conclusion
Outline
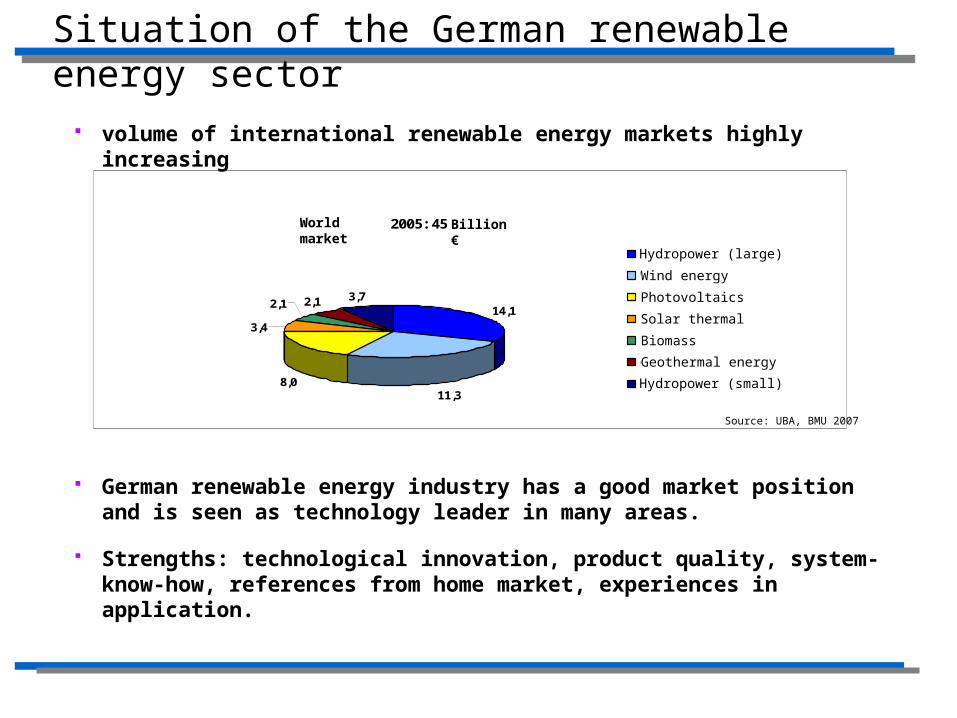
volume of international renewable energy markets highly increasing
German renewable energy industry has a good market position and is seen as technology leader in many areas.
Strengths: technological innovation, product quality, system-know-how, references from home market, experiences in application.
Situation of the German renewable energy sector
Weltmarkt 2005: 45 Mrd. €
14,1
11,38,0
3,4
2,1 2,1 3,7
Wasserkraft (groß)
Windkraft
Photovoltaik
Solarthermie
Biomasse
Geothermie
Wasserkraft (klein)
Source: UBA, BMU 2007
World market Billion €
Hydropower (large)
Wind energy
Photovoltaics
Solar thermal energy
Geothermal energy
Biomass
Hydropower (small)

4
Energetic use of renewable resources (1)
Renewable energy sources as a share of energy supply in Germany
3.14.8
0.22.1
8.6
14.2
6.67.6
3.5
6.7
182)
141)
0
5
10
15
20
25
30
35
Share of total final energyconsumtion
Share of gross electricityconsumption
Share of final energyconsumtion for heat
Share of fuel consumption Share of primary energyconsumption
Sh
are
in [
%]
1998 2000
2002 2004
2006 2007
2020
3)
minimum 301)
1 ) Resolution of the German P arlament, 6th J une 2008; 2) Directive of the Euopean P arlament and the Council on the promotion of the use of energy from renewable sources, 23 J anuary 2008;
3) For calculating the share of primary energy consumption (P EC), the (official) physical energy content method has been used (acc. to the substitution method: 9.2 %) RE - renewable energiy, Source: BMU-Brochure:"Renewable energy sources in figures – national and international development", KI III 1; Version: J une 2008; all figures provisional
German Government Targets
5
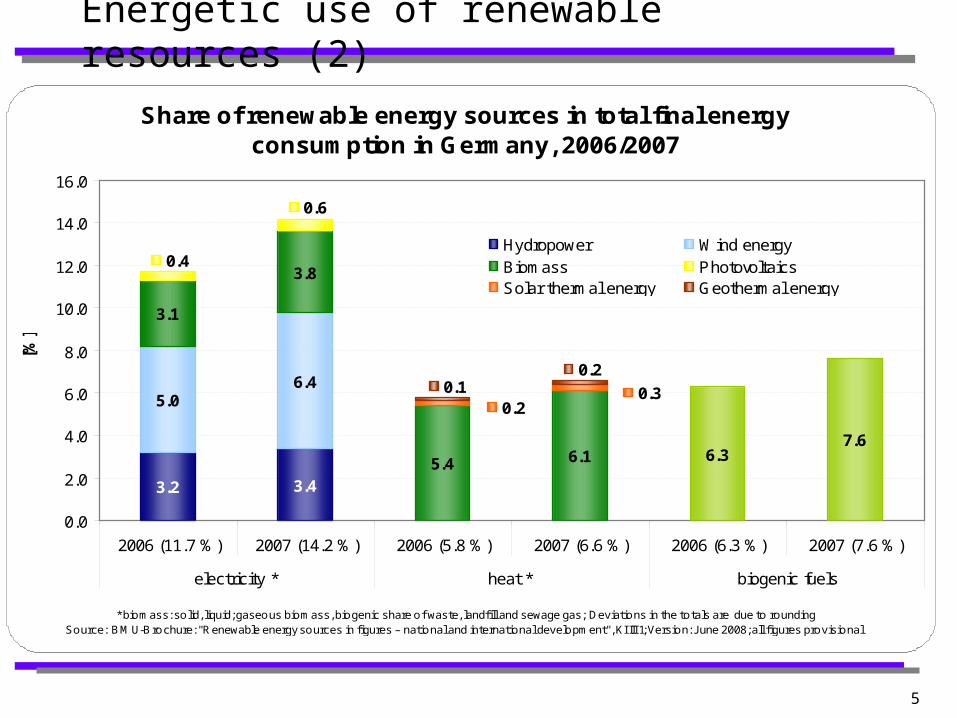
Energetic use of renewable resources (2)
Share of renewable energy sources in total final energy consumption in Germany, 2006/2007
3.2 3.4
5.06.4
3.1
3.8
5.4 6.1 6.37.6
0.6
0.4
0.30.2
0.10.2
0.0
2.0
4.0
6.0
8.0
10.0
12.0
14.0
16.0
2006 (11.7 %) 2007 (14.2 %) 2006 (5.8 %) 2007 (6.6 %) 2006 (6.3 %) 2007 (7.6 %)
electricity * heat * biogenic fuels
[%
]
Hydropower Wind energyBiomass PhotovoltaicsSolar thermal energy Geothermal energy
* biomass: solid, liquid; gaseous biomass, biogenic share of waste, landfill and sewage gas; Deviations in the totals are due to roundingSource: BMU-Brochure: "Renewable energy sources in figures – national and international development", KI III 1; Version: J une 2008; all figures provisional

6
nearly 70% of renewable energy is delivered from biomass utilization
Biomass is mainly used for heat and fuel generation
for electricity production wind energy and hydropower are the most important renewable resources
73,90%
18,80%
7,30%
biodiesel vegetable oil bioethanol
7,6% of the fuel consumption is provided by biofuels in 2007
– therein more than 70% is biodiesel
– biodiesel is produced mainly from rape
– available at 1900 fuel stations– biofuels of 2nd generation not
yet available
Structure of biogenic fuel in Germany, 2007
Structure for the provision of final energy from renewable resources in Germany (basic year 2007):
Energetic use of renewable resources (3)
Source: BMU 2008
Source: BMU 2008

7
Energetic use of renewable resources in Germany - heat
Approximately 1370 TWh heat are annually generated in Germany (basic year 2007)
Ca. 7% of the entire heat generation are provided by renewable resources (basic year 2007)
Source: BMU 2008
Structure of the heat generation from renewable resources in Germany2007
8
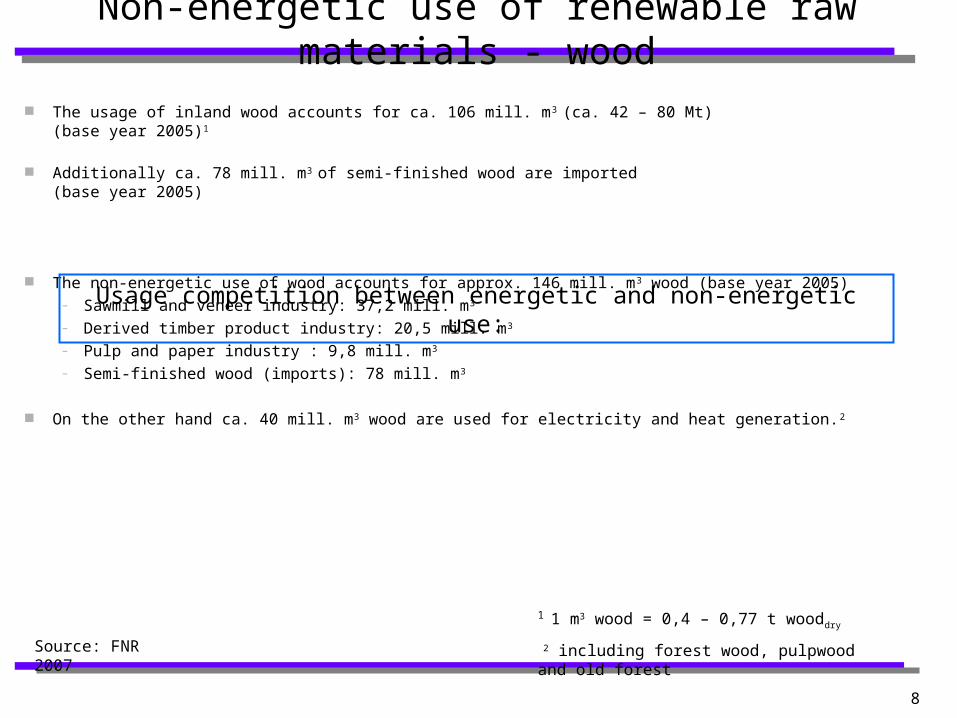
The usage of inland wood accounts for ca. 106 mill. m3 (ca. 42 – 80 Mt) (base year 2005)1
Additionally ca. 78 mill. m3 of semi-finished wood are imported (base year 2005)
The non-energetic use of wood accounts for approx. 146 mill. m3 wood (base year 2005)– Sawmill and veneer industry: 37,2 mill. m3 – Derived timber product industry: 20,5 mill. m3
– Pulp and paper industry : 9,8 mill. m3 – Semi-finished wood (imports): 78 mill. m3
On the other hand ca. 40 mill. m3 wood are used for electricity and heat generation.2
1 1 m3 wood = 0,4 – 0,77 t wooddry
2 including forest wood, pulpwood and old forest
Source: FNR 2007
Non-energetic use of renewable raw materials - wood
Usage competition between energetic and non-energetic use:

9
Non-energetic use of renewable raw materials
Raw material Amount [t]
Vegetable oils 800.000
Starch 630.000
Animal fats 350.000
Cellulose 320.000
Sugar 295.000
Natural fibres 176.000
Others 117.000
TOTAL 2.688.000
Ca. 2.7 mill. t of renewable raw materials are used in the industry per year
Thereof ca. 2 mill. t are used in the chemical industry and ca. 0,7 mill. t in the pulp and paper industry (base year 2007)
Raw material proportions of the chemical industry in Germany (basic year 2007)
Renewable raw materials in the chemical-technical area
Sources: FNR 2007, VCI 2008
75%
11%
2%
12%
petroleum natural gas coal renewable primary products

10
Biomass utilization pathways in Germany
Biomass Process steps Products
Gasification,Synthesis
Straw, woodBtl-fuelSynFuel
WoodDisintegration,
Enzymatic hydrolysis, Fermentation
platform chemicals (e.g. ethanol, lactic acid)
Cereal, Sugar beet
ethanolEnzymatic hydrolysis,
Fermentation, Distillation
Oil mill,Refining,
Transesterification
Oil plants(rape, sunflower)
FAME(biodiesel)
Anaerobe fermentation
corn, liquid manure, sewage sludge, Biowaste
Biogas Methane
Application
fuel:2 pilot installations- Choren, Freiberg- FZK, Karlsruhe
Research projects
fuel: Flexible-Fuel-Vehicles for E85 availableInfrastructure: 75 petrol stations for E85
fuel:cars for B100 available, good infrastructure
heat and electricity:950 MW in 3300 installations

11
Increase of the cultivated area for renewable raw materials in Germany:
– from ca. 290.000 ha in the year 1993
– to ca. 2 mill. ha in the year 2007 (approximately 17% of the agricultural crop land in 2007)
In 2020 3,5 m ha might be available for biomass production because of
– increase in production efficiency– decrease in population in Germany– reduction of European food
overproduction
if 3,5 m ha were used to produce BtL-fuel, 25% of German fuel consumption could be substituted.
Source: FNR 2007, BMU
Biomass Usage competition
Energetic vs. non-energetic use
Land use
1993: 85% of this area served for the material utilization
2007: only about 13%.
In particular increase of the cultivated area for rape for the production of biofuels (ca. 1,1 mill. ha in the year 2007)
Especially vegetable oils and starch (from rape and cereals) do also represent important industrial raw materials

12
Replacement of limited fossil raw materials
Reduction of dependence of crude oil imports
Reduction of greenhouse gas emissions
Biomass represents a renewable but limited resource
Competition for land use and between different utilisation pathways requires an efficient and sustainable use of biomass
General Framework for an increasing use of biomass
Constraints
Motivation

13
Legal framework for the use of biomass
EU: – Guideline 2003/30/EG: Increase of biofuels on the fuel market to
5,75 % until the end of 2010 and to 10 % until the end of 2020
– and others
D:– BioKraftQuG: a given part of fuel sold has to be biofuel
– EnergieStG: no or less tax on biofuels compared to fossil fuels
– EEG: fixed purchasing prices for electricity from renewable sources
– Financial investment programs
– BioNachV: Regulation of sustainability of biomass for the certification of biofuels (concept October 2007)
Sustainable cultivation of agricultural areas
Protection of natural habitats
Potential for the reduction of greenhouse gas emissions.

14
Techno-economic and ecological evaluation (1)
Estimation of the economic efficiency and the environmental effects of process chains for the use of biomass
Identification of economic and ecological key factors to ensure sustainability
Modelling of material and energy flows along the whole value chain
Estimation of environmental impacts
Location and logistics planning
Estimation of investments and total costs
Process determination
Sensitivity analysis
Identification of key factors

15
Estimation of the necessary investments:
– Individual identification of investments for the main plant components
– Application of economies of scale
Determination of annual overall costs of the process chain:
– Investment dependent costs (depreciations, interests,...)
– Operating costs (costs for raw materials, electricity, etc.)
– Labour costs– Costs for transportation– Revenues for by-products
Methodology for life cycle assessment (LCA) according to the European standard DIN EN ISO 14040 and 14044
Goal and scope definition for life cycle inventory analysis
Selection of adequate impact categories, e.g.
- Climate change- Eutrophication- Acidification
Identification of relevant material and energy flows and conversion to indicator values, e.g. CO2 equivalents)
Cultivation of biomass
Production process
Use of product
Transport Transport
Emissions(CO2, NOx,
NH3,...)
Energy Operating materials
Environmental impactsEconomic evaluation
Techno-economic and ecological evaluation (2)

16
Biomass is used energetically as well as non-energetically in Germany
The increasing use of biomass is supposed to reduce the dependence on crude oil imports and to assure the raw materials supply
New utilization concepts amplify existing biomass usage competitions
The techno-economic and ecological evaluation at an early stage of process development aims at the identification of sustainable ways of biomass utilization
Identification of reasonable biomass utilization paths in respect of local conditions (available technologies and feedstock potentials)
Summary and conclusion

17
Hertzstr. 1676187 KarlsruheGermany
Dr. rer. pol. Magnus Fröhling +49 (0)721 608-4400 [email protected]
Dipl.-Umweltwiss. Martina Haase+49 (0)721 608-4467 [email protected]
Dipl.-Wi.Ing. Rebecca Ilsen+49 (0)721 [email protected]
IIP Institute for Industrial Production (IIP)ord. Prof. Dr. rer. nat. O. Rentz
Thank you for your attention.


![Eileen Haase and Harry Goldberg - ii.library.jhu.eduii.library.jhu.edu/wp-content/uploads/sites/31/2017/02/Haase-Team... · Eileen Haase and Harry Goldberg . V [S] ... iRAT gRAT “having](https://static.fdocuments.in/doc/165x107/5b6e05057f8b9aed178e0b77/eileen-haase-and-harry-goldberg-ii-eileen-haase-and-harry-goldberg-v-s.jpg)


![Martin Haase: Linguistic Hacking [24c3]](https://static.fdocuments.in/doc/165x107/549ea58db37959aa618b4791/martin-haase-linguistic-hacking-24c3.jpg)