UTILIZATION OF POMEGRANATE FRUIT WASTE AS VALUE...
198
UTILIZATION OF POMEGRANATE FRUIT WASTE AS VALUE ADDED DRINK By Anees Ahmed Khalil M.Sc. (Hons.) Food Technology A thesis submitted in partial fulfillment of the requirements for the degree of DOCTOR OF PHILOSOPHY IN FOOD TECHNOLOGY NATIONAL INSTITUTE OF FOOD SCIENCE & TECHNOLOGY FACULTY OF FOOD, NUTRITION AND HOME SCIENCES UNIVERSITY OF AGRICULTURE, FAISALABAD PAKISTAN 2016
Transcript of UTILIZATION OF POMEGRANATE FRUIT WASTE AS VALUE...

UTILIZATION OF POMEGRANATE FRUIT
WASTE AS VALUE ADDED DRINK
By
Anees Ahmed Khalil
M.Sc. (Hons.) Food Technology
A thesis submitted in partial fulfillment of the requirements for the degree of
DOCTOR OF PHILOSOPHY
IN
FOOD TECHNOLOGY
NATIONAL INSTITUTE OF FOOD SCIENCE & TECHNOLOGY
FACULTY OF FOOD, NUTRITION AND HOME SCIENCES
UNIVERSITY OF AGRICULTURE, FAISALABAD
PAKISTAN
2016

DECLARATION
I hereby declare that the contents of the thesis “Utilization of pomegranate
fruit waste as value added drink” are product of my own research and no part
has been copied from any published source (except references, standard
mathematical and generic models/equations/formulas/protocols etc.). I further
declare that this work has not been submitted for award of any other
diploma/degree. The University may take action if the information provided is
found inaccurate at any stage.
Anees Ahmed Khalil

To,
The Controller of Examinations,
University of Agriculture,
Faisalabad.
We, the supervisory committee, certify that the contents and form of this thesis submitted by
Anees Ahmed Khalil, Reg. # 2006-ag-1294 have been found satisfactory and recommend
that it be processed for evaluation by the External Examiner(s) for the award of degree:
SUPERVISORY COMMITTEE:
Chairman: _________________________________________
(Dr. Moazzam Rafiq Khan)
Member: _________________________________________
(Dr. Muhammad Asim Shabbir)
Member: _________________________________________
(Prof. Dr. Khalil-ur-Rahman)

DEDICATED
TO
HOLY PROPHET HAZRAT
MUHAMMAD
(Peace Be Upon Him)
&
MY FATHER
M. KHALIL AHMED (Late)

CONTENTS
Sr. No. Title Page No.
I INTRODUCTION 1
II REVIEW OF LITERATURE 6
III MATERIALS AND METHODS 31
IV RESULTS AND DISCUSSION 43
V SUMMARY 144
CONCLUSIONS 149
RECOMMENDATIONS 150
LITERATURE CITED 151

LIST OF CONTENTS
i ACKNOWLEDGEMENTS i
ii LIST OF TABLES ii
iii LIST OF FIGURES v
iv LIST OF APPENDICES vi
v ABSTRACT vii
1. INTRODUCTION 1
2. REVIEW OF LITERATURE 6
2.1. Concept of functional and nutraceutical foods 7
2.2. Nutritional profiling of Pomegranate peel and bagasse 11
2.3. Punicalagin: a potent nutraceutical compound 13
2.4. Extraction and quantification of pomegranate polyphenols 17
2.5. Bioactivity, bioavailability and metabolism 17
2.6. Pomegranate polyphenols against metabolic syndromes 20
2.6.1. Oxidative stress related complications 21
2.6.2. Hypercholesterolemia and renal dysfunction 24
2.6.3. Diabetes and insulin malfunctioning 28
3. MATERIALS AND METHODS 31
3.1. Procurement of raw material 31
3.2. Characterization of Pomegranate peel and bagasse powder 31
3.2.1. Proximate analysis 32
3.2.1.1. Moisture content 32
3.2.1.2. Crude protein 32
3.2.1.3. Crude fat 32
3.2.1.4. Crude fiber 32
3.2.1.5. Total ash 32
3.2.1.6. Nitrogen free extract (NFE) 32
3.2.2. Minerals 33
3.2.3. Preparation of antioxidant extracts 33
3.2.4. In vitro studies 33
3.2.4.1. Total phenolic content (TPC) 35
3.2.4.2. Total flavonoid content (TFC) 35
3.2.4.3. Free radical scavenging activity (DPPH assay) 35
3.3. HPLC quantification of Punicalagin 35

3.4. Selection of best treatment 36
3.5. Development of value added/functional drink 36
3.6. Physicochemical analysis of value added/functional drinks 36
3.6.1. Color 37
3.6.2. Total soluble solids 37
3.6.3. pH 37
3.6.4. Total acidity 37
3.6.5. Antioxidant assay 37
3.7. Sensory evaluation 37
3.8. In vivo studies 38
3.8.1. Biological assay 38
3.8.2. Physical parameters 40
3.8.2.1. Feed and drink intake 40
3.8.2.2. Body weight gain 40
3.8.2.3. Serum separation 40
3.8.2.4. Serum lipid profile 41
3.8.2.5. Cholesterol 41
3.8.2.6. High density lipoprotein 41
3.8.2.7. Low density lipoproteins 41
3.8.2.8. Triglycerides 41
3.8.2.9. Serum glucose and insulin levels 41
3.8.2.10. Antioxidant status 41
3.8.2.11. Safety assessment 41
3.8.2.12. Hematological aspects 42
3.9. Statistical Analysis 42
4. RESULTS AND DISCUSSION 43
4.1. Characterization of pomegranate peel and bagasse powder 43
4.1.1. Proximate composition 43
4.1.2. Mineral analysis 46
4.2. Antioxidant potential of pomegranate peel and bagasse extracts 48
4.3. HPLC quantification of Punicalagin 56
4.4. Value added/functional drink analysis 60
4.5. Sensory evaluation 71
4.6. Bio-evaluation trials 77
4.6.1. Feed intake 77
4.6.2. Drink intake 80
4.6.3. Body weight 83
4.6.4. Cholesterol 88
4.6.5. Low density lipoprotein (LDL) 92

4.6.6. High density lipoprotein (HDL) 97
4.6.7. Triglycerides 102
4.6.8. Glucose 106
4.6.9. Insulin 110
4.6.10. Glutathione 114
4.6.11. Thiobarbituric acid reactive substances (TBARS) 118
4.6.12. Liver functioning tests 122
4.6.12.1. Serum aspartate transaminase (AST) 122
4.6.12.2. Serum alanine transaminase (ALT) 122
4.6.12.3. Serum alkaline phosphatase (ALP) 122
4.6.13. Kidney functioning tests 127
4.6.13.1. Serum urea 127
4.6.13.2. Serum creatinine 127
4.6.14. Hematological aspects 130
4.6.14.1. Red blood cells (RBC) 130
4.6.14.2. Hemoglobin (Hb) 131
4.6.14.3. Hematocrit 131
4.6.14.4. Mean corpuscular volume (MCV) 131
4.6.14.5. White blood cells (WBC) 136
4.6.14.6. Neutrophils 136
4.6.14.7. Monocytes 136
4.6.14.8. Lymphocytes 136
4.6.15. Electrolyte balance 137
4.6.15.1. Sodium (Na) 137
4.6.15.2. Potassium (K) 142
4.6.15.3. Calcium (Ca) 142
5. SUMMARY 144
CONCLUSIONS 149
RECOMMENDATIONS 150
LITERATURE CITED 151
APPENDICES 179

i
ACKNOWLEDGEMENTS
I am thankful to ALMIGHTY ALLAH, the promising, the kind and supreme, whose
blessing and glory flourished my thoughts and blossom my dreams, giving me talented
teachers, affectionate parents and unique friends. Trembling lips and wet eyes praise for
HOLY PROPHET MUHAMMAD (P.B.U.H.) for enlightening our ethics with the soul of
faith in ALLAH, converging all His kindness and mercy upon him.
I deem it my utmost pleasure to avail the opportunity to express the heartiest gratitude and
deep sense of obligation to Prof. Dr. Masood Sadiq Butt, Dean, Faculty of Food, Nutrition
and Home Sciences, University of Agriculture, Faisalabad. The work presented in this
manuscript was accomplished under the sympathetic attitude, compassionate behavior,
animate directions, scholarly criticism, and enlightened supervision of Dr. Moazzam Rafiq
Khan, Assistant Professor, National Institute of Food Science and Technology, University of
Agriculture, Faisalabad. With humble, profound and deep sense of devotion I wish to record
my sincere appreciation to Dr. Muhammad Asim Shabbir, Assistant Professor, National
Institute of Food Science and Technology and Dr. Khalil-ur-Rahman, Professor,
Department of Biochemistry, University of Agriculture Faisalabad, for their reliable
comments, dynamic supervision sincere help and inspiring guidance throughout the course of
this research work.
No acknowledgements could ever adequately express my obligations to my affectionate and
adoring parents, brothers and sisters whose hands always rose in prayers for me. I am greatly
thankful and submit my earnest thank to my lovely wife and friends especially Usman
Ashraf, Usama Khalil, Tariq Mehmood, Ismail Khalil, Ubaid-ur-Rahman, Maaz Khalil,
Muneeb Khan, Anas Khalil, Shabbir Ahmed and Muhammad Ilyas as they have
potentially tolerated agony and all miseries and provided me the charming and positive
company throughout the course of study.
May ALLAH bless all these people with long, happy and peaceful lives (Ameen)!

ii
LIST OF TABLES
Sr. No. Title Page
No.
Table 1. Treatments for solvent extraction 34
Table 2. Treatments used for preparation of value added functional drinks 36
Table 3. Studies conducted in efficacy trial 39
Table 4. Diets and functional drink plan 40
Table 5. Proximate composition of different pomegranate peels 44
Table 6. Proximate composition of different pomegranate bagasses 44
Table 7. Mineral profiling of different pomegranate peels (mg/100g) 47
Table 8. Mineral profiling of different pomegranate bagasses (mg/100g) 47
Table 9. Mean squares for antioxidant indices of pomegranate peel extracts 49
Table 10. Mean squares for antioxidant indices of pomegranate bagasse extracts 49
Table 11. Total phenolic contents (mg/g GAE) of peel extracts 50
Table 12. Total flavonoid contents (mg/g RE) of peel extracts 50
Table 13. Free radical scavenging (DPPH %) activity of peel extracts 51
Table 14. Total phenolic contents (mg/g GAE) of bagasse extracts 53
Table 15. Total flavonoid contents (mg/g RE) of bagasse extracts 53
Table 16. Free radical scavenging (DPPH %) activity of bagasse extracts 54
Table 17. Mean squares for HPLC quantification of Punicalagin 57
Table 18. HPLC quantification of Punicalagin in peel extracts (mg/g) 57
Table 19. HPLC quantification of Punicalagin in bagasse extracts (mg/g) 58
Table 20. Mean squares for color tonality of value added drinks 61
Table 21. Effect of treatments and storage on L* value of value added drinks 62
Table 22. Effect of treatments and storage on a* value of value added drinks 62
Table 23. Effect of treatments and storage on b* value of value added drinks 63
Table 24. Effect of treatments and storage on Chroma of value added drinks 63
Table 25. Effect of treatments and storage on hue angle of value added drinks 64
Table 26. Mean squares for acidity, pH and TSS of value added drinks 66

iii
Table 27. Effect of treatments and storage on acidity (%) of value added drinks 66
Table 28. Effect of treatments and storage on pH of value added drinks 67
Table 29. Effect of treatments and storage on TSS of value added drinks 67
Table 30. Mean squares for antioxidant indices of value added drinks 69
Table 31. Mean squares for sensory evaluation of value added drinks 72
Table 32. Effect of treatments and storage on color of value added drinks 73
Table 33. Effect of treatments and storage on flavor of value added drinks 73
Table 34. Effect of treatments and storage on sourness of value added drinks 74
Table 35. Effect of treatments and storage on sweetness of value added drinks 74
Table 36. Effect of treatments and storage on overall acceptability of value added
drinks
75
Table 37. Effect of treatments and study weeks on feed intake (g/rat/day) 78
Table 38. Effect of treatments and study weeks on drink intake (mL/rat/day) 81
Table 39. Effect of treatments and study weeks on body weight (g/rat/week) 84
Table 40. Effect of value added drinks on cholesterol (mg/dL) 89
Table 41. Effect of value added drinks on LDL (mg/dL) 93
Table 42. Effect of value added drinks on HDL (mg/dL) 98
Table 43. Effect of value added drinks on triglycerides (mg/dL) 103
Table 44. Effect of value added drinks on glucose (mg/dL) 107
Table 45. Effect of value added drinks on insulin (µU/mL) 111
Table 46. Effect of value added drinks on serum glutathione (mg/L) 115
Table 47. Effect of value added drinks on serum TBARS (µmol/L) 119
Table 48. Effect of value added drinks on serum AST (IU/L) 123
Table 49. Effect of value added drinks on serum ALT (IU/L) 124
Table 50. Effect of value added drinks on serum ALP (IU/L) 125
Table 51. Effect of value added drinks on serum urea (mg/dL) 128
Table 52. Effect of value added drinks on serum creatinine (mg/dL) 129
Table 53. Effect of value added drinks on red blood cell indices 132
Table 54. Effect of value added drinks on Hemoglobin 133
Table 55. Effect of value added drinks on Hematocrit 134
Table 56. Effect of value added drinks on mean corpuscular volume (MCV) 135

iv
Table 57. Effect of value added drinks on white blood cell indices 138
Table 58. Effect of value added drinks on Neutrophils 139
Table 59. Effect of value added drinks on Monocytes 140
Table 60. Effect of value added drinks on Lymphocytes 141
Table 61. Effect of value added drinks on electrolytes balance 143

v
LIST OF FIGURES
Sr. No. Title Page
No.
Figure 1. Effect of treatments on antioxidant indices of value added drinks 70
Figure 2. Effect of storage on antioxidant indices of value added drinks 70
Figure 3. Feed intake in study I, II and III (g/rat/day) 79
Figure 4. Drink intake in study I, II and III (mL/rat/day) 82
Figure 5. Body weight in study I, II and III (g/rat/week) 85
Figure 6. Percent reduction in body weight as compared to control 87
Figure 7. Percent reduction in cholesterol as compared to control 90
Figure 8. Percent reduction in LDL as compared to control 95
Figure 9. Percent increase in HDL as compared to control 100
Figure 10. Percent reduction in triglycerides as compared to control 104
Figure 11. Percent reduction in glucose levels as compared to control 108
Figure 12. Percent increase in insulin levels as compared to control 112
Figure 13. Percent increase in glutathione levels as compared to control 116
Figure 14. Percent reduction in TBARS levels as compared to control 120

vi
LIST OF APPENDICES
Sr. No. Title Page No.
I Performa for sensory evaluation of value added drinks 179
I-A Composition of value added drinks (1L) 180
II Composition of experimental diets 181
III Composition of salt mixture 182
IV Composition of vitamin mixture 183

vii
ABSTRACT The present investigation was an attempt to explore the nutraceutical potential of pomegranate peel and bagasse extracts based value added/functional drinks against various metabolic syndromes. Three different pomegranate varieties namely Kandhari, Desi and Badana were nutritionally characterized followed by punicalagin quantification, product development and finally the bio-efficacy trial was carried to evaluate health benefits of respective drinks against hypercholesterolemia and diabetes. The nutritional analysis revealed that pomegranate peel and bagasse are a good source of protein, fiber, fat, potassium (K) and calcium (Ca). For the extraction of polyphenols three types of solvent were used i.e. methanol (50%), ethanol (50%) and ethyl acetate (50%). Amongst tested pomegranate peels & bagasses, Kandhari variety demonstrated the highest total phenolic contents (TPC) [259.05±27.40 & 30.67±4.72 mg/g gallic acid equivalent (GAE)], total flavonoid contents (TFC) [53.53±6.14 & 8.86±1.91 mg/g rutin equivalent (RE)] and 2,2-diphenyl-1-picrylhydrazyl [DPPH (70.66±7.44 & 42.30±5.75%)], likewise, maximum TPC (272.68±17.03 & 31.72±4.75 mg/g GAE), TFC (54.90±3.89 & 8.74±2.48 mg/g RE) and DPPH (72.41±5.87 & 43.34±5.97%) were noticed in methanolic extract of all varieties. The pomegranate peels and bagasses of all varieties were quantified by HPLC that depicted 110.59±8.84 mg/g and 1.77±0.41 mg/g of punicalagin, respectively. Afterwards, in product development phase, three types of value added drinks were formulated as drink containing pomegranate peel extract (D1), drink containing bagasse extract (D2) alongside with control (D0) for comparison purpose. The prepared drinks were subjected to physicochemical characterization during two months storage interval. In this milieu, storage intervals and treatments imparted significant effect on color tonality parameters of value added drinks. Moreover, storage interval substantially affected pH and acidity of drinks except for total soluble solids (TSS). Sensory scores of formulated value added drinks decreased with the progression of storage time however, the scores remained within acceptable range throughout the course of study. The efficacy trial was conducted on male Sprague Dawley rats. Accordingly, three types of studies were designed i.e. study I (normal rats), study II (hypercholesterolemic rats) and study III (diabetic rats). Additionally, each study was further divided into three groups G-1, G-2 and G-3 depending on the drinks i.e. D0, D1 and D2 that they were subjected to respectively. The body weights of experimented rats were affected substantially due to the application of value added drinks in all studies. The pomegranate peel extract based drink (D1) resulted in maximum decline in serum cholesterol values during study I, II & III by 3.09, 14.52 & 10.26% likewise a pronounced reduction in LDL and triglyceride levels was evaluated due to utilization of drink D1 (3.75, 14.86 & 11.75% and 3.12, 9.99 & 7.05%) followed by D2 (2.02, 10.74 & 7.72% and 2.89, 5.63 & 4.22%), respectively. Similarly, HDL increases significantly due to administration of value added drinks in study II and III. As far as antidiabetic perspectives are concerned, a substantial decline (p˂0.05) in serum glucose level was observed in study II (7.50 & 5.11%) and study III (13.28 & 8.71%) due to consumption of drink D1 & D2, correspondingly. Nevertheless, a substantial increase in insulin level was documented in D1 (5.66 & 8.74%) and D2 (3.38 & 4.37%) administrated groups during study II & III. Moreover, for the assessment of anti-oxidative markers, glutathione level was enhanced and thiobarbituric acid reactive substances (TBARS) level was reduced by utilization of value added drinks. The results of liver and kidney functioning tests as well as hematological attributes ensured the safety of value added drinks. It is inferred from the present exploration that Kandhari pomegranate peel was more effective as compared to Kandhari bagasse based drinks to mitigate hypercholesterolemia and diabetes.

1
CHAPTER 1
INTRODUCTION
Globally nutritional status has prompted the researchers to develop innovative dietary
approaches to alleviate various metabolic syndromes for optimal health. Nutritional
assortment is the dynamic element of food system converging on balanced nutrition for all-
inclusive outcomes. Fruits and vegetable based functional and nutraceutical foods have
immense potential to endure with the nutritional needs of consumers owing to their native
curative nature against physiological disorders. Thus, the food based bioactive ingredients
are main preferences of various socioeconomic communities due to their significant impact
on health and longevity (Roller et al., 2007; Jenkins et al., 2008).
Phytonutrients are known to be plant derivatives carrying out vital role in upholding human
health, particularly in disease prevention. In past few decades, phytomolecules based
nutraceuticals especially of fruits and vegetables origins are gaining popularity due to
consumer awareness concerning their health promoting potential. Consumption of these
constituents has been correlated by various epidemiological studies with declining the
prevalence of numerous metabolic threats (Engelhard et al., 2006; Kim et al., 2011).
Phytomolecules exhibit potential health benefits by extenuating lifestyle related syndromes
like cancer, diabetes, cardiovascular diseases (CVD), stroke, etc. The proven facts also
provide an insight regarding balanced nutrition and disease prevention. Thus,
functional/nutraceutical foods are obligatory due to their appeasing nature, nutritional
worthiness, imperishability and safe status (Aruoma et al., 2012; Barboza et al., 2012;
Wildman, 2001).
Currently, nutritionists are predominantly focusing on remedial reduction of lifestyle related
metabolic ailments by introducing suitable alteration in the dietary pattern. Functional and
nutraceutical diet has been reported as an effective tool to enhance the therapeutic value of
daily dietary intake. According to the Health Canada, functional and nutraceutical foods
resemble with traditional ones, however, provide some additional health benefits. Thereby,
provision of such bioactive moieties is one of the prime benefits of fruits and vegetable
consumption (Henson et al., 2008; Shahidi, 2009).

2
Fruits and vegetable processing industry produce million tons of agro-industrial by-products
annually, causing not only disposal problems but also aggravating environmental pollution.
Thus, for friendly ecosystem their proper, inexpensive and efficient disposal is one of the
fundamental prerequisites. Agro-industrial wastes particularly fruit/vegetable peels and
bagasses are concentrated source of phytomolecules that have attained principal attention of
the researches for their extraction and maximum recovery (Li et al., 2006; Pinelo et al.,
2006).
Pomegranate (Punica granatum L.) is known to be Paradise fruit due to its therapeutic
potential and promising nutraceutical aspects. It is tropical fruit native to Iran and also
cultivated in Pakistan, Arizona, Afghanistan, India and California. In 2010-11, area under
cultivation for pomegranate production in Pakistan was 12,900 hectares, yielding an annual
production of about 50,000 tons (GOP, 2011). Owing to its functional attributes, it provides
great health benefits to human beings (Martínez et al., 2006). Pomegranate mainly consists of
50% inedible (peel) and 50% edible portion. The edible portion comprises of 10% seeds and
40% arils. Approximately, 10 million tons of raw pomegranate fruit is required to produce 1
million tons of concentrated pomegranate juice having 65oBrix (Viuda-Martos et al., 2011).
The arils are rich source of vitamins, proteins, minerals, sugars, crude fiber, pectin and
polyphenols (Viuda-Martos et al., 2010). Major classes of phyto-chemicals present in
pomegranate peel having prospective health benefits mainly include tannins, flavonoids and
alkaloids. This broad range of natural compounds appears to have multiple biological
functions, ranging from antioxidant to anticancer. There is an increasing interest in the use of
plant derived bioactive molecules for therapeutic purpose (Viuda-Martos et al., 2012).
Natural antioxidants present in the physiological system of the body are divided into non-
enzymatic and enzymatic groups that deal with the production of free radicals. Enzymatic
antioxidants include catalase, superoxide dismutase and glutathione peroxidase, whereas,
non-enzymatic antioxidants consists of selenium, β-carotene, vitamin E and vitamin C (Rojas
and Brewer, 2007). The scavenging ability of pomegranate peel polyphenols is due to their
molecular structure and degree of hydroxylation (Huang et al., 2005; Moure et al., 2001).
Pomegranate peel extracts exhibit significantly higher amount of ferric reducing antioxidant

3
power ranging as 225.17 to 705.50 mmol/g and free radical scavenging activity up to 81%
(Akbarpour et al., 2009).
Bioactive constituents play significant role by scavenging oxygen, interfering with the
oxidation process and chelating catalytic metals in biological systems (Kim, 2005).
Prophylactic effects of pomegranate peel based phytonutrients like gallic acids, flavonoids,
anthocyanidins, punicalagin, punicalin, kaempferol, luteolin and quercetin are due to their
antioxidant properties (Middha et al., 2013a). The total phenolics of pomegranate peel are
higher than arils due to occurance of ellagitannins (ET), ellagic acid (EA) and ellagic acid
glycosides (Amakura et al., 2000).
Hypercholesterolemia also known as dyslipidemia is a state having elevated level of serum
cholesterol particularly total lipids (TL) and low density lipoproteins (LDL). Inappropriate
nutritional practices comprising of diet having elevated concentrations of saturated fats and
cholesterol have adversely affected consumer health. The resultant changes alter serum
concentrations of triglycerides (TG), high density lipoproteins (HDL), low density
lipoprotein (LDL) and total cholesterol (TC). Therefore, these parameters are used as
diagnostic tool to measure the amplitude of depreciation. Increased level of blood LDL and
decreased HDL during hypercholesterolemic conditions eventually result in induction of
inflammation, widening of vascular lesions and atherosclerosis (Nouri and Rezapour, 2011).
Numerous clinical trials have demonstrated LDL reduction by administration of pomegranate
polyphenolic extracts. Punicalagin has ability to protect body from atherosclerosis by
inhibiting foam cell formation (Alissa and Fens, 2012). In an experimental trial, diet induced
hypercholesterolemic male Sprague Dawley (SD) rats were fed on pomegranate peel
polyphenols at different concentrations for 28 days. The resultant data revealed that
hypercholesterolemic diet alone showed significant increase in low density lipoproteins
(LDL) and serum cholesterol. In contrary, diet containing pomegranate peel polyphenols
elucidated the effect of hypercholesterolemia by significantly lowering serum LDL and
hepatic lipids (Althunibat et al., 2010).
Hyperglycemia is a condition that eventuates quite before the outset of diabetes mellitus.
Chronic conditions result in vascular, retinal, neuropathic and renal complications. Thus,
early diagnosis is indispensable to halt diabetes pathogenesis at early phases as delay can

4
result in organ damage (Markovits et al., 2009; Ozmutlu et al., 2012). Diabetes mellitus
(DM), commonly known as diabetes is a metabolic disease emerging rapidly as a result of
changing eating habits and mechanized lifestyle. For induction of diabetes numerous
methods are being practiced nowadays, nevertheless streptozotocin (STZ) injections are one
of the most appropriate option (Akbarzadeh et al., 2007), resulting rapid decreased
concentration of insulin after STZ-induced β–cell destruction coupled with rise in blood
glucose level (Cooper, 2011).
During the state of hyperglycemia, antioxidant level of blood serum is low enough so
consequently supplementation is an effective strategy to combat the menace. Pomegranate
contributes appreciable amount of bioactive ingredients that have the ability to alleviate
glucose concentration in diabetic individuals (Khalil, 2004). It has tendency to raise the β-
secretion cells alongside improves antioxidant status with affirmative effect on antioxidant
enzymes activity i.e. catalase, superoxide dismutase, glutathione peroxidase, glutathione-S-
transferase and glutathione reductase, in liver and kidney (Parmar and Kar, 2007). In a rat
modeling, Althunibat et al. (2010) explored the association of pomegranate peel (PP) extracts
intake and diabetes management. They subjected streptozotocin (STZ) induced rats to PP
extracts @ 10-20 mg/kg BW/day for 4 weeks and reported significant increased effect on
antioxidant enzymes in red blood cells (RBC), kidney and liver.
Hepatic enzymes like aspartate amino transferase (AST) and alanine amino transferase
(ALT) are higher in oxidative stress and diabetes state leading to lower hepatic efficiency
(Van Dam et al., 2002). Its polyphenols have higher potential as antioxidant by boosting free
radical scavenging activity of hepatic enzymes catalase and superoxide dismutase and
resulted in 54% decrease in lipid peroxidation. Pomegranate peel antioxidants prevent the
cell injury to the liver. Moreover, pomegranate peel and seed extract polyphenols have
cytoprotective effect in in vivo animal studies in which liver fibrosis injury was induced by
carbon tetrachloride CCl4 or hydrogen peroxide (Singh et al., 2002; Toklu et al., 2007).
Several methods are applied for the extraction of pomegranate peel and bagasse extracts
however, solvent extraction using water, ethanol, methanol, acetone and hexane are generally
in practice (Singh et al., 2002). Earlier, spectrophotometric methods were applied for
estimation of pomegranate polyphenols in various products. However, HPLC (high

5
performance liquid chromatography) is a promising technique for polyphenol quantification
i.e. punicalagin (Lu et al., 2011).
In developing economies, malnutrition due to inadequate supply of allied and nutritious diet
is one of the eminent challenges to cope up with various lifestyle related discrepancies. In
Pakistan, health related metabolic disorders including dyslipidemia, diabetes and oxidative
stress have prompted researchers to develop effectual diet based strategies to combat these
existing maladies. Considering the facts, present research project was designed to
characterize indigenously grown pomegranate with special reference to its waste including
both peel and bagasse (dried fibrous part remaining after juice extraction of arils), obtained
as co-products of juice extraction. In the instant exploration, pomegranate peel and bagasse
extracts were carried out for their application as nutraceutical/functional ingredient in food
system. Both extracts were characterized for their antioxidative potential followed by value
added drink development. Accordingly, the animal experimental modeling for the assessment
of prophylactic impact of developed value added drinks against hypercholesterolemia and
diabetes was the limelight of the investigation.
The objectives set to be achieved are herein;
1. Optimization of extraction efficiency of pomegranate waste (peel and bagasse) using
different solvents
2. Comparison of chemical composition and antioxidant potential of pomegranate
wastes
3. Exploring the health benefits of functional drinks prepared from peel and bagasse
extracts

6
CHAPTER 2
REVIEW OF LITERATURE
Innovative health care approaches around the globe have illumined functional and
nutraceutical foods among auspicious therapeutic tools to attenuate various lifestyle related
metabolic syndromes. Plants containing cache of phyto-promising nutrients are considered to
be imperative for the welfare and prosperity of targeted population since ancient times.
Health boosting abilities of plant derived biomolecules have provoked the evolution of value
added foods to combat various ailments. According to the current nutritional guidelines, diet
and health relationship has determined human beings to prefer diet having supplementary
health benefits beside basic nutrition. Sedentary and mechanized lifestyle is narrowing the
gap regarding food selection however; phytochemical moieties are helpful to bridge the
trench (Shahidi, 2009). Subsequently, fruits derived nutraceuticals are of substantial
significance to curb various lifestyle related disorders thru distinctive pathways (Hasler,
2000). In this context, pomegranate peel and bagasse extracts are phytonutrient dense sources
attaining attention of scientists due to a potent antioxidant i.e. punicalagin. Various bio-
efficacy trials have illustrated the potency of pomegranate peel and bagasse extracts against
oxidative stress, hypercholesterolemia, hyperglycemia and different oncogenic events.
Keeping in view the facts, present investigation was an attempt to assess the therapeutic
prospective of pomegranate fruit waste extracts of different indigenously grown varieties
against selected ailments. A comprehensive debate about various aspects of the instant
research has been reviewed herein.
2.1. Concept of functional and nutraceutical foods
2.2. Nutritional profiling of pomegranate peel and bagasse
2.3. Punicalagin: a potent nutraceutical component
2.4. Extraction and quantification of pomegranate polyphenols
2.5. Bioactivity, bioavailability and metabolism
2.6. Pomegranate polyphenols against metabolic syndromes
2.6.1. Oxidative stress related complications
2.6.2. Hypercholesterolemia and renal dysfunction
2.6.3. Diabetes and insulin malfunctioning

7
2.1. Concept of functional and nutraceutical foods
During the last few decades, the consumer attention has swung towards the use of natural
products due to their health promoting potential. Among innumerable bioactive moieties,
polyphenolic complexes have achieved the utmost position. Different fruits and vegetables
are a concentrated source of these secondary plant metabolites (Butt and Sultan, 2009).
Various techniques are in practice for the extraction of bioactive molecules including heat
reflux, microwave & ultrasound assisted extraction and soxhlet extraction method (Xiao et
al., 2008). These nutraceutical and functional constituents are indispensable for the vitality of
life as they safeguard against proliferation of many diseases. Health escalating prospective
allied with the utilization of fruits and vegetables encouraged the scientists for the
documentation, extraction, isolation and purification of their associated bioactive
components (Wauthoz et al., 2007).
Nutrition is the core element for optimal health to mitigate various physiological disorders
during different stages of life from childhood to elderly age. The health and nutrition
paradigm has significantly modified during the last few decades. Nowadays, food is not
merely considered as a vehicle to supply nutrients for proper body functioning but also a
source to maintain good health. Thus, core attention has been paid to illuminate the
therapeutic role of the diet. This has set the ideology of functional and nutraceuticals as the
food that exerts beneficial effects beyond nutrition thereby reducing various ailments
(Henson et al., 2008).
In developing economics, functional/nutraceutical food have emergent market due to
increased consumer awareness regarding diet health interaction and high medication cost
during disease. The concept of functional food was introduced in Japan during mid-80’s and
referred as food that provides additional physiological benefits beyond basic body needs thus
called as Food for Special Health Use (FSHU). To date, about 270 food products have
attained the status of functional foods in Japan (Rajasekaran and Kalaivini, 2011; Serafini et
al., 2012). Numerous terms are interchangeably used to describe the linkages of disease
mitigation and health promotion with reference to specific food ingredients. Earlier, the US
foundation for innovation in medicine introduced the concept of nutraceuticals in 1989 as

8
any food or part of it that provides health benefits including disease prevention (Alissa and
Ferns, 2012).
Phyto-remedies have been in practice since centuries and becoming popular in the recent era
too due to their natural origin and safe status. Considering the importance, nutritionists are
gradually focusing their attention to explore the phytochemicals for health enhancement.
Plants contain certain bioactive substances endowed with potent antioxidative properties.
Phytochemicals are abundantly present in plant based food even responsible for their distinct
color and flavor. Various fruits and vegetables have innate therapeutic worth due to the
presence of bioactive constituents like minerals, fiber, pectic substances, polyunsaturated
fatty acids, essential amino acids, antioxidants (polyphenols, sulfur compounds, resveratrol),
phytoncides (natural antibiotics) and vitamins (Basu et al., 2007; American Dietetic
Association, 2009).
Numerous plant sources have been tested for their antioxidative ability against several
metabolic disorders. This can be exemplified by Alliaceace vegetables like garlic, onion,
parsnip etc. That enhances the glutathione redox cycle and active immune system due to
sulfur containing organic compounds. These are considered active as antioxidant, anti-
carcinogenic, antibacterial and immuno-stimulating alongside showing potential against
hypercholesterolemia and hyperglycemia. Similarly, anthocyanin of black grapes and from
other red or violet fruits is in practice for prophylaxis of various diseases. Flavonoids are the
phytochemicals from citrus fruit, tea and grapes showing anti-inflammatory action and
strengthen the body against various allergies, viral attacks and tumor-including factors (Yi et
al., 2005; Hwang et al., 2012).
Epidemiological studies have encouraged the use of functional foods and nutraceuticals to
ameliorate various physiological dysfunctions owing to their prophylactic role. Several
health associated problems including obesity and dyslipidemia can be addressed by proper
diet planning. Moreover, cardiovascular complications, degenerative diseases, aging and
various oncological events may be prevented by consuming ample amount of fruits due to the
presence of lycopene, tocopherols, L-ascorbic acid and tannins. Significant evidences have
correlated the consumption of apples, grapes, blackberries, broccoli, pomegranates, carrots
etc. with their hypoglycemic, hypotensive, diuretic, anti-atherosclerotic effects and work

9
against stomach ulcers and kidney dysfunctions (Betoret et al., 2011). Besides fruits and
vegetables based beverages are imperative due to the presence of carotenoids, vitamin C,
phenolics as well as other bioactive constituents (Beceanu, 2008). Currently, nutraceutical
beverages are one of the fast growing markets. Novel technologies are in practice for the
identification and isolation of various components of interest to be utilized in the beverage
industry.
Fruits and vegetables processing industries liberate massive quantity of organic waste
materials on annual basis. Various environmental problems like polluted water, production of
unpleasant odors and increased microbial load are directly associated with these industrial
generated byproducts (Zamorano et al., 2007). Nonetheless, these agro-wastes contains
abundant amount of biologically active components that have increased the attention of
scientific investigators for their effectual recovery, recycling and upgradation to convert them
into more profitable and valuable products. Amongst different fruit parts seed, peel, hull and
stone are considered to be rich source of bioactive constituents thus exhibiting substantial
antioxidant activities (Soong and Barlow, 2004; Peschel et al., 2007). Though, peels of
different fruits have gained special attention owing to the existence of nutraceutical
polyphenols having efficient recovery (Negro et al., 2003).
Pomegranate (Punica granatum L.) is an indigenous tree of Mediterranean region. It is found
all over the world in warm climates including areas of the Mediterranean, South East Asia,
and America. Functional food development through enrichment with pomegranate peel
active compounds could be beneficial for curing some diseases like diabetes mellitus. In
addition, consumers all over the world have more concern about the association between
dietary habits and risk for diseases, such as cardiovascular, obesity and gastrointestinal
(Espín et al., 2007b).
The antioxidant activity of pomegranate peel has been reported to be ten times more
powerful as compared to pomegranate pulp. Moreover, flavonoids and proanthocyanidins
have also been reported to be in higher amounts in peel as compared to pulp (Li et al., 2006).
Recently, Altunkaya et al. (2013) reported the effect of pomegranate peel powder (PP), a by-
product of the pomegranate juice industry addition in bread production, due to its potential
health effects. Addition of pomegranate peel powder at different percentages (0 to 10%) to

10
wheat bread enhanced the sensory quality and total antioxidant capacity of bread i.e. 1.8 to
6.8 µmol TEAC per g bread for fresh bread.
Pomegranate bagasse which is obtained as co-product of juice extraction has been reported to
be a potential antioxidant, containing high fiber contents. These fibers are of paramount
importance these days mainly because of their physiological effects on the human being.
Juice bagasse was obtained using various methods including arils and peels method and only
arils method. Pomegranate juice (PJ), arils bagasse (AB) and whole fruit bagasse (WFB) was
used in wheat flour to get value added bread. Variable results were obtained when content &
physical parameters, dietary fiber contents and instrumental analysis were performed (Bhol
and Bosco, 2013).
During storage of value added ready to serve (RTS) drinks; total soluble solids, pH and
acidity are the noteworthy parameters to assess the overall acceptability. In general, acidity
of ready to serve drink enhances during storage whereas, pH reduces whilst concentration of
total soluble solids (TSS) depends upon the nature and amount of sugar present in juice.
Recently a researcher group Ahmed et al. (2008) explicated the influence of storage intervals
on TSS, acidity and pH of green tea based value added drinks. They noticed a significant
increase in acidity with substantial decrease in pH of prepared green tea drink. Nevertheless,
storage interval imparted non-momentous effect on TSS of prepared value added drinks. The
pH of green tea based drink reduced from 4.7 to 4.2 during sixty days storage study.
Similarly, 11% decline was observed in antioxidant potential. On contrary, Hassan et al.
(2007) illustrated an elevation in pH and reduction in acidity of ready to drink juice during
storage study. They were of the view that elevated pH and decline in acidity is mainly due to
ascorbic acid and citric acid breakdown with the passage of time.
Hedonic response is a vital marker useful in determining the overall suitability and quality of
the end product based on evaluation from experienced taste panelists. Sensory assessment of
a product is a renowned procedure to depict the product characteristics based on five senses
including sight, taste, touch, smell etc. performed by qualified personals (Kuti et al., 2004).
Sensory assessments of a food commodity are directly linked with end user awareness,
approach and believe. Color is also considered as one of the prime parameters perceived by
the consumer and plays a key role in product acceptance. According to color evaluations, L*

11
presents brightness and a* reflects redness, however b* values are representative of
yellowness. In an experimental trial by Orak et al. (2012), different genotypes were
examined for color measurements in different parts of fruit. They recorded a* value of peel
between 0.68 and 9.81, the b* value was evaluated between 17.02 and 25.32. Whereas in
case of fruit juice, a* value ranged from 23.73 to 27.94 and, the b* values were from 4.72 to
10.45. Accordingly, in seed, the range of a* value was documented from 7.26 to 12.75, and
values of b* changed from 1.79 to 4.64. Likewise, L* values, an indicator of brightness was
reported to be highest in peel followed by seed and lowest in juice of different pomegranates.
The product containing phytomolecules requires careful evaluation not only to appraise end
user response but also to find its impact on particular population (Aaron et al., 1994; Gylling
et al., 1999; Quílez et al., 2006). Keeping this in mind, nutritionists working on production of
value added food products are not only highlighting their functionality but have also paid full
attention concerning their sensory characteristics.
Reactive oxygen species (ROS) such as peroxides are produced due to utilization of
metabolic oxygen which initiates various oncogenic events and lifestyle related syndromes.
In this perspective, pomegranate peel and bagasse terminates the onset and progression of
oxidative stress by scavenging free radicals (Gorinstein et al., 2009).
2.2. Nutritional profiling of pomegranate peel and bagasse
Fruit by-products are the core objects that must be explored as potent nutraceuticals due to
presence of an array of phytonutrients. In this context, pomegranate peel and bagasse both
have enormous antioxidant potential therefore are helpful in improving health status. During
processing of pomegranate, byproduct obtained usually comprises of peel and bagasse.
Pomegranate bagasse is obtained as co-product of juice extraction and has been reported to
be a potential antioxidant, containing high fiber contents (Bhol and Bosco, 2013; Kushwaha
et al., 2013). Whole pomegranate fruit comprises of 50% edible portion and remaining 50%
inedible. Edible portion comprises 80% of water laden portion known as arils and remaining
20% are seeds. Arils consist of water (85%), total sugars (10%), primarily glucose and
fructose, and pectin (1.5%), organic acids like malic, ascorbic and citric acid, and different
bioactive molecules like polyphenols and anthocyanins (Viuda-Martos et al., 2010).
12
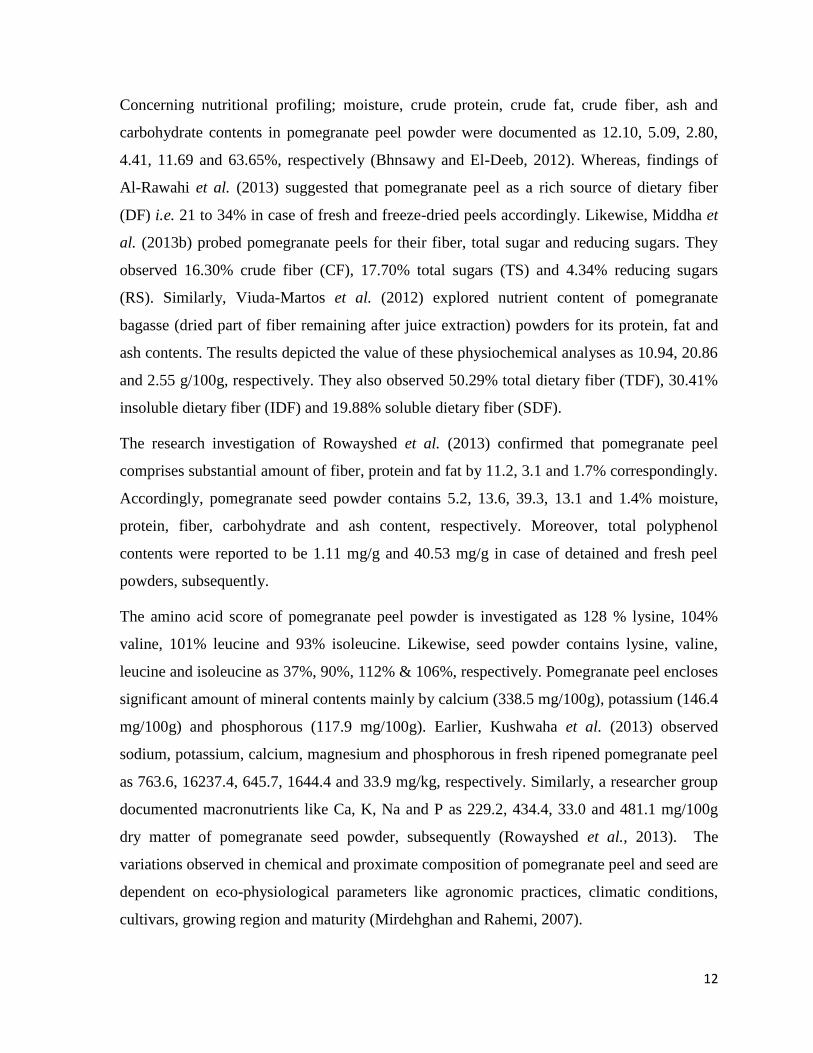
Concerning nutritional profiling; moisture, crude protein, crude fat, crude fiber, ash and
carbohydrate contents in pomegranate peel powder were documented as 12.10, 5.09, 2.80,
4.41, 11.69 and 63.65%, respectively (Bhnsawy and El-Deeb, 2012). Whereas, findings of
Al-Rawahi et al. (2013) suggested that pomegranate peel as a rich source of dietary fiber
(DF) i.e. 21 to 34% in case of fresh and freeze-dried peels accordingly. Likewise, Middha et
al. (2013b) probed pomegranate peels for their fiber, total sugar and reducing sugars. They
observed 16.30% crude fiber (CF), 17.70% total sugars (TS) and 4.34% reducing sugars
(RS). Similarly, Viuda-Martos et al. (2012) explored nutrient content of pomegranate
bagasse (dried part of fiber remaining after juice extraction) powders for its protein, fat and
ash contents. The results depicted the value of these physiochemical analyses as 10.94, 20.86
and 2.55 g/100g, respectively. They also observed 50.29% total dietary fiber (TDF), 30.41%
insoluble dietary fiber (IDF) and 19.88% soluble dietary fiber (SDF).
The research investigation of Rowayshed et al. (2013) confirmed that pomegranate peel
comprises substantial amount of fiber, protein and fat by 11.2, 3.1 and 1.7% correspondingly.
Accordingly, pomegranate seed powder contains 5.2, 13.6, 39.3, 13.1 and 1.4% moisture,
protein, fiber, carbohydrate and ash content, respectively. Moreover, total polyphenol
contents were reported to be 1.11 mg/g and 40.53 mg/g in case of detained and fresh peel
powders, subsequently.
The amino acid score of pomegranate peel powder is investigated as 128 % lysine, 104%
valine, 101% leucine and 93% isoleucine. Likewise, seed powder contains lysine, valine,
leucine and isoleucine as 37%, 90%, 112% & 106%, respectively. Pomegranate peel encloses
significant amount of mineral contents mainly by calcium (338.5 mg/100g), potassium (146.4
mg/100g) and phosphorous (117.9 mg/100g). Earlier, Kushwaha et al. (2013) observed
sodium, potassium, calcium, magnesium and phosphorous in fresh ripened pomegranate peel
as 763.6, 16237.4, 645.7, 1644.4 and 33.9 mg/kg, respectively. Similarly, a researcher group
documented macronutrients like Ca, K, Na and P as 229.2, 434.4, 33.0 and 481.1 mg/100g
dry matter of pomegranate seed powder, subsequently (Rowayshed et al., 2013). The
variations observed in chemical and proximate composition of pomegranate peel and seed are
dependent on eco-physiological parameters like agronomic practices, climatic conditions,
cultivars, growing region and maturity (Mirdehghan and Rahemi, 2007).

13
2.3. Punicalagin: a potent nutraceutical component
Consuming a diet rich in phytonutrients can lead to reduction in the risk of cancer and may
be beneficial in eradicating cancer. Since ancient times, pomegranate has been known for its
herbal and medicinal aspects. Extensive research on phenolics from pomegranate extracts has
been reported to show anti-mutagenic potential. In a clinical research anti-mutagenic and
anti-proliferative potential of punicalagin (PC) and ellagic acid (EA) against benzo[a]pyrene
(BP) induced DNA damage was documented. Accordingly, rat liver microsomes were
incubated with BP, DNA and suitable cofactors in the presence of punicalagin and ellagic
acid at a concentration of 40 μM each, resulted in substantial inhibition of DNA adducts;
with 97% complete inhibition by PC and 77% by EA. Similarly, punicalagin and ellagic acid
both resulted in anti-proliferative effect on human lung cancer cells at all tested dosses
ranging from 50-500 μM (Zahin et al., 2014).
Pomegranates have been reported to have 124 different types of polyphenolic
phytochemicals moieties, out of which few play important role in exerting antioxidant, anti-
cancer and anti-inflammatory potential. Pomegranate ellagitannin, punicalagin is not directly
absorbed into blood stream, but in intestines they are hydrolyzed to EA (ellagic acid). They
are catabolized into urolithins by gut flora, which are conjugated in the liver and finally
excreted by urine. The most persuasive antioxidants are urolithins-C and D having IC50
values of 0.16 & 0.33 μM, correspondingly, as compared to punicalagin and ellagic acid
having IC50 values of 1.4 and 1.1 μM, respectively (Bialonska et al., 2009; Seeram et al.,
2007).
Punicalagin (PC) usually known as pomegranate ellagitannin, a hydrolysable tannin
compound that are isomers of 2, 3-(S)-hexahydroxydiphenoyl-4, 6-(S,S)-gallagyl-D-glucose,
having molecular weight of 1084.71 g/mol. It is present in forms of alpha/beta (α/β) isomers
in pomegranates (Punica granatum), bengal almond (Terminalia catappa) and the velvet
bushwillow (Combretum molle). Pomegranate peel and juice are rich source of punicalagin
however, also been documented to be present in different parts like bark, pulp, seeds, pith
and capillary membranes (Kulkarni et al., 2004; Marzouk et al., 2002). Punicalagin have
high bioavailability and are water soluble, known to hydrolyze into smaller polyphenols such
as ellagic acid. Punicalin, another pharmacologically active flavonoid, along with

14
punicalagin are regarded as unique antioxidants due to their mode of action and
diversification. They exhibit wide range of nutraceutical effects like anti-inflammatory,
antioxidant, anti-neoplastic, anti-cancer and anti-atherosclerotic alongside immuno-
modulatory perspectives (Asres et al., 2001; Akbarpour et al., 2009; Viuda-Martos et al.,
2010).
Recently, results from studies on humans, cells, rats, mice and rabbits have clearly pointed
out the importance of mentioned pomegranate polyphenol i.e. punicalagin and punicalin
metabolites as markers on in vitro inhibition of prostate cancer cells. Group of scientists has
also reported the use of pomegranate fruit extracts and its isolated ellagitannins resulted in
inhibition of proliferating human cancer (HT-29) cells and curbed apoptosis and
inflammatory subcellular organisms signaling pathways (Adams et al., 2006; Afaq et al.,
2005a; Seeram et al., 2005).
Based on the observations by Malik et al. (2005) it can be concluded that pomegranate fruit
extracts (PFE’s 0.1% and 0.2% wt/vol) repressed prostate cancer proliferation in athymic
nude mice (ANM). This anticancer potential of pomegranate extracts is due to high
concentration of anthocyanins present in different parts of pomegranate fruit including peel
and seeds. Indeed anthocyanins do contribute in total antioxidant status of pomegranate; it is
improbable that anthocyanins are responsible for antioxidant potential of pomegranate
extracts. As a matter of fact, pomegranate peel and bagasse extracts containing pomegranate
ellagitannins (PE) lacking anthocyanins have been reported to possess in-vitro and in-vivo
anti-carcinogenic potential, along with induction of apoptosis and cell-cycle arrest
(Castonguay et al., 1997).
Cancer and inflammation has been found to be strongly interlinked. In point of fact, it has
been revealed that inflammation is indication of numerous types of cancer likewise breast,
prostate, colon, etc. Occasionally inflammation outranks, and sometimes it results in tumor
cell propagation. Pomegranate as whole or different specific parts has reported to
demonstrate strong antioxidant potential, so its intake may justify its beneficial effect in
prevention of several metabolic ailments, including inflammation and cancer. Undoubtedly,
the propagated inflammatory deterioration may be an outrider and harbinger to prostate
cancer and PIN (Prostatic Intraepithelial Neoplasia) (De Marzo et al., 2003; Lansky and

15
Newman, 2007). At the time of prostatectomy, inflammatory cells and nuclear factor (NF-
κB) heterodimers expression is significantly increased in prostate tissues. In fact, propagation
of NF-κB is considered to be a risk factor for prostate cancer occurrence, resulting in
prostatectomy. Likewise, stimulation of NF-κB also triggers various downstream genes,
including COX-2 (cyclooxygenase-2). COX-2 is investigated to be the vital enzyme in
regulating the production of prostaglandins, the chief intermediaries of chronic inflammation
(Fradet et al., 2004). Pomegranate whole fruit and different fractions including peel and
bagasse, possesses versatile effects: i) it suppresses cyclooxygenase (COX-2)
stimulation/activation and accordingly prostaglandins formation, ii) it inhibit inflammatory
cytokine regulation and iii) it inhibits matrix metalloproteinases-1 (Adams et al., 2006;
Aslam et al., 2006; Lansky and Newman, 2007; Okamoto et al., 2004; Shukla et al., 2008a).
Dietary phytonutrients and their impact on vulnerability to different type of cancers are far
and wide accepted now a day. In accordance to that, nutritionists have documented the
influence of consumption of pomegranate as whole or different fractions on metabolic
activity of CY-P450 (cytochromes P450 enzymes), as a probable mechanism to its anti-
tumoral potential (Faria et al., 2007a). Their findings revealed that pomegranate juice (PJ)
consumption substantially reduced total hepatic cytochrome P450 enzymes (CYP) along with
the expression of CYP3A and CYP1A2. Therefore, retardation of pro-carcinogens by CYP-
450 stimulation inhibition is mainly involved in PJ (pomegranate juice) protection against
tumor propagation and progression (Patterson and Murray, 2002).
Different studies have verified the effect of pomegranate fruit fractions including juice, peel
and seed oil, on modulation in cell cycle technology through cell signaling molecules (Shukla
and Gupta, 2004). From various experimental reports, pomegranate polyphenols
substantively affect the enzymes most likely to be the reason for their anti-cancer activity.
Among these, carbonic anhydrase (CA) and ornithine decarboxylase (OD) enzymes
potentially inhibit cancer cell growths in vivo and in vitro studies. Pomegranate peel extract
(PPE) and fermented pomegranate juice (FPJ) inhibits aromatase also known to be estrogen
synthetase/synthase, a member of cytochrome P450 superfamily & 17-β-hydroxysteroid
dehydrogenase type-1, responsible for conversion of estrone to 17-β-estradiol, a more
potentially estrogenic compound (Afaq et al., 2005b; Hora et al., 2003; Pastorekova et al.,
2004; Satomi et al., 1993). In addition to this, some pomegranate polyphenolic components

16
are reported to have estrogenic activity, therefore suppressing the estrogenic potential of 17-
β-estradiol by binding them to estrogen receptors (Kim et al., 2002).
Anti-arthritic potential of pomegranate phenolic extracts has been documented in animal
models to a limited degree. Accordingly, Shukla et al. (2008b) reported significant reduction
of Rheumatoid arthritis (RA) in collagen induced male mice model. They orally
administrated extract to mice via drinking water and also concluded delayed onset of arthritis
and suppression of inflammatory cytokine inerleukin-6 (IL-6) in joints of mice model.
Likewise, oral administration of pomegranate juice (4-20 mL/kg B.W.) for two weeks
resulted in prevention of chondrocyte impairment in MIA-induced (mono-iodoacetate)
osteoarthritic mice model (Hadipour-Jahromy and Mozaffari-Kermani, 2010). Similarly, in
another study human osteoarthritis (OA) chondrocyte samples pretreated with pomegranate
fruit extract resulted inhibition of IL-1β induced cytotoxicity, whereas, reduction in
proteoglycan suggested inhibition of cartilage damage (Ahmed et al., 2005).
Exploration of pomegranate fractions against cardiovascular diseases (CVD) has been
principally focused on the anticipation of atherosclerosis and prevention of dyslipidemia in
diabetic personals. Purposely, numerous human studies have been performed; most of these
have revealed significant potential of pomegranate extracts on cardiovascular health (CVH)
relating to cholesterol, intima media widening, blood pressure and endothelial function. An
experimental trial revealed that consumption of pomegranate juice (PJ) by hypertensive
patients constrains serum angiotensin converting enzyme (SACE) and decreases systolic
(maximum) blood pressure. For this purpose, 10 hypertensive patients, 3 women and 7 men
having ages between 62 to 77 were subjected to 50 mL of pomegranate juice (comprising 1.5
mmol total polyphenols) on daily basis for two consecutive weeks. Among these ten subjects,
two were suffering from diabetes and two were hypercholesterolemic. Results showed thirty
six percent decrease in SACE activity and significant lowering (5%) of systolic blood
pressure in seven out of 10 subjects (Aviram and Dornfeld, 2001). Accordingly, consumption
of 50 mL/day PJ (pomegranate juice) for two weeks suggested that serum plasma of 13
healthy young men (non-smokers) had significant high antioxidant activity, reduced lipid
peroxides value and augmented resistance of high-density lipoprotein (HDL) oxidation.
Same report confirmed that PJ ingestion to apolipoprotein E-deficent (apoE-/-) mouse model

17
diminished the quantity of foam cells and size of atherosclerotic lesions by 44% (Aviram et
al., 2000).
2.4. Extraction and quantification of pomegranate polyphenols
In recovering and purification of phytonutrients from fruit byproducts, extraction is a vital
step. Numerous methods are being practiced nowadays for the extraction of biochemical
molecules; solvent extraction is a well renowned experimental technique owing to its low
cost, easy handling, high recovery and better control. Amongst various solvents, ethyl
acetate, ethanol, n-hexane, acetone and methanol are most often used for the recovery of
antioxidative extract from pomegranate peel and bagasse (Singh et al., 2002). The extraction
of polyphenolic compounds is influenced by several factors like sample preparation, type of
solvent, extraction time, agitation (rpm), temperature, particle size, solute to solvent ratio and
efficiency of mass transfer (Haminiuk et al., 2011; Yang et al., 2011; Zhao et al., 2011). In
this reference, drying and freezing procedures are frequently used to safeguard fruit
commodity against microbial attack and deterioration along with enhancement in antioxidant
perspectives (Türkben et al., 2010).
2.5. Bioactivity, bioavailability and metabolism
Comprehensively, nutritionists have concentrated their focus on discovery of fruits and
vegetables based phytomolecules having higher antioxidant properties. In recent times,
interest of nutritionists and dietitians are increasing regarding the therapeutic worth &
pharmacokinetics aspects of biologically active molecules after their consumption. Food
commodities containing abundant amount of phytogenic compounds impart numerous health
associated benefits, generally due to presence of bioactive compounds available to the body
(Palafox-Carlos et al., 2011). The uptake of polyphenolic molecules in human body occurs
largely through passive diffusion in membrane of gut epithelial cells. During metabolism, a
huge quantity of these biologically active moieties infiltrates into the gut wall due to their
hydrophilic nature. Health enhancing potential of pomegranate polyphenols is fore mostly
due to their bioavailability and metabolic fate that principally depends on degree of expulsion
from food matrix, dietary sources, efficiency of transepithelial channel and digestive
immovability (Manach et al., 2005; Rodrigo et al., 2011).

18
Pomegranate phenolics are not equally distributed in pulp, peel, juice, and seed portion;
resulting in uneven absorption within the body. There are many diverse reasons like
biochemical structure and interaction with different carbohydrate polymers that can affect the
bioavailability of pomegranate peel & bagasse phytochemicals to different body parts
(Palafox-Carlos et al., 2011). Subsequently, the interaction of these active molecules with
fiber portion can lower their absorption through small intestines nevertheless; minimizing the
interaction among polysaccharides and polyphenols can improve their availability to various
organs. Pomegranate punicalagins are entrapped within food matrix that interacts with
different enzymes and protein. Similarly, numerous phenolics from different parts of
pomegranate like peel, juice and bagasse are potentially available to body by the action of
various enzymes & colon gut flora (D’Archivio et al., 2010; Parada and Aguilera, 2007).
Ellagitannins (ETs) are a diverse family of hydrolysable tannins, a class of bioactive
polyphenols abundantly present in variety of fruits and nuts like pomegranates, raspberries,
strawberries, black raspberries, almonds and walnuts (Amakura et al., 2000). Juice being
yielded by pressing entire pomegranate fruit (Punica granatum L.) comprises of abundant
source of ellagitannins in comparison to all other fruit based juices. Medicinal potential of
this type of juice has been documented to be used since ancient times (Clifford and Scalbert,
2000). In United States, commercially available pomegranate juice has gained popularity due
to its antioxidant potential and rich polyphenolic content. Researchers have reported its
anticancer properties, with the most significant data and literature to date regarding prostate
cancer. Nevertheless, the inhibitory effect on inflammation initiated by NF-κB (nuclear
factor κB) at sub-cellular level and cellular propagation besides stimulation of apoptosis
endorses that ETs can be fruitful bioactive agent for curing and preventing various forms of
cancer like breast, colon and prostate (Longtin, 2003).
The most abundant form of phenolics present in pomegranate peel, juice and bagasse is
pomegranate ellagitannins (PEs) that on hydrolysis yield ellagic acid (EA) and are finally
converted to urilithins A by gut micro-flora. Punicalagin a unique polyphenolic compound to
pomegranate and belongs to class of ellagitannins, which also comprises of other tannins for
instance gallagic acid and punicalin. Commonly, all mentioned ellagitannins have capability
to produce ellagic acid on hydrolysis, subsequently prolonging the release of ellagic acid into
blood stream on consumption of pomegranate juice (Gil et al., 2000). Punicalagin being the

19
largest polyphenol, having molecular weight more than 1000, is documented to be
accountable for more than half the antioxidant potential of pomegranate juice. Punicalagin
has been investigated to be present in ample amount in the peel (fruit husk) as compared to
arils (water laden portion) embedded inside the fruit. Extraction of whole pomegranate fruit
juice achieved by squeezing process, results in significant amount of ellagitannins being
diffused into pomegranate juice at a level of greater than 2 g/L juice content. Over 124
phytonutrients are identified in pomegranate including, anthocyanins (pelargonidin
glycosides, cyanidin and delphinidin) and flavonols (luteolin glycosides, quercetin and
kaempferol) (Gil et al., 2000; Heber et al., 2006).
Blood PSA (prostate-specific antigen) is foremost practiced biological marker to assess the
proliferation of prostate cancer. Likewise, for the estimated calculation of cancer stage and
for defining future strategic therapeutic guidelines, Gleason grading system/score is a clinical
test for grading of prognosis in a prostate cancer patient. Accordingly, an experimental study
was conducted on personnel having high values of post-surgery PSA (greater than 0.2 ng/mL
and less than 5.0 ng/mL) and a Gleason score of ≤ 7. After surgical/radio therapy biological
reappearance was observed in nearly 30% of patients, having Gleason score of about 7.
These patients were administrated to 250 mL (8.45 oz) of PJ (pomegranate juice) from
healthy fully matured variety on daily basis. Each 8.45 ounce serving comprised of 570 mg
GAE (gallic acid equivalents) of total polyphenols. Study conducted by Pantuck et al. (2006)
suggested that 85% of subjected cases had a significant decrease in rate of PSA content,
which is secreted exclusively in these circumstances by prostate cancer cells that have
procreated after the primary therapeutic removal of normal and primary tumor tissues. PSA
doubling time is a prognosticator of clinical prostate cancer progression in patients having
recurring disease.
Bioactivity of phytonutrients is critically dependent on their bioavailability, purposely, 18
volunteers were subjected to pomegranate juice and their serum samples were quantified to
assess ellagic acid (EA) content being hydrolyzed from pomegranate ellagitannins (Seeram et
al., 2004). Additionally, they revealed that hydrolytic conversion of punicalagin to ellagic
acid is ultimately transformed to DMEAG (dimethylellagic acid glucuronide) and is
quantitatively present in blood serum and urine. Urolithins, derivative of ellagic acid was
reported to be found in human urine even after 12 hours of pomegranate juice administration.

20
Importantly, the propensity of pomegranate polyphenolic metabolites to confine in prostate
tissue, along with experimental data revealing the chemo-preventive potential of
pomegranate fruit extracts (juice, peel and seed) proposes the anti-prostate cancer potential of
pomegranate products (Seeram et al., 2006).
Furthermore, Seeram et al. (2007) analyzed the bioavailability of urolithins and DMEAG in
orthotopically transplanted LNCaP (Lymph Node Carcinoma of Prostate) cells of Severe
combined immunodeficient (SCID) mouse model. Conclusively, many studies on humans
and rat models have reported the hydrolyzation of pomegranate ellagitannins to ellagic acid
in the gut, which is further being metabolized to urolithins A & B by the action of colon
micro-flora (Cerdá et al., 2003). Urolithins are subsequently diffused into the enterohepatic
circulation and are eliminated via feces and urine (Cerdá et al., 2004). Accumulation of
urolithins and ellagic acid are also investigated to be found in prostate and intestines.
Punicalagins, ellagic acid, and urolithins A & B have shown documented chemopreventive
potential on many cell lines and mouse models. Orally administrated pomegranate fruit
extracts to wild mice species significantly increased serum ellagic acid level, but no detection
of ellagic acid was observed in prostate gland. However, intraperitoneally (IP) administrated
pomegranate extract resulted in ten times more ellagic acid (EA) content in blood plasma and
were predominantly found in intestines, prostate and colon relative to other organ of body
(Espín et al., 2007a; Larrosa et al., 2006; Seeram et al., 2007).
2.6. Pomegranate polyphenols against metabolic syndromes
Pomegranate polyphenols exhibit numerous health boosting properties necessary for good
quality life. Due to their free radical quenching potential, they are reported to be effective
against various health issues with special reference to hyperglycemia and
hypercholesterolemia. Correspondingly, they improve the human body immune system via
various metabolic pathways and control numerous neuro-degenerative ailments. Natural
antioxidant enriched functional and nutraceutical foods are one of the paradigms involved in
the diet based therapy to attenuate various lifestyle related metabolic syndromes. Considering
the facts, functional/nutraceutical foods are flourished as a billions dollar industry (Colonna
et al., 2008; Martin-Moreno et al., 2008). There are proven facts that 30-40% of metabolic

21
dysfunctions can be prevented through healthy lifestyle and novel dietary strategies (Farah,
2005; Divisi et al., 2006; Nies et al., 2006).
2.6.1. Oxidative stress and safety concerns
Oxidative stress is actually disproportion between endogenous antioxidative enzymes and
reactive oxygen species (ROS) produced in a biological system that eventually disrupts the
removal of free radicals from the body. This condition disturbs body redox potential and
damages the cell components including protein and lipid thereby alters the cellular signaling
(Butt and Sultan, 2009). Oxidative stress is an undesirable state of the body cells that
ultimately leads to hyperlipidemia and hyperglycemia (Bursill et al., 2007; Basu et al., 2010).
Reactive oxygen spices (ROS) are generated ubiquitously within the body nevertheless, some
factors like unhealthy diet intake, smoking, sedentary lifestyle and environment can boost
their production. The primary goal of phytochemical rich diet therapy is to augment the
antioxidant immune system that eventually will protect human body against free radicals
therefore ensuring long healthy life. In this context, intake of polyphenolic diet is inevitable
and an appropriate approach to amplify body antioxidant status (Tapsell et al., 2006; Gibson
et al., 2012). Lack of physical activity along with poor nutritional habits causes the onset and
progression of metabolic complications like cardiovascular diseases, diabetes, cancer
insurgence and immune dysfunctions (Bárta et al., 2006). Pomegranate phytochemicals have
ability to combat oxidative injury by shielding against these physiological threats (Wong et
al., 2006; Seifried et al., 2007).
During last decade, scientists are highlighting the importance of identification and isolation
of naturally available phytogenic complexes which proliferates the activity of endogenous
antioxidant enzyme system (Finkel and Holbrook, 2000). Glutathione (GSH) a naturally
occurring antioxidant present in various plants, herbs and animals, have ability to prevent
cellular damage triggered by free radicals and reactive oxygen species. Cells synthesize
glutathione by two ATP-dependent steps, firstly enzyme glutamate-cysteine-ligase produces
γ-glutamylcysteine by using cysteine and L-glutamate and secondly glutathione synthetase
acts on γ-glutamylcysteine and adds a glycine molecule at its C-terminal end. In animal cells,
reduced glutathione donates an electron to free radicals and reduces them. After donation of
electron, resultant reactive glutathione reacts with other reactive glutathione to produce

22
glutathione disulfide, a substrate for glutathione reductase (GSSR). Glutathione reductase
reduces oxidized glutathione by accepting an electron from NADPH (nicotinamide adenine
dinucleotide phosphate) (Hayes and Pulford, 1995; White et al., 2003). The oxidative balance
disrupts during production of reactive oxygen species (ROS) that successively generate
double allylic hydrogen atom and initiate oxidation of lipid. Meanwhile, neutrophils catalyze
the synthesis of hypochlorous acid that causes oxidative injury in terms of cellular damage.
In this milieu, body produces defense enzymes i.e. superoxide dismutase (SOD) and
glutathione peroxidase (GSH-Px). Superoxide dismutase acts as first line defense by
producing singlet oxygen into hydrogen peroxide. However, GSH-Px and catalase enzymes
convert hydrogen peroxide into water. Generally, these enzymes works in harmony but in
case of ROS over production, interruption may result in necrosis or apoptosis. In such cases,
phytochemicals acts as therapeutic agents to combat excessive ROS production (Erdman et
al., 2009).
Oxidative stress plays a key role in the prevalence of chronic diseases. Free radicals are
linked with various diseases as cancer, diabetes, cardiovascular complications and
osteoporosis (Ratnam et al., 2006). Pomegranate phytogenic extracts has been reported to
significantly restore the antioxidant enzymes including glutathione peroxidase (GSH-Px) and
superoxide dismutase (SOD). In this context, pomegranate fruit juice and seed extracts has
been explored against CCl4-induced cytotoxicity in HepG2 cells by using three different
solvents namely ethyl acetate, n-hexane and hydro-alcohol at different concentrations. For
this purpose extracts at a concentration of 1 µg/ml to 1000 µg/ml were subjected to cells, 1 h
prior to application of CCl4 (100 mM). After incubation of 24 h, glutathione (GSH) content,
thiobarbituric acid reactive substances (TBARS) and toxicity of the cells were assessed.
Hydroalcoholic extracts having concentration ranging from 100 to 1000µg/ml showed
protective effect against CCl4-induced cytotoxicity in the cells, whereas ethyl acetate extract
of fruit juice was only effective at higher concentration i.e. 1000 µg/ml followed by n-hexane
extracts being the least effective. Contrarily, non-significant effect was observed in case of n-
hexane and ethyl acetate seed extracts against carbon tetra chloride (CCl4) induced
cytotoxicity (Niknahad et al., 2012).
Accumulation of carbon tetrachloride (CCl4) in hepatic parenchyma cells results in reaction
with polyunsaturated fatty acids (PUFA), producing peroxy and alkoxy radicals that are

23
directly linked to lipid peroxidation. These liberated free radicals induce hepatic necrosis by
disrupting the cell membrane and covalently binding with cellular proteins (Pandit et al.,
2004; Brautbar and Williams, 2002). Likewise, Murthy et al. (2002) probed pomegranate
peel extract against CCl4-induced lipid peroxidation in albino rats of Wister strain. They
examined the levels of various antioxidant enzymes i.e. peroxidase, catalase and superoxide
dismutase (SOD). For this purpose they treated rats with a single dose of CCl4 (2.0 g/kg of
body weight), resulting in decrease in the levels of superoxide dismutase (SOD), catalase and
peroxidase by 49, 81 and 89% correspondingly, while the lipid peroxidation content
augmented nearly 3 times. Whereas, rats pretreated with methanolic extract (MeOH) of
pomegranate peel (PP) at 50 mg/kg CE (Catechin equivalent) along with CCl4 application
resulted in preservation of SOD, peroxidase and catalase enzymes as compared to control
group, similarly significant reduction up to 54% was observed in case of lipid peroxidation
incomparable to control.
Kumar et al. (2013) undertook an experiment in order to evaluate the protecting effects of
MPPE (methanol pomegranate peel extract) against Wister rats in which oxidative stress was
induced by injecting mercuric chloride (HgCl2) at 5 mg kg-1
body weight. After oxidative
stress induction, MPPE (50 mg/kg body weight per day) suspended in Na-CMC (0.5%) was
orally fed to rats for one month. Significant decrease up to 25% and 75% was observed in
plasma antioxidant capacity and intracellular glutathione respectively. They also suggested
that MPPE supplementation increased antioxidant defense system of HgCl2-induced
oxidative stress in rat model.
Aqueous PSE (pomegranate seed extract), a by-product obtained after juice extraction from
arils, has reported to have antiglycative potential that boosts human hepatoma (HepG2) cells
integrity. Purposely, Navarro et al. (2014) investigated the protective effect of aqueous PSE
against t-BOOH (tert-butyl hydroperoxide) induced oxidative stress in human cell in vitro
model. Additionally, reactive oxygen species (ROS) produced from induction of t-BOOH
was significantly reduced by 21% after pretreatment of cells with aqueous PSE (100 µg/mL)
for 180 minutes. The applied concentrations were found to be effective in reduction of ROS
formed but this phenomenon was not dose-dependent.

24
Ischemia occurs due to interruption in blood flow to cells, tissues or organs resulting in
shortage of oxygen supply and glucose required for proper cellular metabolism. Restriction
in blood flow to brain causes brain ischemia and brain dysfunction. Pomegranate extracts
(PEs) are safely consumed all over the world due to their anti-inflammatory and antioxidant
potential. Nowadays, various researchers are considering plant extracts as a novel therapeutic
tool for curbing neurodegenerative disorders. Therefore, Ahmed et al. (2014) explored the
protecting effect of pomegranate extract (PE) against brain ischemia in rat models. They
randomly divided forty adult male albino rats into four groups, namely sham control, I/R
(ischemia/reperfusion) group and two other groups that were orally administrated with 250
mg/kg and 500 mg/kg of pomegranate extract respectively, 15 days before cerebral ischemia
induction. Results indicated significant reduction in nitric oxide (NO) and malondialdehyde
(MDA) content, whereas biochemical profiling of rats administrated with pomegranate
extract revealed incremental effect on glutathione reductase (GRD), superoxide dismutase
(SOD) and glutathione peroxidase (GPx) values. Furthermore, PE administrated rats had
reduced amount of capase-3, nuclear factor kappa B p65 (NF-κB p65) and tumor necrosis
factor-alpha (TNF-α). Whereas, significant increase in level of interleukin-10 (IL-10) and
production of adenosine triphosphate (ATP) was observed, however, less deoxyribonucleic
acid (DNA) damage was reported in rats pretreated with pomegranate extract (PE).
2.6.2. Hypercholesterolemia and renal dysfunction
Cholesterol is one of the vital compounds, lipophilic in nature that performs various
metabolic functions in the body. In hypercholesterolemia, various metabolic dysfunctions
like coronary complications, high blood pressure and strokes are allied with raised levels of
serum cholesterol, low density lipoproteins (LDL) and triglycerides (TG) along with
suppressed high density lipoproteins (HDL) content. Dyslipidemia plays a critical role in the
development of atherosclerosis disease owing to cholesterol accumulation in coronary
arteries (Anwar et al., 2012). Fruits and vegetables based phytonutrients potentially protects
against cardio-vascular diseases (CVD). Amongst different phytochemicals, punicalagin has
been reported to have hypoglycemic and hypolipidemic perspectives hence impart increase in
high density lipoproteins along with decrease in serum cholesterol, low density lipoprotein
(LDL) and triglycerides (TG) levels (Aviram et al., 2000).

25
Supplementation of phytogenic antioxidants to rat model has shown inhibitory effect on low
density lipoproteins (LDL) oxidation and is also helpful in diminishing atherosclerosis
progression. Latterly, Aviram et al. (2004) probed the preventive effect of PJ (pomegranate
juice) containing anthocyanins and tannins, by feeding it to atherosclerotic volunteers with
CAS (carotid artery stenosis). They investigated 10 patients that were subjected to PJ for one
year, whereas 5 out of these 10 individuals continued to take PJ for three years. Serum
profiling data revealed that carotid IMT (intima-media thickness) increased up to 9% within
one year in case of control group that were not administrated to PJ. However, IMT was
reduced to 30% by twelve months consumption of PJ. The PJ subjected group of patients
showed significant reduction in LDL (low density lipoprotein) vulnerability to induced
oxidation and blood LDL basal oxidative content by 59% and 90%, respectively. Likewise,
dietary PJ application also raised serum PON-1 (paraoxonase-1) level by 83%. This lipid
lowering effect was attributed to the tannins attachment with LDL that eventually protects it
from being oxidized. During whole experimental trial systolic blood pressure was observed
frequently, conclusively it was reduced by 21% after consuming PJ for twelve months.
According to Wu et al. (2004) elevation in low density lipoprotein and decreased level of
high density lipoprotein are major causes if coronary diseases. LDL interacts with reactive
oxygen species (ROS) and are oxidized finally resulting in accumulation of various
adhesions, neutrophils, monocytes, development of atherosclerotic plaques and cell death. In
another research, impact of pomegranate juice was studied on macrophage cells. The derived
results demonstrated that macrophage enrichment with pomegranate juice polyphenols
potentially suppresses the oxidation of LDL by macrophage (90%), due to inhibition of
cellular lipid peroxidation. Moreover, PJ supplementation showed reduction of 44% in terms
of volume of atherosclerotic lesions (Aviram et al., 2000). Furthermore, two months
administration of pomegranate juice to atherosclerotic mice resulted in 31% reduction of
oxidized LDL and 39% elevation of macrophage cholesterol efflux (Kaplan et al., 2001).
Over past few decades, researchers are emphasizing on treatment of hypercholesterolemia by
naturally occurring bioactive compounds present in fruits and vegetables. Dyslipidemia or
hypercholesterolemia is normally characterized as raised levels of LDL (low density
lipoprotein), TG (triglyceride) and TC (total cholesterol) and reduced levels of HDL (high
density lipoprotein). Dyslipidemia is known to be avertible risk factor for CHDs (coronary

26
heart diseases) and has characteristically identified as a core reason for enhancement of
cardiovascular mortality. Accordingly, Sadeghipour et al. (2014) explored ethanolic extract
of PP (pomegranate peel) against fat based irregularities. Purposely, they conducted thirty
days bio-efficacy trial on male rats that were divided into six groups: Group-1 as normal
control; Group-2 as untreated control (administrated on 10% cholesterol diet); Group-3, 4, 5
and 6 (fed on 10% lipid rich diet + intraperitoneally administrated PP extract @ 50, 100, 200
and 300 mg kg-1
day-1
). Serum parameters showed significant reduction in triglycerides
(55%), cholesterol (26%) and LDL (80%) values as compared to untreated control group.
Whereas, hypercholesterolemic groups that were subjected to PP extracts at different
concentration showed raised HDL level by 68-84% in respective study. Similarly,
histopathological data for liver damage in dyslipidemic rats that were intraperitoneally
administrated to intake of 50-300 mg PPE/kg/day revealed significant reduced levels of AST
(1538-1170 UI/L), ALT (1553-1130 UI/L) and ALP (13362-1049 UI/L), thus attenuating
liver damage in hypercholesterolemic rats as compared to untreated control group.
Diet comprising of rich source of antioxidants has been illustrated to have inhibitory effect
on atherosclerosis and macrophage foam cell formation. Pomegranate as a whole, including
peel juice and seed are known to be good source of phytochemicals and other antioxidants.
Dietary pomegranate peel powder and their extracts exert anti-lipidemic effect due to their
high antioxidant activity. Pomegranate as dietary intervention is encouraged to attenuate
hypercholesterolemia. In a research investigation, forty male albino rats were divided into
eight groups G(1-8); G-(1) as negative control, G-(2) as positive control, G-(3, 4 and 5) were
supplemented with 5, 10 and 15% pomegranate peel powder and G-(6, 7 and 8) were
administrated to 1, 2 and 3% PPE (pomegranate peel extract), respectively. The
hypercholesterolemic group of rats that were fed on peel powder showed substantial decline
in levels of serum TG (124-52 mg/dL), TC (154-92 mg/dL) and LDL (87-40 mg/dL).
Likewise, TG, TC and LDL levels were diminished up to 33%, 55% and 89% respectively, in
case of group that were administrated to (1, 2 and 3%) peel extracts (Hossin, 2009).
Chronic kidney disease (CKD) is a silent killer characterized by the progressive loss in renal
function at a slower pace. It includes blood vessel disorders leading to nephron dysfunction
that ultimately reduces the glomerulus filtration. Renal dysfunctionality is more prevalent in
patients with high blood pressure, diabetes and cardiovascular complications (Chauhan and

27
Vaid, 2009). Elevated creatinine and blood urea levels were noticed in the chronic renal
failure due to impairment in glomerular filtration rate thereby reduce urinary excretion.
Recent studies advocated the capability of pomegranate polyphenols to activate antioxidant
enzymes thus improve liver detoxifying ability. Likewise, pomegranate polyphenols
treatment declined plasma creatinine and blood urea nitrogen levels in male albino rats
(Moneim et al., 2011). Next, Ibrahium (2010) elucidated that pomegranate peel polyphenols
reduces creatinine level by their anti-platelet action and enable kidneys to regain their normal
function. It has been observed that pomegranate peel polyphenols exhibit diuretic effect
thereby enhance the overall kidney functioning like renal blood flow, capillary expansion and
glomerular filtration (Faria et al., 2007b). In this context, Ahmed and Ali (2010) reported the
protective effect of ethanolic extract of pomegranate peel polyphenols against Fe-NTA
(ferric nitrilotriacetate)-induced renal oxidative stress in decreasing blood urea and creatinine
value. They observed that Egyptian pomegranate peel extract (100 & 200 mg kg-1
day-1
)
reduced blood creatinine (28.07 & 48.43%) and urea (45.40 & 67.96%), respectively as
compared to Fe-NTA-induced rats. The recorded values for creatinine and urea were 89.4
and 35.9 mmol L-1
for Fe-NTA-induced control whereas, values for PPE (100 & 200 mg kg-1
day-1
) treated group were documented as 64.3 & 19.6 mmol L-1
for creatinine and 46.1 &
11.5 mmol L-1
in case of urea, respectively.
Similarly, El-Habibi (2013) determined the effect of pomegranate juice (PJ) and peel (PP)
polyphenols on liver and kidney functioning in normal and AD (Adenine) induced CRF
(chronic renal failure) rats. Both PJ and PP polyphenols imparted significant effect on the
blood urea and creatinine level of AD-induced rats whilst, non-significant differences were
observed among the normal rats. Later, El-Sayed et al. (2014) observed reduction in urea as
55 to 42 mg/dL and creatinine from 1.44 to 0.91 mg/dL, in pomegranate peel extract treated
experimental rats. Their findings were in agreement with Hamza et al. (2014) as they
reported a significant decline in plasma urea and creatinine by 41.68 and 15.73%,
respectively in male albino mice.
Currently, Albasha and Azab (2016) explicated the modulatory role of pomegranate juice
(PJ) in nicotine-induced hepato-renal dysfunctional in Guinea pigs. The in vivo renal
functioning parameters like blood urea nitrogen and creatinine were observed in elevated

28
amount in nicotine induced toxic pigs. However, pomegranate juice administration
significantly reduced urea and creatinine by 28.57% and 53.33%, respectively. The oxidative
stress induced some morphological abnormalities in glomerulus, capillaries and tubules
structures. Moreover, inflammation, sore lesion and deformation in tubules were also
observed. Provision of PJ uplifts the renal functioning by mitigating the abnormal signs of
kidney and inflammation.
2.6.3. Diabetes and insulin malfunctioning
Over the last decade, the predominance of diabetes has intensified at a disturbing rate owing
to improper and unwholesome dietetic pattern alongside with obesity. Diabetes mellitus is
the most prevailing metabolic disorder around the globe and the numbers of diabetic patients
are increasing day by day. International Diabetes Federation accounted nearly 194 million
diabetic individuals in year 2003 and this number will upsurge to 333 million by the year
2025. It has also been ranked as third most widespread disease by World Health Organization
after cardiovascular (CVD) and oncological syndromes (Viuda-Martos et al., 2010). Diabetes
mellitus (DM) is known to be a lifestyle related metabolic syndrome in which insulin
improperly regulates both carbohydrate and lipid metabolism. Many herbal medicinal plants
are considered to cure diabetes successfully and nowadays reported to be more preferably
used over synthetic drugs due to their less toxic nature.
Generally, in type-II diabetes the heterogeneous disorder of insulin resistance and pancreatic
ß-secreting cell malfunctioning occurs. To deal with this menace, conventional medication
supplemented by diet based therapy is helpful to attenuate the existing threat. Among various
therapeutic foods, pomegranate has attained forefront position to combat against
hyperglycemia and its related immune dysfunctions. Substantial evidences have divulged the
role of pomegranate as an anti-diabetic agent, due to its strong antioxidant potential. The
pomegranate allied antioxidants attenuate hyperglycemic state by modifying the glucose
metabolism, affirmative influence on insulin secretion and absorption through the ß-cells
(American Diabetes Association, 2005; Rashid et al., 2008; Chen et al., 2009; Huang and
Lin, 2012). From last few decades, significant development has occurred in instituting the
anti-diabetic property of pomegranate peel (PP), juice (PJ), seed (PS) and isolated

29
polyphenols from these fractions responsible for this mechanism. Numerous phytogenic
extracts of PP have reported to possess anti-hyperglycemic potential.
An experimental trial held by Khalil (2004) revealed anti-hyperglycemic activity of aqueous
pomegranate peel extract (AQPPE). He suggested significant increase in 𝛽-secreting cells
and reduced number of serum glucose level in rat model, when subjected to 0.43 g kg-1
body
weight AQPPE for 28 days. The pharmacological anti-diabetic potential of the PP extracts is
by regeneration of 𝛽-cells and activation of insulin receptors. Similarly, Oral
supplementation of AQPPE at concentration of 50 & 100 mg kg-1
for 3 weeks considerably
lessened the SG (serum glucose), TC (total cholesterol), TG (triglycerides), LDL (low
density lipoprotein) content together with enhancement of antioxidant enzymes, HDL (high
density lipoprotein cholesterol) and GSH (glutathione) level in divergence to diabetic control
group. They suggested the use of PP-extract as a nutraceutical tool for attenuation of chronic
diseases that are usually characterized by reduced glucose metabolism and aggravated
antioxidant status (Parmar and Kar, 2007). Later, same group highlighted importance of
orally administrated AQ-EPPE (aqueous-ethanolic pomegranate peel extract) on alloxan-
induced diabetic rats and concluded significant reduction of blood glucose level in rats that
were fed on both normal and high glucose diet. They suggested that interference in
absorption of intestinal glucose may also have inhibitory effect of hyperglycemia in diabetic
rats (Parmar and Kar, 2008).
Earlier, Althunibat et al. (2010) carried out a rodent trial for the evaluation of pomegranate
peel extract against high glucose levels. In this experiment, rats were made hyperglycemic by
application of STZ (streptozotocin) injection. Pomegranate peel extracts administrated at 10
& 20 mg kg-1
body weight (B.W.) significantly reduced hyperglycemia and liver dysfunction
by boosting antioxidant enzymatic activity in RBC, liver and kidney. Likewise, methanolic
extract (ME) of pomegranate peel (PP) supplemented @ 75 and 150 mg/kg on daily basis
inhibited serum glucose content in diabetic Wister rats. These administrated extracts also
reflected significant decline of MDA (malondialdehyde) level in alloxan-induced
hyperglycemic rat tissues and raised blood antioxidant capability in a dose dependent
manner. Phytogenic gallic acid, present in ample quantity, is the main reason for
pomegranate peels anti-diabetic activity. They also discovered that oleanolic acid and ursolic
acid, scavenge free-radicals produced in diabetic models (Middha et al., 2012).

30
Likewise, Radhika et al. (2011) intended to assess the anti-diabetic potential of pomegranate
husk in intra-peritoneally injected alloxan-induced diabetic male rats. Diabetes &
hypercholesterolemia was induced by intra-peritoneal administration of alloxan mono
hydrate (120mg/kg) for 2 successive days. Diabetes was confirmed 2 days after the last
alloxan dose administration by determining the blood glucose concentration. Treatments
were started after confirmation of diabetes in rats. During diabetes, the excess glucose
present in the blood reacts with hemoglobin to form glycosylated hemoglobin. So the total
hemoglobin level is lowered in alloxan induced diabetic rats. Alloxan induced diabetes has
been observed to cause a massive reduction of the beta cells of the islets of pancreas leading
to hyperglycemia. Rats treated with alloxan (120mg/kg), for 2 consecutive days, showed an
increase in the concentration of glucose, triglycerides, cholesterol, LDL cholesterol, VLDL
cholesterol and a decrease in the level of HDL cholesterol and hemoglobin content.
Administration of crude powder of Punica granatum husk reduced the concentration of
glucose, triglycerides, cholesterol, LDL cholesterol, VLDL cholesterol and raised the level of
HDL cholesterol & hemoglobin content in the blood of both group-I normal and group-III
alloxan diabetic rats treated.
Pomegranate peel and seed extracts significantly reduce the glucose level in streptozotocin
(STZ) induced diabetic male albino rats. The pomegranate fruit bioactive compounds
revealed a hypoglycemic effect in diabetic rats. The ß-secretion cells regenerating ability of
pomegranate peel and bagasse polyphenols is due to their protective antioxidant action
against STZ damaged ß-cells. Furthermore, pomegranate polyphenols inhibits the activity of
α-amylase & α-glucosidase enzymes that are vitally responsible for carbohydrates breakdown
and absorption throughout the body thus reduces the glucose uptake from intestines and
eventually lowers the blood glucose level. Several research based investigations have proven
the importance of pomegranate extract ellagitannins like punicalagin and punicalin on
modulating serum glucose level and proposed inhibitory effect on α-glucosidase enzyme
(Bellesia et al., 2015; Hanhineva et al., 2010; Kim et al., 2016).

31
CHAPTER 3
MATERIALS AND METHODS
The present study was carried out in the Fruits and Vegetables Laboratory, National Institute
of Food Science and Technology (NIFSAT), University of Agriculture, Faisalabad. Whilst in
vitro antioxidant assay was conducted in Department of Biochemistry and Biotechnology,
University of Agriculture Faisalabad. In the current investigation, three locally cultivated
pomegranate varieties were subjected to characterization, antioxidant potential estimation
and punicalagin quantification. Furthermore, therapeutic and nutraceutical potential of
pomegranate peel and bagasse polyphenols based drinks was evaluated against selected
lifestyle related disorders. The materials and protocols followed are described as under;
3.1. Procurement of raw material
Pomegranate varieties namely Kandhari, Desi and Badana were procured from the local fruit
market. The varieties were subjected to washing followed by peeling in the Canning Hall at
NIFSAT. To obtain the representative pomegranate arils bagasse all the three varieties of
pomegranate were separately peeled manually and the arils were introduced into a blender.
The resultant mixture was filtered using muslin cloth to separate pomegranate juice leaving
behind pomegranate bagasse. Afterwards, the separated peels and bagasses of each variety
were dried in cabinet dryer at 60°C for 24 hours and were grounded to form representative
powder. The reagents (analytical and HPLC grade) and standards were purchased from
Merck (Merck KGaA, Darmstadt, Germany) and Sigma-Aldrich (Sigma-Aldrich Tokyo,
Japan). For efficacy trial, Male Sprague Dawley rats were purchased from National Institute
of Health, Islamabad and housed in the Animal Room of NIFSAT. For biological assay,
diagnostic kits were purchased from Sigma-Aldrich, Bioassay (Bioassays Chemical Co.
Germany) and Cayman Chemicals (Cayman Europe, Estonia).
3.2. Characterization of Pomegranate peel and bagasse powder
Initially, the pomegranate peel and bagasse powder of all varieties were examined for various
quality traits including proximate and mineral analysis, polyphenol estimation and
punicalagin quantification. The procedures followed are given below;

32
3.2.1. Proximate analysis
Pomegranate peel and bagasse powder samples were investigated for moisture, crude protein,
crude fat, crude fiber, ash and nitrogen free extract in triplicate on dry weight basis as
following.
3.2.1.1. Moisture content
The Moisture content of pomegranate peel and bagasse powders was measured by drying
sample in Air Forced Draft Oven (Model: DO-1-30/02, PCSIR, Pakistan) at 105±5°C till
constant weight following the procedure of AOAC (2006).
3.2.1.2. Crude protein
The percentage of Crude protein of all samples was estimated through Kjeltech Apparatus
(Model: D-40599, Behr Labor Technik, Gmbh-Germany) by adopting the protocol of AOAC
(2006).
3.2.1.3. Crude fat
Crude fat was determined by using Soxtec System (Model: H-2 1045 Extraction Unit,
Hoganas, Sweden) in pomegranate peel and bagasse powder samples following the
guidelines mentioned in AOAC (2006).
3.2.1.4. Crude fiber
The pomegranate peel and bagasse powder samples were subjected to crude fiber content
determination by digesting the fat free samples with 1.25% H2SO4 for 30 min followed by
1.25% NaOH solution using Labconco Fibertech (Labconco Corporation Kansas, USA) as
mentioned in AOAC (2006).
3.2.1.5. Total ash
Total ash content in all dried samples were determined after charring followed by direct
incineration at 550oC using Muffle Furnace (MF-1/02, PCSIR, Pakistan) till grayish white
residues following the procedure of AOAC (2006).
3.2.1.6. Nitrogen free extract (NFE)
NFE was calculated through subtraction method following the expression:

33
𝑁𝐹𝐸% = 100 – (𝑀𝑜𝑖𝑠𝑡𝑢𝑟𝑒 + 𝐶𝑟𝑢𝑑𝑒 𝑝𝑟𝑜𝑡𝑒𝑖𝑛 + 𝐶𝑟𝑢𝑑𝑒 𝑓𝑎𝑡 + 𝐶𝑟𝑢𝑑𝑒 𝐹𝑖𝑏𝑒𝑟 +
𝐴𝑠ℎ)%
3.2.2. Minerals
The pomegranate peel and bagasse samples were subjected to mineral profiling following the
instructions of AOAC (2006). Purposely, sodium and potassium were determined through
Flame Photometer-410 (Sherwood Scientific Ltd., Cambridge). Likewise, Atomic Absorption
Spectrophotometer (Varian AA240, Australia) was used for the measurement of
phosphorous, magnesium, calcium and iron.
3.2.3. Preparation of antioxidant extracts
The antioxidant extracts of pomegranate peel and bagasse powder samples of all three
varieties were obtained by treating them with different solvents such as methanol (50%),
ethanol (50%) and ethyl acetate (50%) respectively, to asses there extraction efficiency
(Table 1). Purposely, prepared samples were subjected to mechanical shaker for 7 hours
followed by centrifugation for 15 min at 12,000 rpm (Viuda-Martos et al., 2011). Resultant
extracts were filtered using vacuum filtration assembly and solvents were recovered by
Rotary Evaporator (EYELA, N-N series, Japan) at a temperature of 40°C (Rusak et al.,
2008). These extracts were further evaluated for in vitro antioxidant potential.
3.2.4. In vitro studies
Extracts of pomegranate peel and bagasse of each variety were further analyzed for their in
vitro antioxidant potential including total phenolic content (TPC), total flavonoid content
(TFC) and free radical scavenging activity by DPPH (1,1-diphenyl-2-picrylhydrazyl) as
discussed below;

34
Table 1. Treatments for solvent extraction
Treatments Pomegranate Peel Solvents Treatments Pomegranate Bagasse Solvents
T1 Kandhari
Methanol
T10 Kandhari
Methanol
T2 Desi T11 Desi
T3 Badana T12 Badana
T4 Kandhari
Ethanol
T13 Kandhari
Ethanol T5 Desi T14 Desi
T6 Badana T15 Badana
T7 Kandhari
Ethyl Acetate
T16 Kandhari
Ethyl Acetate T8 Desi T17 Desi
T9 Badana T18 Badana

35
3.2.4.1. Total phenolic content (TPC)
Estimation of total phenolic content (TPC) of representative pomegranate peel and bagasse
extracts was carried out using Folin-Ciocalteau method as described by Singleton et al.
(1999). For this purpose 125 μL of extract was mixed with 125 μL of Folin-Ciocalteau
reagent along with 500 μL of distilled water and allowed to stand for 5 min at 22ºC.
Following resting period, 4.5 mL of sodium bicarbonate solution (7%) was added to the
mixture. After 90 min, absorbance was measured at 765 nm using a UV/vis
Spectrophotometer (CECIL CE7200) against control. Total polyphenols were calculated and
expressed as gallic acid equivalent (mg gallic acid/g).
3.2.4.2. Total flavonoid content (TFC)
Total flavonoid contents (TFC) were determined by following the method of Chang et al.
(2002) with some slight modifications. For this purpose, 1 mL of extract were mixed with 0.3
mL NaNO2 (5%), and 0.3 mL AlCl3 (10%) was added after 5 min. Afterwards, 2 mL of 1 M
NaOH solution was added and volume was raised up to 10 mL by adding distilled water. For
all the samples the absorbance was measured at 510 nm by using UV/vis Spectrophotometer
(CECIL CE7200). All the results were expressed in mg rutin equivalent (RE)/g.
3.2.4.3. Free radical scavenging activity (DPPH assay)
The free radical scavenging activity (DPPH assay) of pomegranate peel and bagasse extracts
was measured according to the procedure of Brand-Williams et al. (1995). For the purpose,
one mL of methanolic solution of DPPH (0.1mM) was added to each extract (4 mL) and
incubated at room temperature for 30 min. The absorbance was noted at 520 nm using
Spectrophotometer (CECIL CE7200). Percent inhibition was calculated using the following
formula;
𝑅𝑒𝑑𝑢𝑐𝑡𝑖𝑜𝑛 𝑜𝑓 𝑎𝑏𝑠𝑜𝑟𝑏𝑎𝑛𝑐𝑒 (%) = [(𝐴𝐵 − 𝐴𝐴) / 𝐴𝐵] × 100
AB = absorbance of blank sample (t = 0 min)
AA = absorbance of tested extract solution (t = 30 min)
3.3. HPLC quantification of Punicalagin
Punicalagin was quantified through HPLC (PerkinElmer, Series 200, USA) using C18 column
(250 mm x 4.6 mm, 5.0 μm particle size). A 10 µL aliquot of sample was taken through auto

36
sampler (WISP Model 710) and maintained the column temperature 30oC throughout the
analysis. During Punicalagin quantification, mobile phase comprised of MeOH (eluent A)
and 0.1% (v/v) TFA in water (eluent B). Gradient conditions: 0–10 min, 5%–20% A in B;
10–20 min, 20–40% A in B; 20–26 min, 70% A in B. This was followed by a 10 min re-
equilibration. The flow rate was maintained at 1 mL/min followed by quantification with
UV/vis detector at 378 nm wavelength (Lu et al., 2011).
3.4. Selection of best treatment
On the basis of in vitro tests and HPLC quantification, one best treatment each from
pomegranate peel and bagasse extracts was selected for the development of value
added/functional drinks.
3.5. Development of value added/functional drink
During product development phase, three types of value added drinks were prepared, the first
treatment (D1) comprises of 3% (dry weight basis, w/v) pomegranate peel extract (PPE)
whilst other (D2) enriched with 3% pomegranate bagasse extract (PBE) alongside control
(D0) for comparison purpose (Table 2). All test drinks were prepared by adding aspartame,
citric acid, sodium benzoate, carboxy methyl cellulose (CMC), food grade color and flavor
(Appendix I-A).
Table 2. Treatments used for preparation of value added drinks
Treatments Description
D0 Control
D1 Drink containing PPE
D2 Drink containing PBE
3.6. Physicochemical analysis of value added/functional drinks
Value added functional drinks were analyzed for color, total soluble solids, pH, total acidity
and antioxidant assay during two month storage at 0, 30 and 60 days interval.

37
3.6.1. Color
Prepared drinks were analyzed for their color values using CIE-Lab Color Meter (CIELAB
SPACE. Color Tech-PCM, USA) following the method of Duangmal et al. (2008). For this
purpose, 5 mL of tested sample was taken and respective color values as a* (-a greenness; +a
redness), b* (-b blueness; +b yellowness) and L* (lightness) were determined. The resultant
data was used to calculate chroma (C*) and hue angle.
𝐶ℎ𝑟𝑜𝑚𝑎 (𝐶 ∗) = [(𝑎 ∗)2 + (𝑏 ∗)2]1/2
𝐻𝑢𝑒 𝑎𝑛𝑔𝑙𝑒 (ℎ) = 𝑡𝑎𝑛 − 1 (𝑏 ∗/𝑎 ∗)
3.6.2. Total soluble solids
Total soluble solids of prepared drinks were estimated through refractometer (TAMCO,
Model No. 90021, Japan) by adopting the protocol mentioned in AOAC (2006).
3.6.3. pH
Value added functional drinks were analyzed for pH using digital pH meter (InoLab 720,
Germany) according to the procedures of AOAC (2006).
3.6.4. Total acidity
Developed drinks were estimated for total acidity by following the protocol of AOAC
(2006). The representative samples were subjected to titration against 0.1 N sodium
hydroxide solution till persistent pink color.
3.6.5. Antioxidant assay
The prepared value added functional drinks were also assessed for antioxidant assay by
conducting total phenolic content (TPC), total flavonoid content (TPC) and free radical
scavenging activity (DPPH assay) method as discussed earlier.
3.7. Sensory evaluation
The formulated drinks (D0, D1 and D2) were subjected to sensory evaluation using 9-point
hedonic scale system (9=like extremely; 1=dislike extremely) as mentioned in Appendix-I
following the instructions of Meilgaard et al. (2007). In this context, sensory response for
various attributes like color, flavor, sweetness and overall acceptability was assessed at 0,

38
30and 60 days of storage. Hedonic response was determined in the sensory Evaluation
Laboratory of NIFSAT, University of Agriculture, Faisalabad. During sensory evaluation,
sensory panelists comprising of five judges were provided with fluorescent light in separate
booths and developed drinks were presented in transparent glasses labeled with random
codes. For evaluation, panelists were provided with mineral water and unsalted crackers to
neutralize their mouth receptors for critical and precise judgment. Samples were offered to
the judges randomly and requested to rate by assigning scores for selected traits.
3.8. In vivo studies
3.8.1. Biological assay
To evaluate the potential health benefit of developed value added functional drinks against
lifestyle related disorders with special reference to hypercholesterolemia and diabetes, an
efficacy trial was carried out. For the intention, 100 experimental rats were housed in the
Animal Room of NIFSAT, University of Agriculture, Faisalabad. The rats were acclimatized
by feeding the basal diet for a period of one week. The environmental conditions were
maintained throughout the trial i.e. temperature (23±2oC) and relative humidity (55±5%)
with 12 hr light-dark period. At the initiation of study, some rats were sacrificed to establish
a baseline trend. During animal modeling, three types of studies were conducted
independently involving normal, hypercholesterolemic and diabetic rats (Table 3). Each
study comprised of 30 rats, divided in three equal groups, ten in each. In Study I, rats were
fed on normal diet whereas in study II high cholesterol diet was given to the rats. While in
study III, diabetic rats [streptozotocin (STZ) @ 65mg/kg body weight] were involved that
relied on normal diet. Accordingly, control, pomegranate peel and bagasse based drinks were
given to the respective groups (Table 4). During the eight weeks trial, instantaneous
administration of value added/functional drinks to experimental rats was ensured to assess
their therapeutic role. At the termination of the study, overnight fasted rats were decapitated
and blood was collected. For serum collection, blood samples were subjected to
centrifugation using centrifuge machine @ 4000 rpm for 6 min. The respective sera samples
were examined for various biochemical assays by using Microlab 300, Merck, Germany.
Different biochemical parameters including total cholesterol, LDL, HDL, triglyceride,
glucose & insulin levels and antioxidant status were accessed using respective commercial

39
kits. Likewise, kidney and liver function test were performed to evaluate the safety
assessment. Initially, collected blood samples were analyzed for hematological parameters
with special reference to red and white blood cells indices along with electrolyte balance.
The details of these studies are herein;
Table 3. Studies conducted in efficacy trial
Study I Normal rats
Study II Hypercholesterolemic rats
Study III Diabetic rats
Study I: Normal rats
In this study, rats were divided in to three homogeneous groups fed on normal diet along
with provision of respective functional drink. The experimental diet (Appendix II) was
formulated using corn oil (10%), protein (10%), corn starch (66%), cellulose (10%), and
mineral (3%) and vitamin mixture (1%) (Appendix III & IV).
Following similar approach, two other studies were conducted to find out the impact of
functional drinks against respective disorders i.e. hypercholesterolemia and diabetes in rat
modeling (Table 4).
Study II: Hypercholesterolemic rats
In study II, high cholesterol diet i.e. 1.5% of cholesterol along with cholic acid 0.5% was
given to the normal rats to induce hypercholesterolemia. Periodic examination of rats was
carried out to assess the induction of hypercholesterolemia. The functional drinks were
provided to the rats concurrently to synchronize their effect on the respective group.
Study III: Diabetic rats
Diabetes was induced in rats by a single intraperitoneal injection of streptozotocin (STZ) @
65 mg/kg, dissolved in citrate buffer pH 4.5. Afterwards, respective functional drinks
alongside normal diet were provided to the diabetic rats to evaluate their therapeutic role.

40
Table 4. Diets and functional drink plan
Studies
Study I Study II Study III
Normal rats Hypercholesterolemic
rats Diabetic rats
Groups G1 G2 G3 G1 G2 G3 G1 G2 G3
Diets D0 D1 D2 D0 D1 D2 D0 D1 D2
D0: Control drink
D1: Drink containing pomegranate peel extracts
D2: Drink containing pomegranate bagasse extracts
3.8.2. Physical parameters
The following parameters were also measured throughout the experiment.
3.8.2.1. Feed and drink intake
Feed intake was measured daily by subtracting the spilled diet from the total diet during the
whole trial (Wolf and Weidbrode, 2003). The functional drink intake of each group was also
recorded daily by monitoring the differences in the graduated bottles.
3.8.2.2. Body weight gain
Gain in body weight of experimental groups was measured weekly throughout the study
period to monitor any suppressing effect of functional drinks on this trait.
3.8.2.3. Serum separation
For serum separation, blood samples were collected in commercially available red topped
tubes. The respective samples were allowed to clot at room temperature for 30 min. Further,
clotted part was removed after centrifugation through Centrifugation Machine (Model: 800,
China) @ 4000 rpm for 6 min (Uchida et al., 2001; Adkins et al., 2002).

41
3.8.2.4. Serum lipid profile
Lipid related including cholesterol, low density lipoproteins (LDL), high density lipoprotein
(HDL) and triglycerides (TG) were estimated by their respective protocols using commercial
kits. The further detail is given below;
3.8.2.4.1. Cholesterol
Serum cholesterol level was determined using CHOD–PAP method following the guidelines
of Kim et al. (2011).
3.8.2.4.2. High density lipoprotein
High density lipoprotein (HDL) was estimated by Cholesterol Precipitant method as
elaborated Alshatwi et al. (2011).
3.8.2.4.3. Low density lipoproteins
Low density lipoproteins (LDL) were recorded following the protocol of Kim et al. (2011).
3.8.2.4.4. Triglycerides
Triglycerides in the serum sample were measured by liquid triglyceride (GPO-PAP) method
outlined by Kim et al. (2011).
3.8.2.5. Serum glucose and insulin levels
Glucose concentration of individual rat in each study was determined by GOD-PAP method
as described by Kim et al. (2011), whereas insulin level was estimated by the method of Ahn
et al. (2011).
3.8.2.6. Antioxidant status
Glutathione contents were determined following the protocols as described by Feng et al.
(2011). The colored product of GSH + DTNB in the protein free supernatant was measured at
412 nm and expressed as nmol/mg protein. Similarly, indicator of lipid peroxidation i.e.
thiobarburic acid reactive species (TBARS) was also estimated (Huang et al., 2011).
3.8.2.7. Safety assessment
Liver function tests including aspartate aminotransferase (AST), alanine aminotransferase
(ALT) and alkaline phosphatase (ALP) were assessed. Levels of AST and ALT were

42
measured by the dinitrophenylhydrazene (DNPH) method using Sigma Kits 59-50 and 58-50,
respectively and ALP by Alkaline Phosphates–DGKC method (Basuny, 2009). Moreover,
the serum samples were also analyzed for urea by GLDH-method and creatinine by Jaffe-
method using commercial kits (Jacobs et al., 1996; Thomas, 1998) to assess the renal
functionality of different groups.
3.8.2.8. Hematological aspects
Red blood cells indices including total red blood cells (TRBCs), hemoglobin (hb), hematocrit
(Hct) and mean corpuscular volume (MCV) were estimated. Likewise, white blood cell
indices including monocytes, lymphocytes and neutrophils were measured by using
Automatic Blood Analyzer (Nihon Kohden, Japan). Indicators of electrolytes balance like
Na, K and Ca of collected blood samples were also probed by their respective methods
(AlHaj et al., 2011; Caduff et al., 2011).
3.9. Statistical Analysis
Data were obtained by applying completely randomized design (CRD) and further subjected
to statistical analysis using Statistical Package (Costat-2003, Co-Hort, v 6.1.). Levels of
significance were determined (ANOVA) using 2-factor factorial CRD following the
principles outlined by Steel et al. (1997).

43
CHAPTER 4
RESULTS AND DISCUSSION
Dietary phytochemicals assures safety against a number of metabolic ailments and
inclusively improve the overall health status. In this perspective, pomegranate peel and
bagasse both are imminent sources of naturally occurring bioactive molecules that have
tendency to alleviate numerous lifestyle related syndromes like diabetes and
hypercholesterolemia. In present study, pomegranate peels and bagasses of different varieties
were characterized for their nutritional assay, polyphenol extraction, antioxidant potential
and punicalagin quantification. Alongside, during product formulation phase, mainly three
different value added drinks were developed by supplementation of pomegranate peel and
bagasse extracts respectively alongside with control for comparison purposes. Lastly, the bio-
efficiency of formulated value added drinks were assessed through rat modeling against
selected metabolic disorders. The results and discussion of studied attributes are conferred
herein:
4.1. Characterization of pomegranate peel and bagasse powder
Characterization of experimental constituents is essential for the assessment of elements of
concern. Physiological assay along with sensory profiling are the decisive factors in
development of value added food products that eventually supports the dietary effectiveness
in rat feeding investigation. With intent, pomegranate was explored for its proximate
profiling i.e. moisture, crude protein, crude fat, crude fiber, ash and nitrogen free extract
(NFE). Alongside, mineral quantification and antioxidant indices of pomegranate peel and
bagasse powder samples are discussed in the upcoming segment for meticulousness
regarding the nutritional characterization of indigenously grown pomegranate.
4.1.1. Proximate composition
Proximate composition is vital parameter in estimating the quality of raw material.
Pomegranate peel and bagasse powders were subjected to various quality traits. The means
for pomegranate peel and bagasse powder elucidated highest moisture in the peel of

44
Table 5. Proximate composition of different pomegranate peels
Parameters Kandhari (%) Desi (%) Badana (%)
Moisture 8.88±0.49 7.51±0.25 5.43±0.31
Protein 3.31±0.14 3.26±0.12 3.25±0.17
Fat 1.28±0.12 1.31±0.18 1.26±0.10
Fiber 16.32±0.96 12.64±1.02 11.21±1.26
Ash 3.59±0.03 3.21±0.19 2.98±0.12
NFE 66.62±3.41 72.07±5.20 75.87±3.85
Table 6. Proximate composition of different pomegranate bagasses
Parameters Kandhari (%) Desi (%) Badana (%)
Moisture 6.18±0.31 6.19±0.25 6.11±0.17
Protein 13.44±1.07 12.23±1.09 10.94±1.01
Fat 22.06±1.52 20.49±1.68 19.26±0.86
Fiber 47.29±2.21 45.61±3.10 39.34±2.49
Ash 2.68±0.02 2.49±0.03 2.42±0.18
NFE 8.34±0.89 13.00±1.24 21.96±0.95

45
Kandhari 8.88±0.49 followed by Desi and Badana as 7.51±0.25 and 5.43±0.31%, whereas,
among bagasses highest moisture content (6.19±0.25%) was observed in Desi, followed by
Kandhari (6.18±0.31%) and Badana (6.11±0.17%). Moreover, protein contents for peels and
bagasses were recorded as 3.31±0.14 & 13.44±1.07, 3.25±0.12 & 12.23±1.09 and 3.26±0.17
& 10.94±1.01% in Kandhari, Desi and Badana, correspondingly. Similarly, fat & fiber
contents for pomegranate peels ranged from 1.26±0.10 (badana) to 1.31±0.18 (desi) &
11.21±1.26 (badana) to 16.32±0.96% (kandhari), however, for bagasses their values varied
from 19.26±0.86 (badana) to 22.06±1.52 (kandhari) & 39.34±2.49 (badana) to 47.29±2.21%
(kandhari), respectively. The ash content in peel and bagasse powders of corresponding
samples were 3.59±0.03, 3.21±0.19 and 2.98±0.12 & 2.68±0.02, 2.49±0.03 and 2.42±0.18%.
Likewise, NFE values for respective varieties were 66.62±3.41, 72.07±5.20 & 75.87±3.85%
for pomegranate peels and 8.34±0.89, 13.00±1.24 & 21.96±0.95% for bagasses of respective
varieties (Table 5 & Table 6).
Results of current study for pomegranate peel powder are in harmony with earlier
conclusions of Aguilar et al. (2008). They carried out proximate characterization of
pomegranate peel and probed moisture, fiber, protein, fat and ash content as 5.40, 16.30,
4.90, 1.26 and 3.40%, respectively. Similarly, Kushwaha et al. (2013) compared the values
for crude protein, crude fat, crude fiber and ash contents of different pomegranate peels in the
range of 3.95-6.43, 1.43-2.40, 12.61-24.36 and 3.29-5.49%, correspondingly.
Likewise, the results for pomegranate bagasse are also in line with the earlier findings of
Viuda-Martos et al. (2012), they narrated protein, fat, ash and total dietary fiber from 12.10
to 13.10, 21.50 to 27.10, 2.20 to 3.20 and 45.39 to 45.81%, respectively. Later, Rowayshed et
al. (2013) observed moisture (5.82%), protein (13.66%), fat (29.60%) and ash (1.49%) in
different pomegranate seed powder by-products samples. Recently, De Silva et al. (2014)
characterized inedible seed portion of pomegranate for its crude protein, crude fat, crude
fiber & ash and reported values as 9.10, 14.17, 12.55 and 5.31%, respectively. The
compositional disparities in pomegranate peel and bagasse about proximate composition are
mainly due to climatic conditions, agronomic practices, varietals variations and topographic
locations. Besides this, the time of plucking and maturity of pomegranate fruit are also the
factors of primary importance.

46
4.1.2. Mineral analysis
Mineral profiling in present study comprised of potassium (K), phosphorous (P), magnesium
(Mg), calcium (Ca), sodium (Na) & iron (Fe). In the current exploration, the maximum
potassium content was noticed in peel of Kandhari (1781.49±74.66 mg/100g) followed by
Desi (1207.76±53.85 mg/100g) and Badana (1176.32±48.91 mg/100g), similar trend was
noticed in case of pomegranate bagasse varieties i.e. 221.14±8.26 mg/100g (Kandhari),
202.23±9.14 (Desi) and 193.54±7.18 (Badana). Similarly, Ca & Mg contents for peel
samples ranged from 318.84±12.63 (Desi) to 328.52±18.54 (Kandhari) & 53.01±2.13 (Desi)
to 58.16±2.52 mg/100g (Kandhari). However, the values for pomegranate bagasse of
different varieties varied from 54.25±2.32 (Badana) to 60.11±3.69 (Kandhari) & 12.96±1.11
(Badana) to 19.61±1.18 mg/100g (Kandhari), respectively. Moreover, maximum values of P
and Na content (76.92±2.93 & 36.54±1.75 mg/100g) was observed in peel of Kandhari
trailed by Desi (69.45±3.41 & 34.07±1.18 mg/100g), whilst minimum (65.01±3.21 &
33.98±1.28 mg/100g) was noticed in peel of Badana variety. Likewise, phosphorous and
sodium content in respective pomegranate bagasse samples were 11.94±2.01 & 44.07±1.17
(Kandhari), 8.27±1.48 & 43.77±1.51 (Desi) and 7.69±1.37 & 37.82±2.58 mg/100g (Badana).
Additionally, Fe content in kandhari, desi & badana varieties were recorded as 1.63±0.15,
1.26±0.12 & 1.18±0.17 mg/ 100g for peel samples, while, 1.29±0.14, 1.72±0.16 & 1.12±0.11
mg/100g for bagasse (Table 7 and Table 8).
The means concerning mineral profiling in the present investigation are in accordance with
earlier results of Mirdehghan and Rahemi (2007), they explored the effect of seasonal
changes on mineral contents of pomegranate fruit (peel) for potassium, phosphorous,
calcium, sodium, iron & magnesium and observed variations from 10 to 20, 0.20 to 1.00,
2.10 to 3.90, 0.39 to 0.59, 0.001 to 0.004 & 0.50 to 1.50 g/kg, respectively. Moreover,
Rowayshed et al. (2013) reported 33.03 mg/100g of sodium and 434.40 mg/100g of
potassium in pomegranate seed by products. In an investigation, Kushwaha et al. (2013)
recorded variations in peel potassium contents from 6679 to 16237 mg/kg. The recorded
variation in mineral contents of present study is mainly due to varietal characteristics,
ripening stage, harvesting season and soil fertility.

47
Table 7. Mineral analysis of different pomegranate peels (mg/100g)
Parameters Kandhari Desi Badana
K 1781.49±74.66 1207.76±53.85 1176.32±48.91
P 76.92±2.93 69.45±3.41 65.01±3.21
Mg 58.16±2.52 53.01±2.13 55.25±3.09
Ca 328.52±18.54 318.84±12.63 321.27±14.82
Na 36.54±1.75 34.07±1.18 33.98±1.28
Fe 1.63±0.15 1.26±0.12 1.18±0.17
Table 8. Mineral analysis of different pomegranate bagasses (mg/100g)
Parameters Kandhari Desi Badana
K 221.14±8.26 202.23±9.14 193.54±7.18
P 11.94±2.01 8.27±1.48 7.69±1.37
Mg 19.61±1.18 17.55±1.95 12.96±1.11
Ca 60.11±3.69 58.73±4.21 54.25±2.32
Na 44.07±1.17 43.77±1.51 37.82±2.58
Fe 1.29±0.14 1.72±0.16 1.12±0.11

48
4.2. Antioxidant potential of pomegranate peel and bagasse extracts
Mean squares in Table 9 & Table 10 illuminated that antioxidant indices of both
pomegranate peel and bagasse extracts were momentously affected by treatments and
solvents though, their interactive effect showed non-significant trend except for total
flavonoid content of pomegranate bagasse.
The means for pomegranate peel of different varieties (Table 11) showed that the highest
total phenolic contents (TPC) 259.05±27.40 mg/g GAE was observed in Kandhari peel
followed by 238.60±31.29 mg/g GAE in Desi and the lowest value 220.00±32.56
mg/g GAE
was recorded in Badana peel. Whereas, means regarding different solvents revealed
maximum TPC in methanol 272.68±17.03 mg/g GAE followed by ethanol 231.69±19.14
mg/g GAE and ethyl acetate extract 213.28±22.46 mg/g GAE.
Likewise, means for total flavonoid contents (TFC) in pomegranate peel of different varieties
(Table 12) exposed that the maximum value was noticed in methanol (54.9±3.89 mg/g RE)
followed by ethanol (50.77±4.78 mg/g RE) and minimum output (42.10±4.00 mg/g RE) was
recorded in ethyl acetate extract. The values for TFC were also recorded highest in variety
Kandhari (53.53±6.14 mg/g RE) as compared to Desi (48.89±7.81 mg/g RE) and Badana
(45.34±5.72 mg/g RE). Similarly, Kandhari peel (Table 13) exhibited the highest DPPH
activity (70.66±7.44%) than Desi (66.21±7.50%) and Badana (61.96±4.99%). The mean
values for solvent showed maximum DPPH activity in methanolic extract (72.41±5.87%)
followed by ethanol (67.12±3.88%) and ethyl acetate (59.29±3.58%).
On the other hand, means for solvents regarding pomegranate bagasse indicated highest TPC
(Table 14), TFC (Table 15) and DPPH (Table 16) values for methanolic extract as
31.72±4.75 mg/g GAE, 8.74±2.48 mg/g RE & 43.34±5.97 % followed by ethanolic extracts
having values 26.27±4.26 mg/g GAE, 7.18±2.64 mg/g RE & 37.04±5.77 % and lowermost
values were recorded in case of ethyl acetate extract i.e. 22.72±3.76 mg/g GAE, 5.32±1.62
mg/g RE & 32.94±4.55 %, respectively. In the same way, means for effect of pomegranate
varieties explicated highest TPC (30.67±4.72 mg/g GAE), TFC (8.86±1.91 mg/g RE) and
DPPH (42.30±5.75 %) in bagasse of Kandhari as compared to Desi variety that showed
values of 27.74±5.01 mg/g GAE, 7.79±2.12 mg/g RE and 39.24±5.59 % for TPC, TFC and
DPPH correspondingly. While minimum values for TPC, TFC and DPPH were noticed in

49
Table 9. Mean squares for antioxidant indices of pomegranate peel extracts
SOV df TPC TFC DPPH
Treatments (A) 2 3432.98**
151.684**
170.031**
Solvents (B) 2 8322.98**
383.929**
392.281**
A×B 4 25.55 NS
5.297 NS
8.724NS
Error 18 109.55 8.085 11.174
NS=Non-significant
**=Highly significant
Table 10. Mean squares for antioxidant indices of pomegranate bagasse extracts
SOV df TPC TFC DPPH
Treatments (A) 2 162.588**
44.8011**
263.842**
Solvents (B) 2 184.665**
26.3971**
247.150**
A×B 4 1.121NS
1.2895**
2.868NS
Error 18 2.125 0.0833 4.499
NS=Non-significant
**=Highly significant

50
Table 11. Total phenolic contents (mg/g GAE) of peel extracts
Parameters Methanol Ethanol Ethyl Acetate Mean
Kandhari 289.40±12.75 251.62±10.82 236.12±8.38 259.05±27.40a
Desi 273.30±9.30 230.01±7.25 212.50±11.54 238.60±31.29b
Badana 255.35±11.89 213.44±10.33 191.21±10.76 220.00±32.56c
Mean 272.68±17.03a 231.69±19.14
b 213.28±22.46c
Table 12. Total flavonoid contents (mg/g RE) of peel extracts
Parameters Methanol Ethanol Ethyl Acetate Mean
Kandhari 58.63±3.41 55.26±2.25 46.71±3.69 53.53±6.14a
Desi 55.21±2.65 51.32±3.01 40.16±2.11 48.89±7.81b
Badana 50.86±2.91 45.74±2.14 39.44±2.98 45.34±5.72c
Mean 54.90±3.89a 50.77±4.78
b 42.10±4.00c

51
Table 13. Free radical scavenging (DPPH %) activity of peel extracts
Parameters Methanol Ethanol Ethyl Acetate Mean
Kandhari 78.23±4.11 70.38±4.27 63.36±3.45 70.66±7.44a
Desi 72.53±3.32 68.17±2.45 57.92±3.30 66.21±7.50b
Badana 66.48±3.20 62.82±3.29 56.59±2.12 61.96±4.99c
Mean 72.41±5.87a 67.12±3.88
b 59.29±3.58c

52
badana variety as 22.30±3.86 mg/g GAE, 4.58±1.21 mg/g RE & 31.77±4.46%, respectively.
The outcomes regarding total phenolic contents in the present investigation are corroborated
with the results documented by Ardekani et al. (2011). They inspected the antioxidant
potential of different pomegranate cultivars through estimation of total phenolic and total
flavonoid contents and concluded highest TPC and TFC in peel extracts of pomegranate i.e.
98.24-250.13 mg/g GAE and 18.61-36.40 mg/g CE as compared to pulp extracts that were
recorded as 11.62-21.03 mg/g GAE and 0.84-2.14 mg/g CE, respectively. They further
expressed that values for TPC and TFC varied depending upon the type of variety, maturity
stage and season of harvesting. These results noticeably show that peel extract enclosed more
antioxidant activity than observed in pulp extract. Reported data is in conformity with the
findings of Tomas-Barberan et al. (2001), who concluded that fruit peel tissues are generally
rich source of phenolics and flavonoids as compared to flesh tissues in plums and peaches.
Likewise, Singh and Immanuel (2014) explored the phenolic concentration in peels of
different fruits including pomegranate, lemon & orange and noticed 249.41, 211.70 & 169.56
mg/g GAE TPC values, respectively. Previously, Pande and Akoh (2009) inspected the
antioxidant capacity of pomegranate peel, leaves and seeds. For this purpose, they conducted
poly-phenolic estimation and recorded highest value of TPC in leaves (365 mg/g GAE)
followed by peel (311 mg/g GAE) and seed (89 mg/g GAE), correspondingly.
Afterwards, Shiban et al. (2012) compared extracts of different solvents like methanol, water
and ether for the evaluation of total phenolic contents (TPC) in pomegranate peel. They were
of the view that methanol was extra effective than water and ether extracts owing to their
polarity differences. They recorded TPC in methanol, water and ether as 274.1, 91.2 and 08.5
mg/g GAE, respectively. Similarly in a research, Manasathien et al. (2012) elucidated that
ethanol exhibits better affinity for pomegranate peel polyphenols than water. They stated
total phenolic and total flavonoid contents as 449.60 µg/mg GAE and 38.44 µg/mg CE for
ethanolic extract that were comparatively higher than observed in case of water extract i.e.
380.54 µg/mg GAE and 26.04 µg/mg CE.
Earlier, Li et al. (2006) probed pulp and peel of pomegranate for total phenolic and total
flavonoid contents. They used different solvents namely methanol, ethanol, acetone and

53
Table 14. Total phenolic contents (mg/g GAE) of bagasse extracts
Parameters Methanol Ethanol Ethyl Acetate Mean
Kandhari 35.69±1.24 30.01±1.01 26.32±1.57 30.67±4.72a
Desi 33.01±1.35 27.17±1.21 23.03±1.95 27.74±5.01b
Badana 26.45±1.61 21.62±1.91 18.82±0.88 22.30±3.86c
Mean 31.72±4.75a 26.27±4.26
b 22.72±3.76
c
Table 15. Total flavonoid contents (mg/g RE) of bagasse extracts
Parameters Methanol Ethanol Ethyl Acetate Mean
Kandhari 10.70±0.44a 9.01±0.10
bc 6.89±0.36
d 8.86±1.91
a
Desi 9.57±0.11b 8.37±0.31
c 5.43±0.22
e 7.79±2.12
b
Badana 5.95±0.25c 4.15±0.15
f 3.64±0.41
f 4.58±1.21
c
Mean 8.74±2.48a 7.18±2.64
b 5.32±1.62
c

54
Table 16. Free radical scavenging (DPPH %) activity of bagasse extracts
Parameters Methanol Ethanol Ethyl Acetate Mean
Kandhari 48.00±3.22 42.39±1.87 36.50±1.57 42.30±5.75a
Desi 45.42±3.14 37.80±2.11 34.51±1.09 39.24±5.59b
Badana 36.60±1.88 30.92±1.91 27.80±1.21 31.77±4.46c
Mean 43.34±5.97a 37.04±5.77
b 32.94±4.55
c

55
mixture of all these solvents for antioxidant extraction. Furthermore, they subjected these
extracts to Folin-Coicalteu assay and colorimetric method for the quantification of TPC and
TFC, respectively and observed higher TPC and TFC i.e. 249.4 mg/g GAE and 59.1 mg/g RE
in peel samples as compared to 24.4 mg/g GAE and 17.2 mg/g RE for pomegranate pulp
samples, respectively. Likewise, Singh et al. (2002) extracted antioxidants using water,
methanol and acetone and concluded that methanolic extracts have maximum antioxidant
yield, mainly due to the ascribed polarity differences among the type of solvent and nature of
bioactive compounds to be extracted.
The results concerning total phenolic content (TPC) and total flavonoid content (TFC) of
pomegranate bagasse in present exploration are in accordance with the outcomes of Elfalleh
et al. (2012). They assessed the values of these attributes 7.94-11.84 mg/g GAE and 3.30-
6.79 mg/g RE, respectively in aqueous and methanolic extracts of commercially available
pomegranate variety known as Gabsi. Likewise, Manasathien et al. (2012) elucidated TPC in
pomegranate seed ethanolic extract (PSE/e) and pomegranate seed water extract (PSE/w) as
77.93 µg/mg GAE and 51.58 µg/mg GAE. They also recorded TFC as 16.66 µg/mg CE and
10.55 µg/mg CE in case of PSE/e and PSE/w, correspondingly. Previously, Viuda-Martos et
al. (2011) characterized TFC in pomegranate bagasses obtained by two different methods,
firstly bagasse obtained by crushing whole pomegranate fruit including peel and arils (WFB)
and secondly obtained just from arils (AB). They noticed higher TFC in WFB i.e. 7.19 mg/g
RE as compared to 5.71 mg/g RE for AB. In current study some variations in TPC values of
bagasse are due to varietal variation, maturity, climate, storage conditions, growing region
and method used for obtaining bagasse (Poyrazoglu et al., 2002). These polyphenolic
compounds are known for their free radical scavenging properties that ultimately inhibit lipid
oxidation (Noda et al., 2002).
Similarly, Niknahad et al. (2012) stated a direct association between type of solvent used for
pomegranate polyphenol extraction and antioxidant activity. The results regarding DPPH
activity of present study are supported by the findings of Singh et al. (2002). They calculated
the effect of different concentrations on DPPH activity of pomegranate peel and seed. In their
results they interpreted that polyphenol concentration has linear correlation with DPPH
activity and observed free radical scavenging activity in pomegranate peel methanolic extract
& seed water extract as 81% & 39.6% at polyphenolic concentration of 50 ppm and 100 ppm,

56
respectively. Later, Middha et al. (2013a) also probed the effect of polyphenolic
concentration on free radical quenching ability. They altered the concentration of
pomegranate peel extracts comprising of biologically active compounds from 10 to 100
µg/mL and observed a direct correlation among DPPH activity and polyphenolic
concentration as 10 to 40 and 25 to 60% in aqueous and methanolic extract, correspondingly.
Previously, Orak et al. (2012) noticed that pomegranate peel (PP) has greater free radical
scavenging activity (77.02-86.36%) than that of juice (1.44-7.58%) and seed fractions
(20.07-62.65%). Earlier, Viuda-Martos et al. (2011) observed the antioxidant prospective of
aril bagasse and whole fruit bagasse through DPPH assay, the result for the tested parameters
varied from 17.19-75.92 and 48.9- 92.24%, respectively. Amongst many systematic routes
on the topic of antioxidant action of pomegranate polyphenols, single electron transfer
mechanism is most understandable due to its capability to donate one electron thus reduces
free radicals, metals & carbonyls and terminates lipid oxidation process at initiation step
furthermore, hydrogen atom transfer also helps to quench free radicals through hydrogen
donation (Yen and Chen, 1995; Wright et al., 2001).
From the above mentioned discussion, it can be clearly concluded that antioxidant indices of
pomegranate peel and bagasse are affected by both the type of variety and nature of solvent.
Conclusively, all tested extracts demonstrated good antioxidant power but, methanolic
extract exhibited better performance as compared to ethanol and ethyl acetate extracts in case
of both peel and bagasse. Amongst various varieties of pomegranate peels and bagasses,
kandhari variety presented better performance regarding polyphenolic estimation.
4.3. HPLC quantification of Punicalagin
Mean squares depicted in Table 17 exhibited substantial effect of treatments and solvents on
the punicalagin content in both peel and bagasse. On the other hand, their interactive effect
explicated non-significant variations.
The means for peel varieties indicated highest punicalagin in Kandhari (110.59±8.84 mg/g)
trailed by Desi (98.41±10.75 mg/g) and lowest value (79.11±10.53 mg/g) was observed in
Badana peel. Considering the solvents, the mean punicalagin content for methanol, ethanol
and ethyl acetate were 105.77±15.39, 96.46±15.64 and 85.89±16.81 mg/g, respectively
(Table 18). Similarly, means for pomegranate bagasse illuminated that maximum punicalagin

57
Table 17. Mean squares for HPLC quantification of Punicalagin
SOV df Punicalagin (peel) Punicalagin (bagasse)
Treatments (A) 2 2267.14**
1.95143**
Solvents (B) 2 889.71**
1.40443**
A×B 4 12.39NS
0.01013NS
Error 18 17.39 0.00414
NS=Non-significant
**=Highly significant
Table 18. HPLC quantification of Punicalagin in peel extracts (mg/g)
Parameters Methanol Ethanol Ethyl Acetate Mean
Kandhari 118.60±5.26 112.07±4.96 101.10±3.42 110.59±8.84a
Desi 110.00±5.10 96.50±3.46 88.74±4.25 98.41±10.75b
Badana 88.70±2.21 80.80±4.01 67.84±3.93 79.11±10.53c
Mean 105.77±15.39a 96.46±15.64
b 85.89±16.81
c

58
Table 19. HPLC quantification of Punicalagin in bagasse extracts (mg/g)
Parameters Methanol Ethanol Ethyl Acetate Mean
Kandhari 2.12±0.04 1.88±0.05 1.32±0.01 1.77±0.41a
Desi 1.45±0.07 1.13±0.02 0.67±0.08 1.08±0.39b
Badana 1.29±0.13 0.86±0.06 0.51±0.03 0.89±0.39c
Mean 1.62±0.44a 1.29±0.52
b 0.83±0.42
c

59
was observed in case of bagasse obtained from variety Kandhari (1.77±0.41 mg/g) followed
by Desi (1.08±0.39 mg/g) and minimum (0.89±0.39 mg/g) was observed in Badana bagasse.
While, means for solvents regarding pomegranate bagasse (Table 19) exhibited values of
1.62±0.44, 1.29±0.52 and 0.83±0.42 mg/g punicalagin in methanolic, ethanolic and ethyl
acetate extracts, subsequently.
The present results are in harmony with the investigations of Lu et al. (2008), they explored
pomegranate husk obtained from different varieties in China for their punicalagin contents
through high performance liquid chromatography. For this purpose, they used RP-HPLC
(reverse phase high performance liquid chromatography) equipped with C18 column and
quantified maximum punicalagin concentration in Red ruby (121.5 mg/g) and minimum in
Changsha variety (44.9 mg/g) husks. They also noticed punicalagin content in two varieties
of dried pomegranate husk available in drug store from province Heibei (97.3 mg/g) and
Guangdong (39.8 mg/g).
In another research, Seeram et al. (2005) carried out purification of ellagitannins from
pomegranate peel and revealed that 1 kg of pomegranate husk contains 58-60 grams total
pomegranate tannins (TPT). Furthermore, they evaluated purified TPT through HPLC and
were of a view that TPT comprises of 80-85% (w/w) punicalagin; major ellagitannin present
in pomegranate fruit responsible for its potent antioxidant power. Afterwards, Cam and Hisil
(2010) examined pomegranate by-product i.e. peel for their punicalagin content. They
established that pomegranate peels that were extracted by using pressurized water had 116.6
mg/g punicalagin contents. Likewise, Fischer et al. (2010) revealed punicalagin content
ranging from 11-20 g/kg on dry weight basis in peel & mesocarp, whereas, 4-565 mg/L in
pomegranate juice. In the current case, some variations regarding punicalagin contents may
be due to the varietals & climatic variations, geographical location and agronomic practices.
Additionally, HPLC quantification revealed that pomegranate peel and bagasse extracts
contain significant amount of punicalagin. Likewise, pomegranate peel characterization
indicated that Kandhari variety had highest amount of punicalagin whilst Badana had lowest.
However, among the tested extracts, methanol showed appreciable amount of punicalagin in
case of peel and bagasse both. Therefore, owing to its antioxidant potential due to presence
of punicalagin, it can be further used in product development and incorporated in the diet

60
based module for combating various metabolic syndromes.
4.4. Value added/functional drink analysis
Color is the primary perceptual discriminating factor for the rational product selection by the
consumer. The color of beverages is measured by CIELAB color system that indicates L* for
lightness-darkness, a* for greenish to reddish tinge whilst b* for bluish to yellowish tint.
Mean squares for the color of value added drinks (Table 20) exposed significant effect of
treatment and storage on L*, a*, b*, Chroma and hue angle, while their interaction was
observed non-significant.
The means related to L* values of value added drinks are depicted in Table 21. The values
for control (D0), drink containing peel extract (D1) and drink containing bagasse extract (D2)
were 30.73±1.88, 27.11±1.21 and 29.02±1.61. Whereas, the storage values presented a
significant decline for this trait at 0, 30th
and 60th
day i.e. 27.58±1.15, 28.64±1.80 and
30.64±2.16, respectively. Moreover, values for a* were significantly affected by D0, D1 and
D2 during storage. In this context, a* values for treatments D0, D1 and D2 were 35.77±1.61,
38.37±1.05 and 37.38±1.60, respectively. While during storage interval, the values for a*
decreased substantially from 38.61±1.19 to 35.79±1.65 (Table 22).
Similarly, values for b* also showed significant variations in different value added drinks
(Table 23). The highest value was documented for D1 (8.18±0.07), followed by D2
(8.15±0.11), whereas, minimum in D0 (8.11±0.11). Likewise, a momentous decrease was
noticed for this trait with the progression of storage study. The documented values for b*
were 8.23±0.02, 8.16±0.04 and 8.05±0.06, respectively at 0, 30th
and 60th
day. Regarding
chroma and hue angle, the recorded values for D0, D1 & D2 were 36.68±1.59, 39.23±1.05 &
38.26±1.60 and 12.79±0.39, 12.04±0.23 & 12.31±0.36, correspondingly. Additionally, at 0,
30th
and 60th
day presented values of chroma significantly declined from 39.48±1.17 to
36.69±1.63. However values for hue angle increased from 12.04±0.34 to 12.68±0.49,
respectively (Table 24 & 25).
Earlier, Pérez-Vicente et al. (2004) investigated the influence of different packaging
materials on color of pomegranate juice and noticed a decreasing trend in a* value with

61
Table 20. Mean squares for color tonality of value added drinks
SOV df L* a* b* Chroma Hue angle
Treatments (A) 2 29.46**
15.43* 0.012
* 14.902
* 1.295
*
Days (B) 2 21.7214* 17.9604
** 0.07923
** 17.6340
** 0.93029
*
A×B 4 0.6342NS
0.5028NS
0.00183NS
0.4883NS
0.04284NS
Error 18 1.0648 1.1795 0.00263 1.1321 0.11797
NS=Non-significant
**=Highly significant
*= Significant

62
Table 21. Effect of treatments and storage on L* value of value added drinks
Storage
intervals (days)
Treatments
Means
D0 D1 D2
0 28.91±1.01 25.93±0.97 27.89±1.11 27.58±1.15b
30 30.59±1.04 27.04±1.13 28.29±1.03 28.64±1.80b
60 32.68±1.02 28.36±1.05 30.87±0.91 30.64±2.16a
Means 30.73±1.88a 27.11±1.21
c 29.02±1.61b
D0 = Control drink
D1 = Drink containing pomegranate peel extract
D2 = Drink containing pomegranate bagasse extract
Table 22. Effect of treatments and storage on a* value of value added drinks
Storage
intervals (days)
Treatments Means
D0 D1 D2
0 37.25±1.31 39.45±0.96 39.15±0.85 38.61±1.19a
30 36.02±1.34 38.31±1.12 37.01±1.04 37.11±1.14b
60 34.05±1.01 37.34±1.06 35.99±0.99 35.79±1.65c
Means 35.77±1.61b 38.37±1.05
a 37.38±1.60a
D0 = Control drink
D1 = Drink containing pomegranate peel extract
D2 = Drink containing pomegranate bagasse extract

63
Table 23. Effect of treatments and storage on b* value of value added drinks
Storage
intervals (days)
Treatments Means
D0 D1 D2
0 8.21±0.01 8.24±0.06 8.25±0.85 8.23±0.02a
30 8.12±0.03 8.19±0.04 8.16±1.04 8.16±0.04b
60 7.99±0.08 8.11±0.01 8.04±0.99 8.05±0.06c
Means 8.11±0.11b 8.18±0.07
a 8.15±0.11ab
D0 = Control drink
D1 = Drink containing pomegranate peel extract
D2 = Drink containing pomegranate bagasse extract
Table 24. Effect of treatments and storage on Chroma of value added drinks
Storage
intervals (days)
Treatments Means
D0 D1 D2
0 38.14±1.28 40.30±0.95 40.01±0.84 39.48±1.17a
30 36.92±1.31 39.18±1.09 37.90±1.02 38.00±1.12b
60 34.98±0.97 38.21±1.04 36.88±0.98 36.69±1.63c
Means 36.68±1.59b 39.23±1.05
a 38.26±1.60a
D0 = Control drink
D1 = Drink containing pomegranate peel extract
D2 = Drink containing pomegranate bagasse extract

64
Table 25. Effect of treatments and storage on hue angle of value added drinks
Storage
intervals (days)
Treatments Means
D0 D1 D2
0 12.44±0.41 11.80±0.19 11.90±0.18 12.04±0.34b
30 12.72±0.41 12.07±0.40 12.44±0.31 12.41±0.33ab
60 13.21±0.51 12.25±1.04 12.59±0.20 12.68±0.49a
Means 12.79±0.39a 12.04±0.23
b 12.31±0.36b
D0 = Control drink
D1 = Drink containing pomegranate peel extract
D2 = Drink containing pomegranate bagasse extract

65
passage of storage study. They recorded increase in L* values from 28 to 42 and therefore
reduction in a* values from 64 to 48 in pomegranate stored in glass bottles over a storage
period of 180 days. Similarly, one researcher group Orak et al. (2012) observed L* values
ranged from 14.81 to 19.69, 51.88 to 56.67 and 64.33 to 69.24 in juice, seed and peel
fractions of four different varieties of pomegranate that are comparable with instant results.
They also confirmed b* value for pomegranate juice in genotype 19-66 and genotype 19-121
as 4.72 to 10.45, respectively. The rise in L* (lightness) value in this instant study is due to
oxidation resulting in color degradation. It is worth mentioning that decrease in a* value is
directly correlated with decline in pigment concentration causing increase in brightness (L*)
of value added drink as storage study progressed. Whereas, treatments showed significant
increase in a* values because extracts added have cache of polyphenols in them, responsible
for reduction in oxidation process as compared to control. The polyphenols retain the color
thus helps in maintaining the keeping quality of juices by inhibiting the oxidation of color
imparting pigments (Melendez-Martinez et al. 2011).
Mean squares showed non-substantial effect of treatments on acidity, pH and TSS of the
formulated drinks. However, storage interval substantially affected these traits except for
TSS (Table 26).
Acidity in value added drinks i.e. D0, D1 and D2 was observed as 0.167±0.014, 0.161±0.011
& 0.163±0.014%, respectively. However, storage imparts substantial increase in acidity from
0.152±0.002 to 0.178±0.004 at 0 and 60th
day, correspondingly (Table 27). Likewise, pH
values for value added drinks were documented as 4.49±0.16, 4.48±0.08 and 4.47±0.09 for
D0, D1 and D2, congruently. During 60 days of storage interval, pH of the drinks significantly
reduced from 4.58±0.03 to 4.36±0.05 (Table 28). Total soluble solids (TSS) of the respective
value added drinks were 1.75±0.02, 1.78±0.01 and 1.76±0.01 indicating a non-momentous
rise. Though, storage exhibited non-substantial decrease in TSS and recorded values at 0 &
60th
day were 1.78±0.01 and 1.75±0.02, correspondingly (Table 29). The possible
mechanism for reduction in pH with elevated acidity is due to the breakdown of aspartame to
aspartic acid with the passage of time moreover, the acidic nature of added artificial
sweetener may alter acidity during storage. The results about physiochemical parameters of
value added drinks are in agreement with the outcomes of Omodamiro et al. (2012).

66
Table 26. Mean squares for acidity, pH and TSS of value added drinks
SOV Df Acidity pH TSS
Treatments (A) 2 0.00008NS
0.00063NS
0.00253NS
Days (B) 2 0.00151**
0.11743**
0.00263NS
A×B 4 0.00002NS
0.00593NS
0.00003NS
Error 18 0.00001 0.00111 0.00164
NS=Non-significant
**=Highly significant
Table 27. Effect of treatments and storage on acidity (%) of value added drinks
Storage
intervals (days)
Treatments Means
D0 D1 D2
0 0.154±0.001 0.153±0.005 0.151±0.005 0.152±0.002c
30 0.166±0.003 0.157±0.003 0.159±0.001 0.160±0.005b
60 0.181±0.002 0.174±0.006 0.179±0.004 0.178±0.004c
Means 0.167±0.014 0.161±0.011 0.163±0.014
D0 = Control drink
D1 = Drink containing pomegranate peel extract
D2 = Drink containing pomegranate bagasse extract

67
Table 28. Effect of treatments and storage on pH of value added drinks
Storage
intervals (days)
Treatments Means
D0 D1 D2
0 4.62±0.02 4.57±0.06 4.56±0.03 4.58±0.03
a
30 4.55±0.04 4.49±0.01 4.50±0.03 4.51±0.03
b
60 4.31±0.01 4.40±0.02 4.37±0.05 4.36±0.05
c
Means 4.49±0.16 4.48±0.08 4.47±0.09
D0 = Control drink
D1 = Drink containing pomegranate peel extract
D2 = Drink containing pomegranate bagasse extract
Table 29. Effect of treatments and storage on TSS of value added drinks
Storage
intervals (days)
Treatments Means
D0 D1 D2
0 1.77±0.01 1.80±0.05 1.78±0.04 1.78±0.01
30 1.76±0.02 1.79±0.04 1.77±0.05 1.77±0.01
60 1.73±0.06 1.77±0.03 1.75±0.04 1.75±0.02
Means 1.75±0.02 1.78±0.01 1.76±0.01
D0 = Control drink
D1 = Drink containing pomegranate peel extract
D2 = Drink containing pomegranate bagasse extract

68
They documented inverse correlation between acidity and pH of ginger based functional
drinks during storage. Earlier, Ayub et al. (2010) revealed momentous impact of storage time
on strawberry juice pH under controlled conditions. They reported that pH decreased
significantly from 3.29 to 2.22 at 0 to 90 days however treatment imparted non-significant
differences. Similarly, acidity increased from 1.39 to 2.38% during the entire study. Earlier,
Klimczak et al. (2007) also noticed a decline in pH and increment in the acidity of orange
juice during storage. One of the peers, Ahmed et al. (2008) inferred that breakdown of sugars
to carboxyl acids and acidic nature of aspartame were the main causes that tempted
deviations in acidity and pH in mandarin ready to serve (RTS) drink.
Similarly, Coda et al. (2012) developed vegetable based yoghurt like beverage prepared from
concentrated grapes musts, mixed cereals like rice, barley, oat etc. & soy flours and noticed
an inverse relationship between pH and acidity during 30 days of storage interval. One of the
researchers groups, Kausar et al. (2012) also prepared a functional beverage based on blend
of cucumber & melon and recorded an elevation in acidity from 0.44-0.51%, reduction in pH
from 4.89-4.77 and TSS were found to be increased from 15.39 to 16.24% during 4 months
storage study. In this context, Mishra et al. (2012) documented TSS, acidity and pH of
vitamin C enriched value added drink formulated by blending amla and grape juices during 2
months storage trial. The pH decreased from 4.02 to 3.41 whereas acidity increased from
0.40 to 0.49 during the entire study. They assigned these changes due to the breakdown of
acids present in lemon drink. Recently, Ahmad et al. (2012) exhibited an inverse relation
between pH & acidity of catechins-enriched polyphenolic value added beverage during
storage. They were of the view that storage had momentous effect both on pH and acidity,
pH decreased from 4.70 to 4.20 and acidity increased from 0.14 to 0.21% in time interval of
0-60 days; however treatments had non-significant effect on both parameters.
Mean squares for antioxidant indices of value added drinks elucidated significant difference
due to treatments and storage; however their interaction did not impart any momentous effect
(Table 30).
Means regarding TPC, TFC and DPPH for treatments and storage are illustrated in Figure 1
and Figure 2, respectively. The total phenolic contents (TPC) for treatments D1 and D2 were

69
Table 30. Means square for antioxidant indices of value added drinks
SOV Df TPC TFC DPPH
Treatments (A) 1 789**
59.46**
252.63**
Days (B) 2 183345**
7669.41**
2322.89**
A×B 2 309NS
4.14NS
2.31NS
Error 12 53 5.64 8.53
NS=Non-significant
**=Highly significant

70
Figure 1. Effect of treatments on antioxidant indices of value added drinks
Figure 2. Effect of storage on antioxidant indices of value added drinks
A
A A
B
B
B
0
50
100
150
200
250
TPC TFC DPPH
D1
D2
A
A
A
B
A
A
B
B
B
0
20
40
60
80
100
120
140
TPC TFC DPPH
0
30
60

71
documented as 230.32±18.46 and 28.47±5.00 mg/g GAE, respectively. Besides TFC and
DPPH values for treatments D1 & D2 were 49.44±3.95 & 8.16±2.36 mg/g RE and 61.56±6.64
& 38.84±6.39%, respectively. Likewise, during storage study the recorded values for TPC
varied from 141.85 (0 days) to 119.28 mg/g GAE (60 days), indicating a significant decline.
Similarly, a decreasing trend for TFC and DPPH was noted that varied from 31.73 to 25.38
mg/g RE and 55.84 to 43.11%, correspondingly from commencement to end of the storage
study.
The present results for antioxidant & bioactive compounds reduction during storage are
supported by the work of Varela-Santos et al. (2012). They evaluated the stability of
pomegranate juice during thirty five days of storage and determined that oxidation,
temperature and light exposure were the chief factors responsible for degradation of phenolic
compounds. During storage interval, total phenolic content decreased from 1361.87 to 916.36
mg GAE per liter. The decline of phenolics and antioxidant activity in this present
investigation was due to degradation and oxidation of punicalagin during storage.
Likewise, Ventura et al. (2013) elucidated a similar deteriorating trend in the TPC and
antioxidant potential of pomegranate juice jelly supplemented with pomegranate peel
aqueous extract during eight weeks storage. They indicated a decline in DPPH activity up to
18.90% in control and 6.75% in jelly that was supplemented with pomegranate peel extract.
Furthermore, they demonstrated direct association between presence of pomegranate
phenolics and antioxidant stability of product. Bioactive compound in pomegranate is
punicalagin, higher the content of punicalagin less shall be the reduction in antioxidant
potential and oxidation rate.
4.5. Sensory evaluation
Sensory assessment of food containing bioactive phytochemicals is key step to evaluate
consumer response. Therefore, the developed value added drinks were evaluated by
following 9-point hedonic scale system for quality attributes like color, flavor, sourness,
sweetness and overall acceptability.
Means square for all the sensory attributes illustrates substantial difference as a function of
treatments and storage except for flavor and sourness scores that differed non-significantly

72
Table 31. Mean squares for sensory evaluation of value added drinks
SOV df Color Flavor Sourness Sweetness Overall acceptability
Treatments (A) 2 0.01823* 0.0052
NS 0.00423
NS 0.01043
* 0.0273
*
Days (B) 2 0.22863**
0.0196* 0.14583
** 0.15843
** 0.1651
**
A×B 4 0.00163NS
0.0005NS
0.00303NS
0.00448NS
0.01NS
Error 18 0.00139 0.00202 0.00141 0.00147 0.00309
NS=Non-significant
**=Highly significant
*= Significant

73
Table 32. Effect of treatments and storage on color of value added drinks
Storage
intervals (days)
Treatments Means
D0 D1 D2
0 7.59±0.01 7.63±0.03 7.61±0.04 7.61±0.02
a
30 7.43±0.04 7.53±0.07 7.49±0.01 7.48±0.05
b
60 7.23±0.02 7.36±0.02 7.29±0.05 7.29±0.07
c
Means 7.42±0.18
b 7.51±0.14
a 7.46±0.16
a
D0 = Control drink
D1 = Drink containing pomegranate peel extract
D2 = Drink containing pomegranate bagasse extract
Table 33. Effect of treatments and storage on flavor of value added drinks
Storage
intervals (days)
Treatments Means
D0 D1 D2
0 7.54±0.02 7.56±0.03 7.58±0.07 7.56±0.02
a
30 7.49±0.03 7.51±0.05 7.54±0.04 7.51±0.03
ab
60 7.43±0.05 7.49±0.06 7.48±0.03 7.47±0.03
b
Means 7.49±0.06 7.52±0.04 7.53±0.05
D0 = Control drink
D1 = Drink containing pomegranate peel extract
D2 = Drink containing pomegranate bagasse extract

74
Table 34. Effect of treatments and storage on sourness of value added drinks
Storage
intervals (days)
Treatments Means
D0 D1 D2
0 7.61±0.04 7.59±0.02 7.57±0.02 7.70±0.02
a
30 7.39±0.05 7.45±0.04 7.43±0.04 7.63±0.03
b
60 7.29±0.01 7.38±0.06 7.35±0.03 7.45±0.05
c
Means 7.43±0.16 7.47±0.10 7.45±0.11
D0 = Control drink
D1 = Drink containing pomegranate peel extract
D2 = Drink containing pomegranate bagasse extract
Table 35. Effect of treatments and storage on sweetness of value added drinks
Storage
intervals (days)
Treatments Means
D0 D1 D2
0 7.43±0.01 7.41±0.01 7.46±0.06 7.43±0.03
a
30 7.22±0.03 7.31±0.02 7.29±0.05 7.27±0.05
b
60 7.11±0.06 7.23±0.04 7.17±0.02 7.17±0.06
c
Means 7.25±0.16
b 7.32±0.09a 7.31±0.15
a
D0 = Control drink
D1 = Drink containing pomegranate peel extract
D2 = Drink containing pomegranate bagasse extract

75
Table 36. Effect of treatments and storage on overall acceptability of value added drinks
Storage
intervals (days)
Treatments Means
D0 D1 D2
0 7.57±0.09 7.61±0.03 7.56±0.07 7.58±0.03
a
30 7.43±0.06 7.57±0.01 7.51±0.03 7.50±0.07
b
60 7.21±0.02 7.33±0.08 7.41±0.05 7.32±0.10
c
Means 7.40±0.18
b 7.50±0.15a 7.49±0.08
a
D0 = Control drink
D1 = Drink containing pomegranate peel extract
D2 = Drink containing pomegranate bagasse extract

76
by treatments (Table 31). However, interaction of all the parameters was found to have non-
momentous effect on all sensory traits.
Maximum scores for color (Table 32) were assigned to D1 (7.51±0.14) trailed by D2 (7.46±0.16)
and D0 (7.42±0.18). Likewise, storage interval also led to decline in color scores from 7.61±0.02
to 7.29±0.07 during the entire period of storage. Statistical analysis for flavor scores elucidated
significant difference during storage study and non-substantial variations due to treatments. The
recorded values for flavor were 7.49±0.06 (D0), 7.52±0.04 (D1) and 7.53±0.05 (D2). Storage had
a declining trend on flavor values from commencement to termination of study i.e. 7.56±0.02 to
7.47±0.03 (Table 33).
Means related to sourness (Table 34) explicated non-momentous effect of treatments on this trait.
The documented values for D0, D1 and D2 were 7.43±0.16, 7.47±0.10 and 7.45±0.11,
respectively. Whereas, during storage significant declining trend was observed from 7.70±0.02
to 7.45±0.05 at 0 day and 60th
day, correspondingly. The sweetness score differed significantly
among the treatments and storage, respective scores in treatments D0, D1 & D2 and storage were
depicted as 7.25±0.16 (D0), 7.32±0.09 (D1) & 7.31±0.15 (D2) and 7.43±0.03 (0 day), 7.27±0.05
(30th
day) and 7.17±0.06 (60th
day), respectively (Table 35). Finally, the recorded scores for
overall acceptability in value added drinks D0, D1 and D2 were 7.40±0.18, 7.50±0.15 and
7.49±0.08, respectively. Similarly, during storage substantial decrease in scores of overall
acceptability was recorded from 7.58±0.03 to 7.32±0.10 (Table 36).
Existing results about hedonic response are in accordance with the findings of Ahmed et al.
(2012) they explored the effect of treatments and storage on the sensory profile of functional
drink being enriched with tea polyphenols. For this purpose, four drinks were prepared having
different concentrations of tea polyphenols and were stored for 60 days. They observed non-
significant decline in sensory attributes including flavor and sourness during storage intervals.
The findings of Murtaza et al. (2004) supported the trend in present study for sensory profiling.
They subjected strawberry juice for three months at refrigeration temperature (4-6oC), room
temperature (25oC) and high temperature (40-45
oC). They reported variations in hedonic
response of respective drinks for color, flavor and taste during 90 days storage. According to
their findings loss of color and flavor was ascribed to the elevated acidity. In present study, the
phenolic concentration was recorded highest in D1 therefore showing relatively less detrimental

77
effect on sensory attributes than observed in D2 and D0. The presence of polyphenolic extract in
drinks acts as natural antioxidant thus helps in preventing degradation and deterioration of
coloring compounds during storage interval.
Conclusively, in the present study, pomegranate peel and bagasse based value added drinks
performed better regarding hedonic response and had not any deleterious effect on the developed
value added drinks. The storage interval imparted momentous reduction in scores of color,
flavor, sweetness, sourness and overall acceptability of examined drinks nevertheless, all values
were within acceptable ranges thus depicted their suitability for further utilization in the bio-
evaluation trial.
4.6. Bio-evaluation trials
Bio-efficacy study was conducted to investigate the nutraceutical worth of pomegranate peel and
bagasse polyphenols against lifestyle related ailments with special reference to
hypercholesterolemia and diabetics using experimental Sprague Dawley rats. The feeding trials
were conducted on rodents rather than humans due to organized supervision, planned diet
provision and controlled environmental conditions. In this current exploration, efficacy trial
comprised of three segments including study I (normal rats), study II (hypercholesterolemic rats)
and study III (diabetic rats). Additionally, each study was further divided into three groups G-1,
G-2 and G-3 depending on the drinks i.e. D0, D1 and D2 that they were subjected to respectively.
At the initiation of efficacy trial, some rats were slaughtered to evaluate the baseline values
whilst rest of the rats was scarified at the termination (60th
day) of study. Feed & drink intakes
were recorded on daily basis though, body weight was calculated weekly. Mainly, pomegranate
peel and bagasse extract based drinks were tested against hypercholesterolemia and diabetes. For
better understanding the results of respective studies are inferred statistically to draw a
conclusive approach.
4.6.1. Feed intake
Mean squares depicted in Table 37 for feed intake explicated significant difference due to
treatments and storage intervals however, their interaction showed non-significant effect in all
studies (Study I, II & III).

78
Table 37. Effect of treatments and study weeks on feed intake (g/rat/day)
SOV df
Study I
(Normal rats)
Study II
(Hypercholesterolemic rats)
Study III
(Diabetic rats)
Treatments (A) 2 12.2475* 4.0411
* 4.3929
*
Weeks (B) 7 33.1249**
42.7585**
35.6483**
A×B 14 0.492NS
0.0522NS
0.1146NS
Error 48 0.3283 0.6159 0.5394
NS=Non-significant
**=Highly significant
*= Significant

79
Study-I
Study-II
Study-III
Figure 3. Feed intake in study I, II and III (g/rat/day)
Letters (A-G) shows significant difference (p˂0.05) among weeks, Letters a & b shows significant difference
among treatments
Eb DEb
CDEb B-Eb
A-Db ABCb
ABb Ab
Ga
Fa Ea
DEa CDa
BCa ABa Aa
Gb FGb
EFb DEb
CDb BCb
ABb Ab
15
17
19
21
23
Week 1 Week 2 Week 3 Week 4 Week 5 Week 6 Week 7 Week 8
D0
D1
D2
Fb EFb
DEFb CDEb
BCDb ABCb
ABb Ab
Ga
FGa EFa
DEa
CDa BCa
ABa Aa
Fb EFb DEFb
CDEb BCDb
ABCb ABb
Ab
15
17
19
21
23
Week 1 Week 2 Week 3 Week 4 Week 5 Week 6 Week 7 Week 8
D0
D1
D2
Fb
EFb DEFb CDEb BCDb
ABCb ABb
Ab
Ea DEa
CDEa BCDa
ABCa ABa ABa
Aa
Fb EFb
DEFb CDEb
BCDb ABCb
ABb Ab
14
16
18
20
22
Week 1 Week 2 Week 3 Week 4 Week 5 Week 6 Week 7 Week 8
D0
D1
D2

80
Mean values in Figure 3 revealed (Study I) highest feed intake for drink D1 (pomegranate
peel extract) fed group trailed by D0 (control drink) and D2 (pomegranate bagasse extract)
treated groups as 19.63±2.33, 18.58±1.59 and 18.26±1.84 g/rat/day, respectively. The feed
consumption enhanced gradually as a function of time and at 1st week it was documented as
16.24±0.66, 15.88±0.51, and 15.78±0.27 g/rat/day in groups 1, 2 and 3 that were subjected to
drink D0, D1 and D2 that substantially increased to 20.83±0.72, 22.90±0.22 and 21.09±0.38
g/rat/day, respectively at the end of 8th
week.
Likewise, in Study II, drink D0 administrated group exhibited 19.05±2.16 g/rat/day feed
intake whilst D1 and D2 designated groups showed 19.29±2.32 and 18.68±2.11 g/rat/day in
current trial. With the passage of time feed intake improved, at beginning of study the
observed values were 15.99±0.54, 15.98±0.51 and 15.67±1.14 g/rat/day in groups consuming
drink D0, D1 and D2, respectively. However, at termination of trial (8th
week) the feed intake
values increased to 22.19±1.11, 22.71±0.92 and 21.71±0.36 g/rat/day for respective groups.
Similarly in study III (diabetic rats), group subjected to D1 demonstrated maximum
(19.25±1.80 g/rat/day) feed consumption followed by D0 (18.53±2.14 g/rat/day), whilst
minimum was noticed in D2 i.e. 18.49±2.02 g/rat/day. During time internal of 8 weeks,
values for intake increased from 15.45±0.81 to 21.55±0.65 g/rat/day in case of group relying
on D0 at initiation to termination, respectively. Similarly, in groups utilizing drinks D1 and D2
showed elevation in feed consumption from 16.51±0.53 to 21.65±1.14 and 15.53±1.03 to
21.12±0.23 g/rat/day at 1st and 8
th week, respectively (Figure 3).
4.6.2. Drink intake
Mean squares regarding drink intake represented in Table 38 exhibited non-significant
influence of treatments while, time intervals (weeks) imparted significant differences during
the progression of study.
Means for drink intake (Figure 4) in all studies showed increasing trend with the passage of
time i.e. from 1st to 8
th week. In study I (normal rats) the drink intake at the start of study was
recorded as 19.04±0.56, 19.05±0.49 and 19.03±0.82 mL/rat/day, respectively for groups
administrated to D0, D1 and D2 that enhanced to 25.69±0.55, 25.58±0.87 and 25.75±0.77
mL/rat/day, respectively at the completion (8th
week) of study.

81
Table 38. Effect of treatments and study weeks on drink intake (mL/rat/day)
SOV df
Study I
(Normal rats)
Study II
(Hypercholesterolemic rats)
Study III
(Diabetic rats)
Treatments (A) 2 0.0275NS
0.8064NS
0.1956NS
Weeks (B) 7 47.9806**
41.5965**
46.3122**
A×B 14 0.0028NS
0.0188NS
0.0003NS
Error 48 0.4049 0.5161 0.4166
NS=Non-significant
**=Highly significant
*= Significant

82
Study-I
Study-II
Study-III
Figure 4. Drink intake in study I, II and III (mL/rat/day)
Letters (A-G) shows significant difference (p˂0.05) among weeks
G FG
EF
DE CD
BC AB
A
G FG
EF DE
CD BC
AB A
F EF
DEF
CDE
BCD
BC AB
A
18
20
22
24
26
Week 1 Week 2 Week 3 Week 4 Week 5 Week 6 Week 7 Week 8
D0
D1
D2
F EF
DEF CDE
BCD ABC
AB A
F EF
DEF CDE
BCD ABC
AB A
F EF DEF
CDE BCD
ABC AB
A
21
23
25
27
29
31
Week 1 Week 2 Week 3 Week 4 Week 5 Week 6 Week 7 Week 8
D0
D1
D2
G
FG
EF
DE CD
BC
AB A
E
DE
CD C
BC
AB
A
A
F EF
DE CD
C BC
AB A
18
20
22
24
26
Week 1 Week 2 Week 3 Week 4 Week 5 Week 6 Week 7 Week 8
D0
D1
D2

83
In study II (hypercholesterolemic rats) the documented values for drink intake in D0, D1 and
D2 treated groups at initiation were 21.92±0.43, 21.79±1.18 and 21.80±0.87 mL/rat/day,
respectively that elevated to 28.32±0.63, 27.84±0.63 and 27.76±0.46 mL/rat/day,
respectively at termination of study. Study containing diabetic rats (study III), depicted
maximum drink intake at beginning of 1st week in group that was subjected to D0
(19.89±0.92 mL/rat/day) followed by D1 (19.78±0.26 mL/rat/day) and minimum was noticed
in case of group given drink D2 (19.72±0.44 mL/rat/day) that progressively enhanced at
termination (8th
week) of study i.e. D0 (26.39±0.38 mL/rat/day) trailed by D1 (26.26±0.28
mL/rat/day) whilst D2 showed least value (26.19±0.32 mL/rat/day).
4.6.3. Body weight
It is apparent from Table 39 that mean squares for body weight of Sprague Dawley rats in all
experimented studies were momentously affected by treatments and study time.
Body weight depicted in Figure 5 clearly shows that in the beginning of study I the body
weights in different rats groups that were subjected to drinks D0, D1 and D2 were recorded as
138±4.32, 131±6.32 and 136±4.98 g/rat, respectively that subsequently raised to 245±4.21
g/rat (D0), 228±8.56 g/rat (D1) and 235±10.21 g/rat (D2) at the termination of trial. Means
also indicated maximum weight gain in group given D0 followed by group that was
administrated to D2 whilst lowest was observed in D1. Similar increasing trend in weight was
noticed in experimental groups of study II with the passage of time. The recorded
measurements for group 1 that was administrated to drink D0 at 1st & 8
th weeks were
138±5.43 & 250±5.32 g/rat, respectively while, groups 2 and 3 that were subjected to value
added drinks D1 and D2 correspondingly, had initial and final weights as 133±7.43 &
221±9.66 and 134±6.09 & 230±11.23 g/rat.
Similarly in study III, gain in weight was more significantly pronounced in control group.
During progression of study III, the weight increased from 141±6.54 to 261±6.43, 139±8.54
to 236±10.78 and 138±7.22 to 239±12.34 g/rat in case of groups given drinks D0, D1 and D2,
respectively.

84
Table 39. Effect of treatments and study weeks on body weight (g/rat/week)
SOV df
Study I
(Normal rats)
Study II
(Hypercholesterolemic rats)
Study III
(Diabetic rats)
Treatments (A) 2 473.8* 2246.3
* 1716.6
*
Weeks (B) 7 11210.7**
11688.5**
12504.8**
A×B 14 15.3NS
49.6NS
86.1NS
Error 48 47.3 63.3 81.7
NS=Non-significant
**=Highly significant
*= Significant

85
Study I
Study II
Study III
Figure 5. Body weight in study I, II and III (g/rat/week)
Letters (A-G) shows significant difference (p˂0.05) among weeks, Letters a & b shows significant difference
among treatments
Ga
Fa
Ea DEa
Da
Ca
Ba Aa
Fb
EFb
DEb CDb
BCb ABb
Ab Ab
Gb
FGb
EFb DEb
CDb BCb
ABb A
120
140
160
180
200
220
240
Week 1 Week 2 Week 3 Week 4 Week 5 Week 6 Week 7 Week 8
D0
D1
D2
Ga FGa
EFa DEa
CDa BCa
ABa Aa
Eb Eb DEb
CDb BCb
ABb Ab
Ab
Fb Fb
EFb DEb
CDb
BCb ABb
Ab
120
140
160
180
200
220
240
260
Week 1 Week 2 Week 3 Week 4 Week 5 Week 6 Week 7 Week 8
D0
D1
D2
Ga FGa
EFa DEa
CDa
BCa ABa
Aa
E E DE
CD BC
BC AB
A
Fb EFb DEb
CDb Cb
BCb ABb Ab
120
140
160
180
200
220
240
260
Week 1 Week 2 Week 3 Week 4 Week 5 Week 6 Week 7 Week 8
D0
D1
D2

86
Percent reduction in body weights of experimental rats in respective studies is illustrated in
Figure 6. During study I, value added drinks D1 and D2 aided in reduction of body weight up
to 4.53 and 3.10%, respectively. Highest percent reduction for body weight was noticed due
to drink D1 (9.51%) followed by D2 (7.44%) in study II comprising of hypercholesterolemic
rats. Similarly, in study III (diabetic rats) highest reduction 8.08% was noticed due to
administration of drink D1 whilst minimum of 6.10% reduction was observed due to drink D2.
Intake of caloric rich diet and sedentary lifestyle leads to numerous physiological disorders
like obesity and hyperlipidemia. The amount of weight gain is directly correlated to nature,
volume and type of diet consumed; generally fat rich diet consumption results in increase of
body weight. Numerous scientific explorations indicated an inverse association between
polyphenolic diet consumption and weight gain owing to the presence of bioactive
compounds like catechins, tannins, punicalins, gallic acids and quercetins (Arao et al., 2004;
Hayek et al., 2014; Rains et al., 2011; Sae-tan et al. 2011).
The existing outcomes concerning reduced body weight in pomegranate peel and bagasse
extracts based drinks administrated to different groups of rats are comparable with earlier
findings of Al-Muslehi (2013). He reported 33.77% reduction in weight of albino Wister
male rats that were fed on cholesterol rich diet throughout the trial along with administration
of 10% level of pomegranate peel powder. He was of the view that pomegranate is a rich
source of antioxidants and other polyphenols like punicalagin, ellagic acid and punicalin,
which have potential to prevent lipid peroxidation and decrease the uptake of cholesterol
from gastrointestinal track. Furthermore, they manage the prevention of LDL-cholesterol
deposition and delays onset of obesity.
Conclusively, in present investigation, administration of pomegranate peel (D1) and bagasse
(D2) based value added drinks to hypercholesterolemic and diabetic rats were proven to be
handy against body weight management by interfering with lipid metabolism. Prepared
drinks also inhibited the pancreatic enzyme lipase activity alongside also reduced the
intestinal lipid absorption thus lessens the gain in weight.

87
Figure 6. Percent reduction in body weight as compared to control
-10
-9
-8
-7
-6
-5
-4
-3
-2
-1
0
Study I Study II Study III
-4.53
-9.51
-8.08
-3.10
-7.44
-6.10
Per
cen
t re
du
ctio
n
D1
D2

88
4.6.4. Cholesterol
In this experimental research, the effect of pomegranate peel and bagasse extracts were
examined for normal, hypercholesterolemic and diabetic rats with special reference to lipid
profile markers including total cholesterol, LDL, HDL, and triglycerides.
The F value documented in Table 40 reveals that treatments imparted non-substantial impact
on cholesterol level in study I however, significant variations were noticed in remaining
studies i.e. study II & III. In study I (normal rats), highest cholesterol level was assessed in
group subjected to D0 (79.75±4.43 mg/dL) trailed by D2 (77.61±5.58 mg/dL) however,
minimum level was recorded as 77.24±4.14 mg/dL (D1). While, means for cholesterol level
in study II (hypercholesterolemic rats) indicated maximum values for D0 (143.55±0.96
mg/dL) that significantly reduced in groups that relied on value added drink D1 and D2 as
122.7±1.38 and 130.53±2.31 mg/dL, respectively. Similarly in study III (diabetic rats), group
that relied on drink D0 exhibited high cholesterol level (99.84±4.78 mg/dL) followed by
those subjected to D2 (92.87±4.64 mg/dL) and D1 (89.60±4.93 mg/dL).
It is quite evident in Figure 7 that in study I, drink D1 (pomegranate peel extract based drink)
caused maximum reduction in cholesterol levels followed by D2 (pomegranate bagasse based
drink). In study I, drinks D1 and D2 exhibited 3.09 and 2.68% decrease in cholesterol levels,
respectively as compared to control drink (T0). Similarly, in study II (hypercholesterolemic
rats) highest decline in cholesterol levels was assessed in group treated with drink by D1
(14.52%) trailed by D2 (9.07%). Moreover, same cholesterol lowering trend was observed in
diabetic rats of study III. Accordingly, in study III maximum percent reduction in cholesterol
levels was recorded as 10.25% in group subjected to drink D1 whilst least reduction was
caused due to intake of drink D2 (6.98%), as compared to control.
Cholesterol is an essential and integral component of cellular membrane; cell produces its
own cholesterol through a process known as de novo cellular synthesis but they also uptake
plasma LDL through receptor mediated transport (Fuhrman et al., 1997). There are proven
facts that illumined the cholesterol lowering ability of pomegranate peel and bagasse
polyphenols i.e. punicalagins, punicalin and ellagic acid. The results of various bio-
evaluation trials comprising of humans and animals (rats, mice, hamster, pigs and rabbits)

89
Table 40. Effect of value added drinks on cholesterol (mg/dL)
Studies
Treatments
F value
D0 D1 D2
Study I 79.75±4.43 77.28±5.57 77.61±5.81 0.19NS
Study II 143.55±0.96a 122.7±1.38
c 130.53±2.31
b 122
**
Study III 99.84±4.78a 89.6±4.93
b 92.87±4.64
ab 3.58
*
* = Significant Study I: Normal rats D0: Control drink
**= Highly significant Study II: Hypercholesterolemic rats D1: Drink containing pomegranate peel extract
NS= Non Significant Study III: Diabetic rats D2: Drink containing pomegranate bagasse extract

90
Figure 7. Percent reduction in cholesterol as compared to control
-16
-14
-12
-10
-8
-6
-4
-2
0
Study I Study II Study III
-3.09
-14.52
-10.26
-2.68
-9.07
-6.98
Per
cen
t re
du
ctio
n
D1
D2

91
elucidated the role of pomegranate against hypercholesterolemia due to its antioxidant
potential and mode of action (Rock et al., 2008).
The outcomes of current investigation are in accordance with the findings of Ibrahium
(2010); he evaluated the effect of low (400 mg/kg body weight (B.W.) of rat) and high (800
mg/kg B.W. of rat) of pomegranate peel extract (PPE) on the lipid profile of white albino rats
fed on hypercholesterolemic diet for seven weeks. Purposely, rats were distributed into four
groups on the basis of administrated diet i.e. control (C-), hypercholesterolemic diet (HD)
(C+), HD+PPE @ 400mg/kg and HD+PPE @ 800mg/kg B.W. The maximum dose of PPE
resulted in highest reduction in cholesterol 52.07% as compared to positive control group at
the end of trial. Inhibitory effect of pomegranate peel polyphenols on activity of pancreatic
lipase enzyme is one of the mechanistic reasons for reduction in serum total cholesterol (TC).
Recently, research results of Taha et al. (2016) concluded the hypolipidemic potential of
pomegranate peel extract in diet induced hypercholesterolemic rats and HEPG2 cell line.
They were of the view that pomegranate peel polyphenols increases expression of liver
mRNA for LDL receptor (LDL-R) & down-regulates sterol regulatory element-binding
protein (SREBF-2 & SRBEP1c), alongside inhibit the activities of 3-hydoxy-3-methyl
glutaryl-CoA (HMG-CoA) reductase and fatty acid synthase (FAS), involved in fatty acid
synthesis. Furthermore, the results of PCR assay revealed significant effect on upregulation
of hormone sensitive lipase and suppression of FAS in adipose tissues and isolated liver of
male albino mice.
Earlier, Sadeghipour et al. (2014) observed that pomegranate peel extract treatment resulted
substantial reduction of total serum cholesterol levels in male Wister rats. They conducted 23
days trial to investigate the therapeutic potential of pomegranate peel extracts against
hyperlipidemia. Entire experimental study comprised of six groups, Group-1: normal control
(C-), Group-2: untreated control (C+), fed on 10% lipid rich diet along with saline 0.5 mL/rat
(i.p.), Groups-3, 4, 5 and 6 fed on 10% lipid rich diet and administered extract at doses 50,
100, 200 and 300 mg/kg/day (i.p.). The results regarding total cholesterol delineated that
pomegranate polyphenols resulted in 20.90, 25.45, 27.27 and 26.36% reduction in rats
subjected to 50, 100, 200 and 300 mg/kg/day, respectively.

92
The reduction trend in total cholesterol is further strengthen by the findings of Salwe et al.
(2015), they noticed decrease in serum total cholesterol level up to 14.91% and 22.78% due
to application of pomegranate leaf extract (PLE) at a rate of 100 and 200 mg/kg body weight.
Moreover, it is stated that all parts of pomegranate fruit including peel, leaf, flowers, juice
and bagasse have been reported to contain cache of bioactive compounds like punicalagin,
gallic acid, ellagic acid, ursolic acid, punicalin and oleanolic acid. All these pomegranate
bioactive polyphenols are responsible for reduction in serum cholesterol levels and hepatic
abnormalities. Hypercholesterolemia is tackled by pomegranate bioactive constituents that
inhibit lipid peroxidation. Furthermore, they influence the fecal excretion of fatty acids and
sterols that helps to get rid of excess cholesterol (Al-Muammar and Khan, 2012; Lei et al.,
2007; Li et al., 2008; Liu, 2005).
Hypercholesterolemic ability of pomegranate polyphenols is due to multi-dimensional mode
of action. They not only inhibit the activity of pancreatic lipase enzyme but also retard the
activity of HMG-CoA reductase in living system, resulting in reduction of cholesterol level
within the cell therefore increasing the mediated transport of cholesterol through LDL-
receptors ultimately lowering the level of cholesterol in serum.
From above stated results, it is evident that value added drinks comprising of pomegranate
peel and bagasse extracts are helpful to mitigate the elevated cholesterol levels, however,
pomegranate peel based drink was more promising in this context.
4.6.5. Low density lipoprotein (LDL)
The F values depicted in Table 41 indicated substantial effects of treatments on LDL level in
study II & III, whereas non-momentous differences were noticed in study I.
The recorded means (study I) revealed highest LDL value 28.59±1.28 mg/dL in group given
drink D0 that non-significantly reduced to 27.52±1.76 and 28.01±1.89 mg/dL in drinks D1
and D2 treated groups, respectively. While in study II (hypercholesterolemic rats), drink D0
administrated group showed maximum LDL level 59.59±1.43 mg/dL that significantly
diminished in groups subjected to value added drinks D1 and D2 to 50.73±1.26 mg/dL and
53.19±1.32 mg/dL, respectively. Similarly in study III (diabetic rats), mean LDL levels for
D0, D1 and D2 subjected groups changed substantially i.e. 46.23±1.77, 40.80±1.53 and
42.66±1.93 mg/dL, respectively (Table 41).

93
Table 41. Effect of value added drinks on LDL (mg/dL)
Studies
Treatments
F value
D0 D1 D2
Study I 28.59±1.28 27.52±1.76 28.01±1.89 0.31NS
Study II 59.59±1.43a 50.73±1.26
b 53.19±1.32
b 35.0
**
Study III 46.23±1.77a 40.80±1.53
b 42.66±1.93
ab 7.45
*
* = Significant Study I: Normal rats D0: Control drink
**= Highly significant Study II: Hypercholesterolemic rats D1: Drink containing pomegranate peel extract
NS= Non Significant Study III: Diabetic rats D2: Drink containing pomegranate bagasse extract

94
The Figure 8 illustrated percent reductions in LDL levels among different groups (1, 2 and 3)
of rats in each individual study i.e. study I, II and III. In experimental trial of study I, the
value added drinks D1 and D2 resulted in non-momentous decrease in LDL values by 3.75
and 2.02%, correspondingly as compared to control drink D0. However, in study II,
pomegranate peel extract based drink (D1) caused highest decrease in LDL levels up to
14.86% as compared to pomegranate bagasse extract based drink D2 (10.74%). Similar trend
was observed in study III, in which value added drink containing pomegranate peel extract
(D1) lowered the LDL values by 11.75%, whilst drink comprising of pomegranate bagasse
extract (D2) lead to 7.72% LDL reduction, correspondingly as compared to D0 (control
drink).
LDL known to be bad cholesterol is actually chief cholesterol carrying lipoprotein in plasma
and mainly comprises of 25% of apo-B100 protein, 74.96% of cholesterol esters and nearly
less than 1% triglycerides. It also contains a polyunsaturated fatty acid identified as linoleate
that combines to cholesterol esters and makes it vulnerable to oxidation. Additionally,
oxidation of LDL is considered to be the key reason for development of atherosclerosis. It
initiates anomalous changes in the macrophage and combines with macrophage scavenger
receptor resulting in foam cell deposition that eventually deposits inside the arteries and leads
to coronary complications (Rosenblat et al., 2006). Various scientific explorations have
proven the ability of pomegranate fruit polyphenols especially punicalagin to ameliorate
LDL oxidation owing to its strong antioxidant potential causing free radicals to scavenge,
hampering the foam cell production and deposition (Esmaillzadeh and Azadbakht, 2008;
Heinecke, 1998; Heinecke, 2006; Viuda‐Martos et al., 2010).
The present investigation is in accordance with the earlier exploration of Saad et al. (2015).
Their findings supported the results of current exploration regarding momentous LDL
decline due to pomegranate peel polyphenols. They probed the hypolipidemic effect of
pomegranate peel in streptozotocin induced diabetic rats and narrated a substantial reduction
(52.09%) in serum LDL levels in diabetic groups orally subjected to 200 mg/kg/day body
weight for twenty days as compared to positive diabetic control group. Nevertheless,
pomegranate polyphenols significantly ameliorated the raised level of LDL levels via
different mechanisms i.e. free radical scavenging ability, modulate the particle size of LDL,
adjusting the macrophage and LDL ratio however, the former is considered as the most

95
Figure 8. Percent reduction in LDL as compared to control
-16
-14
-12
-10
-8
-6
-4
-2
0
Study I Study II Study III
-3.75
-14.86
-11.75
-2.02
-10.74
-7.72
Per
cen
t re
du
ctio
n
D1
D2

96
important that inhibits LDL oxidation at initiation stages (Aviram et al., 2000; Fuhrman et
al., 2010; Ignarro et al., 2006). Earlier, Hossin (2009) examined the effect of different
concentration of pomegranate peel extracts i.e. 1, 2 and 3% on lipid profile of 40 male albino
rats fed on high cholesterol diet. They concluded that pomegranate peel extract resulted in
dose dependent reduction in low density lipoproteins (LDL) due to its ability to quench
superoxide ion and chelate Fe ions in macrophages.
Likewise, Aviram et al. (2008) noticed LDL lowering potential of pomegranate polyphenols
from peels, flowers and arils in apolipoprotein E-deficient (E0) mice. For this purpose,
experimental rats were provided with pomegranate extracts including peel, flower and aril
extracts (200 µg/mice/day) for three months. They observed reduction in atherosclerotic
lesion area and oxidized LDL uptake up to 70% and 15% respectively. They concluded that
antioxidant mode of action and suppression of fatty acid synthesis enzymes by pomegranate
polyphenols (punicalagin, punicalin, gallic acid, and ellagic acid) are the leading routes by
which it tackles the lipid related abnormalities. Similarly, Kulkarni et al. (2007) showed that
the antioxidant potential of punicalagin, major hydrolyzable tannin present in different parts
of pomegranate, reduces LDL levels and macrophage oxidative stress owing to its free
radicals scavenging capacity, along with its action as a metal chelator.
One of the researcher groups, Esmaillzadeh et al. (2006) examined the effect of concentrated
pomegranate juice (PJ) ingesting (40 g) on lipid biomarkers in type-II diabetic patients with
hypercholesterolemia. At the termination of 8th
week, significant reductions were noticed in
total cholesterol and serum LDL cholesterol levels i.e. 5.43% and 9.24%, respectively.
Similarly, Fuhrman et al. (2005) described that pomegranate polyphenols employs a
momentous effect on macrophage cholesterol metabolic rate by decreasing cellular uptake of
oxidized-LDL and reducing cellular cholesterol biosynthesis. These routes ultimately lead to
decline in macrophage cholesterol aggregation, foam cell accumulation and reduction of
atherosclerosis expansion. Later, De Nigris et al. (2006 & 2007) proposed that pomegranate
fruit extract employs valuable effects on the development of medical vascular problems,
coronary heart disease (CHD) and atherogenesis in living beings by augmenting the
endothelial nitric-oxide synthase (NOS-III) bioactivity. Conclusively, pomegranate juice and
extract polyphenols upregulates the potent downregulation of NOS-III enzyme provoked by
oxidized low-density lipoprotein (ox-LDL) in human coronary endothelial cells.

97
According to a research conducted by Murthy et al. (2002) on antioxidant potential of
pomegranate peel (PP) using in vivo models. Purposely, methanol was used for extraction of
polyphenols from pomegranate peels and was fed to albino rats that were orally given carbon
tetrachloride (CCL4) at 2 g/kg body weight for induction of liver injury. The methanolic
extract of pomegranate peels exhibited 54% inhibition in lipid peroxidation as compared to
control. Anti-oxidative action is not only the mode of action by which pomegranate inhibits
LDL level in the subjects; pomegranate polyphenols also have the ability to address this
menace with some other mechanistic approaches. It is inferred that pomegranate polyphenols
reverses the oxidation of LDL cholesterol resulting effectual balance in HDL and harmonize
cholesterol homeostasis. They also lower the levels of LDL by increasing fecal excretion of
fatty acids, sterols and protecting LDL from oxidation.
It is evident from the above debate that pomegranate peel and bagasse polyphenols
supplemented value added/functional drinks have potential to be administrated as dietary
intervention against elevated LDL and other lipid related abnormalities.
4.6.6. High density lipoprotein (HDL)
The F value indicated in Table 42 elucidates that treatments imparted non-significant
variations on HDL level in study I whereas, the effect was observed momentous in study II
& III.
In normal rats (study I), HDL values was non-momentously increased from 34.22±2.97
mg/dL in D0 (control drink) treated group to 34.84±2.07 and 35.16±2.76 D2 (drink containing
pomegranate bagasse extract) and D1 (drink containing pomegranate peel extract) subjected
groups, respectively. However, means relating to study II illustrated that least HDL level was
recorded as 26.73±0.36 mg/dL (D0) that increased to 28.19±0.72 mg/dL and 27.75 mg/dL in
case of D1 and D2 administrated groups, correspondingly. Similarly, a progressive increase
was documented in study III (diabetic rats) in current experimental trial i.e. 30.68±0.53,
31.60±0.27 and 32.24±0.95 mg/dL in D0, D2 and D1 dependent groups, respectively.
It is clearly depicted from Figure 9 that in present trial of study I, value added drinks D1 and
D2 caused non-substantial increment in HDL concentration (2.75 and 1.81%), respectively as
compared to control drink (D0). In contrary, study II revealed momentous

98
Table 42. Effect of value added drinks on HDL (mg/dL)
Studies
Treatments
F value
D0 D1 D2
Study I 34.22±0.97 35.16±0.76 34.84±0.57 1.12NS
Study II 26.73±0.36b 28.19±0.72
a 27.75±0.04a 7.77
**
Study III 30.68±0.53b 32.24±0.27
a 31.6±0.95ab 4.41
*
* = Significant Study I: Normal rats D0: Control drink
**= Highly significant Study II: Hypercholesterolemic rats D1: Drink containing pomegranate peel extract
NS= Non Significant Study III: Diabetic rats D2: Drink containing pomegranate bagasse extract

99
rise in groups subjected to drink D1 (5.46%) trailed by D2 (3.82%), correspondingly.
Accordingly, study III presented substantial elevation for HDL values in groups that were
treated with drinks D1 and D2 as 5.08 and 2.99% during subsequent trial.
Cholesterol being lipophilic in nature requires various lipoproteins for its circulation in the
blood. In this perspective, high density lipoprotein (HDL), very low density lipoprotein
(VLDL), low density lipoprotein (LDL) and chylomicron (CM) are the noteworthy carriers
that facilitate transportation of cholesterol whereas, HDL and LDL are the most promising
among all (Yang et al., 2012). Numerous investigations have indicated a direct correlation
between imbalance of LDL and HDL for onset of cardiovascular complications (Michos et
al., 2012). High density lipoproteins (HDL) is known to be “good cholesterol” due to its
ability to assist reverse cholesterol transport (RCT), removal of excess cholesterol from
arteries & tissues and sending them back to liver, where they are absorbed and excreted after
conversion in to bile acid. It principally acts on sub-endothelial space in medium caliber
artery resulting in prevention of cholesterol deposition in the form of atheroma. Presently,
evident attention is being paid towards the therapeutic role of HDL for the management of
cardiovascular health due to its inverse relationship with LDL (McEneny et al., 2012; Gadi et
al., 2012).
In the treatment of diet based therapy, polyphenols have attained primary attention as
coronary protection agent owing to their cholesterol and LDL lowering capabilities. Various
polyphenols are considered vital for curbing this menace however, pomegranate peel and
bagasse based polyphenols like punicalagin have acquired special position in that list due to
their unique structure and mode of action. Several scientific investigations have revealed an
inverse correlation between pomegranate based polyphenols consumption and lipid
irregularities by augmenting against LDL oxidation and up surging the levels of HDL in
obese and diabetic models (Sezer et al., 2007; Basu and Penugonda, 2009; Davidson et al.,
2009; Al-Attar and Zari, 2010). The non-significant enhancement in the HDL level of normal
rats (study I) are in harmony with the findings of Salwe et al. (2015), they stated non-
momentous HDL elevation (4.09%) in pomegranate peel extract treated group (200 mg/kg
B.W.) as compared to normal control.

100
Figure 9. Percent increase in HDL as compared to control
0
1
2
3
4
5
6
Study I Study II Study III
2.75
5.46 5.08
1.81
3.82
2.99
Per
cen
t in
crea
se
D1
D2

101
The substantial effect of value added drinks containing pomegranate peel and bagasse
extracts on HDL level of rats subjected on high cholesterol diet are supported by the
outcomes of Hossin (2009), they piloted a study on obese hyperlipidemic rats to evaluate the
atherosclerosis protective potential of pomegranate peel powders and their respective
extracts. They observed that cholesterol rich diet initiated deviations in cholesterol, LDL &
triglyceride levels and disturbed the LDL/HDL ratio nevertheless, peel powder (15%) and
extract provision (2%) resulted in 24.65% and 27.16% enhancement in serum HDL level of
rats, respectively. They concluded that pomegranate peel antioxidants prevent LDL
oxidation, remove excessive cholesterol through feces and modulate the expressions involved
in lipid metabolic rate. Afterwards, Sadeghipour et al. (2014) elucidated the HDL
incremental ability of pomegranate peel polyphenols. They used high fat diet (10%) to induce
hypercholesterolemia in rats with intraperitoneally (i.p.) injected pomegranate peel extract @
50, 100, 200 and 300 mg/kg/day for twenty three consecutive days. It was discovered that
peel extracts enhanced HDL by 9.18, 23.43, 45.25 and 47.02% as compared to control by
increasing the cholesterol excretion via bile acid, suppressing the fatty acid synthase (FAS)
enzyme activity thus preventing plaque formation.
Research exploration of Lei et al. (2007) outlined that pomegranate extract containing
10.60% ellagic acid significantly improved the HDL up to 5.87% in hypercholesterolemic
induced obese rats. They also revealed that arthrogenic ratio decreased from 3.49-2.60 in
case of group administrated to 400 mg/kg body weight of obese rat. Lowering the arthrogenic
index, inhibition of pancreatic lipase activity and prevention from lipid oxidation are the
possible mechanisms by which pomegranate polyphenols enhance the plasma HDL level.
Arthrogenic index is the ratio between LDL & HDL which is significantly managed by the
peel and bagasse polyphenol punicalagin. Cholesterol metabolism, suppression of lipid
synthesis enzymes activity and prevention of LDL oxidation due to pomegranate polyphenols
free radical scavenging potential are vital reasons to curb hypercholesterolemic
abnormalities. Moreover, upregulating HDL expression results in enhancing the movement
of cholesterol back to liver from where it is converted to bile acid and excreted from body
(Lowe, 1994; Drent and Van der Veen, 1995; Basu and Penugonda, 2009).

102
From the above-mentioned discussion it is inferred that pomegranate peel and bagasse
polyphenols are valuable against cardiovascular and dyslipidemic complications owing to
their positive impact on HDL activation.
4.6.7. Triglycerides
The F values (Table 43) elucidated non-substantial effect due to treatments on triglycerides
concentrations of normal rats in study I whereas, significant variations were observed in
study II & III.
In study I (normal rats), mean triglycerides levels were 65.67±2.90, 63.62±3.14 and
63.77±2.62 mg/dL in groups 1, 2 and 3 that were subjected to value added drinks D0, D1 and
D2, respectively. Whereas, means relating to study II explicated highest triglycerides level
(96.19±1.98 mg/dL) in group fed on control drink D0. Nonetheless, drink D1 (pomegranate
peel extract) and D2 (pomegranate bagasse extract) demonstrated triglyceride lowering
potential by 86.58±1.13 and 90.77±1.27 mg/dL, correspondingly. Likewise, the recorded
values for triglycerides in diabetic rats (study III) indicated similar diminishing trend in
respective groups that were administrated to D0, D1 and D2 as 73.90±1.92, 68.69±1.87 and
70.78±1.94, respectively.
It is noticeable in Figure 10 that highest percent reductions in triglycerides concentration for
study II i.e. 9.99 and 5.63% was observed in D1 and D2 treated groups, respectively.
Similarly, value added drinks D1 and D2 caused 7.05 and 4.22% decline in triglycerides levels
in diabetic rats (study III). Though, study I presented non-momentous decrease in
triglycerides values in groups relying on drink D1 (3.12%) and D2 (2.89%) in case of normal
rats.
Raised triglyceride (TG) levels is one of the major reasons for various coronary
complications and hypercholesterolemic irregularities leading to atherogenic state either due
to elevated LDL or reduced HDL cholesterol levels. There are scientific confirmations
illuminating a linear association between high fat diet and elevation in cholesterol,
triglyceride (TG) and LDL levels due to the production of more free fatty acids (FFAs) that
trigger the progression of lipogenesis (Gotto, 1998).

103
Table 43. Effect of value added drinks on triglycerides (mg/dL)
Studies
Treatments
F value
D0 D1 D2
Study I 65.67±2.90 63.62±3.14 63.77±2.62 0.47NS
Study II 96.19±1.98a 86.58±1.13
c 90.77±1.27b 30.7
**
Study III 73.90±1.92a 68.69±1.87
b 70.78±1.94ab 5.65
*
* = Significant Study I: Normal rats D0: Control drink
**= Highly significant Study II: Hypercholesterolemic rats D1: Drink containing pomegranate peel extract
NS= Non Significant Study III: Diabetic rats D2: Drink containing pomegranate bagasse extract

104
Figure 10. Percent reduction in triglycerides as compared to control
-12
-10
-8
-6
-4
-2
0
Study I Study II Study III
-3.12
-9.99
-7.05
-2.89
-5.63
-4.22
Per
cen
t re
du
ctio
n
D1
D2

105
In this instant study, the substantial decline in serum triglycerides (TG) levels of
hypercholesterolemic rats (study II) is supported by the findings of Lei et al. (2007). They
tested pomegranate leaf polyphenols against triglyceride levels in high fat fed diet mice. The
mice were divided into 5 groups; group-1 fed on high fat diet (HFD), group-2 treated with
subutramine (4.6 mg/kg B.W.)+HFD, group-3 & 4 treated with different concentrations of
pomegranate leaf extract (PLE) i.e. 400 & 800 mg/kg B.W., respectively and group-5 as
negative control fed on basal diet.
Results narrated decline in triglyceride levels as 37.78, 17.74 and 24.19% in case of groups
subjected to drug subutramine, PLE (400 mg/kg) and PLE (800 mg/kg), respectively. Similar
trend was observed by Sadeghipour et al. (2014), they exploited the effect of pomegranate
peel extracts administrated @ 50-300 mg/kg body weight in high lipid diet fed rats. They
observed dose dependent decline in serum triglyceride levels revealing 19.78-55.78%
reduction, respectively. They were of the view that pomegranate polyphenols especially
punicalagin has potential to significantly reduce the activity of pancreatic lipase, a vital
enzyme in triglycerides biosynthesis. Another researcher, Al-Muslehi (2013) also described
the lipid lowering capability of pomegranate peel in hyperlipidemic rats and testified 45.61%
triglycerides reduction in rats fed on high fat diet along with 10% pomegranate peel powder
as compared to rats present in positive control group. They deduced that besides strong
antioxidant potency, pomegranate peel polyphenols tackles the triglycerides elevation by
hindering pancreatic lipase activity and accelerating removal of excess fat. Besides,
pomegranate peel, leaf, arils, juice and bagasse polyphenols have capability to modulate lipid
abnormalities by decreasing uptake of intestinal lipids, increasing fecal excretion of fat
through bile acid, suppressing the activity of fat synthesis enzymes and preventing
lipogenesis.
It is concluded that pomegranate peel and bagasse based value added/functional drinks are
effectual against lipid related abnormalities. However, respective drinks showed better
performance in hypercholesterolemic and diabetic studies (II & III). Moreover, pomegranate
peel based value added drink was more effective to ameliorate the threat of hyperlipidemia as
compared to drink containing pomegranate bagasse extract. Owing to the presence of peel
and bagasse extract, respective value added drinks can be used efficiently as nutraceutical

106
dietary intervention for mitigating the lifestyle related ailments with special reference to
hypercholesterolemia.
4.6.8. Glucose
The statistical analysis (F value) showed that treatments exhibited significant effect on
glucose concentration in all the conducted studies excluding study I (Table 44).
Means regarding glucose levels (study I) in drinks D0, D1 and D2 subjected groups were
recorded as 89.84±4.57, 86.41±2.74 and 87.97±4.14 mg/dL, respectively. Glucose level in
study II (hypercholesterolemic rats) showed diminishing trend in performed efficacy trial.
Purposely, highest value was noticed in group fed on D0 (132.12±2.20 mg/dL) trailed by
drinks D1 (124.46±3.61 mg/dL) and D2 (126.90±3.10 mg/dL) administrated groups. Likewise
the values for serum glucose level in D0 (control), D1 (drink containing pomegranate peel
extract) and D2 (drink containing pomegranate bagasse extract) treated groups were
documented as 233.80±3.21, 216.03±2.15 and 222.15±2.83 mg/dL, correspondingly (Table
44).
The Figure 11 depicted the percent decrease in glucose concentration in different rat groups.
The study I explicated 3.82% and 2.08% decrease in drink D1 and D2 subjected groups,
respectively. However substantial decline was perceived in rats fed on cholesterol rich diet
(study II). In hypercholesterolemic rats, pomegranate peel extract based drink (D1) led to
7.50% reduction whereas (D2) pomegranate bagasse extract based drink resulted in 5.11%
reduction. Similarly in study III (diabetic rats), maximum reduction occurred due to feeding
of drink D1 (13.28%) and minimum decrease in case of drink D2 (8.71%) treated group. It is
revealed that value added drink containing pomegranate peel extract (D1) performed better
against glucose related abnormalities than drink containing pomegranate bagasse extract
(D2).
In diabetes, homeostasis of carbohydrates and lipid metabolism is disturbed causing elevated
fasting and postprandial serum glucose levels. Raised serum glucose levels for prolonged
period of time leads to hyperglycemia that in turn is converted to diabetes mellitus (Tiwari
and Rao, 2002; Sailaja et al., 2003). The data from present study revealed an inverse
correlation between pomegranate peel & bagasse extract based value added drinks (D1 & D2)
and serum glucose level.

107
Table 44. Effect of value added drinks on glucose (mg/dL)
Studies
Treatments
F value
D0 D1 D2
Study I 89.84±4.57 86.41±2.74 87.97±4.14 0.58NS
Study II 132.12±2.20a 124.46±3.61
b 126.90±3.10ab 5.01
*
Study III 233.80±3.21a 216.03±2.15
c 222.15±2.83b 32.0
**
* = Significant Study I: Normal rats D0: Control drink
**= Highly significant Study II: Hypercholesterolemic rats D1: Drink containing pomegranate peel extract
NS= Non Significant Study III: Diabetic rats D2: Drink containing pomegranate bagasse extract

108
Figure 11. Percent reduction in glucose levels as compared to control
-15
-13
-11
-9
-7
-5
-3
-1
Study I Study II Study III
-3.82
-7.50
-13.28
-2.08
-5.11
-8.71
Per
cen
t re
du
ctio
n
D1 D2

109
Various scientific researches have enlightened the nutraceutical role of pomegranate
polyphenols against diabetes and hyperglycemia. This property is validated owing to the
cache of polyphenols in various parts of pomegranate that results in reduction of blood
glucose and recovers insulin resistance in many human and animal model studies (Katz et al.,
2007; Matsui et al., 2002).
Similar glucose lowering tend was also reported by Rock et al. (2008) due to utilization of
pomegranate extract and juice by thirty diabetic patients. They outlined that administration
of pomegranate extract @ 5mL/day for six weeks resulted in significant diminish in serum
glucose concentration (4.19%). Likewise, Radhika et al. (2011) reported momentous
reduction (33.33%) in serum glucose levels of experimental alloxan induced (120 mg/kg for
2 days) diabetic rats due to consumption of pomegranate peel extract (1g/kg body weight/day
for 10 days). In this connection, Das et al. (2001) carried out a bio-efficacy trial on albino
rats of Wister strain to elucidate the role of pomegranate seed methanolic extract (300 and
600 mg/kg body weight) against glucose related abnormalities and concluded 47 and 52%
reduction respectively, in blood glucose levels after twelve hours of oral application. They
inferred that pomegranate polyphenols not only raised the level of hepatic glycogen, and
enhanced glycogen synthesis but also reduced glucose-6-phosphatase activity resulting in
reduced serum glucose concentration.
The findings of Khalil (2004) are in accordance with the results of instant research, they
established 57.14% decline in blood glucose levels of alloxan induced diabetic rats that were
subjected to 0.43g/kg body weight of pomegranate peel aqueous extract for a period of 4
weeks, due to regeneration of ß-secretion cells in treated diabetic rats. Relevant to this, Li et
al. (2005) investigated a rodent trial to authenticate the α-glucosidase inhibitory activity of
pomegranate extract. Purposely, they used methanolic extract of pomegranate flower and
observed significant reduction in concentration of this enzyme. They further reported in in
vitro study that pomegranate polyphenols validated that inhibition has direct relation with
concentration of substrate and enzyme, along with the length of pre-treatment with the
enzyme α-glucosidase. They were of a view that suppression of enzyme activity causes
reduction in carbohydrate breakdown thus slows down the absorption of glucose through
intestines.

110
The most important enzymes responsible for breakdown of carbohydrate are α-amylase & α-
glucosidase. Action of α-amylase results in formation of three main products maltotriose,
maltose and α-dextrins which are further converted to glucose residues by the action of α-
glucosidase present in small intestines. Glucose is then brought up into cells thru SGLT1
(sodium-dependent glucose transporter) mediated transport (Hanhineva et al., 2010; Kim et
al., 2016). Accordingly, Bellesia et al. (2015) assessed inhibitory effect of pomegranate
extract ellagitannins like punicalagin against α-glucosidase and proposed reduced glucose
uptake from intestines.
Pomegranate polyphenols inhibits activity of enzymes α-amylase and α-glucosidase thus
minimizing glucose absorption from intestine through SGLT1 transporter. They also
increased insulin secretion from β–secretion cells and moderated glucose output from liver. It
is inferred from above mentioned literature that pomegranate byproducts based value added
drinks are efficient in curtailing glucose related syndromes. Nevertheless, pomegranate peel
polyphenols based drink proved to be more promising in addressing this menace.
4.6.9. Insulin
The F values presented in Table 45 indicated substantial variations for insulin level due to
treatments in study II (hypercholesterolemic rats) and III (diabetic rats) whilst, non-
momentous effect was noticed in study I (normal rats).
The means for insulin content in study I were documented as 8.62±0.67, 8.86±0.41 and
8.80±0.62 µU/mL in different groups of normal rats that were fed on drinks D0, D1 and D2,
respectively. Nevertheless, in study II, least insulin level was elucidated in group
administrating on drink D0 (8.06±0.18 µU/mL) that significantly inclined to 8.63±0.12 and
8.40±0.15 µU/mL in drinks D1 and D2 treated groups, respectively. Likewise, treatments D0,
D1 and D2 had significant effect on insulin levels in study III; D1 exhibited highest insulin
value (7.69±0.12 µU/mL) trailed by D2 (7.18±0.14 µU/mL) whilst minimum was recorded in
group subjected to drink D0 (6.67±0.10 µU/mL).
The Figure 12 illustrates the percent increase in insulin levels; in study III pomegranate peel
extract supplemented drink (D1) resulted in 8.74% incremental effect on insulin
concentration whereas, D2 (pomegranate bagasse extract based drink) resulted 4.37% incline
for this trait. Similarly, for hypercholesterolemic rats (study II), the value added drinks D1

111
Table 45. Effect of value added drinks on insulin (µU/mL)
Studies
Treatments
F value
D0 D1 D2
Study I 8.62±0.67 8.86±0.41 8.80±0.62 0.14NS
Study II 8.06±0.18b 8.63±0.12
a 8.40±0.15ab 10.70
*
Study III 6.67±0.10c 7.69±0.12
a 7.18±0.14b 53.20
**
* = Significant Study I: Normal rats D0: Control drink
**= Highly significant Study II: Hypercholesterolemic rats D1: Drink containing pomegranate peel extract
NS= Non Significant Study III: Diabetic rats D2: Drink containing pomegranate bagasse extract

112
Figure 12. Percent increase in insulin levels as compared to control
0
2
4
6
8
10
Study I Study II Study III
2.78
5.66
8.74
2.08
3.38 4.37
Per
cen
t in
crea
se
D1 D2

113
and D2 resulted 5.66 and 3.38% rise in serum insulin levels, respectively. However, drinks
showed non-significant enhancement in insulin level due to drinks D1 and D2; 2.78 and
2.08%, respectively (study I).
Diabetes mellitus is the most prevailing metabolic ailment around the globe and the numbers
of diabetic patients are increasing day by day. International Diabetes Federation accounted
nearly 194 million diabetic individuals in year 2003 and this number will upsurge to 333
million by the year 2025. It has also been ranked as third most widespread disease by World
Health Organization after cardiovascular (CVD) and oncological syndromes (Viuda-Martos
et al., 2010). Among the causes of hyperglycemia and diabetes β-secretion cell
malfunctioning, insulin resistance and defective insulin signaling pathways are the most
noteworthy ones. Use of α-glucosidase inhibitors as anti-diabetic drug is one way to manage
diabetes; on the other hand plants based phytochemical regimen has also been clinically
proven to ameliorate hyperglycemia and diabetes (Bahadoran et al., 2013).
Alloxan, thiazide diuretics and streptozotocin are the most widely used drugs to damage β-
cells and for induction of diabetes. Streptozotocin, a β-cytotoxic agent used in this study
rapidly accumulates and damages β-secretion cells due to production of reactive oxygen
species (ROS) and super oxide radicals (Radhika et al. 2011). The present outcomes
regarding elevation in insulin concentration are in harmony with the results of Khalil (2004),
explored the anti-diabetic response of pomegranate peel aqueous extracts in alloxan induced
diabetic male albino rats. Administration of pomegranate extract @ 0.43 g/kg B.W. for 28
days resulted enhancement in insulin level by 1.6 folds from 7.5±0.8 to 12±0.5 µU/mL.
Conclusively, the proposed route of action was free radical scavenging ability of
pomegranate peel polyphenols resulting in reduction of reactive oxygen species eventually
increasing the amount of insulin secreted by β-cells.
Peroxisome proliferator-activated receptor (PPAR)-γ activators are clinically most usually
used for treatment of diabetes. Pomegranate polyphenols and flavonoids have reported anti-
diabetic potential in various studies. In a study conducted by Huang et al. (2005), they
revealed that administration of pomegranate methanolic extract (500 mg/kg/day) for 42 days
reduced elevated glucose levels in Zucker diabetic rats. Moreover, real time-PCR results
validated that treatment of pomegranate extract uplifted the glucose transporters (GLUT-4)

114
m-RNA and improved PPAR-γ m-RNA expression causing amended sensitivity of the
insulin receptor. Similarly, data of in vitro studies explicated improved PPAR-γ-dependent
mRNA expression in human THP-1-differentiated macrophage cells. Pomegranate
phytochemical gallic acid is believed to be most responsible for this anti-diabetic activity.
Pomegranate based polyphenols and flavonoids have synergistic beneficial effect against
diabetes. They not only scavenges reactive oxygen species (ROS) damaging the pancreatic
β-cells but also enhances insulin secretion by propagation of β-cells. Reduction of insulin
resistance and oxidative stress in tissues is also a pronounced mode of action in management
of diabetes. It is concluded from the preceding section that pomegranate peel and bagasse
bioactive moieties are useful to assuage insulin and glucose related abnormalities.
Considering the above mentioned facts, they are suitable to be incorporated in diet based
treatment to deal with diabetes and hyperglycemia.
4.6.10. Glutathione
The F values shown in Table 46 point’s out momentous effect of value added drinks on
serum glutathione level in normal (study I), hypercholesterolemic (study II) and diabetic rats
(study III).
Means on the subject of glutathione level in study I revealed the lowest glutathione level was
detected in drink D0 (46.18±1.34 mg/L) subjected group that substantially elevated in D1
(49.35±1.26 mg/L) and D2 (48.27±1.19 mg/L) treated groups. Likewise in study II, the
glutathione content in drink D0 (36.83±1.15 mg/L) fed group was substantially less as
compared to D1 (43.85±1.06 mg/L) and D2 (41.56±1.18 mg/L) administrated groups.
Similarly in study III, glutathione concentrations were raised from 38.75±1.12 mg/L (D0) to
45.15±1.51 mg/L (D1) and 43.04±1.41 mg/L (D2).
The pictorial presentation (Figure 13) demonstrated significant increase in glutathione
concentration due to utilization of value added drinks containing pomegranate peel (D1) and
bagasse (D2) extracts in all experimental studies i.e. study I, II and III. In study I & II, the
percent rise due to intake of drinks D1 and D2 was 6.86 and 4.52% & 19.06 and 12.84%,
respectively. The same incremental trend was noticed in study III, glutathione levels uplifted
by consumption of drink D1 and D2 i.e. 16.51 and 11.07%, correspondingly.

115
Table 46. Effect of value added drinks on serum glutathione (mg/L)
Studies
Treatments
F value
D0 D1 D2
Study I 46.18±1.34b 49.35±1.26
a 48.27±1.19ab 4.87
*
Study II 36.83±1.15c 43.85±1.06
a 41.56±1.18b 30.0
**
Study III 38.75±1.12b 45.15±1.51
a 43.04±1.41a 17.3
**
* = Significant Study I: Normal rats D0: Control drink
**= Highly significant Study II: Hypercholesterolemic rats D1: Drink containing pomegranate peel extract
NS= Non Significant Study III: Diabetic rats D2: Drink containing pomegranate bagasse extract

116
Figure 13. Percent increase in glutathione levels as compared to control
0
4
8
12
16
20
Study I Study II Study III
6.86
19.06
16.51
4.52
12.84 11.07
Per
cen
t in
crea
se
D1 D2

117
Glutathione is the most important low molecular weight endogenous antioxidant existing in
the body that helps in keeping up the intracellular redox status by acting as a co-factor in
several metabolic reactions. Chemically, it is a tripeptide comprising of glutamic acid,
glycine and cysteine that executes many important functions in body such as scavenging free
radicals, detoxification and immunity boosting owing to its thiol group (Gibson et al., 2012).
During oxidative stress conditions, reactive oxygen species (ROS) are frequently generated
and due to cellular respiration they produce hydrogen peroxide that initiates several
deleterious reactions. Glutathione halts this production by converting hydrogen peroxide into
water therefore helps body in regaining its normal oxidation potential (Teyssier et al., 2011).
Various scientific explorations had explicated inverse relationship between oxidative stress
and glutathione activity. Antioxidant glutathione scavenges free radicals thru conjugation of
electrophiles controlled by glutathione transferase and oxidation-reduction cyclic glutathione
conversion by glutathione reductase and glutathione peroxidase as a result it regularizes the
imbalance between reactive oxygen species and body redox potential (Seifried et al., 2007;
Wong et al., 2006).
In accordance with instant results, Ahmed and Ali (2010) carried out an investigation
comprising of 30 albino rats to evaluate the protective role of pomegranate peel ethanolic
extract against Fe-NTA (ferric nitrilotriacetate) induced oxidative damage. Administration of
pomegranate peel extract @ 200 mg/kg/day caused substantial increment in glutathione
status by 6.84 and 83.51% in normal and Fe-NTA treated rats. They established a view that
pomegranate peel polyphenols have capability to uplift the activity of serum glutathione
(GSH) due to their radical scavenging ability. Furthermore, they assist in quenching the
superoxide radical anion and hydroxyl radicals. Similarly, Niknahad et al. (2012) also
explored the effect of pomegranate seed extract polyphenols on glutathione (GSH) activity in
carbon tetrachloride (CCl4) induced hepatotoxicity and noticed 26.22, 12.67 and 15.62%
improvement after application of 1000 µg/mL of each ethyl acetate, hydro alcoholic and n-
hexane extract, respectively. They concluded that pomegranate polyphenols are chiefly
responsible for the induction of progressive impact on glutathione levels. Furthermore, Toklu
et al. (2007) reported 10.00 and 46.15% enhancement in glutathione levels due to application
of pomegranate peel extract (50 mg/kg) in normal and liver fibrotic rats.

118
Recently, El-Sayed et al. (2014) elucidated the effect of pomegranate peel extract (PPE)
against oxytetracycline induced oxidative stress and revealed that PPE ingestion helps to
alleviate liver injury in albino rats. During thirty days trial, PPE treated group showed
38.72% increase in serum glutathione level as compared to control. Previously, work of El-
Habibi (2013) also supported the fact that pomegranate polyphenols have ability to scavenge
free radicals produced under oxidative stress conditions.
Conclusively, pomegranate fruit waste based value added drinks have potential to elevate
serum glutathione content (GSH) therefore helpful in managing oxidative stress related
perils.
4.6.11. Thiobarbituric acid reactive substances (TBARS)
It is evident from the statistical interpretation (F values) that serum thiobarbituric acid
reactive substances (TBARS) values were affected substantially by the treatments in study I,
II and III (Table 47).
Means concerning TBARS content (study I; normal rats) specified the maximum value
6.78±0.21 µmol/L in D0 fed group that meaningfully declined to 6.31±0.25 and 6.41±0.03
µmol/L in D1 and D2 treated groups, respectively. Likewise in study II, highest TBARS level
was examined in drink D0 (10.65±0.12 µmol/L) subjected group that substantively
suppressed due to ingestion of value added drinks D1 (8.87±0.15 µmol/L) and D2 (9.52±0.21
µmol/L). Furthermore same trend was noticed in study III (diabetic rats) in which TBARS
concentration decreased significantly from 8.89±0.19 µmol/L in group consuming drink D0
to 8.02±0.13 and 8.27±0.11 µmol/L for groups relying on value added drinks containing
pomegranate peel (D1) and bagasse extracts (D2), respectively (Table 47).
It is apparent from the Figure 14 that value added drinks containing peel & bagasse extract
(D1 & D2) affected significant reduction in serum TBARS levels during entire bio-efficacy
trial. The documented decline in study I (normal rats) was 6.93 and 5.45% in case of drink D1
and D2 designated groups, respectively. Similarly, the maximum decrease regarding
respective parameter was recorded in study II (hypercholesterolemic rats) up to 16.71% (D1)
and 10.61% (D2). Moreover, in study III (diabetic rats) highest TBARS decline 9.78% was
noted in drink D1 consumed group followed by 6.97% in D2 administrated group.

119
Table 47. Effect of value added drinks on serum TBARS (µmol/L)
Studies
Treatments
F value
D0 D1 D2
Study I 6.78±0.21a 6.31±0.25
b 6.41±0.03ab 5.13
*
Study II 10.65±0.12a 8.87±0.15
c 9.52±0.21b 90.1
**
Study III 8.89±0.19a 8.02±0.13
b 8.27±0.11b 27.7
**
* = Significant Study I: Normal rats D0: Control drink
**= Highly significant Study II: Hypercholesterolemic rats D1: Drink containing pomegranate peel extract
NS= Non Significant Study III: Diabetic rats D2: Drink containing pomegranate bagasse extract

120
Figure 14. Percent reduction in TBARS levels as compared to control
-19
-17
-15
-13
-11
-9
-7
-5
-3
-1
Study I Study II Study III
-6.93
-16.71
-9.78
-5.45
-10.61
-6.97
Per
cen
t re
du
ctio
n
D1
D2

121
During diabetic and hypercholesterolemic conditions, production of reactive oxygen species
(ROS) results in lipid peroxidation. During lipid peroxidation, cell membrane integrity is
impaired due to reaction among free radicals and polyunsaturated fatty acids process
resulting in the production of malondialdehyde (MDA) and lipid hydro-peroxides. In this
context, pomegranate polyphenols had protective effect on elevated thiobarbituric acid
reactive substances (TBARS) by reducing mitochondrial oxidation and hindering the
production of superoxide ions (Hamza et al., 2014; Toklu et al., 2007).
The outcomes of present investigation related to serum TBARS concentration are in harmony
with the earlier findings of Shaban et al. (2013), they examined the protecting effect of
pomegranate peel and seed extract against DEN (diethylnitrosamine) induced liver injury in
40 male rats. For this purpose, DEN treated rats were administrated with pomegranate peel
extract (PE) @ 0.2 mL/kg/day. Oxidative stress conditions amplified MDA content
substantially, nearly 112% as compared to control group, whereas 50% thiobarbituric acid
reactive substances levels were reduced momentously in rats subjected to PE. They inferred
that pomegranate peel and seed extract had shielding effect against lipid peroxidation due to
metal ions and free radicals scavenging potential.
Likewise, El-Sayed et al. (2014) experimented on OTC (Oxytetracyclin) induced oxidative
stressed 36-male albino rats that were provided with pomegranate peel extract as a
therapeutic tool. The pomegranate peel extracts administrated group indicated 40.36%
decrease in lipid peroxidation indicator (MDA) as compared to control. They were of a view
that pomegranate polyphenols have ability to provide defense against OTC-induced hepatic
and oxidative injury due to their antioxidant potential that eventually results in quenching of
free radicals. One of the researcher groups, Salwe et al. (2015) determined that pomegranate
peel and leaf extract (200 mg/kg body weight) resulted decline of TBARS levels in
streptozotocin induced diabetic rats by 57.45 and 42.91%, respectively. Previously, Niknahad
et al. (2012) reported 12.83% reduction in TBARS levels of HepG2 cell line treated with
pomegranate seed extracts.
Evidently, supplementation of pomegranate peel and bagasse extract based value added
drinks assuages oxidative stress accordingly lesson the concentration of serum TBARS. Such
diet based therapies can be innovative tool to deal with free radicals induced complications.

122
4.6.12. Liver functioning tests
Liver functioning tests including alkaline phosphatase (ALP), aspartate transaminase (AST)
and alanine transaminase (ALT) were carried out to evaluate the hepatic safety of efficacy
rats subjected to pomegranate peel and bagasse extract supplemented drinks.
4.6.12.1. Serum aspartate transaminase (AST)
The F values in depicted in Table 48 revealed that treatments had non-significant effect on
level of serum aspartate transaminase (AST) in study I & III whereas the respective trait was
affected momentously in study II.
Means related to serum AST levels in study I showed non-substantial decrease in groups
administrated to drinks D0, D1 and D2 and their recorded values were 106.52±3.06,
103.87±5.14 and 104.85±4.14 IU/L, respectively. However in study II (hypercholesterolemic
rats), means for serum AST presented highest value in group subjected to drink D0
(142.26±3.31 IU/L) than that treated with drinks D1 (128.01±4.51 IU/L) and D2 (135.99±2.15
IU/L). Whereas, in study III (diabetic rats), D0 fed group recorded maximum AST content
(119.18±2.26 IU/L) that decreased non-substantially in D1 (110.54±2.44 IU/L) and D2
(114.78±5.18 IU/L) designated groups, respectively.
4.6.12.2. Serum alanine transaminase (ALT)
It is evident from the F values presented in Table 49 that treatments significantly affected
serum alanine transaminase (ALT) content in study II while non-significant difference was
observed in study I & III.
For this trait, mean serum ALT levels in value added drinks D0, D1 and D2 assigned groups
were 53.87±1.88, 48.31±1.69 and 51.06±2.04 IU/L, respectively (study II). Nonetheless in
study I & III, non-momentous decline in ALT values was observed in groups administrated
to drinks D0 (47.45±1.60 & 51.24±1.45 IU/L), D1 (45.50±1.40 & 46.98±2.11 IU/L) and D2
(45.98±1.93 & 49.12±2.58 IU/L).
4.6.12.3. Serum alkaline phosphatase (ALP)
It is comprehended from the statistical analysis (F value) depicted in Table 50 that serum
alkaline phosphatase (ALP) level was affected substantially by treatments in study II & III
whilst non-significant variations was observed in study I.

123
Table 48. Effect of value added drinks on serum AST (IU/L)
Studies
Treatments
F value
D0 D1 D2
Study I 106.52±3.06 103.87±5.14 104.85±4.14 0.31NS
Study II 142.26±3.31a 128.01±4.51
b 135.99±2.15ab 12.80
**
Study III 119.18±2.26 110.54±2.44 114.78±5.18 4.43NS
* = Significant Study I: Normal rats D0: Control drink
**= Highly significant Study II: Hypercholesterolemic rats D1: Drink containing pomegranate peel extract
NS= Non Significant Study III: Diabetic rats D2: Drink containing pomegranate bagasse extract

124
Table 49. Effect of value added drinks on serum ALT (IU/L)
Studies
Treatments
F value
D0 D1 D2
Study I 47.45±1.60 45.50±1.40 45.98±1.93 1.13NS
Study II 53.87±1.88a 48.31±1.69
b 51.06±2.04ab 6.59
**
Study III 51.24±1.45 46.98±2.11 49.12±2.58 3.09NS
* = Significant Study I: Normal rats D0: Control drink
**= Highly significant Study II: Hypercholesterolemic rats D1: Drink containing pomegranate peel extract
NS= Non Significant Study III: Diabetic rats D2: Drink containing pomegranate bagasse extract

125
Table 50. Effect of value added drinks on serum ALP (IU/L)
Studies
Treatments
F value
D0 D1 D2
Study I 152.39±3.45 147.02±2.37 148.53±5.21 1.55NS
Study II 244.25±2.51a 222.01±3.43
c 229.62±2.15b 50.70
**
Study III 224.84±4.14a 208.38±5.12
b 214.65±5.18ab 8.85
*
* = Significant Study I: Normal rats D0: Control drink
**= Highly significant Study II: Hypercholesterolemic rats D1: Drink containing pomegranate peel extract
NS= Non Significant Study III: Diabetic rats D2: Drink containing pomegranate bagasse extract

126
Means for serum ALP in study I (normal rats) were documented as 152.39±3.45,
147.02±2.37 and 148.53±5.21 IU/L in drinks D0, D1 and D2 prescribed groups, respectively.
Nonetheless in study II (hypercholesterolemic rats), highest serum ALP concentration was
recorded in case of drink D0 (244.25±2.51 IU/L) that momentously decreased in D1
(222.01±3.43 IU/L) and D2 (229.62±2.15 IU/L) subjected groups. Similarly, in study III
(diabetic rats), maximum serum ALP concentration i.e. 224.84±4.14 IU/L was reported in
drink D0 administrated group that significantly minimized to 208.38±5.12 IU/L and
241.65±5.18 IU/L in drinks D1 and D2 fed groups.
Liver is an organ responsible for numerous functions like blood filtration, nutrients
metabolism and detoxification of harmful substances. There is a direct relationship between
oxidative stress condition and hepatotoxicity. During liver malfunctioning, higher amount of
ROS are produced causing an increase in concentration of enzymes AST, ALP and ALT in
serum profiling. To improve liver soundness, various phytomolecules based products are
attaining consumer attention owing to their hepato-protective & strong antioxidant potential,
and anti-inflammatory ability (El-Sayed et al., 2014; Toklu et al., 2007).
Recently, Saad et al. (2015) illuminated the hepatoprotective role of pomegranate peel
polyphenols against elevated levels of serum ALT and AST in streptozotocin (STZ) induced
diabetic rats. Pomegranate peel powder was orally subjected to diabetic rats @ 200 mg/kg for
twenty days resulted in substantial decrease i.e. 28.91% and 37.28%, respectively in
concentration of respective enzymes. Same effect of pomegranate peel and juice methanolic
extract against elevated levels of hepatic enzymes was revealed from the experimental work
of Moneim et al. (2011). They observed significant decline (62.49% and 37.89%) in serum
ALP concentration after pomegranate peel (200 mg/kg/day) & juice (3mL/kg/day) extract
administration for 21 days. Later, Ashoush et al. (2013) noticed rise in content of serum ALT
and AST levels during carbon tetrachloride (CCl4) induced hepatotoxicity. However,
pomegranate peel supplemented diet significantly affected (57.48 and 43.82%) this
enhancement, respectively. They inferred that this protective ability of pomegranate
polyphenols can be due to its radical scavenging and antioxidant potential.

127
4.6.13. Kidney functioning tests
Kidney functioning test i.e. serum urea and serum creatinine were calculated to check the
renal soundness status of formulated value added drinks.
4.6.13.1. Serum urea
The statistical analysis (F values) exhibited non-substantial effect of value added drinks (D1
and D2) on serum urea level in study I (normal rats) however, momentous variations were
recorded in study II (hypercholesterolemic rats) & III (diabetic rats) (Table 51).
In study I, means for serum urea levels in drinks D0 (control), D1 (pomegranate peel extract
supplemented drink) and D2 (pomegranate bagasse extract based drink) treated groups were
documented as 21.15±1.61, 20.53±1.72 and 20.80±1.93 mg/dL, respectively. Whereas,
significant decline was noticed in study II for D0, D1 and D2 administrated groups as
28.71±0.56, 27.23±0.18 and 27.81±0.61 mg/dL, correspondingly. Likewise, in study III,
maximum serum urea level was found in group relying on drink D0 (31.40±0.43 mg/dL) that
substantially decreased in groups subjected to value added drinks D1 (30.06±0.34 mg/dL)
and D2 (30.41±0.21 mg/dL), respectively.
4.6.13.2. Serum creatinine
The F values indicated non-substantial effect of value added drinks on serum creatinine level
in study I & II whereas in study III momentous variations for this trait was noticed (Table
52).
In study I (normal rats), drink D0 fed group showed the highest creatinine value i.e.
0.89±0.01 mg/dL while, D1 and D2 treated groups demonstrated lesser values as 0.87±0.01
and 0.88±0.03 mg/dL, respectively (Table 52). The same trend was observed in study II
(hypercholesterolemic rats); serum creatinine levels in D0 equipped group was noted as
0.90±0.01 mg/dL that reduced non-significantly in groups administrating on drink D1
(0.86±0.02 mg/dL) and D2 (0.88±0.03 mg/dL). On the other hand in study III, a significant
decrease was recorded from 0.99±0.04 mg/dL in D0 subjected group to 0.92±0.01 and
0.94±0.02 mg/dL in drink D1 and D2 designated groups, respectively.

128
Table 51. Effect of value added drinks on serum urea (mg/dL)
Studies
Treatments
F value
D0 D1 D2
Study I 21.15±0.61 20.53±0.72 20.80±0.93 0.50NS
Study II 28.71±0.56a 27.23±0.18
b 27.81±0.61ab 6.97
*
Study III 31.40±0.43a 30.06±0.34
b 30.41±0.21b 12.60
**
* = Significant Study I: Normal rats D0: Control drink
**= Highly significant Study II: Hypercholesterolemic rats D1: Drink containing pomegranate peel extract
NS= Non Significant Study III: Diabetic rats D2: Drink containing pomegranate bagasse extract

129
Table 52. Effect of value added drinks on serum creatinine (mg/dL)
Studies
Treatments
F value
D0 D1 D2
Study I 0.89±0.01 0.87±0.01 0.88±0.03 0.82NS
Study II 0.90±0.01a 0.86±0.02
c 0.88±0.03b 2.57
NS
Study III 0.99±0.04a 0.92±0.01
b 0.94±0.02ab 5.57
*
* = Significant Study I: Normal rats D0: Control drink
**= Highly significant Study II: Hypercholesterolemic rats D1: Drink containing pomegranate peel extract
NS= Non Significant Study III: Diabetic rats D2: Drink containing pomegranate bagasse extract

130
Healthy kidney carry out many functions like sustaining body homeostasis by regulating
electrolytic balance, maintenance of body blood pressure and excretion of body toxic
substances in the form of urine (Garcia et al., 2012). Chronic kidney disease had up surged
rapidly in the last decade mainly due to ingestion of toxins like pesticides and low quality
diet. A diseased kidney results in elevated amount of urea and creatinine in blood due to
improper filtration by glomerulus (Agarwal et al., 2012). This threat is predominant in
patients that are diagnosed with hypertension, diabetes, hypercholesterolemia and
cardiovascular diseases (Chauhan and Vaid, 2009).
The conclusions of El-Habibi (2013) are in agreement with the outcomes of current
exploration concerning reduction of serum creatinine & urea levels in adenine induced
kidney toxicity due to utilization of pomegranate peel and juice polyphenols. They observed
significant decrease in serum creatinine and urea levels in rats having renal toxicity.
Similarly, Ibrahium (2010) also evidently proved similar trend in hypercholesterolemic rats.
Continuous consumption of pomegranate peel ethanolic extract @ 400 and 800 mg/kg body
weight in an efficacy trial prolonging for a period of 28 days affected significant decline in
serum creatinine and urea levels due to its high anti-oxidative potential. In terms of kidney
safety, pomegranate peel and bagasse polyphenols are considered safe because they help in
regulating serum urea and creatinine levels.
4.6.14. Hematological aspects
4.6.14.1. Red blood cells (RBC)
It is clearly inferred from the F values shown in Table 53 that treatments imparted non-
momentous impact on red blood cells (RBC) in study I whereas remaining all studies (study
II & III) were affected significantly by treatments.
Mean RBC levels for drinks D0, D1 and D2 treated groups in study I were recorded as
7.73±0.64, 7.89±0.15 and 7.87±0.30 cells/pL, respectively. Nevertheless in study II
(hypercholesterolemic rats), the least value for this respective trait was observed in groups
subjected to drink D0 (6.98±0.18 cells/pL) that expressively increased by value added drinks
application D1 (7.48±0.16 cells/pL) and D2 (7.18±0.11 cells/pL). Likewise in study III
(diabetic rats), the RBC content were calculated as 7.01±0.14, 7.41±0.13 and 7.23±0.11
cells/pL in drinks D0, D1, and D2 administrated groups, respectively.

131
4.6.14.2. Hemoglobin (Hb)
The F values (Table 54) reveals that value added drinks affected the hemoglobin (Hb)
concentration substantially in the bio-efficacy experimental trial except for study I.
In study I (normal rats), mean hemoglobin level for drinks D0, D1 and D2 fed groups were
documented as 11.41±0.15, 11.71±0.51 and 11.67±0.48 g/L, respectively. However in study
II, the mean values for this aspect in case of drink D0 designated group was 11.16±0.41 g/L
that significantly boosted to 12.16±0.21 and 11.61±0.12 g/L in D1 and D2 treated groups
(Table 54). In the same way, D0 administrated group in study III showed lowermost Hb level
(11.79±0.11 g/L) however, value added drinks D1 and D2 treated groups demonstrated greater
values i.e. 12.80±0.21 and 12.20±0.13 g/L, respectively.
4.6.14.3. Hematocrit
The F values depicted in Table 55 presented non-significant effect of value added drinks on
the hematocrit content in all experimented studies. Means for hematocrit levels in case of D0,
D1 and D2 subjected groups were recorded as 38.57±1.28, 39.18±1.36 and 38.95±1.64%,
correspondingly (Study I). In study II, this attribute non-momentously raised from
38.16±1.72% (D0) to 40.78±1.63% (D1) and 40.07±1.32% (D2). Similarly pattern was
practically noticed in study III, where D0 fed group exhibited 37.48±1.21% hematocrit level
as compared to D1 (39.28±1.71%) and D2 (38.77±1.28%) administrated groups.
4.6.14.4. Mean corpuscular volume (MCV)
It is apparent from F values illustrated in Table 56 that treatments displayed non-momentous
changes in MCV levels in study I, II and III. Means (study I) showed that prepared value
added drinks did not alter this trait significantly and documented levels of MCV in D0, D1
and D2 prescribed groups were 52.45±2.26, 53.17±2.32 and 52.62±2.55 fL, respectively.
Likewise in hypercholesterolemic study, MCV levels were noticed as 44.71±2.34,
45.19±2.72 and 44.94±2.65 fL in D0, D1 and D2 administrated groups, respectively. The
MCV concentration (study III) in group treated with drink D0 was 43.43±1.98 fL that
enhanced non-significantly to 44.05±2.46 and 43.55±2.81 fL in D1 and D2 fed groups,
correspondingly.

132
Table 53. Effect of value added drinks on red blood cell indices
RBC (cells/pL)
Treatments
F value
D0 D1 D2
Study I 7.73±0.64 7.89±0.15 7.87±0.30 0.13NS
Study II 6.98±0.18b 7.48±0.16
a 7.18±0.11ab 8.13
*
Study III 7.01±0.14b 7.41±0.13
a 7.23±0.11ab 7.43
*
* = Significant Study I: Normal rats D0: Control drink
**= Highly significant Study II: Hypercholesterolemic rats D1: Drink containing pomegranate peel extract
NS= Non Significant Study III: Diabetic rats D2: Drink containing pomegranate bagasse extract

133
Table 54. Effect of value added drinks on Hemoglobin
Hemoglobin (g/L)
Treatments
F value
D0 D1 D2
Study I 11.41±0.15 11.71±0.51 11.67±0.48 0.47NS
Study II 11.16±0.41b 12.16±0.21
a 11.61±0.12ab 9.96
*
Study III 11.79±0.11c 12.80±0.21
a 12.20±0.13b 31.8
**
* = Significant Study I: Normal rats D0: Control drink
**= Highly significant Study II: Hypercholesterolemic rats D1: Drink containing pomegranate peel extract
NS= Non Significant Study III: Diabetic rats D2: Drink containing pomegranate bagasse extract

134
Table 55. Effect of value added drinks on Hematocrit
Hematocrit (%)
Treatments
F value
D0 D1 D2
Study I 38.57±1.28 39.18±1.36 38.95±1.64 0.14NS
Study II 38.16±1.72 40.78±1.63 40.07±1.32 2.25NS
Study III 37.48±1.21 39.28±1.71 38.77±1.28 1.29NS
* = Significant Study I: Normal rats D0: Control drink
**= Highly significant Study II: Hypercholesterolemic rats D1: Drink containing pomegranate peel extract
NS= Non Significant Study III: Diabetic rats D2: Drink containing pomegranate bagasse extract

135
Table 56. Effect of value added drinks on mean corpuscular volume (MCV)
MCV (fL)
Treatments
F value
D0 D1 D2
Study I 52.45±2.26 53.17±2.32 52.62±2.55 0.08NS
Study II 44.71±2.34 45.19±2.72 44.94±2.65 0.03NS
Study III 43.43±1.98 44.05±2.46 43.55±2.81 0.05NS
* = Significant Study I: Normal rats D0: Control drink
**= Highly significant Study II: Hypercholesterolemic rats D1: Drink containing pomegranate peel extract
NS= Non Significant Study III: Diabetic rats D2: Drink containing pomegranate bagasse extract

136
4.6.14.5. White blood cells (WBC)
Statistical analysis (F value) elucidated non-significant effect of value added drinks on WBC
in all the performed studies (Table 57). In this milieu, means for study I, II and III reveals
highest WBC content for groups administrated to D0 (15.71±0.96, 15.51±0.28 and
16.08±0.21 cells/nL) that decreased non-substantially in groups subjected to drinks D1
(15.36±0.25, 14.97±0.45 and 15.57±0.34 cells/nL) D2 (15.55±0.38, 15.11±0.52 and
15.85±0.21 cells/nL), respectively.
4.6.14.6. Neutrophils
Statistical analysis (F value) inferred that neutrophils concentration varied non-significantly
due to utilization of value added drinks (D1 & D2) in study I whereas significant differences
were observed in Study II & III (Table 58). In study I (normal rats), means for respective
attribute were documented as 60.78±2.29, 62.64±2.25 and 61.90±2.54 % in drinks D0, D1 and
D2 administrated groups, respectively. While in study II (hypercholesterolemic rats),
neutrophils level in D0 (58.74±1.15%) fed group meaningfully boosted in D1 (62.18±1.21%),
followed by D2 (61.74±1.01%). Likewise in study III (diabetic rats), D0 treatment revealed
lower value (56.29±1.06%) as compared to D1 (59.73±1.18%) and D2 (58.53±1.04%)
subjected groups.
4.6.14.7. Monocytes
The F values from Table 59 exposed that drinks imparted non-significant variances on
monocytes levels in all bio-evaluated studies. In normal rats, mean monocytes values were
6.17±0.21, 6.57±0.27 and 6.27±0.24% for D0, D1 and D2 designated groups, respectively.
Likewise in hypercholesterolemic rats, means for respective traits in D0 (5.01±0.32%) fed
group non-momentously raised in D1 (5.44±0.23%) and D2 (5.21±0.35%) subjected groups.
In diabetic rats, monocytes content improved non-momentously from 4.45±0.26 (D0) to
5.11±0.41 and 4.96±0.23% in D1 and D2 treated groups, correspondingly.
4.6.14.8. Lymphocytes
It is quite evident from F value depicted in Table 60 that concentration of lymphocytes was
affected non-substantially by administration of value added drinks in all experimental
studies.

137
Mean values for this trait in D0, D1 and D2 (study I) treated groups were recorded as
31.19±1.13, 32.06±1.45 and 31.65±1.56%, respectively. Similarly in study II, least
lymphocytes content were noticed in D0 (32.98±1.15%) ingested group that eventually
enhanced non-substantially due to application of value added drinks; D1 (33.76±1.21%) and
D2 (33.51±1.01). Likewise in study III, lymphocytes levels noticed in D0 (36.74±0.21%)
treated group was lesser than that observed in D1 (37.79±0.34%) and D2 (37.51±1.63%)
administrated groups.
Changed hematological aspects are the markers that indicate adversative impact of drug or
diet which eventually results in multi-dimensional abnormalities in human body. Due to
onset of hypercholesterolemia, diabetes and oxidative stress related diseases irregularities in
both red blood and white blood cells indices occur. Many researchers have probed that
membrane oxidation and production of excessive toxins are the potential reasons that cause
decline in hemoglobin (Hb), red blood cells (RBC) and monocytes whereas rise in levels of
white blood cells (WBC) occur (Kumar, 2000; Hoffman et al., 2004; Madjid et al., 2004).
The outcomes on the subject of RBCs, WBCs and Hb indices of present investigation are in
harmony with the findings of Khalil (2004). Concentration of red blood cells, hemoglobin,
MCV and hematocrit enhanced due to consumption of pomegranate peel extract by diabetic
rats. Similarly, Şen et al. (2014) documented that pomegranate extract utilization did not
impart any adverse effect on the hematological aspects therefore endorsing its safety.
4.6.15. Electrolyte balance
4.6.15.1. Sodium (Na)
The F values in Table 61 displayed non-significant effect of treatments on Na content in the
entire bio-efficacy trial. In study I, means for Na level in drinks D0, D1 and D2 prescribed
groups were noticed as 111.43±1.84, 113.23±3.68 and 112.19±3.77 mEq/L, respectively.
Similarly, the Na content in study II was also non-significantly raised from 104.25±4.12
mEq/L (D0) to 109.43±2.98 mEq/L (D1) and 106.98±3.87 mEq/L (D2). Likewise in study III,
drink D0 subjected group exhibited 108.18±2.58 mEq/L of Na that enhanced non-
significantly in D1 and D2 treated groups i.e. 112.81±3.69 and 109.74±4.15 mEq/L,
correspondingly.

138
Table 57. Effect of value added drinks on white blood cell indices
WBC (cells/nL)
Treatments
F value
D0 D1 D2
Study I 15.71±0.96 15.36±0.25 15.55±0.38 0.24NS
Study II 15.51±0.28 14.79±0.45 15.11±0.52 1.28NS
Study III 16.08±0.21 15.57±0.34 15.85±0.21 2.88NS
* = Significant Study I: Normal rats D0: Control drink
**= Highly significant Study II: Hypercholesterolemic rats D1: Drink containing pomegranate peel extract
NS= Non Significant Study III: Diabetic rats D2: Drink containing pomegranate bagasse extract

139
Table 58. Effect of value added drinks on Neutrophils
Neutrophils (%)
Treatments
F value
D0 D1 D2
Study I 60.78±2.29 62.64±2.25 61.90±2.54 0.47NS
Study II 58.74±1.15 62.18±1.21 61.74±1.01 8.29*
Study III 56.29±1.06 59.73±1.18 58.53±1.04 7.63*
* = Significant Study I: Normal rats D0: Control drink
**= Highly significant Study II: Hypercholesterolemic rats D1: Drink containing pomegranate peel extract
NS= Non Significant Study III: Diabetic rats D2: Drink containing pomegranate bagasse extract

140
Table 59. Effect of value added drinks on Monocytes
Monocytes (%)
Treatments
F value
D0 D1 D2
Study I 6.17±0.21 6.57±0.27 6.27±0.24 2.23NS
Study II 5.01±0.32 5.44±0.23 5.21±0.35 1.50NS
Study III 4.45±0.26 5.11±0.41 4.96±0.23 3.73NS
* = Significant Study I: Normal rats D0: Control drink
**= Highly significant Study II: Hypercholesterolemic rats D1: Drink containing pomegranate peel extract
NS= Non Significant Study III: Diabetic rats D2: Drink containing pomegranate bagasse extract

141
Table 60. Effect of value added drinks on Lymphocytes
Lymphocytes (%)
Treatments
F value
D0 D1 D2
Study I 31.19±1.13 32.06±1.45 31.65±1.56 0.29NS
Study II 32.98±1.15 33.76±1.21 33.51±1.01 0.38NS
Study III 36.74±0.21 37.79±0.34 37.51±1.63 0.35NS
* = Significant Study I: Normal rats D0: Control drink
**= Highly significant Study II: Hypercholesterolemic rats D1: Drink containing pomegranate peel extract
NS= Non Significant Study III: Diabetic rats D2: Drink containing pomegranate bagasse extract

142
4.6.15.2. Potassium (K)
F values showed non-significant effect of value added drinks on K content in all
experimented studies (Table 61). In study I, means for potassium levels in groups
administrated to D0, D1 and D2 were noticed as 5.96±0.17, 6.14±0.37 and 6.05±0.35 mEq/L,
correspondingly. In study II, the mean K values in D0 treated group was 5.11±0.21 mEq/L
that non-significantly increased in case of D1 (5.58±0.34 mEq/L) and D2 (5.39±0.28 mEq/L)
subjected groups. Means for K value (study III) in D0 prescribed group was 4.62±0.32 mEq/L
that varied non-substantially with special reference to groups fed on drinks D1 and D2 as
5.10±0.22 and 4.85±0.16 mEq/L, respectively.
4.6.15.3. Calcium (Ca)
Statistical analysis (F values) in Table 61 expounded non-significant effect of prepared
drinks on Ca values in all studies. Means for respective attribute in D0, D1 and D2 treated
groups were recorded as 13.71±0.55, 14.11±0.62 and 13.85±0.36 mEq/L, respectively (study
I). Similarly in study II, calcium content in D0 (12.17±0.66 mEq/L) fed group varied non-
significantly to D1 (12.63±0.53 mEq/L) and D2 (12.31±0.42 mEq/L) administrated groups.
Likewise in diabetic rats, values for Ca were noticed as 11.78±0.68 mEq/L in D0 designated
group that was less than D1 (12.06±0.61 mEq/L) and D2 (11.93±0.57 mEq/L) utilized groups.
Electrolyte balance has central role in upholding body homeostasis which ultimately
safeguards proper myocardial functioning, acid/base ratio, oxygen equilibrium and fluid
balance. On the other hand, its inequity results in dehydration, oxidative stress and kidney
malfunctioning (Paudel and Karma, 2003). Several investigations have conclusively
advocated that polyphenols ingesting is helpful in modulating the body electrolytes balance
by managing the activity of gland aldosterone which is considered vital in secretion of
sodium and potassium via urination (Ahmed and Ali, 2010).

143
Table 61. Effect of value added drinks on electrolytes balance
Sodium (Na)
mEq/L
Treatments F values
D0 D1 D2
Study I
111.43±1.84 113.23±3.68 112.19±3.77 0.24
NS
Study II
104.25±4.12 109.43±2.98 106.98±3.87
1.48NS
Study III
108.18±2.58 112.81±3.69 109.74±4.15 1.33
NS
Potassium (K) Treatments
F values D0 D1 D2
Study I
5.96±0.17 6.14±0.37 6.05±0.35 0.25
NS
Study II
5.11±0.21 5.58±0.34 5.39±0.28 2.11
NS
Study III
4.62±0.32 5.10±0.22 4.85±0.16 2.94
NS
Calcium (Ca) Treatments
F values D0 D1 D2
Study I
13.71±0.55 14.11±0.62 13.85±0.36 0.45
NS
Study II
12.17±0.66 12.63±0.53 12.31±0.42 0.56
NS
Study III
11.78±.68 12.06±0.61 11.93±0.57 0.15
NS
NS= Non Significant
Study I: Normal rats
Study II: Hypercholesterolemic rats
Study III: Diabetic rats
D0: Control drink
D1: Drink containing pomegranate peel extract
D2: Drink containing pomegranate bagasse extract

144
CHAPTER 5
SUMMARY
Phytogenic nutritional strategies have acquired attention of the consumers owing to their
therapeutic and nutraceutical role against lifestyle related physiological disorders. In this
perspective, pomegranate peel and bagasse polyphenols especially punicalagin has potential
to ameliorate various physiological ailments. In the current investigation, three different
pomegranate peels and bagasses were characterized for their nutritional and compositional
profile, antioxidant potential and punicalagin quantification. Subsequently, during product
development phase, three types of value added/functional drinks were prepared by
supplementation of pomegranate peel extract (D1) and bagasse extract (D2) alongside control
(D0). Developed value added drinks were then analyzed for their physicochemical properties
and antioxidant assay alongside the drinks were sensory evaluated. Lastly, during bio-
efficacy trial an effort was made to assess the nutraceutical/functional worth of formulated
value added drinks against various metabolic disorders like hypercholesterolemia and
diabetes.
Results regarding the proximate analysis for pomegranate peels and bagasses revealed that
Kandhari showed highest protein contents in peel (3.31±0.14) and bagasse (13.44±1.07)
amongst all varieties used in this study. Similarly, fat, fiber and ash contents ranged from
1.26±0.10 (Badana) to 1.31±0.18 (Desi), 11.21±1.26 (Badana) to 16.32±0.96% (Kandhari)
and 2.98±0.12 (Badana) to 3.59±0.03 (Kandhari) for pomegranate peels, however, for
bagasses their values varied from 19.26±0.86 (Badana) to 22.06±1.52 (Kandhari),
39.34±2.49 (Badana) to 47.29±2.21% (Kandhari) and 2.42±0.18 (Badana) to 2.68±0.02
(Kandhari), respectively. Likewise, outcomes of mineral profiling in present study elucidated
that all the experimented minerals were maximum in Kandhari peel and bagasse, except for
iron (Fe) content that was highest in Desi variety.
For the isolation of bioactive moieties, extraction module comprised of varieties (Kandhari,
Desi and Badana) and solvents (methanol, ethanol and ethyl acetate). The antioxidant indices
of both pomegranate peel and bagasse extracts were significantly affected by treatments and

145
solvents however, their interactive effect showed non-momentous trend except for TFC of
pomegranate bagasse.
The HPLC quantification of punicalagin revealed highest values in peel & bagasse of
Kandhari (110.59±8.84 & 1.77±0.41 mg/g) trailed by Desi (98.41±10.75 & 1.08±0.39 mg/g)
and lowest value (79.11±10.53 & 0.89±0.39 mg/g) was observed in Badana variety.
Considering the solvents, punicalagin content for methanol, ethanol and ethyl acetate were
105.77±15.39, 96.46±15.64 and 85.89±16.81 mg/g, respectively. While, means for solvent
regarding pomegranate bagasse exhibited values of 1.62±0.44, 1.29±0.52 and 0.83±0.42
mg/g punicalagin in methanolic, ethanolic and ethyl acetate extracts.
In product development phase, three types of value added drinks were formulated i.e. D1
(containing 3% pomegranate peel extract) and D2 (containing 3% pomegranate bagasse
extract) whereas D0 acted as control. The treatments and storage had significant effect of on
L*, a*, b*, Chroma and hue angle. Additionally, treatments exhibited non-substantial effect
on acidity, pH and TSS of the resultant drinks. However, storage significantly affected these
parameters except for TSS. Further, the total phenolic contents (TPC) for treatments D1 and
D2 were documented as 230.32±18.46 and 28.47±5.00 mg/g GAE, respectively. Besides TFC
and DPPH values for treatments D1 & D2 were 49.44±3.95 & 8.16±2.36 mg/g RE and
61.56±6.64 & 38.84±6.39%, respectively. Likewise, during storage study the recorded values
for TPC varied from 141.85 (0 days) to 119.28 mg/g GAE (60 days), indicating a significant
decline. Similarly, a decreasing trend for TFC and DPPH was noted that varied from 31.73 to
25.38 mg/g RE and 55.84 to 43.11%, correspondingly from commencement to end of the
storage study.
The developed value added drinks were evaluated following 9-point hedonic scale system for
quality attributes like color, flavor, sourness, sweetness and overall acceptability. Mean
squares for all the sensory attributes illustrates substantial difference as a function of
treatments and storage except for flavor and sourness scores that differed non-significantly
by treatments. The results of present investigation expounded that pomegranate peel and
bagasse extract supplementation did not impart any deleterious effect on respective sensory
attributes.

146
To investigate the worth of pomegranate peel and bagasse polyphenol based value added
drinks against different physiological threats, bio-evaluation trial was carried out. During
efficacy trial, three types of studies were designed i.e. study I (normal rats), study II
(hypercholesterolemic rats) and study III (diabetic rats). Additionally, each study was further
divided into three groups G-1, G-2 and G-3 depending on the drinks i.e. D0, D1 and D2 that
they were subjected to respectively. It was deduced that pomegranate peel extract
supplemented drink was more effective in comparison to bagasse extract based drink for
weight management.
At termination of study, lipid profiling was carried out to assess hypolipidemic potential of
pomegranate peel and bagasse extract supplemented drinks. The value added drinks had
momentous effect on serum cholesterol, LDL, HDL and triglycerides content in all studies
except for study I. Regarding percent reduction, highest decline in cholesterol levels was
assessed in group treated with drink D1 (14.52%) trailed by D2 (9.07%). Accordingly, in
study III maximum percent reduction (10.25%) in cholesterol levels was recorded in group
subjected to drink D1 whilst least reduction was caused due to intake of drink D2 (6.98%), as
compared to control.
The LDL level was affected significantly by value added drinks in all studies except for
study I. Considering percent reduction, in study II, pomegranate peel extract based drink (D1)
caused highest decrease in LDL levels up to 14.86% as compared to pomegranate bagasse
extract based drink D2 (10.74%). Similar trend was observed in study III, in which value
added drink containing pomegranate peel extract (D1) lowered the LDL values by 11.75%,
whilst drink comprising of pomegranate bagasse extract (D2) lead to 7.72% LDL reduction,
correspondingly as compared to D0 (control drink). The statistical analysis revealed that
value added drinks imparted non-substantial differences on HDL levels in study I, whilst
study II & III were affected significantly. Purposely, study II revealed momentous rise in
groups subjected to drink D1 (5.46%) trailed by D2 (3.82%), correspondingly. Accordingly,
study III presented substantial elevation for HDL values in groups that were treated with
drinks D1 and D2 as 5.08 and 2.99% during subsequent trial.
On the other hand, highest percent reductions in triglycerides concentration for study II i.e.
9.99 and 5.63% was observed in D1 and D2 treated groups, respectively. Similarly, value

147
added drinks D1 and D2 caused 7.05 and 4.22% decline in triglycerides levels in diabetic rats
(study III).
To authenticate anti-diabetic effect, serum profiling results of subjected drinks revealed that
respective treatments exhibited significant effect on glucose and insulin concentration in all
the conducted studies excluding study I. Regarding percent decrease in blood glucose levels,
pomegranate peel extract based drink (D1) led to 7.50% reduction whereas (D2) pomegranate
bagasse extract based drink resulted in 5.11% reduction in study II. Likewise in study III
(diabetic rats), maximum reduction occurred due to feeding of drink D1 (13.28%) and
minimum decrease in case of drink D2 (8.71%) treated group. It was also depicted that value
added drink containing pomegranate peel extract (D1) performed better against glucose
related abnormalities than drink containing pomegranate bagasse extract (D2). Moreover,
percent increase in insulin levels; in study III pomegranate peel extract supplemented drink
(D1) resulted in 8.74% incremental effect on insulin concentration whereas, D2 (pomegranate
bagasse extract based drink) resulted 4.37% incline for this trait. Similarly, for
hypercholesterolemic rats (study II), the value added drinks D1 and D2 resulted 5.66 and
3.38% rise in serum insulin levels, respectively.
The value added drinks improved the glutathione activity and reduced the serum TBARS
level in rats during all studies. In study I & II, the percent rise due to intake of drinks D1 and
D2 was 6.86 and 4.52% & 19.06 and 12.84%, respectively. The same incremental trend was
noticed in study III, glutathione levels uplifted by consumption of drink D1 and D2 i.e. 16.51
and 11.07%, correspondingly. The maximum TBARS reduction was recorded in study I as
6.93 and 5.45% in case of drink D1 and D2 designated groups, respectively. Similarly, the
maximum decrease regarding respective parameter was recorded in study II
(hypercholesterolemic rats) up to 16.71% (D1) and 10.61% (D2). Moreover, in study III
(diabetic rats) highest TBARS decline (9.78%) was noted in drink D1 consumed group
followed by 6.97% in D2 administrated group. The normal ranges of liver and kidney
functioning tests were the indicators for safety assessment of the formulated value
added/functional ingredients. It has been observed that pomegranate peel and bagasse extract
based value added drinks did not impart any adverse effect on the RBC and WBC alongside
electrolyte balance.

148
In the nutshell, pomegranate peel and bagasse polyphenolic extract based value added drinks
are effective to ameliorate various physiological syndromes. However, pomegranate peel
extract based value added drink performed better against hypercholesterolemia and diabetes
as compared to pomegranate bagasse extract based drink with special reference to manage
elevated serum cholesterol and glucose concentrations. The value added drinks enhanced the
overall antioxidant status by diminishing the body lipid peroxidation. Conclusively,
pomegranate peel and bagasse extract polyphenols are effectual to curtail various metabolic
disorders thereby have potential to be used in diet based regimen for the mentioned
vulnerable segments.

149
CONCLUSIONS
In the selection of extraction solvents and varieties of pomegranate peel and bagasse,
Kandhari was selected due to:
o Maximum phenolic contents extracted using solvent methanol.
o Highest antioxidative activity based on DPPH radical scavenging activity.
o Punicalagin content, which is the responsible component in bioactivity, was
found to be abundant in methanolic extract of Kandhari variety.
The drinks formulated with Kandhari peel and bagasse extracts were compatible as
compared to control with special reference to sensory attributes.
In biological study using rats, the prepared value added drinks had momentous effect
on serum cholesterol, LDL, HDL, and triglycerides content in all studies except for
study I (normal rats).
Value added drink containing peel extract performed better against diabetic
abnormalities than drink comprising of bagasse extract.
Pomegranate waste based value added drinks significantly elevated serum glutathione
content (GSH) and lessen the concentration of serum TBARS.
Conclusively, drinks containing methanolic extracts of Kandhari peel and bagasse
had profound antidiabetic and hypocholesterolemic potential which may provide
health benefits for consumer.

150
RECOMMENDATIONS
1. Locally available nutrients dense byproducts must be explored for the preparation of
value added foods to enhance health status
2. Pomegranate polyphenol based value added drinks should be encouraged in daily diet
to safeguard against various metabolic disorders
3. Novel extraction and isolation techniques should be adopted to improve
nutraceuticals recovery at commercial scale
4. Isolation and purification of punicalagin should be carried out to develop products in
order to curtail oxidative stress related complications

151
LITERATUE CITED
Aaron, J.I., D.J. Mela and R.E. Evans. 1994. The influences of attitudes, beliefs and label
information on perceptions of reduced-fat spread. Appetite. 22:25-37.
Adams, L.S., N.P. Seeram, B.B. Aggarwal, Y. Takada, D. Sand and D. Heber. 2006.
Pomegranate juice, total pomegranate tannins and punicalagin suppress inflammatory
cell signaling in colon cancer cells. J. Agric. Food Chem. 54:980-985.
Adkins, J.L. 2002. Toward a human serum blood proteome: Analysis by multidimensional
separation coupled with mass spectrometry. Mol. Cell Proteomics. 1:947-955.
Afaq, F., A. Malik, D. Syed, D. Maes, M.S. Matsui and H. Mukhtar. 2005a. Pomegranate
fruit extract modulates UV-B-mediated phosphorylation of mitogen-activated protein
kinases and activation of nuclear factor kappa B in normal human epidermal
keratinocytes paragraph sign. Photochem. Photobiol. 81:38-45.
Afaq, F.M. Saleem, C.G. Krueger, J.D. Reed and H. Mukhtar. 2005b. Anthocyanin- and
hydrolysable tannin-rich pomegranate fruit extract modulates MAPK and NF-
κBpathways and inhibits skin tumorigenesis in CD-1 mice. Int. J. Cancer. 113:423-
433.
Agarwal, R. and A.D. Sinha. 2012. Thiazide diuretics in advanced chronic kidney disease. J.
Am. Soc. Hypertens. 1-10.
Aguilar, C.N., A. Aguilera-Carbo, A. Robledo. J. Ventura, R. Belmares, D, Martinez, R.
Rodríguez-Herrera and J. Contreras. 2008. “Production of antioxidant nutraceutlcals
by solid-state cultures of pomegranate (Punica granatum) peel and creosote bush
(Larrea tridentata) leaves. Food Technol. Biotech. 46(2):218-222.
Ahmad, R.S., M.S. Butt, N. Huma and M.T. Sultan. 2012. Green tea catechins based
functional drink (Green cool) improves the antioxidant status of SD rats fed on high
cholesterol and sucrose diets. Pak. J. Pharm. Sci. 26(4):721-726.

152
Ahmed, M., A. Ahmad, Z.A. Chatha and S.M.R. Dilshad. 2008. Studies on preparation of
ready to serve mandarin (Citrus reticulata) diet drink. Pak. J. Agric. Sci. 45(4):470-
476.
Ahmed, M.A., E.M. El Morsy, and A.A. Ahmed. 2014. Pomegranate extract protects against
cerebral ischemia/reperfusion injury and preserves brain DNA integrity in rats. Life
sciences. 110(2):61-69.
Ahmed, M.M. and S.E. Ali. 2010. Protective effect of pomegranate peel ethanol extract
against ferric nitrilotriacetate induced renal oxidative damage in rats. J. Cell Mol.
Biol. 8(1):35-43.
Ahmed, S., N. Wang, B.B. Hafeez, V.K. Cheruvu and T.M. Haqqi. 2005. Punica granatum
L. extract inhibits IL-1β–Induced expression of matrix metalloproteinases by
inhibiting the activation of MAP kinases and NF-κB in human chondrocytes in
vitro. J. Nutr. 135(9):2096-2102.
Ahn, J., W. Choi, S. Kim and T. Ha. 2011. Anti-diabetic Effect of Watermelon (Citrullus
vulgaris Schrad) on Streptozotocin-induced Diabetic Mice. Food Sci. Biotechnol.
20(1):251-254.
Akbarpour, V., K. Hemmanti and M. Sharifani. 2009. Physical and chemical properties of
pomegranate (Punica grantum L.) fruits in maturation stage. Amer-Eurasian J. Agric.
Environ. Sci. 6(4):411-416.
Akbarzadeh, A., D. Norouzian, M.R. Mehrabi, S. Jamshidi, A. Farhangi, A. Allah, S.
Mofidian and R.B. Lame. 2007. Induction of diabetes by streptozotocin in rats. Indian
J. Clin. Biochem. 22:60-64.
Al-Attar, A.M. and T.A. Zari. 2010. Influences of crude extract of tea leaves, Camellia
sinensis, on streptozotocin diabetic male albino mice. Saudi J. Biol. Sci. 17:295-301.
Albasha, M.O. and A.E. Azab. 2016. Hepatorenal Protective Effects of Pomegranate (Punica
granatum) Juice against Nicotine Induced Toxicity in Guinea Pigs. J. Advan. Biol.
Biotechnol. 5(1):1-13.

153
AlHaj, M., E. Kazzam, N.J. Nagelkerke, F. Nyberg, M.G. Nicholls and A. Adem. 2011.
Effect of dehydration in the presence and absence of the angiotensin receptor blocker
losartan on blood constituents in the camel. J. Med. Sci. 4(2):73-78.
Alissa, E.M. and G.A. Ferns. 2012. Functional foods and nutraceuticals in the primary
prevention of cardiovascular diseases. J. Nutr. Matab. 1-16. doi:
10.1155/2012/569486.
Al-Muammar, M.N. and F.F. Khan. 2012. Obesity: the preventive role of the pomegranate
(Punica granatum). Nutr. 28(6):595-604.
Al-Muslehi, M.S.M. 2013. Effect of Powder of Pomegranate (Punica granatum) Peels on
Lipid Profile in Hypercholesterolemic Rats. Kufa J. Vet. Med. Sci. 4(1):111-117.
Al-Rawahi, A.S., M.S. Rahman, N. Guizani and M.M. Essa. 2013.Chemical composition,
water sorption isotherm, and phenolic contents in fresh and dried pomegranate
peels. Drying Technol. 31(3):257-263.
Alshatwi, A.A., M.A. Al Obaaid, S.A. Al Sedairy, E. Ramesh and K.Y. Lei. 2011. Black and
green tea improves lipid profile and lipid peroxidation parameters in Wistar rats fed a
high-cholesterol diet. J. Physiol. Biochem. 67:95-104.
Althunibat, O.Y., A.H. Al-Mustafa, K. Tarawneh, K.M. Khleifat, B.H. Ridzwan and H.N.
Qaralleh. 2010. Protective role of Punica granatum L. peel extract against oxidative
damage in experimental diabetic rats. Process Biochem. 45(4):581-585.
Altunkaya, A., R.V. Hedegaard, L. Brimer, V. Gökmen and L.H. Skibsted. 2013. Antioxidant
capacity versus chemical safety of wheat bread enriched with pomegranate peel
powder. Food Funct. 4(5):722-727.
Amakura, Y., M. Okada, S. Tsuji and Y. Tonogai. 2000. High-performance liquid
chromatographic determination with photodiode array detection of ellagic acid in
fresh and processed fruits. J. Chromatogr. A. 896:87-93.
American Dietetic Association. 2009. Position of the American dietetic association:
functional foods. J. Am. Dietetic Assoc. 109:735-746.

154
Anwar, T., M. Sharma, K.K. Pillai, G. Khan and M.M. Safhi. 2012. Antihyperglycemic,
antidyslipidemic and antioxidant activity of Rhus coriaria in STZ-induced type 2
diabetic rats. Afr. J. Pharma. Pharacol. 6(41):2851-2855.
AOAC. 2006. Official Methods of Analysis of Association of Official Analytical Chemists
International. In: Horwitz, W. (Ed.), 18th ed. AOAC Press, Arlington, VA, USA
Arao, K., Y. Wang, N. Inoue, J. Hirata, J. Cha, K. Nagao and T. Yanagita, 2004. Dietary
effect of pomegranate seed oil rich in 9cis, 11trans, and 13cis conjugated linolenic
acid on lipid metabolism in obese, hyperlipidemic OLETF Rats. Lipids Health Dis.
3(1):1-7.
Ardekani, M.R.S., M. Hajimahmoodi, M.R. Oveisi, N. Sadeghi, B. Jannat, A.M. Ranjbar, N.
Gholam and T. Moridi. 2011. Comparative Antioxidant Activity and Total Flavonoid
Content of Persian Pomegranate (Punica granatum L.) Cultivars. Iran. J. Pharm. Res..
10(3):519-524.
Aruoma, O.I., L.S. Coles, B. Landes and J.E. Repine. 2012. Functional benefits of
ergothioneine and fruits and vegetable derived nutraceuticals: overview of the
supplemental issue contents. Prev. Med. 54:4-8.
Ashoush, I.S., O.I. El-Batawy, G.A. El-Shourbagy. 2013. Antioxidant activity and
hepatoprotective effect of pomegranate peel and whey powders in rats. Ann. Agric.
Sci. 58(1):27-32.
Aslam, M.N., E.P. Lansky and J. Varani. 2006. Pomegranate as a cosmeceutical source:
Pomegranate fractions promote proliferation and procollagen synthesis and inhibit
matrix metalloproteinase-1 production in human skin cells. J. Ethnopharmacol.
103:311-318.
Asres, K., F. Bucar, E. Knauder, V. Yardley, H. Kendrick and S.L. Croft. 2001. In vitro
antiprotozoal activity of extract and compounds from the stem bark of Combretum
molle. Phytother. Res. 15(7):613-617.
Aviram, M. and L. Dornfeld. 2001. Pomegranate juice consumption inhibits serum
angiotensin converting enzyme activity and reduces systolic blood pressure.
Atherosclerosis. 158:195-198.

155
Aviram, M., L. Dornfeld, M. Rosenblat, N. Volkova, M. Kaplan, R. Coleman, T. Hayek, D.
Presser and B. Fuhrman. 2000. Pomegranate juice consumption reduces oxidative
stress, atherogenic modifications to LDL, and platelet aggregation: studies in humans
and in atherosclerotic apolipoprotein E-deficient mice. Am. J. Clin. Nutr. 71:1062-
1076.
Aviram, M., M. Rosenblat, D. Gaitini, S. Nitecki, A. Hofman, L. Dornfeld, N. Volkova, D.
Presser, J. Attias, H. Liker and T. Hayek. 2004. Pomegranate juice consumption for 3
years by patients with carotid artery stenosis reduces common carotid intima-media
thickness, blood pressure and LDL oxidation. Clin. Nutr. 23:423-433.
Aviram, M., N. Volkova, R. Coleman, M. Dreher, M.K. Reddy, D. Ferreira and M.
Rosenblat. 2008. Pomegranate phenolics from the peels, arils, and flowers are
antiatherogenic: studies in vivo in atherosclerotic apolipoprotein E-deficient (E0)
mice and in vitro in cultured macrophages and lipoproteins. J. Agric. Food Chem.
56(3):1148-1157.
Ayub, M., J. Ullah, A. Muhammad and A. Zeb. 2010. Evaluation of strawberry juice
preserved with chemical preservatives at refrigeration temperature. Int. J. Nutr.
Metab. 2(2):27-32.
Bahadoran, Z., P. Mirmiran and F. Azizi. 2013. Dietary polyphenols as potential
nutraceuticals in management of diabeties: a review. J. Diabetes Metab. Disord. 12:1-
9.
Barboza, Y., Marquez, K. Parra, M.P. Pinero and L.M. Medina. 2012. Development of a
potential functional food prepared with pigeon pea (Cajanus cajan), oats and
Lactobacillus reuteri. ATCC 55730. Int. J. Food Sci. Nutr. 63(7):813-820.
Bárta, I., P. Smerák, Z. Polívková, H. Sestáková, M. Langová, B. Turek and J. Bártová. 2006.
Current trends and perspectives in nutrition and cancer prevention. Neoplasma.
53:19-25.
Basu, A. and K. Penugonda. 2009. Pomegranate juice: a heart-healthy fruit juice. Nutr. Rev.
67(1):49-56.

156
Basu, A., K. Sanchez, M.J. Leyva, M. Wu, N.M. Betts and C.E. Aston. 2010. Green tea
supplementation affects body weight, lipids, and lipid peroxidation in obese subjects
with metabolic syndrome. J. Am Coll. Nutr. 29(1):31-40.
Basu, S.K., J.E. Thomas and S.N. Acharya. 2007. Prospects for growth in global
nutraceutical and functional food markets: a Canadian perspective. Aust. J. Basic
Appl. Sci. 1(4):637-649.
Basuny, A.M., A.M. Gaafar and S.M. Arafat. 2009. Tomato lycopene is a natural antioxidant
and can alleviate hypercholesterolemia. Afr. J. Biotechnol. 8(23):6627-6633.
Beceanu, D. 2008. Nutritive, nutraceutical, medicinal and energetic value of fruits and
vegetable. Cercetari Agron. Moldova. 4:65-81.
Bellesia, A., E. Verzelloni and D. Tagliazucchi. 2015. Pomegranate ellagitannins inhibit α-
glucosidase activity in vitro and reduce starch digestibility under simulated gastro-
intestinal conditions. Int. J. Food Sci. Nutr. 66(1):85-92.
Betoret, E., N. Betoret, D. Vidal and P. Fito. 2011. Functional foods development. Trends
Food Sci. Technol. 22(9):498-508.
Bhnsawy, R.M.E. and F.E. El-Deeb. 2012. A Special Biological Evaluation for Some Food
Industrial Wastes. Life Sci. J. 9(4):2241-2249.
Bhol, S. and J.D.S. Bosco. 2013. Enrichment of Yeast Leavened Bread by Pomegranate
Bagasse Powder. Int. J. Sci. Res. 2(5):298-300.
Bialonska, D., S.G. Kasimsetty, S.I. Khan, and D. Ferreira. 2009. Urolithins, intestinal
microbial metabolites of pomegranate ellagitannins, exhibit potent antioxidant
activity in a cell-based assay. J. Agric. Food Chem. 57(21):10181-10186.
Brand-Williams, W., M.E. Cuvelier and C. Berset. 1995. Use of a free radical method to
evaluate antioxidant activity. Lebensm. Wiss. Technol. 28:25-30.
Brautbar, N. and J. Williams. 2002. Industrial solvents and liver toxicity: risk assessment,
risk factors and mechanisms. Int. J. Hyg. Environ. Health. 205:479-491.

157
Bursill, C.A., M. Abbey and P.D. Roach. 2007. A green tea extract lowers plasma cholesterol
by inhibiting cholesterol synthesis and upregulating the LDL receptor in the
cholesterol-fed rabbit. Atherosclerosis. 193:86-93.
Butt, M.S. and M.T. Sultan. 2009. Green tea: Nature’s defense against malignancies. Crit.
Rev. Food Sci. Nutr. 49(5):463-473.
Caduff, A., H.U. Lutz, L. Heinemann, G.D. Benedetto, M.S.Talary and S. Theander. 2011.
Dynamics of blood electrolytes in repeated hyperand/or hypoglycaemic events in
patients with type 1 diabetes. Diabetologia. 10:2210-2219.
Cam, M. and Y. Hisil. 2010. Pressurised water extraction of polyphenols from pomegranate
peels. Food Chemistry. 123:878-885.
Castonguay, A., H. Gali, E. Perchellet, X. Gao, M. Boukharta, G. Jalbert, T. Okuda, T.
Yoshida, T. Hatano and J. Perchellet. 1999. Antitumorigenic and antipromoting
activities of ellagic acid, ellagitannins and oligomeric anthocyanin and
procyanidin. Int. J. Oncol. 10:367-373.
Cerdá, B., J.C. Espín, S. Parra, P. Martínez and F.A. Tomás-Barberán. 2004. The potent in
vitro antioxidant ellagitannins from pomegranate juice are metabolised into
bioavailable but poor antioxidant hydroxy–6H–dibenzopyran–6–one derivatives by
the colonic microflora of healthy humans. Eur. J. Nutr. 43(4):205-220.
Cerdá, B., R. Llorach, J.J. Cerón, J.C. Espín and F.A. Tomás-Barberán. 2003. Evaluation of
the bioavailability and metabolism in the rat of punicalagin, an antioxidant
polyphenol from pomegranate juice. Eur. J. Nutr. 42(1):18-28.
Chang, C., M. Yang, H. Wen and J. Chern. 2002. Estimation of total flavonoid content in
propolis by two complementary colorimetric methods J. Food Drug Anal. 10:178-
182.
Chauhan, V. and M. Vaid. 2009. Dyslipidemia in chronic kidney disease: managing a high-
risk combination. Postgrad. Med. 121(6):54-61.
Chen, N., R. Bezzina, E. Hinch, P.A. Lewandowski, D. Cameron-Smith, M.L. Mathai, M.
Joise, A.J. Sinclair, D.P. Begg, J.D. Wark, H.S. Weisinger and R.S. Weisinger. 2009.
Green tea, black tea, and epigallocatechin modify body composition, improve glucose

158
tolerance, and differentially alter metabolic gene expression in rats fed a high-fat diet.
Nutr. Res. 29:784-793.
Clifford, M.N and A. Scalbert. 2000. Ellagitannins-nature, occurrence and dietary burden. J.
Sci. Food Agric. 80(7):1118-1125.
Coda, R., A. Lanera, A. Trani, M. Gobbetti and R.D. Cagno. 2012. Yogurt-like beverages
made of a mixture of cereals, soy and grape must: Microbiology, texture, nutritional
and sensory properties. Int. J. Food Microbiol. 155:120-127.
Colonna, M., A. Danzon, P. Delafosse, N. Mitton, S. Bara, A.M. Bouvier, O. Ganry, A.V.
Guizard, G. Launoy, F. Molinie, E.A. Sauleau, C. Schvartz, M. Velten, P. Grosclaude
and B. Tretarre. 2008. Cancer prevalence in France: time trend, situation in 2002 and
extrapolation to 2012. Eur. J. Cancer. 44(1):115-122.
Cooper, G.J. 2011. Therapeutic potential of copper chelation with triethylenetetramine in
managing diabetes mellitus and Alzheimer’s disease. Drugs. 71:1281-1320.
D’Archivio, M., C. Filesi, R. Varì, B. Scazzocchio and R. Masella. 2010. Bioavailability of
the polyphenols: status and controversies. Int. J. Mol. Sci. 11(4):1321-1342.
Das, A.K., S.C. Mandal, S.K. Banerjee, S. Sinha, B.P. Saha and M. Pal. 2001. Studies on the
Hypoglycaemic Activity of Punica granatum Seed in Streptozotocin induced Diabetic
Rats. Phytother. Res. 15:628-629.
Davidson, M.H., K.C. Maki, M.R. Dicklin, S.B. Feinstein, M.S. Witchger, M. Bell, D.K.
McGuire, J.C. Provos, H. Liker and M. Aviram. 2009. Effects of consumption of
pomegranate juice on carotid intima-media thickness in men and women at moderate
risk for coronary heart disease. Am. J. Cardiol. 104(7):936-942.
De Marzo, A.M, A.K. Meeker, S. Zha, J. Luo, M. Nakayama and E.A. Platz. 2003. Human
prostate cancer precursors and pathobiology. Urology. 62:55-62.
De Nigris, F., M.L. Balestrieri, S. Williams-Ignarro, F.P. D’Armiento, C. Fiorito, L.J. Ignarro
and C. Napoli. 2007. The influence of pomegranate fruit extract in comparison to
regular pomegranate juice and seed oil on nitric oxide and arterial function in obese
Zucker rats. Nitric Oxide. 17:50-54.

159
De Nigris, F., S. Williams-Ignarro, C. Botti, V. Sica, L.J. Ignarro and C. Napoli. 2006.
Pomegranate juice reduces oxidized low-density lipoprotein downregulation of
endothelial nitric oxide synthase in human coronary endothelial cells. Nitric Oxide.
15(3):259-263.
De Silva, K.L.S.R., D.Y. Jadhav, R.M.U.S.K. Rathnayaka and A.K. Sahoo. 2014.
Investigation of Nutrient Content, Phytochemical Content, Antioxidant Activity and
Antibacterial Activity of Inedible Portion of Pomegranate (Punica granatum L.). Eur.
J. Med. Plants. 4(5):610-622.
Divisi, D., S. Di Tommaso, S. Salvemini, M. Garramone and R. Crisci. 2006. Diet and
cancer. Acta Biomed. 77:118-123.
Drent, M.L. and E.A. Van der Veen. 1995. First clinical studies with Orlistat: a short review.
Obes. Res. 3:623s-625s.
Duangmal, K., B. Saicheuaa and S. Sueeprasan. 2008. Color evaluation of freeze-dried
roselle extract as a natural food colorant in a model system of a drink. LWT-Food
Sci. Technol. 41:1437-1445.
Elfalleh, W., H. Hannachi, N. Tlili, Y. Yahia, N. Nasri and A. Ferchichi. 2012. Total
phenolic contents and antioxidant activities of pomegranate peel, seed, leaf and
flower. J. Med. Plants Res. 6:4724-4730.
El-Habibi, E.M. 2013. Renoprotective effects of Punica granatum (pomegranate) against
adenine-induced chronic renal failure in male rats. Life Sci. J. 10(4):2059-2069.
El-Sayed, A.S., A.M. Badawi and M.T. Asmaa. 2014. The Protective Effect of Olive Leaf
and Pomegranate Peel Extracts On Oxidative Stress And Liver Injury Induced By
Oxytetracycline In Albino Rats. J. Drug Res. Egypt. 35(1):33-41.
Engelhard, Y.N., B. Gazer and E. Paren. 2006. Natural antioxidants from tomato extract
reduce blood pressure in patients with grade-1 hypertension: a double blind, placebo-
controlles pilot study. Am. Heart J. 151:1-6.
Erdman, J.W., N.A. Ford and B.L. Lindshield. 2009. Are the health attributes of lycopene
related to its antioxidant function. Achieves Biochem. Biophys. 483(2):229-235.

160
Esmaillzadeh, A and L. Azadbakht. 2008. Food intake patterns may explain the high
prevalence of cardiovascular risk factors among Iranian women. J. Nutr. 138(8):1469-
1475.
Esmaillzadeh, A., F. Tahbaz, I. Gaieni, H. Alavi-Majd and L. Azadbakht. 2006. Cholesterol-
lowering effect of concentrated pomegranate juice consumption in type II diabetic
patients with hyperlipidemia. Int. J. Vitam. Nutr. Res. 76:147-151.
Espín, J.C., M.T. Garcia-Conesa and F.A. Tomas-Barberan. 2007b. Nutraceuticals: facts and
fiction. Phytochem. 68:2986-3008.
Espín, J.C., R. González-Barrio, B. Cerdá, C. López-Bote, A.I. Rey and F.A. Tomás-
Barberán. 2007a. Iberian pig as a model to clarify obscure points in the bioavailability
and metabolism of ellagitannins in humans. J. Agric. Food Chem. 55(25):10476-
10485.
Farah, I.O. 2005. Assessment of Cellular Responses to Oxidative Stress using MCF-7 Breast
Cancer Cells, Black Seed (N. sativa L.) Extracts and H2O2. Int. J. Environ. Res.
Public Health. 2(3):411-419.
Faria, A., R. Monteiro, I. Azevedo and C. Calhau. 2007a. Pomegranate juice effects on
cytochrome p450s expression: In vivo studies. J. Med. Food. 10:643-649.
Faria, A., R. Monteiro, N. Mateus, I. Azevedo and C. Calhau. 2007b. Effect of pomegranate
(Punica granatum) juice intake on hepatic oxidative stress. Eur. J. Nutr. 46:271-
278.
Feng, C.H., H.Y. Huang and C.Y. Lu. 2011. Quantitation of the glutathione in human
peripheral blood by matrix assisted laser desorption ionization time-of-flight mass
spectrometry coupled with micro-scale derivatization. Anal. Chem. 690(2):209-214.
Finkel, T. and N.J. Holbrook. 2000. Oxidants, oxidative stress and the biology of ageing.
Nature. 408(6809):239-247.
Fischer, U.A., R. Carle and D.R. Kammerer. 2011. Identification and quantification of
phenolic compounds from pomegranate (Punica granatum L.) peel, mesocarp, aril and
differently produced juices by HPLC-DAD-ESI/MS(n). Food Chem. 127(2):807-821.

161
Fradet, L., L.R. Bégin, P. Karakiewicz, A.M. Masson and F. Saad. 2004. Nuclear factor-
kappaB nuclear localization is predictive of biochemical recurrence in patients with
positive margin prostate cancer. Clin. Cancer Res. 10:8460-8464.
Fuhrman, B., A. Elis and M. Aviram. 1997. Hypercholesterolemic effect of lycopene and
beta-carotene is related to suppression of cholesterol synthesis and augmentation of
LDL receptor activity in macrophages. Biochem. Biophys. Res. Commun. 233:658-
662.
Fuhrman, B., N. Volkova and M. Aviran. 2005. Pomegranate juice oxidized LDL uptake and
cholesterol biosynthesis in macrophages. J. Nutr. Biochem. 16:570-576.
Fuhrman, B., N. Volkova and M. Aviran. 2010. Pomegranate juice polyphenols increase
recombinant paraoxonase-1 binding to high-density lipoprotein: studies in vitro and in
diabetic patients. Nutr. 26(4):359-366.
Gadi, R., A. Amanullah and V.M. Figueredo. 2012. HDL-C: Does it matter? An update on
novel HDL-directed pharmaco-therapeutic strategies. Int. J. Cardiol. 167(3):646-655.
Garcia, G.G., P. Harden and J. Chapman. 2012. Global role of kidney transplantation, for the
World Kidney Day Steering Committee. Hong Kong J. Nephrol. 14:1-6.
Gibson, S.A., Z. Korade and R.C. Shelton. 2012. Oxidative stress and glutathione response in
tissue cultures from persons with major depression. J. Psychiat. Res. 46:1326-1332.
Gil, M.I., F.A. Tomàs-Barberàn, B. Hess-Pierce, D.M. Holcroft and A.A. Kader. 2000.
Antioxidant activity of pomegranate juice and its relationship with phenolic
composition and processing. J. Agric. Food Chem. 48(10):4581-4589.
GOP (Government of Pakistan). 2011. Agricultural Statistics of Pakistan 2010-2011.
Pakistan Bureau of Statistics, Statistics Division, Govt. of Pakistan, Islamabad,
Pakistan.
Gorinstein, S., R. Haruenkit, S. Poovarodom, Y. Park, S. Vearasilp, M. Suhaj, K.S. Ham,
B.G. Heo, J.Y. Cho and H.G. Jang. 2009. The comparative characteristics of snake
and kiwi fruits. Food Chem. Toxicol. 47:1884-1891.

162
Gotto, A.M. 1998. Triglyceride as a risk factor for coronary artery disease. Am. J. Cardiol.
82(8):22-25.
Gylling, H., P. Puska, E. Vartiainen and T.A. Miettinen. 1999. Retinol, vitamin D, carotenes
and α-tocopherol in serum of moderately hypercholesterolemic population consuming
sitostanol ester margarine. Atherosclerosis. 145:279-285.
Hadipour‐Jahromy, M. and R. Mozaffari‐Kermani. 2010. Chondroprotective effects of
pomegranate juice on monoiodoacetate‐induced osteoarthritis of the knee joint of
mice. Phytother. Res. 24(2):182-185.
Haminiuk, C.W., M.S. Plata‐Oviedo, A.R. Guedes, A.P. Stafussa, E. Bona and S.T. Carpes.
2011. Chemical, antioxidant and antibacterial study of Brazilian fruits. Int. J. Food
Sci. Tech. 46(7):1529-1537.
Hamza, R.Z., N.A. Hussien and A.M.A. El-Azez. 2014. Hepatoprotective and
nephroprotective effects of Al-Taif Pomegranate (Punicagranatum L) extract against
toxicity induced by Atrazine and Malathion pesticides in male albino mice. J. Chem.
Pharm. Res. 6(10):807-817.
Hanhineva, K., R. Torronen, I. Bondia-Pons, J. Pekkinen, M. Kolehmainen, H. Mykkanen
and K. Poutanen. 2010. Impact of dietary polyphenols on carbohydrate metabolism.
Int. J. Mol. Sci. 11:1365-1402.
Hasler, M.C. 2000. The changing face of functional food. J. Am. Coll. Nutr. 19(5):499S-
506S.
Hassan, S.W., M. Lawal, B.V. Muhammed, R.A. Umar and V. Saidu. 2007. Effects of
anthraquinone glycosides and aqueous ethanol extracts for Ficus sycomorus L.
(Moraceae) on rat liver and kidney functions. Asian J. Biochem. 2(2):136-141.
Hayek, T., M. Rosenblat, N. Volkova, J. Attias, R. Mahamid, S. Hamoud and M. Aviram.
2014. The Effects of Pomegranate Extract (POMx), Simvastatin, or Metformin
Therapies in Hypercholesterolemic or in Diabetic Patients on Daily Rhythms of
Serum Lipids and of Oxidative Stress: A Pilot Study. J. Hortic. 1(2):1-10.

163
Hayes, J.D. and D.J. Pulford. 1995. The Glutathione S-Transferase Supergene Family:
Regulation of GST and the Contribution of the lsoenzymes to Cancer
Chemoprotection and Drug Resistance Part II. Crit. Rev. Biochem. Mol. 30(6):521-
600.
Heber, D., R.N. Schulman and N.P. Seeram (Eds.). 2006. Pomegranates: ancient roots to
modern medicine. CRC press.
Heinecke, J.W. 1998. Oxidants and antioxidants in the pathogenesis of atherosclerosis:
implications for the oxidized low density lipoprotein hypothesis. Atherosclerosis
141:1-15.
Heinecke, J.W. 2006. Lipoprotein oxidation in cardiovascular disease: chief culprit or
innocent bystander? J. Exp. Med. 203(4):813-816.
Henson, S., O. Masakure and J. Cranfield. 2008. The propensity for consumer to offset health
risks through the use of functional foods and nutraceuticals: the case of lycopene.
Food Qual. Prefer. 19:395-406.
Hoffman, M., A. Blum, R. Baruch, E. Kaplan and M. Benjamin. 2004. Leukocytes and
coronary heart disease. Atherosclerosis. 172:1-6.
Hora, J.J., E.R. Maydew, E.P. Lansky and C. Dwivedi. 2003. Chemopreventive effects of
pomegranate seed oil on skin tumor development in cd1 mice. J. Med. Food. 6:157-
161.
Hossin, F.L.A. 2009. Effect of Pomegranate (Punica granatum) Peels and It’s Extract on
Obese Hypercholesterolemic Rats. Pak. J. Nutr. 8(8):1251-1257.
Huang, C.S., M.C. Yin and L.C. Chiu. 2011. Antihyperglycemic and antioxidative potential
of Psidium guajava fruit instreptozotocin-induced diabetic rats. Food Chem.
49(9):2189-2195.
Huang, D., B. Ou and R.L. Prior. 2005. The chemistry behind antioxidant capacity assays. J.
Agric. Food Chem. 53:1841-1856.

164
Huang, H.C. and J.K. Lin. 2012. Pu-erh tea, green tea, and black tea suppresses
hyperlipidemia, hyperleptinemia and fatty acid synthase through activating AMPK in
rats fed a high-fructose diet. Food Func. 3:170.
Hwang, S.L., P.H. Shih and G.C. Yen. 2012. Neuroprotective effects of citrus flavonoids. J.
Agric. Food Chem. 66(4):877-885.
Ibrahium, M.I. 2010. Efficiency of pomegranate peel extract as antimicrobial, antioxidant
and protective agents. World J. Agric. Sci. 6(4):338-344.
Ignarro, L.J., R.E. Byrns, D. Sumi, F. de Nigris and C. Napoli. 2006. Pomegranate juice
protects nitric oxide against oxidative destruction and enhances the biological actions
of nitric oxide. Nitric Oxide 15:93-102.
Jacobs, D.S., W.R. DeMott, H.J. Grady, R.T. Horvat, D.W. Huestis and B.L. Kasten. 1996.
Laboratory test handbook, 4th ed. Lexi-comp Inc., Hudson (Cleveland).
Jenkins, D.J., Kendall, C.W., Nguyen, T.H., Marchie, A., Faulkner, D.A., Ireland, C., Josse,
A. R., Vidgen, E., Trautwein, E. A., Lapsley, K. G., Holmes, C., Josse, R. G., Leiter,
L. A., Connelly, P. W. and Singer, W. 2008. Effect of plant sterols in combination
with other cholesterol-lowering foods. Metab. 57(1):130-139.
Kaplan, M., T. Hayek, A. Raz, R. Coleman, L. Dornfeld, J. Vaya and M. Aviram. 2001.
Pomegranate juice supplementation to atherosclerotic mice reduces macrophage lipid
peroxidation, cellular cholesterol accumulation and development of atherosclerosis. J
Nutr. 131:2082-2089.
Katz, S.R., R.A. Newman and E.P. Lansky. 2007. Punica granatum: heuristic treatment for
diabetes mellitus. J. Med. Food. 10(2):213-217.
Kausar, H., S. Saeed, M.M. Ahmad and A. Salam. 2012. Studies on the development and
storage stability of cucumber-melon functional drink. J. Agric. Res. 50(2):239-248.
Khalil, E.A.M. 2004. Antidiabetic effect of an aqueous extract of pomegranate (Punica
granatum L.) peels in normal and alloxan diabetic rats. Egypt. J. Hosp. Med.
16(1):92-99.

165
Kim, J.I., J.K. Paik, O.Y. Kim, H.W. Park, J.H. Lee, Y. Jang and J.H. Lee. 2011. Effects of
lycopene supplementation on oxidative stress and markers of endothelial function on
healthy men. Atherosclerosis. 215:189-195.
Kim, J.S. 2005. Radical scavenging capacity and antioxidant activity of E vitamin fraction in
rice bran. J. Food Sci. 70:208-213.
Kim, N.D., R. Mehta, W. Yu, I. Neeman, T. Livney, A. Amichay, D. Poirier, P. Nicholls, A.
Kirby, W. Jiang, R. Mansel, C. Ramachandran, T. Rabi, B. Kaplan and E. Lansky.
2002. Chemopreventive and adjuvant therapeutic potential of pomegranate (Punica
granatum) for human breast cancer. Breast Cancer Res. Treat. 71:203-217.
Kim, Y., J.B. Keogh and P.M. Clifton. 2016. Polyphenols and Glycemic Control. Nutrients.
8(1):1-27.
Klimczak, I., M. Małecka, M. Szlachta, A. Gliszczyńska-Świgło. 2007. Effect of storage on
the content of polyphenols, vitamin C and the antioxidant activity of orange juices. J.
Food Comp. Anal. 20(3):313-322.
Kulkarni, A.P., H.S. Mahal, S. Kapoor and S.M. Aradhya. 2007. In Vitro studies on the
binding antioxidant, and cytotoxic actions of punicalagin. J. Agric. Food. Chem.
55:1491-1500.
Kulkarni, A.P., S.M. Aradhya and S. Divakar. 2004. Isolation and identification of a radical
scavenging antioxidant–punicalagin from pith and carpellary membrane of
pomegranate fruit. Food Chem. 87:551-557.
Kumar, D., S. Singh, A.K. Singh and S.I. Rizvi. 2013. Pomegranate (Punica granatum) peel
extract provides protection against mercuric chloride-induced oxidative stress in
Wistar strain rats. Pharm. Biol. 51(4):441-446.
Kumar, P. 2000. Impact of anaemia in patients with head and neck cancer. Oncol. 5:13-18.
Kushwaha, S.C., M.B. Bera and P. Kumar. 2013. Nutritional Composition of Detanninated
and Fresh Pomegranate Peel Powder. J. Environ. Sci. Toxicol. Food Technol..
7(1):38-42.

166
Kuti, T., A. Hegyi, and B. Kemeny. 2004. Analysis of sensory data of different food products
by ANOVA. Chemometrics Intelligent Lab. Syst. 72:253-257.
Lansky, E. P. and R.A. Newman. 2007. Punica granatum (pomegranate) and its potential for
prevention and treatment of inflammation and cancer. J. Ethnopharmacol. 109:177-
206.
Larrosa, M., F.A. Tomás-Barberán and J.C. Espín. 2006. The dietary hydrolysable tannin
punicalagin releases ellagic acid that induces apoptosis in human colon
adenocarcinoma Caco-2 cells by using the mitochondrial pathway. J. Nutr. Biochem.
17(9):611-625.
Lei, F., X.N. Zhang, W. Wang et al. 2007. Evidence of anti-obesity effects of the
pomegranate leaf extract in high-fat diet induced obese mice. Int. J. Obesity.
31(6):1023-1029.
Li, Y., C. Guo, J. Yang, J. Wei, J. Xu and S. Cheng. 2006. Evaluation of antioxidant
properties of pomegranate peel extract in comparison with pomegranate pulp extract.
Food Chem. 96(2):254−260.
Li, Y., Y. Qi, T.H.W. Huang, J. Yamahara and B.D. Roufogalis. 2008. Pomegranate flower:
a unique traditional antidiabetic medicine with dual PPAR-𝛼/-𝛾 activator properties.
Diabetes Obes. Metab. 10(1):10-17.
Liu, J. 2005. Oleanolic acid and ursolic acid: research perspectives. J. Ethnopharmacol.
100:92-94.
Longtin, R. 2003. The pomegranate: nature’s power fruit? J. Natl. Cancer Inst. 95(5):346-
348.
Lowe, M.E. 1994. Pancreatic triglyceride lipase and colipase: insights into dietary fat
digestion. Gastroenterol. 107:1524-1536.
Lu, J., K. Ding and Q. Yuan. 2008. Determination of punicalagin isomers in pomegranate
husk. Chromatographia. 68:303-306.
Lu, J., K. Ding and Q. Yuan. 2011. One-Step Purification of Punicalagin by Preparative
HPLC and Stability Study on Punicalagin. Separ. Sci. Technol. 46:147-154.

167
Madjid, M., I. Awan, J.T. Willerson and S.W. Casscells. 2004. Leukocyte count and
coronary heart disease: implications for risk assessment. J. Am. Coll. Cardiol.
44:1945-1956.
Malik, A., F. Afaq, S. Sarfaraz, V.M. Adhami, D.N. Syed and H. Mukhtar. 2005.
Pomegranate fruit juice for chemoprevention and chemotherapy of prostate
cancer. Proceedings of the National Academy of Sciences of the United States of
America. 102(41):14813-14818.
Manach, C., G. Williamson, C. Morand, A. Scalbert and C. Rémésy. 2005. Bioavailability
and bioefficacy of polyphenols in humans. I. Review of 97 bioavailability studies.
Am. J. Clin. Nutr. 81(1):230S-242S.
Manasathien, J., K. Indrapichate and K. Intarapichet. 2012. Antioxidant Activity and
Bioefficacy of Pomegranate Punica granatum Linn. Peel and Seed Extracts. Global J.
Pharm. 6(2):131-141.
Markovits, N., A.B. Amotz and Y. Levy. 2009. The effect of tomato-derived lycopene on
low carotenoids and enhanced systemic inflammation and oxidative in severe obesity.
Israel Med. Assoc. J. 11:598-601.
Martínez, J.J., P. Melgarejo, F. Hernández, D.M. Salazar and R.Martínez. 2006. Seed
characterisation of five new pomegranate (Punica granatum L.) varieties. Sci. Hort.
110:241-246.
Martin-Moreno, J.M., I. Soerjomataram and G. Magnusson. 2008. Cancer causes and
prevention: A condensed appraisal in Europe in 2008. Eur. J. Cancer. 44(10):1390-
1403.
Marzouk, M.S.A., S.A.A. El-Toumy, F.A. Moharram, N.M. Shalaby and A.A. Ahmed. 2002.
Pharmacologically Active Ellagitannins from Terminalia myriocarpa. Planta
Med. 68(6):523-527.
Matsui, T., S. Ebuchi, M. Kobayashi, K. Fukui, K. Sugita, N. Terahara and K. Matsumoto.
2002. Anti-hyperglycemic effect of diacylated anthocyanin derived from Ipomoea
batatas cultivar Ayamurasaki can be achieved through the alpha-glucosidase
inhibitory action. J. Agric. Food Chem. 50:7244-7248.

168
McEneny, J., P. McPherson, M. Spence, U. Bradley, S. Blair, M. McKinley, I. Young and S.
Hunter. 2012. Does a diet high or low in fat influence the oxidation potential of
VLDL, LDL and HDL subfractions? Nutr. Metabol. Cardiovasc. Dis. 23(7):612-618.
Meilgaard, M.C., G.V. Civille and B.T. Carr. 2007. Sensory evaluation techniques, 4th ed.
C.R.C. Press L.L.C., New York.
Melendez-Martinez, A.J., L. Gomez-Robledo, M. Melgosa, L.M. Vicario and F.J. Heredia.
2011. Color of orange juices in relation to their carotenoid contents as assessed from
different spectroscopic data. J. Food Compos. Analy. 24(6):837-844.
Michos, E.D., C.T. Sibley, J.T. Baer, M.J. Blaha and R.S. Blumenthal, R.S. 2012. Niacin and
statin combination therapy for atherosclerosis regression and prevention of
cardiovascular disease events: reconciling the AIM-HIGH (Atherothrombosis
Intervention in Metabolic Syndrome With Low HDL/High Triglycerides: Impact on
Global Health Outcomes) trial with previous surrogate endpoint trials. J. Am. Coll.
Cardiol. 59(23):2058-2064.
Middha, S.K., T. Usha and T. RaviKiran. 2012. Influence of Punica granatum L. on region
specific responses in rat brain during alloxan-induced diabetes. Asian Pac. J. Trop.
Biomed. 2(2):905-909.
Middha, S.K., T. Usha and V. Pande. 2013a. A Review on Antihyperglycemic and
Antihepatoprotective Activity of Eco-Friendly Punica granatum Peel Waste. Evid.
Based Complement. Alternat. Med. 2013:1-10. doi:10.1155/2013/656172.
Middha, S.K., T. Usha and V. Pande. 2013b. HPLC evaluation of phenolic profile, nutritive
content, and antioxidant capacity of extracts obtained from Punica granatum fruit
peel. Adv. Pharmacol. Sci. 2013:1-6.
Mirdehghan, S.H. and M. Rahemi. 2007. Seasonal changes of mineral nutrients and
phenolics in pomegranate (Punica grantum L.) fruit. Sci. Hort. 111:120-127.
Mishra, V., V. Puranik, V. Singh, M. Verma, N. Yadav and G.K. Rai. 2012. Development of
Vitamin C rich value added beverage. Am. J. Food Technol. 7(4):222-229.

169
Moneim, A.E.A., M.A. Dkhil and S. Al-Quraishy. 2011. Studies on the effect of
pomegranate (Punica granatum) juice and peel on liver and kidney in adult male
rats. J. Med. Plants Res. 5(20):5083-5088.
Moure, A., J.M. Cruz, D. Franco, J.M. Dominguez, J. Sineiro, H. Dominguez, M.J. Nunez
and J.C. Parajo. 2001. Natural antioxidants from residual sources. Food Chem.
72:145-171.
Murtaza, M.A., N. Huma, J. Javaid, M.A. Shabbir, G.M. Din and S. Mahmood. 2004. Studies
on stability of strawberry drink stored at different temperatures. Int. J. Agric. Biol.
6(1):58-60.
Murthy, K.N.C., G.K. Jayaprakasha and R.P. Singh. 2002. Studies on antioxidant activity of
pomegranate (Punica granatum) peel extract using in vivo models J. Agric. Food
Chem. 50(17):4791-4795.
Navarro, M., M. Amigo‐Benavent, M. Mesias, G. Baeza, V. Gökmen, L. Bravo and F.J.
Morales. 2014. An aqueous pomegranate seed extract ameliorates oxidative stress of
human hepatoma HepG2 cells. J. Sci. Food Agric. 94(8):1622-1627.
Negro, D.R., A. Rossi and I. Cerveri. 2003. The burden of COPD in Italy: results from the
confronting COPD survey. Respir. Med. 97:43-50.
Nies, L.K., A.A. Cymbala, S.L. Kasten, D.G. Lamprecht and K.L. Olson. 2006.
Complementary and alternative therapies for the management of dyslipidemia. Ann.
Pharmacother. 40:1984-1992.
Niknahad, H., A. Jamshidzadeh, M. Abbasian and A. R. Mehrabadi, A. 2012.
Hepatoprotective Effect of Pomegranate (Punica Granatum) Fruit Juice and Seed
Extracts against CCL4-Induced Toxicity. Iran. J. Pharm. Sci. 8(3):181-187.
Noda, Y., T. Kaneyuka, A. Mori and L. Packer. 2002. Antioxidant activities of pomegranate
fruit extract and its anthocyanidins: delphinidin, cyanidin, and pelargonidin. J. Agric.
Food Chem. 50:166-171.
Nouri, M.H.K. and A.K. Rezapour. 2011. Effects of tomato supplementation on the level of
serum lipid and lipoproteins in rats fed with high cholesterol. Adv. Environ. Biol.
5(9):3036-3041.

170
Okamoto, T., T. Akuta, F. Tamura, A. van Der Vliet and T. Akaike. 2004. Molecular
mechanism for activation and regulation of matrix metalloproteinases during bacterial
infections and respiratory inflammation. Biol. Chem. 385(11):997-1006.
Omodamiro, R.M., C. Aniedu, U. Chijoke and E. Oti. 2012. Storage and consumer
acceptability of fruit; Ginger based drinks for combating micronutrient deficiency. J.
Stored Prod. Postharvest Res. 3(6):80-82.
Orak, H.H., H. Yagar and S.S. Isbilir. 2012. Comparison of Antioxidant Activities of Juice,
Peel, and Seed of Pomegranate (Punica granatum L.) and Inter-relationships with
Total Phenolic, Tannin, Anthocyanin, and Flavonoid Contents. Food Sci. Biotechnol.
21(2):373-387.
Ozmutlu, S., S. Dede and E. Ceylan. 2012. The effect of lycopene treatment on ACE activity
in rats with experimental diabetes. J. Renin-Angio-Aldo. S. 13(3):328-333.
Palafox‐Carlos, H., J.F. Ayala‐Zavala and G.A. González‐Aguilar. 2011. The role of dietary
fiber in the bioaccessibility and bioavailability of fruit and vegetable antioxidants. J.
Food Sci. 76(1):R6-R15.
Pande, G. and C.C. Akoh. 2009. Antioxidant Capacity and Lipid Characterization of Six
Georgia-Grown Pomegranate Cultivars. J. Agric. Food Chem. 57(20):9427-9436.
Pandit, S., T.K. Sur, U. Jana, P.K. Debnath, S. Sen and D. Bhattacharyya. 2004. Prevention
of carbon tetrachloride-induced hepatotoxicity in rats by Adhatoda vasica leaves.
Indian J. Pharmacol. 36(5):312-320.
Pantuck, A.J., J.T. Leppert and N. Zomorodian. W. Aronson, J. Hong, R.J. Barnard, N.
Seeram, H. Liker, H. Wang, R. Elashoff, D. Heber, M. Aviram, L. Ignarro and A.
Belldegrun. 2006. Phase II study of pomegranate juice for men with rising prostate-
specific antigen following surgery or radiation for prostate cancer. Clin. Cancer Res.
12(13):4018-4026.
Parada, J. and J.M. Aguilera. 2007. Food microstructure affects the bioavailability of several
nutrients. J. Food Sci. 72(2):R21-R32.
Parmar, H.S. and A. Kar. 2007. Antidiabetic potential of Citrus sinensis and Punica
granatum peel extracts in alloxan treated male mice. BioFactors. 31(1):17-24.

171
Parmar, H.S. and A. Kar. 2008. Medicinal values of fruit peels from Citrus sinensis, Punica
granatum and Musa paradisiaca with respect to alterations in tissue lipid
peroxidation and serum concentration of glucose, insulin, and thyroid hormones.
Journal of Medicinal Food. 11(2):376-381.
Pastorekova, S., S. Parkkila, J. Pastorek and C.T. Supuran. 2004. Carbonic anhydrases:
Current state of the art, therapeutic applications and future prospects. J. Enzyme
Inhib. Med. Chem.19:199-229.
Patterson, L.H. and G.I. Murray. 2002. Tumour cytochrome p450 and drug activation. Curr.
Pharm. Des. 8:1335–1347.
Paudel, B.H. and S. Kamar. 2003. Effect of water and saline load on urinary output in healthy
undergraduate Medical Students. J. Nepal Med. Ass. 42:23-26.
Pérez-Vicente, A., P. Serrano, P. Abellán and C. García-Viguera. 2004. Influence of
packaging material on pomegranate juice colour and bioactive compounds, during
storage. J. Sci. Food Agric. 84:639-644.
Peschel, W., W. Dieckmann, M. Sonnenschein and A. Plescher. 2007. High antioxidant
potential of pressing residues from evening primrose in comparison to other oilseed
cakes and plant antioxidants. Ind. Crop Prod. 25:44-54.
Pinelo, M., A. Arnous and A.S. Meyer. 2006. Upgrading of grape skin: Significance of plant
cell-wall structural components and extraction techniques for phenol release. Trends
Food Sci. Technol. 17:579-590.
Poyrazoglu, E., V. Gokmen and N. Artik. 2002. Organic acids and phenolic compounds in
pomegranates (Punica granatum L.) grown in Turkey. J. Food Comp.
Anal. 15(5):567-575.
Quílez, J., J.A. Ruiz, G. Brufau and M. Rafecas. 2006. Bakery products enriched with
phytosterols, α-tocopherol and β-carotene. Sensory evaluation and chemical
comparison with market products. Food Chem. 94(3):399-405.
Radhika, S., K.H. Smila and R. Muthezhilan. 2011. Antidiabetic and Hypolipidemic Activity
of Punica granatum Linnon Alloxan Induced Rats. World J. Med. Sci. 6(4):178-182.

172
Rains, T.M., S. Agarwal and K.C. Maki. 2011. Anti obesity effects of green tea catechins: a
mechanistic review. J. Nutr. Biochem. 22:1-7.
Rajasekaran, A. and M. Kalaivani. 2011. Designer foods and their benefits: a review. J. Food
Sci. Technol. 50(1):1-16.
Rashid, S., A. Jabbar, R.P.J. Michels and J.H. Devries. 2008. Metabolic risk factors, insulin-
resistance and lifestyle in children of type 2 diabetes patients in Karachi, Pakistan.
Diabetes Res. Clin. Prac. 80:399-404.
Ratnam, D.V., D.D. Ankola, V. Bharadwaj, D.K. Sahana and M.N. Kumar. 2006. Role of
antioxidants in prophylaxis and therapy: A pharmaceutical perspective. J. Control
Release. 113:189-207.
Rock, W., M. Rosenblat, R. Miller-Lotan, A.P. Levy, M. Elias and M. Aviram. 2008.
Consumption of Wonderful variety pomegranate juice and extract by diabetic patients
increases paraoxonase 1 association with high-density lipoprotein and stimulates its
catalyticactivities. J. Agric. Food Chem. 56(18):8704-8713.
Rodrigo, R., C. Guichard and R. Charles. 2007. Clinical pharmacology and therapeutic use of
antioxidant vitamins. Fund. Clin. Pharmacol. 21(2):111-127.
Rojas, M.C. and M.S. Brewer. 2007. Effect of natural antioxidants on oxidative stability of
cooked, refrigerated beef and pork. J. Food Sci. 72(4):S282-S288.
Roller, M., Y. Clune, K. Collins, G. Rechkemmer and B. Watzl. 2007. Consumption of
prebiotics inulin enriched with oligofructose in combination with the probiotics
Lactobacillus rhamnosus and Bifidobacterium lactis has minor effects on selected
immune parameters in polypectomised and colon cancer patients. Br. J. Nutr. 97: 676-
684.
Rosenblat, M., N. Volkova, R. Coleman and M. Aviram. 2006. Pomegranate byproduct
administration to apolipoprotein e-deficient mice attenuates atherosclerosis
development as a result of decreased macrophage oxidative stress and reduced
cellular uptake of oxidized low-density lipoprotein. J. Agric. Food Chem. 54:1928-
1935.

173
Rowayshed, G., A. Salama, M. Abul-Fadl, S. Akila-Hamza and E.A. Mohamed. 2013.
Nutritional and chemical evaluation for pomegranate (Punica granatum L.) fruit peel
and seeds powders by products. Middle East J. Appl. Sci. 3(4):169-179.
Rusak, G., D. Komes, S. Likic, D. Horzic and M. Kovac. 2008. Phenolic content and
antioxidative capacity of green and white tea extracts depending on extraction
conditions and solvent used. Food Chem. 110:852-858.
Saad, E.A., M.M. Hassanien, M.A. El-Hagrasy and K.H. Radwan. 2015. Antidiabetic,
hypolipidemic and antioxidant activities and protective effects of punica granatum
peels powder against pancreatic and hepatic tissues injuries in streptozotocin induced
iddm in rats. Int. J. Pharm. Pharm. Sci. 7(7):397-402.
Sadeghipour, A., M. Eidi, A. Ilchizadeh Kavgani, R. Ghahramani, S. Shahabzadeh and A.
Anissian. 2014. Lipid lowering effect of Punica granatum L. peel in high lipid diet
fed male rats. Evid. Based Complement. Alternat. Med. 2014:1-5.
Sae-tan, S., K.A. Grove and J.D. Lambert. 2011. Weight control and prevention of metabolic
syndrome by green tea. Pharmacol. Res. 64:146-154.
Sailaja, Y.R., R. Baskar and D. Saralakumari. 2003. The antioxidant status during maturation
of reticulocytes to erythrocytes in type 2 diabetics. Free Radic. Biol. Med. 35(2):133-
139.
Salwe, K.J., D.O. Sachdev, Y. Bahurupi and M. Kumarappan. 2015. Evaluation of
antidiabetic, hypolipedimic and antioxidant activity of hydroalcoholic extract of
leaves and fruit peel of Punica granatum in male Wistar albino rats. J. Nat. Sci. Biol.
Med. 6(1):56-62.
Satomi, H., K. Umemura, A. Ueno, T. Hatano, T. Okuda and T. Noro. 1993. Carbonic
anhydrase inhibitors from the pericarps of Punica granatum L. Biol. Pharm. Bull.
16:787-790.
Seeram, N., R. Lee, M. Hardy and D. Heber. 2005. Rapid large scale purification of
ellagitannins from pomegranate husk, a by-product of the commercial juice industry.
Sep. Purif. Technol. 41:49-55.

174
Seeram, N.P., W.J. Aronson, Y. Zhang, S.M. Henning, A. Moro, R. Lee, M. Sartippour,
D.M. Harris, M. Rettig, M.A. Suchard, A.J. Pantuck, A. Belldegrun and D. Heber.
2007. Pomegranate Ellagitannin-Derived Metabolites Inhibit Prostate Cancer Growth
and Localize to the Mouse Prostate Gland. J. Agric. Food Chem. 55(19):7732-7737.
Seeram, N.P., R. Lee and D. Heber. 2004. Bioavailability of ellagic acid in human plasma
after consumption of ellagitannins from pomegranate (Punica granatum L.)
juice. Clin. Chim. Acta. 348(1):63-68.
Seeram, N.P., S.M. Henning, Y. Zhang., M. Suchard, Z. Li and D. Heber. 2006. Pomegranate
juice ellagitannin metabolites are present in human plasma and some persist in urine
for up to 48 hours. J. Nutr. 136(10):2481-2485.
Seifried, H.E., D.E. Anderson, E.I. Fisher and J.A. Milner. 2007. A review of the interaction
among dietary antioxidants and reactive oxygen species. J. Nutr. Biochem. 18:567-
579.
Şen, V., M. Bozkurt, S. Söker, A. Ece, A. Güneş, Ü. Uluca, M. Söker, S. Yel and İ. Kaplan.
2014. The Effects of Pomegranate and Carvacrol on Methotrexate-Induced Bone
Marrow Toxicity in Rats. Clin. Invest. Med. 37(2):E93-E101.
Serafini, M., A. Stanzione and S. Foddai. 2012. Functional foods: traditional use and
European legislation. Int. J. Food Sci. Nutr. 63:7-9.
Sezer, E.D., Y.D. Akcay, B. Ilanbey, H.K. Yildirim and E.Y. Sozmen. 2007. Pomegranate
wine has greater protection capacity than red wine on low-density lipoprotein
oxidation. J. Med. Food. 10(2):371-374.
Shahidi, F. 2009. Nutraceuticals and functional foods: whole versus processed foods. Trends
Food Sci. Technol. 20:376-387.
Shiban, M.S., M.M. Al-Otaibi and N.S. Al-Zoreky. 2012. Antioxidant Activity of
Pomegranate (Punica granatum L.) Fruit Peels. Food Nutr. Sci.k. 3:991-996.
Shukla, M., K. Gupta, Z. Rasheed, K.A. Khan and T.M. Haqqi. 2008a. Bioavailable
constituents/metabolites of pomegranate (Punica granatum L) preferentially inhibit
COX2 activity ex vivo and il-1beta-induced pge2 production in human chondrocytes
in vitro. J. Inflamm. 5(1):1-10.

175
Shukla, M., K. Gupta, Z. Rasheed, K.A. Khan and T.M. Haqqi. 2008b. Consumption of
hydrolyzable tannins-rich pomegranate extract suppresses inflammation and joint
damage in rheumatoid arthritis. Nutr. 24:733-743.
Shukla, S. and S. Gupta. 2004. Molecular mechanisms for apigenin-induced cell-cycle arrest
and apoptosis of hormone refractory human prostate carcinoma DU145 cells. Mol.
Carcinog. 39:114-126.
Singh, R. P., K.N.C. Murthy and G.K. Jayaprakasha. 2002. Studies on the antioxidant
activity of pomegranate peel and seed extracts using in vitro models. J. Agric. Food
Chem. 50:81−86.
Singh, S. and G. Immanuel. 2014. Extraction of Antioxidants from Fruit Peels and its
Utilization in Paneer. J Food Process Technol. 5(7):1-5.
Singleton, V.L., R. Orthofer and R.M. Lamuela-Raventos. 1999. Analysis of total phenols
and other oxidation substrates and antioxidants by means of Folin-Ciocalteu reagent.
Methods Enzymol. 299:152-178.
Soong, Y.Y. and P.J. Barlow. 2004. Antioxidant activity and phenolic content in selected
fruit seeds. Food Chem. 88:411-417.
Steel, R.G.D., J.H. Torrie and D. Dickey. 1997. Principles and procedures of statistics: a
biometrical approach, 3rd ed. McGraw Hill Book Co., Inc., New York.
Taha, O.A., A. Barakat, H.K. Abdelhakim, M.A. Shemis and Z. Zakaria. 2016.
Hypolipidemic and anti-fatty liver effects exerted by standardized Punica granatum
L. Peel extract in hepg2 cell-line and high-fat diet induced mice. Int. J. Pharm. Pharm.
Sci. 8(6):156-161.
Tapsell, L.C., I. Hemphill, L. Cobiac, C.S. Patch, D.R. Sullivan, M. Fenech, S. Roodenrys,
J.B. Keogh, P.M. Clifton, P.G. Williams, V.A. Fazio and K.E. Inge. 2006. Health
benefits of herbs and spices: the past, the present, the future. Med. J. Aust. 185(4):4-
24.
Teyssier, J.R., S. Ragot, J.C. Chauvet-Gélinier, B. Trojak and B. Bonin. 2011. Expression of
oxidative stress-response genes is not activated in the prefrontal cortex of patients
with depressive disorder. Psychiat. Res. 186:244-247.

176
Thomas, L. 1998. Alanine aminotransferase (ALT), Aspartate aminotransferase (AST).
Clinical Laboratory Diagnostics. 1st ed. Frankfurt: TH-Books Verlagsgesellschaft. pp
241-247.
Tiwari, A.K. and J.M. Rao. 2002. Diabetes mellitus and multiple therapeutic approaches of
phytochemicals: Present status and future prospects. Curr. Sci. 83:30-38.
Toklu, H.Z., M.U. Dumlu and O. Sehirlietal. 2007. Pomegranate peel extract prevents liver
fibrosis in biliary-obstructed rats. J. Pharm. Pharmacol. 59(9):1287-1295.
Tomas-Barberan, F.A., M.I. Gil, P. Cremin, A.L. Waterhouse, B. Hess-Pierce and A.A.
Kader. 2001. HPLC-DAD-ESIMS analysis of phenolic compounds in nectarines,
peaches, and plums. J. Agric. Food Chem. 49:4748-4760.
Türkben, C., E. Sarıburun, C. Demir and V. Uylaşer. 2010. Effect of freezing and frozen
storage on phenolic compounds of raspberry and blackberry cultivars. Food Anal.
Methods. 3(3):144-153.
Uchida, K., T. Satoh, Y. Ogura, N. Yamaga and K. Yamada. 2001. effect of partial ileal
bypass on cholesterol and bile acid metabolism in rats. Yanago Acta. Medica. 44:69-
77.
Van Dam, R.M., W.C. Willett, E.B. Rimm and F.B. Hu. 2002. Dietary fat and meat intake in
relation to risk of type 2 diabetes in men. Diabetes Care. 25:417-424.
Varela-Santos, E., A. Ochoa-Martinez, G. Tabilo-Munizaga, J.E. Reyes, M. Pérez-Won, V.
Briones-Labarca and J. Morales-Castro. 2012. Effect of high hydrostatic pressure
(HHP) processing on physicochemical properties, bioactive compounds and shelf-life
of pomegranate juice. Innov. Food Sci. Emerg. Technolo. 13:13-22.
Ventura, J., F. Alarcón-Aguilar, R. Roman-Ramos, E. Campos-Sepulveda, M.L. Reyes-Vega,
V.D. Boone-Villa, E.I. Jasso-Villagómez, C.N. Aguilar. 2013. Quality and
antioxidant properties of a reduced-sugar pomegranate juice jelly with an aqueous
extract of pomegranate peels. Food Chem. 136:109-115.
Viuda-Martos, M., Y. Ruiz-Navajas, A. Martin-Sánchez, E. Sánchez-Zapata, J. Fernández-
López, E. Sendra, E. Sayas-Barberá, C. Navarro and J.A. Pérez-Álvarez. 2012.

177
Chemical, physico-chemical and functional properties of pomegranate (Punica
granatum L.) bagasses powder co-product. J. Food. Eng. 110:220–224.
Viuda‐Martos, M., J. Fernández‐López and J.A. Pérez‐Álvarez. 2010. Pomegranate and its
Many Functional Components as Related to Human Health: A Review. Com. Rev.
Food Sci. Food Safety. 6:635-654.
Viuda-Martos, M., Y. Ruiz-Navajas, J. Fernández-López, E. Sendra, E. Sayas-Barberá and
J.A. Pérez-Álvarez. 2011. Antioxidant properties of pomegranate (Punica granatum
L.) bagasses obtained as co-product in the juice extraction. Food Res. Int. 44:1217–
1223.
Wauthoz, N., A. Balde, E.S. Balde, M.V. Damme and P. Duez. 2007. Ethnopharmacology of
Mangifera indica L bark and pharmacological studies of its main glucosylxanthone,
mangiferin. Int. J. Biomed. Pharma. Sci. 1(2):112-119.
White, C.C., H. Viernes, C.M. Krejsa, D. Botta and T.J. Kavanagh. 2003. Fluorescence-
based microtiter plate assay for glutamate-cysteine ligase activity. Anal. Biochem.
318(2): 175-180.
Wildman, R.E.C. (2001). Classifying nutraceuticals. In Handbook of nutraceuticals and
functional foods (Edn. Wolinsky, Hickson and J.F. Jr., I). CRC press LLC.
Wolf, B.W. and S.E. Weisbrode. 2003. Safety evaluation of an extract from Salacia oblonga.
Food Chem. Toxicol. 41:867-874.
Wong, S.P., L.P. Leong and J.H. William-Koh. 2006. Antioxidant activities of aqueous
extracts of selected plants. Food Chem. 99:775-783.
Wright, J.S. E.R. Johnson and G.A. DiLabio. 2001. Predicting the activity of phenolic
antioxidants: theoretical methods, analysis of substituents effects and application to
major families of antioxidants. J. Am. Chem. Soc. 123:1173-1183.
Wu, L.L., C.C. Chiou, P.Y. Chang and J.T. Wu. 2004. Urinary 8-OHdG. A marker of
oxidative stress to DNA and a risk factor for cancer, atherosclerosis and diabetes.
Clin. Chim. Acta. 339:1-9.
178
Xiao, W., L. Han and B. Shi. 2008. Microwave-assisted extraction of flavonoids from Radix
astragali. Sep. Purif. Technol. 62:614-618.
Yang, B., Y.M. Jiang, J. Shi, F. Chen and M. Ashraf. 2011. Extraction and pharmacological
properties of bioactive compounds from longan (Dimocarpus longan L.) fruit-a-
review. Food Res. Int. 44:1837-1842.
Yang, J., L. Zhong, B. Zou, Y. Tian, S.F. Xu and P. Yao. 2012. Spectroscopic investigations
on the binding of persimmon tannin to phospholipase A2 from Chinese cobra (Naja
naja atra). J. Mol. Str. 1008:42-48.
Yen, G.C. and H.Y. Chen. 1995. Antioxidant activity of various tea extracts in relation to
their antimutagenicity. J. Agric. Food Chem. 43(1):27-32.
Yi, W., J.C. Fischer and C.C. Akoh. 2005. Study of anticancer activities of muscadine grape
phenolics in vitro. J. Agric. Food Chem. 53:8804-8812.
Zahin, M., I. Ahmad, R.C. Gupta and F. Aqil. 2014. Punicalagin and Ellagic Acid
Demonstrate Antimutagenic Activity and Inhibition of Benzo[a]pyrene Induced DNA
Adducts. BioMed Res. Int. 2014:1-10.
Zamorano, M., J.I. Pérez, I.A. Pavéz and A.R. Ridao. 2007. Study of the energy potential of
the biogas produced by an urban waste landfill in Southern Spain. Renew. Sustainable
Energy Rev. 11:909-922.
Zhao, T., Z.N. Zhang, Z. Rong and Y. Xu. 2011. Immunogenicity of induced pluripotent
stem cells. Nature. 474(7350):212-215.

179
APPENDICES
Appendix I
Performa for sensory evaluation of value added drinks
Name of the judge ……………. Date …………………
Character D0 D1 D2
Color
Flavor
Sweetness
Sourness
Acceptability
Signature ……………
INSTRUCTION
Take a sample of value added drink and score for color, flavor, sweetness, sourness and
acceptability using the following 9-point Hedonic Scale.
Extremely poor 1
Very poor 2
Poor 3
Below fair above poor 4
Fair 5
Below good above fair 6
Good 7
Very good 8
Excellent 9
Note:
1. Take a sample of value added drinks and score for color, flavor etc.
2. Before proceeding to the next sample, rinse mouth with water.
3. Make inter comparison of the sample and record the score.
4. Don’t disturb the order of samples.

180
Appendix I-A
Composition of value added drinks (1 L)
Ingredients (%) D0 D1 D2
Pomegranate peel
extract (PPE)
- 3 g -
Pomegranate
bagasse extract
(PBE)
- - 3 g
Water 1 L 1 L 1 L
Carboxymethyl
cellulose (CMC)
1.5 g 1.5 g 1.5 g
Aspartame 6.5 g 6.5 g 6.5 g
Sodium benzoate 0.5 g 0.5 g 0.5 g
Color 0.5 g 0.5 g 0.5 g
Flavor 1 mL 1 mL 1 mL
Citric acid 5 g 5 g 5 g

181
Appendix II
Composition of experimental diets
Ingredients (%) Normal rats Hypercholesterolemic
rats
Diabetic rats
Corn oil 10 10 10
Corn starch 66 64.5 66
Casein 10 10 10
Cellulose 10 10 10
Salt mixture 3 3 3
Vitamins 1 1 1
Cholesterol - 1.5 -
Sucrose - - -
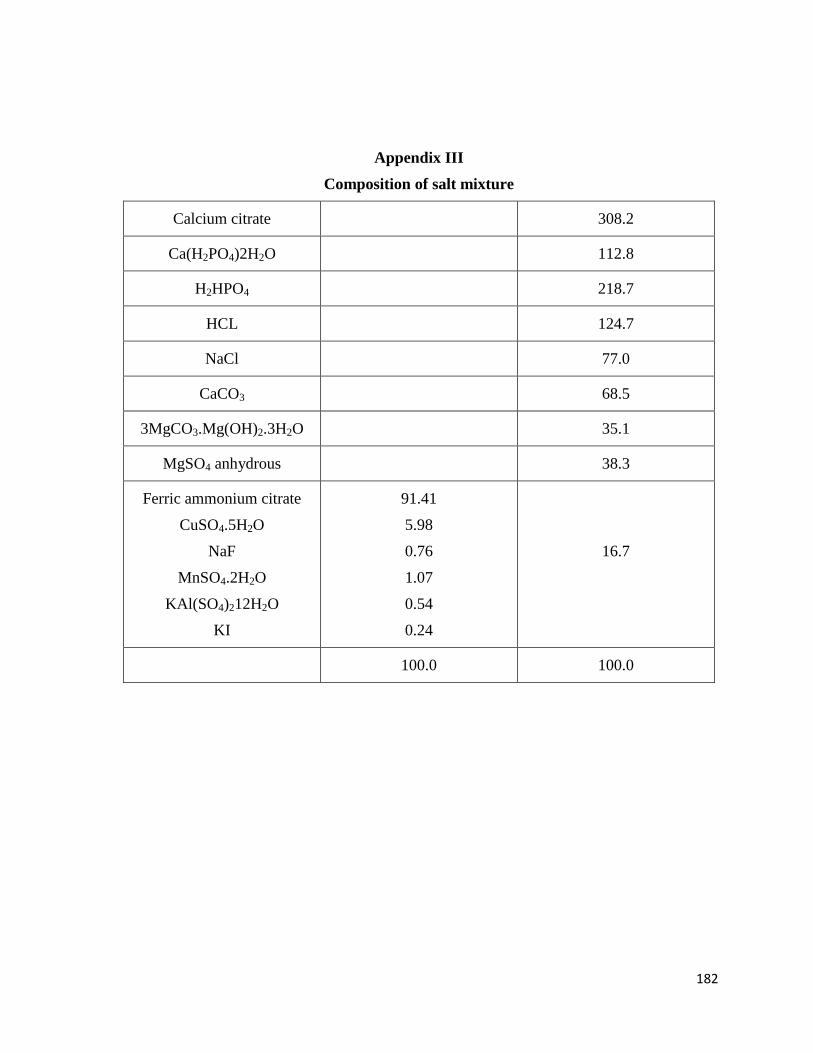
182
Appendix III
Composition of salt mixture
Calcium citrate 308.2
Ca(H2PO4)2H2O 112.8
H2HPO4 218.7
HCL 124.7
NaCl 77.0
CaCO3 68.5
3MgCO3.Mg(OH)2.3H2O 35.1
MgSO4 anhydrous 38.3
Ferric ammonium citrate
CuSO4.5H2O
NaF
MnSO4.2H2O
KAl(SO4)212H2O
KI
91.41
5.98
0.76
1.07
0.54
0.24
16.7
100.0 100.0

183
Appendix IV
Composition of vitamin mixture
Thiamine hydrochloride 0.060
Riboflavin 0.200
Pyriodoxin hydrochloride 0.040
Calcium pentothenate 1.200
Nicotinic acid 4.000
Inositol 4.000
p-aminobenzoic acid 12.000
Biotin 0.040
Folic acid 0.040
Cyanocobalamin 0.001
Choline chloride 12.000
Maize starch 966.419
1000.00