Utilization of health services in a resource-limited rural ...
14
eCommons@AKU Faculty of Health Sciences, East Africa Faculty of Health Sciences, East Africa February 2017 Utilization of health services in a resource-limited rural area in Kenya: Prevalence and associated household-level factors Anthony Ngugi Aga Khan University, [email protected] Felix Agoi Aga Khan University, [email protected] Megan R. Mahoney Stanford University Amyn Lakhani Aga Khan University, [email protected] David Mang’ong’o Kaloleni Sub-County, Kilifi County See next page for additional authors Follow this and additional works at: hp://ecommons.aku.edu/eastafrica_s_s Part of the Other Medicine and Health Sciences Commons Recommended Citation Ngugi, A., Agoi, F., Mahoney, M. R., Lakhani, A., Mang’ong’o, D., Nderitu, E., Armstrong, R., Macfarlane, S. (2017). Utilization of health services in a resource-limited rural area in Kenya: Prevalence and associated household-level factors. PLoS One, 12(2). Available at: hp://ecommons.aku.edu/eastafrica_s_s/11
Transcript of Utilization of health services in a resource-limited rural ...
eCommons@AKU
Faculty of Health Sciences, East Africa Faculty of Health Sciences, East Africa
February 2017
Utilization of health services in a resource-limitedrural area in Kenya: Prevalence and associatedhousehold-level factorsAnthony NgugiAga Khan University, [email protected]
Felix AgoiAga Khan University, [email protected]
Megan R. MahoneyStanford University
Amyn LakhaniAga Khan University, [email protected]
David Mang’ong’oKaloleni Sub-County, Kilifi County
See next page for additional authors
Follow this and additional works at: http://ecommons.aku.edu/eastafrica_fhs_fhs
Part of the Other Medicine and Health Sciences Commons
Recommended CitationNgugi, A., Agoi, F., Mahoney, M. R., Lakhani, A., Mang’ong’o, D., Nderitu, E., Armstrong, R., Macfarlane, S. (2017). Utilization ofhealth services in a resource-limited rural area in Kenya: Prevalence and associated household-level factors. PLoS One, 12(2).Available at: http://ecommons.aku.edu/eastafrica_fhs_fhs/11

AuthorsAnthony Ngugi, Felix Agoi, Megan R. Mahoney, Amyn Lakhani, David Mang’ong’o, Esther Nderitu, RobertArmstrong, and Sarah Macfarlane
This article is available at eCommons@AKU: http://ecommons.aku.edu/eastafrica_fhs_fhs/11
RESEARCH ARTICLE
Utilization of health services in a resource-
limited rural area in Kenya: Prevalence and
associated household-level factors
Anthony K. Ngugi1*, Felix Agoi1,2, Megan R. Mahoney3,4, Amyn Lakhani1,2,
David Mang’ong’o5, Esther Nderitu6, Robert Armstrong7, Sarah Macfarlane1,8
1 Centre for Population Health Sciences, Faculty of Health Sciences—East Africa, Aga Khan University,
Nairobi, Kenya, 2 Department of Community Health, Faculty of Health Sciences—East Africa, Aga Khan
University, Mombasa, Kenya, 3 Department of Medicine, Stanford University, Stanford, California, United
States of America, 4 Department of Family Medicine, Faculty of Health Sciences—East Africa, Aga Khan
University, Nairobi, Kenya, 5 Sub-County Health Management, Kaloleni Sub-County, Mariakani, Kilifi County,
Kenya, 6 School of Nursing and Mid-wifery, Aga Khan University–East Africa, Nairobi, Kenya, 7 Medical
College, Faculty of Health Sciences—East Africa, Aga Khan University, Nairobi, Kenya, 8 Global Health
Sciences, University of California San Francisco, San Francisco, California, United States of America
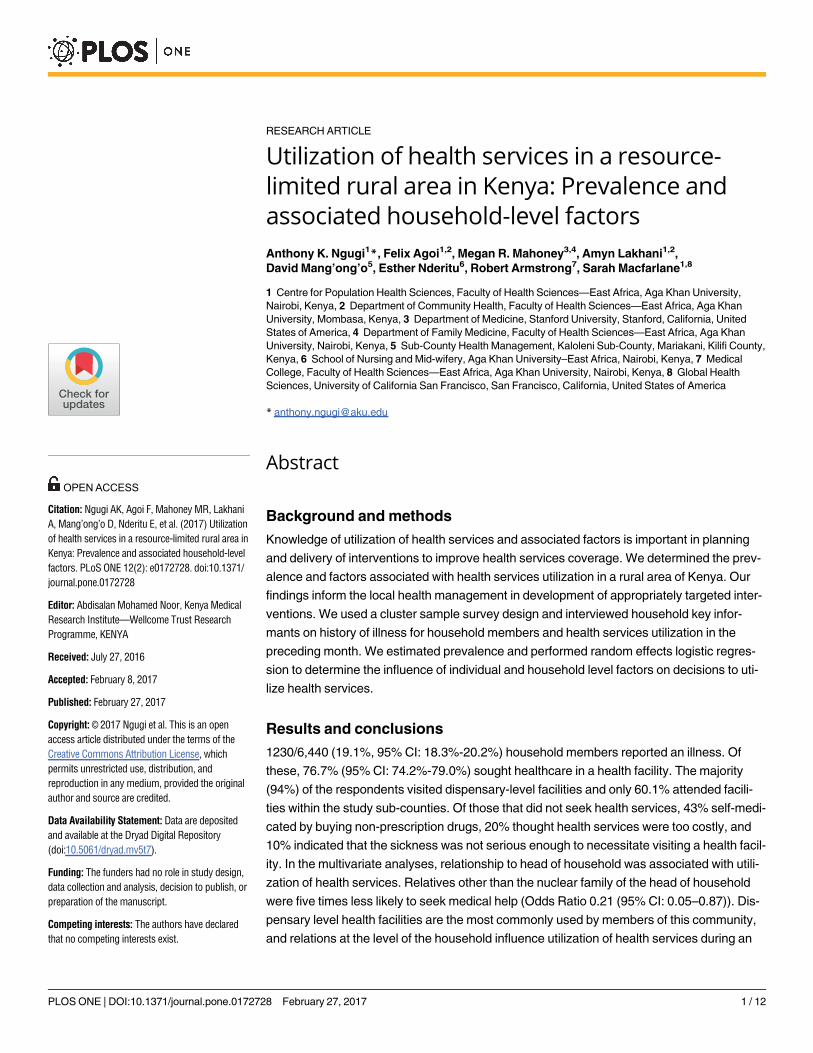
Abstract
Background and methods
Knowledge of utilization of health services and associated factors is important in planning
and delivery of interventions to improve health services coverage. We determined the prev-
alence and factors associated with health services utilization in a rural area of Kenya. Our
findings inform the local health management in development of appropriately targeted inter-
ventions. We used a cluster sample survey design and interviewed household key infor-
mants on history of illness for household members and health services utilization in the
preceding month. We estimated prevalence and performed random effects logistic regres-
sion to determine the influence of individual and household level factors on decisions to uti-
lize health services.
Results and conclusions
1230/6,440 (19.1%, 95% CI: 18.3%-20.2%) household members reported an illness. Of
these, 76.7% (95% CI: 74.2%-79.0%) sought healthcare in a health facility. The majority
(94%) of the respondents visited dispensary-level facilities and only 60.1% attended facili-
ties within the study sub-counties. Of those that did not seek health services, 43% self-medi-
cated by buying non-prescription drugs, 20% thought health services were too costly, and
10% indicated that the sickness was not serious enough to necessitate visiting a health facil-
ity. In the multivariate analyses, relationship to head of household was associated with utili-
zation of health services. Relatives other than the nuclear family of the head of household
were five times less likely to seek medical help (Odds Ratio 0.21 (95% CI: 0.05–0.87)). Dis-
pensary level health facilities are the most commonly used by members of this community,
and relations at the level of the household influence utilization of health services during an
PLOS ONE | DOI:10.1371/journal.pone.0172728 February 27, 2017 1 / 12
a1111111111
a1111111111
a1111111111
a1111111111
a1111111111
OPENACCESS
Citation: Ngugi AK, Agoi F, Mahoney MR, Lakhani
A, Mang’ong’o D, Nderitu E, et al. (2017) Utilization
of health services in a resource-limited rural area in
Kenya: Prevalence and associated household-level
factors. PLoS ONE 12(2): e0172728. doi:10.1371/
journal.pone.0172728
Editor: Abdisalan Mohamed Noor, Kenya Medical
Research Institute—Wellcome Trust Research
Programme, KENYA
Received: July 27, 2016
Accepted: February 8, 2017
Published: February 27, 2017
Copyright: © 2017 Ngugi et al. This is an open
access article distributed under the terms of the
Creative Commons Attribution License, which
permits unrestricted use, distribution, and
reproduction in any medium, provided the original
author and source are credited.
Data Availability Statement: Data are deposited
and available at the Dryad Digital Repository
(doi:10.5061/dryad.mv5t7).
Funding: The funders had no role in study design,
data collection and analysis, decision to publish, or
preparation of the manuscript.
Competing interests: The authors have declared
that no competing interests exist.

illness. These data enrich the perspective of the local health management to better plan the
allocation of healthcare resources according to need and demand. The findings will also
contribute in the development of community-level health coverage interventions that target
the disadvantaged household groups.
Introduction
Access to and utilization of health services are key to improvement of health outcomes in low
and middle income countries (LMICs). In these countries, knowledge of access to and utiliza-
tion of health services is important in planning for health resource allocation to different levels
of the health system and monitoring the achievement of universal health coverage (UHC),
which the World Health Organization (WHO) advocates as a means to ensuring equity in the
use of health services [1,2]. Furthermore, knowledge of barriers to health service utilization
among poor and marginalized populations is essential in informing the design of interventions
aimed at increasing coverage of services [1].
Although the Kenyan Constitution enacted in 2010 declared health to be a universal right
[2], progress towards UHC in Kenya has been limited [3,4]. There is also inadequate popula-
tion-level information on utilization of health services. A recent healthcare benefit incidence
study in Kenya showed inequitable distribution of services according to ability to pay rather
than need for care [5].
In the context of recent devolution of health and development functions from central to
county governments [6], information on access and utilization of services is critical to county
health systems managers particularly in rural and marginalized areas with poorer population
health indicators. In lieu of competition for scarce resources between health and other devel-
opment functions at the local level, it is crucial to identify and describe key determinants of
health e.g. access and utilization of services and factors that influence these determinants
amongst the poorest and most vulnerable segments of the population. Knowledge of such
determinants and associated factors is key in designing and delivery of finely targeted inter-
ventions that save on scarce local resources and promise accelerated improvement of health
outcomes.
As part of a partnership with the local sub-county health management to strengthen pri-
mary healthcare, we determined the prevalence of health services utilization by residents
reporting a health complaint in the month preceding the survey and its associated factors in
one of the poorest rural populations in Kenya.
Methods
We undertook a cross-sectional survey using the WHO cluster-sample design [7] because we
did not have an adequate sampling frame or up-to-date vital statistics for the study area.
Study area and population
We conducted this study in Kaloleni and Rabai sub-counties (formerly Kaloleni district) in the
coastal area of Kenya. The two sub-counties cover an area of 909 km2 and have a population of
about 290,000 living in about 44,000 households [8]. There are few indicator data for this area,
and thus the figures usually presented are for the larger Kilifi county in which the two sub-
counties are located. Kaloleni/Rabai sub-counties are among the poorest regions of Kenya [9].
Health services utilization in rural Kenya
PLOS ONE | DOI:10.1371/journal.pone.0172728 February 27, 2017 2 / 12
This is an area of the Aga Khan University (East Africa) population-level programming and
was selected in consultation with the County government due to lack of population-level
health research and suspected poor population health indicators relative to the rest of Kilifi
county. According to the 2009 Kenya National Population and Housing Census, children
under five years of age comprise 20% of the Kilifi population and women of reproductive age
comprise another 25%. Fifty seven percent of the population are Christian, 19% are Muslim
and the remainder are traditionalists [8]. Approximately 70% of the population lives below the
poverty line and 81% rely on subsistence agriculture, crafts and petty trading for their liveli-
hoods. Maternal, neonatal and child health indicators are poorer than the national averages
[10].
The study area has three administrative divisions (Rabai, Mariakani, and Kaloleni) which
are sub-divided into a total of 12 locations and 34 sub-locations. Forty health facilities serve
these sub-counties: 20 public/government health facilities (16 dispensaries, one health centre,
one sub-district hospital, one district hospital, one military health centre), three faith-based
facilities (one hospital and two dispensaries), three NGO dispensaries, and 14 privately owned
dispensaries [11]. The doctor to population ratio (1 to 36,000) in this area is below the national
average of 1 to 5,000 [12] and a nurse to population ratio of 1:1830.
Sample size, sampling of households and data collection
We estimated that we required 30 clusters (specific villages) of 27 households each to meet the
objectives of this survey. This sample size would be adequate to describe the demographic
characteristics, illness episodes and utilization of health services of individuals in about 800
households. We picked the largest sample size possible, based on the assumption that each of
the characteristics would have a 50% distribution in the study population and used a precision
of 2.5% and a design effect of 2 to adjust for cluster sampling.
Using probabilities proportionate to the number of households in the sub-locations, we
selected 23 of the 34 sub-locations from which we selected the thirty clusters. With the aid
of local administration (chiefs or assistant chiefs), we listed all the villages in each of the
selected sub-locations and then randomly selected the number of villages required in each.
We enlisted the support of the local village elders to identify village boundaries and to select
convenient starting points in each village (e.g. the village elder’s house, a community health
worker’s house etc) and then sequentially selected 27 households to comprise the cluster.
We piloted the study tool in a sub-location outside the selected study area (neighbouring
Kwale County).
The enumerators administered the study questionnaire to consenting participants (the
most senior male or female resident in the household) after obtaining written-informed con-
sent from them. In the event the appropriate respondent was unavailable, they made an
appointment to return at the earliest time convenient and followed-up for three consecutive
times before replacement.
Besides obtaining the socio-demographic information, we collected data on history of sick-
ness or health complaints for each member of the household in the preceding month, whether
they sought healthcare services for the complaint, signs/symptoms of the condition, name of
health facility visited, who refered them to the facility e.g. community health worker (CHW),
self-referral or village elder among others, and reasons they did not seek services if they did
not attend. We list the questions asked on history of illness and utilization of health services in
S1 Appendix. Respondents reported a range of signs and symptoms of the index illness epi-
sode. Based on these, a family medicine physician (MRM) classified sick respondents into
broad illness categories.
Health services utilization in rural Kenya
PLOS ONE | DOI:10.1371/journal.pone.0172728 February 27, 2017 3 / 12
Data management and analysis
Trained data entry clerks double entered and verified all data in Epi Info v7 [13]. We described
the distribution of study subjects characteristics and compared the demographic parameters of
those that were ill in the previous month and those who were not, and those who sought health
services and those who did not among those that fell ill. We generated household socio-eco-
nomic status (SES) quintiles based on reported ownership of a range of 15 household items
and properties using principal component analyses (PCA) [14]. Bivariate associations between
utilization of health facilities and potential predictors were examined by Pearson correlation.
Covariates included: (i) relationship to the household head, (ii) age in years (grouped), (iii)
sex, (iv) schooling (mother’s schooling for those< 18 years old), and (v) occupation of the
household head, (vi) religion of household head, and (vii) the SES quintile for the household.
Multivariate analysis was conducted using a multilevel logistic mixed effect model with
maximum likelihood (ML) estimation to determine the household-level factors associated
with utilization of health services if a household member experienced an illness episode in the
preceding month. We investigated the association between the utilization of health services
and covariates (any factor with p<0.25 in the bivariate analyses). We used a four step model
building procedure. As first step an unconditional model was tested with household and village
as a random intercept to examine the variation in outcomes at these levels. An ICC was esti-
mated to find the contribution of these levels on total variation. The household contributed
34% of the total variance in the outcome (S1 Table) and was therefore included as random
effect in subsequent modelling while the village contributed 2.9% of the total variation and was
thus excluded from further analyses. In the next step, relationship with head of household was
added as a fixed effect and random slope, and likelihood ratio (LR) test was used to confirm
whether the variance of the slope was significantly different from zero. Finally variables signifi-
cant at p<0.25 in bivariate analysis were incorporated into model and retained if p<0.05. In
the final model, we made adjustment for the interaction of age and relationship to the head
household since these variables were correlated (p<0.001) in the bivariate analysis. All data
cleaning and analyses were done in Stata v13 [15].
Ethical approval
We obtained approval for the study from the Aga Khan University-East Africa Health Ethics
Review Committee and the University of California San Francisco Committee on Human
Research. All participants provided written informed consent. Since data were collected at the
level of the household and only heads of household were interviewed, consent was obtained
from household heads on behalf of all members whose information was sought. This approach
was approved by both IRBs.
Results
The enumerators collected data on 6,440 individuals from 829 respondents each representing
a household between 14th July and 29th August 2014. Eighty five percent of the respondents
were either the head of the household (20.2%) or their spouse (64.5%). Of the rest, 5.5% were
the grown-up son/daughter of the household head and 5.4% were either his son or daughter-
in-law. The median (IQR) age of the respondents was 47 (36–59) and 71.5% were male and
28.5% female.
A total of 624 (75.3%) of the households reported a sick member in the preceding month,
with a median (IQR) of 1 (1–2) members per household. 1,230 (19.1%, 95% CI: 18.3–20.2) of
the 6,440 household members had had a health complaint. Demographically, older residents
(50+ years of age) and the heads of the household experienced higher frequencies of ill health
Health services utilization in rural Kenya
PLOS ONE | DOI:10.1371/journal.pone.0172728 February 27, 2017 4 / 12

compared to the rest of the population (Table 1). The distribution of study factors across the
two categories of health service utilization among ill household members is shown in Table 1.
Table 1. Distribution of sickness and utilization of health facilities by demographic characteristics.
Sickness in the previous month Utilization of HF visited when sick
Characteristic Fell ill
n(row %)
Total No
n(row %)
Total
1) Relation to hhh1
Self 571 (69.2) 825 108 (19.0) 568
Spouse 261 (40.9) 638 61 (23.5) 260
Child 246 (8.7) 2,822 73 (30.2) 242
Others 145 (6.8) 2,121 41 (28.9) 142
Total 1,223 (19.1) 6,406 283 (23.4) 1,212
3) Age (years)
0–14 168 (5.3) 3,148 53 (32.3) 164
15–25 170 (13.0) 1,303 52 (31.0) 168
26–49 495 (40.5) 1,221 103 (20.9) 492
50+ 343 (52.4) 655 64 (18.7) 342
Total 1,176 (18.6) 6,327 272 (23.3) 1,166
4) Sex
Male 600 (19.8) 3,024 131 (21.9) 597
Female 624 (19.8) 3,416 152 (24.7) 616
Total 1,224 (21.7) 6,440 283 (23.3) 1,213
5) Religion of hhh
Catholic 92 (19.1) 482 18 (19.6) 92
Protestant 390 (21.0) 1,855 83 (21.6) 385
Islam 483 (19.5) 2471 127 (26.7) 476
Traditional 83 (17.6) 471 22 (26.5) 83
None 148 (18.3) 807 22 (26.5) 142
Other 8 (20.0) 40 4 (50.0) 8
Total 1,204 (19.6) 6,126 281 (23.6) 1,191
6) Occupation of hhh
Bluecollar/technical 147 (21.7) 677 35 (24.0) 146
Agriculture/crafts 648 (18.6) 3,477 147 (22.9) 641
None 63 (18.4) 343 14 (22.2) 63
Others 342 (21.2) 1613 85 (25.2) 337
Total 1,200 (19.6) 6,110 281 (23.7) 1,187
7) SES quintile
1 251 (20.5) 1,222 63 (25.4) 248
2 261 (18.7) 1,397 64 (24.6) 260
3 246 (19.4) 1,266 46 (18.7) 246
4 329 (20.3) 1,623 88 (27.3) 322
5 105 (19.2) 547 18 (17.14) 105
Total 1,192 (19.7) 6,055 279 (23.6) 1,181
8) Schooling
Yes 185 (22.1) 836
No 82 (24.6) 334
Total 267 (22.8) 1,170
1 Head of the household.
doi:10.1371/journal.pone.0172728.t001
Health services utilization in rural Kenya
PLOS ONE | DOI:10.1371/journal.pone.0172728 February 27, 2017 5 / 12

Results of the bivariate correlation analyses showed significant correlation between age, rela-
tionship with head of household and utilization of health services during an illness (S2 Table).
The most commonly reported illnesses/health conditions experienced by residents in the
month preceding the survey included infectious (specific conditions e.g. malaria and those
others associated with fever), respiratory (conditions associated with a cough, chest pain or
flu), neurologic (conditions associated with a headache) and gastrointestinal (associated with
stomach pain, diarrhoea or vomiting) (Table 2). 76.7% (95% CI: 74.2–79.0) of the 1,213 house-
hold members who respondents reported as having had a health complaint sought healthcare
and of these, 76.4% self-referred or were taken to the health facility, mainly by parents or other
relatives while the rest were referred by e.g. CHW, other health workers, teacher, local govern-
ment administrator etc. Of the 23.3% that did not seek health services during their illness,
42.8% self-medicated by buying non-prescription drugs from either shops or pharmacies.
Another 20% did not seek health care from facilities as it was too costly or they did not have
money at the time. For 9.9% the sickness was not serious enough to necessitate visiting a health
facility and for 8.1% the nearest health facility was too far or they did not have transport
(Table 3).
The majority (96.9%) of respondents indicated that the nearest health facility was within the
study area. The 913 residents who sought health care utilized services from 94 health facilities.
However, among the 1,213 who fell sick, only 60.1% attended facilities that were within the
study sub-counties and only 51.1% attended the identified health facility nearest to their home.
Nine out of ten of the most frequently utilized health facilities were located in the study area
and were patronized by 53.0% of the respondents that sought health services, with an equal dis-
tribution between rural and urban locations. Eight out of ten facilities were public/government
facilities and were mainly (8/10) in tier 2 (dispensary-level) of the health system. These most
frequently utilized facilities were located in major towns of the study area (high population
Table 2. Health conditions experienced by residents in the month preceding the survey.
Disease conditions Freq. Percent
Infectious Disease 413 28.4
Respiratory 318 21.9
Neurologic 200 13.8
Gastrointestinal 195 13.4
Musculoskeletal 106 7.3
Dermatologic 65 3.0
Renal Problem 55 2.3
Cardiologic/Respiratory 34 1.5
Eye Problem 22 1.0
Cardiologic 14 3.0
Blood disorder 9 0.6
Dental 8 0.6
Ear Problem 6 0.4
Other 4 0.3
Reproductive Health 3 0.2
Drug Side effect 1 0.1
Psychiatric 1 0.1
Total 1,454* 100
*Some respondents were grouped into more than one category.
doi:10.1371/journal.pone.0172728.t002
Health services utilization in rural Kenya
PLOS ONE | DOI:10.1371/journal.pone.0172728 February 27, 2017 6 / 12

density) or were the only health facilities available within a wide radius in rural areas (Table 4).
A large proportion (68.3%) of those who sought health services attended public health facili-
ties, 30.9% visited privately owned facilities (including faith-based and private not-for-profit)
while 4.3% (n = 5) of the facilities mentioned could not be found in the facilities master list
[11], possibly because the respondents used unknown facility names. Overall, a majority
(93.7%) of the sick respondents visited tier 2 (dispensary) health facilities.
We found that 34% of the total variation in the probability to utilize healthcare during an
illness was attributable to random effects (unmeasured or unmeasurable confounders) operat-
ing at the level of the household or higher (S1 Table). In the multivariate analyses, relationship
to head of household was the only factor associated with utilization of health services in the
(p = 0.03) after adjusting for the interaction between age and relation to the household head.
Relatives other than the immediate family of the head of household (including son/daughter
in-law, grand child, parent/parent in-law, brother/sister, adopted child and other relatives)
were 4.9 times less likely to seek medical help from a health facility when they fell ill (Table 5).
Discussion
We have estimated a prevalence of health services utilization that was similar to the 77.8%
reported previously for Kenya [16]. We found that most of the respondents who fell ill but did
not seek health services either self-medicated, felt that services were too costly (or did not have
money to pay), or felt that the illness was not serious or that the facility was too far. Residents
visited a surprisingly large number of health facilities outside of the study area although in
terms of absolute number of patients, facilities within the study sub-counties accounted for
majority of the visits. Tier 2 (Dispensary) facilities were the most commonly used. In the multi-
variate analyses, relatives who were not in the nuclear family of the head of the household were
at significant disadvantage with regard to utilizing health services when they were ill. These
included son/daughter in law, grandchild, parent/parent-in-law, brother/sister and adopted
child among other relatives.
Table 3. Reasons given for failure to utilize health services.
Main reason given Freq. Percent
Cost related Too costly/no finances 48 17.0
Too far/no transport 23 8.1
Non-cost related Facility not open/no staff 12 4.2
Don’t trust facility/poor services 5 1.8
Not necessary/serious 19 6.7
Not customary 2 0.7
Visited traditional healer 5 1.8
Other reasons*:
Cost related Too costly(2*) 14 4.9
Self-medication 125 44.2
Non-cost related Fear of drugs/injections 2 0.7
Facility not open/no staff (2*) 2 0.7
Not necessary/serious (2*) 9 3.2
Patient too old 2 0.7
No response 15 5.3
Total 283 100.0
*Mentioned in the category “other” (where this was not the primary reason given).
doi:10.1371/journal.pone.0172728.t003
Health services utilization in rural Kenya
PLOS ONE | DOI:10.1371/journal.pone.0172728 February 27, 2017 7 / 12

Conditions with an infectious aetiology (fevers, respiratory conditions, diarrhoea and der-
matological conditions) were the most common causes of ill health in this population,
accounting for 65% of health complaints in the previous month. This concurs with findings of
a hospital-based study done in the same area in which community-acquired bacteremia was
an important cause of paediatric morbidity and mortality [17]. Poverty-related determinants
of infectious diseases such as malnutrition and under-nutrition [18], lack of access to safe
Table 4. The top 10 most utilized health facilities in Kaloleni sub-county.
Health Facility Freq. (%) Type Level In study area? Rural/Urban Comment
Mariakani Hospital 101 (11.1) Public 4 Yes Urban The main District hospital located in Mariakani town
Shangia dispensary 68 (7.4) Public 2 Yes Urban Lower level facility in the main town of Mariakani
Kinarani dispensary 46 (5.0) Public 2 Yes Rural Only dispensary in a 15km radius
Shika adabu dispensary 41 (4.5) Public 2 No Urban In Mombasa (where most labour migrants reside)
Vishakani dispensary 41 (4.5) Public 2 Yes Rural In the urban Kaloleni area
Gotani dispensary 40 (4.4) Public 2 Yes Rural A model health centre (with 2 Clinical officers)
Kamkomani dispensary 40 (4.4) Public 2 Yes Rural In the urban Mariakani area
Khadija clinic 38 (4.2) Private 2 Yes Urban In Mazeras township
St. Luke’s hospital 36 (3.9) Religious 4 Yes Urban Large level 4 hospital in the urban Kaloleni area
Kombeni dispensary 33 (3.9) Public 2 Yes Rural The only public facility in a large area
Total 484
Total as % of all sick 53.0
doi:10.1371/journal.pone.0172728.t004
Table 5. Regression analyses factors associated with utilizing health facilities during illness.
Factor Odds Ratio (95% CI) P-value
1) Relation to hhh1
Self 1.00
Spouse 1.47 (0.54–4.00) 0.45
Child na† na
Other relatives 0.21 (0.05–0.87) 0.03
2) Age group (years)
50+ 1.00
0–14 0.94 (0.04–23.4) 0.97
15–25 0.38 (0.08–1.84) 0.23
26–49 1.05 (0.55–1.98) 0.89
3) Relation to hhh*age group
Spouse*0–14 0.13 (0.001–16.41 0.41
Spouse*15–25 0.65 (0.09–4.89) 0.68
Spouse*26–49 0.48 (0.14–1.60) 0.23
Child*0–14 na† na
Child*15–25 na† na
Child*26–49 na† na
Others*0–14 1.49 (0.04–57.78 0.83
Others*15–25 4.37 (0.43–44.14) 0.21
Others*26–49 2.01 (0.34–11.92) 0.44
1 Head of the household† model did not converge as none (0) of those who failed to visit health facility when sick were ’child’ of the
hhh in the ’50+’ year age category.
doi:10.1371/journal.pone.0172728.t005
Health services utilization in rural Kenya
PLOS ONE | DOI:10.1371/journal.pone.0172728 February 27, 2017 8 / 12

drinking water and sanitation and inadequate availability of water for hygiene are pervasive in
this poor rural community. Addressing these determinants will require a multisectoral
approach between the county government, development partners and other stakeholders.
It was surprising that socio-economic status was not associated with utilization of health
services as has been found elsewhere [19,20]. In our study, this was likely because our popula-
tion was more or less homogeniously poorer than the rest of the country [9] and as such the
socio-economic status determined using PCA may not clearly distinguish wealth groups in
this population [14]. Indeed, a closer look at the data shows that our PCA generated SES scores
that were skewed to the right (to the lower income gropus), ranging between -7.84 to 1.46
compared to a much more normally distributed range of -2.10 to 2.62 in the 2008–9 Kenya
Demographic and Health Survey data [10]. Thus, it is possible that poverty related reasons
were still partially responsible for non-utilization of health services.
The main reason for failure to utilize health services i.e. self medication is likely to be related
to avoidance to pay user fees charged at the health facilities as well as costs associated with
travel [21], since these respondents do not fall in the category that felt that the illness was not
serious to warrant visiting a facility. The user fees charged, though minimal, could be signifi-
cant for this impoverished population [22]. Taken together with those that actually indicated
that seeking care was costly and transport to health facilities as the main reasons for not seek-
ing healthcare, the costs associated with seeking care could account for appoximately 75% of
the reasons for failure to do so. This is a rather high proportion, and an indication that distri-
bution of health services (and benefits) even in the public sector could still be based on the
ability to pay rather than the need for services, as was observed in a natiowide study [5].
Although the majority of those seeking healthcare utilized health services from health facili-
ties within the study sub-counties, a significant proportion of health facilities patronized were
from outside the study area or those not identified as the closest to the homestead. This being a
largely poor rural area, it is unclear why residents would opt to seek health services far from
home, including in facilities located in Mombasa city more than 60 kilometers away. In a sepa-
rate survey carried out in this population, we established that the number of males above 20
years of age was disproportionately lower than females, implying male labour out-migration in
this population. It is likely that households with such a family member (financially capable/
working) would seek services in urban locations far from home, where the working family
member resided. Alternatively, it was possible that households members could travel to seek
services in more urban areas in the belief that urban health facilities offered better services and
were better resourced than those in rural areas [5,23,24].
We observed that majority of the respondents visited dispensaries when they fell ill. This
finding is in concurrence with studies from other LMICs which show that the majority of the
poor tend to utilize primary healthcare (PHC) services [5,25], though healthcare resources are
concentrated in higher levels (tier 4/district hospital) of the health system which more often
serve higher income groups. Kenya spends 50% of her healthcare budget in tier 4 facilities,
benefiting the upper two quintiles of the population [26]. In sub-counties of Kaloleni, the
majority of the higher level facilities are located in urban areas while the largest proportion of
the population is rural. This implies that distance to health facilities could also influence health
seeking behaviour in this population as has been shown elsewhere in LMICs [27,28]. We were
unable to determine distances to facilities within the scope of this study. While it’s a positive
trend that primary care facilities were utilized extensively, the county and sub-county health
management should strengthen this level of care to reduce dependence of higher level facilities
by e.g. ensuring allocation of resources according to need and demand.
Access and utilization of health services was inequitable even within households. Relatives
other than the head of the household and their immediate (nucleus) family were significantly
Health services utilization in rural Kenya
PLOS ONE | DOI:10.1371/journal.pone.0172728 February 27, 2017 9 / 12
disadvantaged in utilizing health services when they fell ill, although other unmeasured house-
hold-level factors could account for a third of the variation in this outcome. This observation
was probably influenced by household power dynamics and prevailing social norms e.g. a daugh-
ter-in-law may not request her father-in-law for money to take her sick child (or herself) to a
hospital. This being a mainly patriarchal community, male heads of the household have the most
authority on matters affecting household members including those related to seeking health
sevices for their spouses [29]. In this case, household heads may favour their more immediate
families in decisions related to seeking healthcare. Related to this, poverty could play an impor-
tant role in this observation, in which the household head may confer priority to his immediate
family members to expend the scarce household resources on healthcare at the expense of other
members of the extended family. The local health system management, through the existing
community health strategy and partnerships with NGOs working in this community should tar-
get these disadvantaged groups with programmatic interventions aimed at improving access to
health services for them. The CHWs could be trained to target and place emphasis on these
groups during their routine health promotion work in the community.
Limitations of the study
We did not measure distance to the nearest health facility, and this has been shown to influ-
ence access to and utilization of health services. In low income populations however, distance
is mainly related to cost of travel (rather than time taken) and is therefore reflected in the rea-
sons given for failure to seek care, although these could not be included in the regression anal-
yses. Our multilevel model (when adjusted for interaction between age and relationship to
head of the household) failed to converge on the ‘child’ category of the relation to head of
household as none (0) of those who failed to visit health facility when were ’child’ of the hhh in
the ’50+’ year age category.
Most of the respondents were male household heads and this could have biased the responses,
for instance it is likely that the male respondents may have been unaware of health status of
some household members.
Signs and symptoms of the reported ill health episodes were self-reported and as such not
classifiable into distinct disease entities. We however grouped these broadly based on the
organ system affected and/or on whether they were possibly infectious or non-infectious and
were therefore able to identify infectious conditions as the most common causes of morbidity.
Also utilization may have varied depending on whether the index illness was a chronic/non-
communicable or acute condition but this was difficult to determine given that only signs and
symptoms were reported.
Conclusion
We have generated new information that enhances our understanding of utilization of health
services in our study population. This information will enrich the perspective of the local
health management to better plan the allocation of scarce healthcare resources to the level of
health system that requires them the most, i.e. those with the highest patronage by the popula-
tion. We have also identified household-level factors that influence utilization of health ser-
vices during an illness. These are related to relationships within the household and possibly
influenced by household power dynamics and economic considerations (poverty related fac-
tors) when expending household resources on health services. The local health management
together with other stakeholders should target the disadvantaged groups through the health
promotion work of CHWs already working in this community. Ultimately, these data shed
Health services utilization in rural Kenya
PLOS ONE | DOI:10.1371/journal.pone.0172728 February 27, 2017 10 / 12

light on some of the key issues that can be targeted in efforts to improve equity in access and
utilization of health services in this population.
Supporting information
S1 Appendix.
(DOCX)
S1 Table.
(DOCX)
S2 Table.
(DOCX)
Acknowledgments
This work was conducted under the Integrated Primary Health Care (IPHC) program. IPHC
is a public-private partnership between the Aga Khan University-East Africa, University of
California San Francisco (UCSF) and the Sub-county Health Management of Kaloleni sub-
county in Kenya. We would like to thank the study the participants and local Kaloleni govern-
ment administration for facilitating this work in the community. We would like to thank Mr
James Orwa for the statistical review of this manuscript.
Author Contributions
Conceptualization: AKN MRM RA SM.
Data curation: AKN FA.
Formal analysis: AKN SM MRM.
Funding acquisition: AKN.
Investigation: AKN FA EN.
Methodology: AKN SM FA.
Project administration: FA AL AKN.
Resources: AKN RA FA DM.
Software: AKN FA.
Supervision: SM RA.
Validation: AKN FA EN.
Visualization: AKN.
Writing – original draft: AKN.
Writing – review & editing: AKN FA MRM AL DM EN RA SM.
References
1. Jacobs B, Ir P, Bigdeli M, Annear PL, Van Damme W (2012) Addressing access barriers to health ser-
vices: an analytical framework for selecting appropriate interventions in low-income Asian countries.
Health Policy Plan 27: 288–300. doi: 10.1093/heapol/czr038 PMID: 21565939
2. Government of Kenya (2010) The Bill of Rights Article 43: Constitution of Kenya.
Health services utilization in rural Kenya
PLOS ONE | DOI:10.1371/journal.pone.0172728 February 27, 2017 11 / 12

3. Chuma J, Okungu V (2011) Viewing the Kenyan health system through an equity lens: implications for
universal coverage. Int J Equity Health 10: 22. doi: 10.1186/1475-9276-10-22 PMID: 21612669
4. Obare V, Brolan CE, Hill PS (2014) Indicators for Universal Health Coverage: can Kenya comply with
the proposed post-2015 monitoring recommendations? Int J Equity Health 13: 123. doi: 10.1186/
s12939-014-0123-1 PMID: 25532714
5. Chuma J, Maina T, Ataguba J (2012) Does the distribution of health care benefits in Kenya meet the
principles of universal coverage? BMC Public Health 12: 20. doi: 10.1186/1471-2458-12-20 PMID:
22233470
6. Government of Kenya (2010) Devolved Government. Articles 186–187: Constitition of Kenya.
7. Bennett S, Woods T, Liyanage WM, Smith DL (1991) A simplified general method for cluster-sample
surveys of health in developing countries. World Health Stat Q 44: 98–106. PMID: 1949887
8. Kenya National Bureau of Statistics (2010) Kenya National Population and Housing Census. Nairobi.
9. Ndeng’e G, Opiyo C, Mistiaen J, Kristjanson P. (2003) Geographic Dimensions of Well-Being in Kenya:
Where are the Poor? From Districts to Locations. Nairobi: Central Bureau of Statistics. 164 p.
10. Kenya National Bureau of Statistics, ICF Macro (2010) Kenya Demographic and Health Survey 2008–
09. Nairobi.
11. Ministry of Health (2015) http://www.ehealth.or.ke/facilities/. Nairobi: ehealth-Kenya.
12. World Bank (2013) Physicians (per 1,000 people). http://dataworldbankorg/indicator/SHMEDPHYSZS
(Accessed 18th July 2015).
13. Centers for Disease Control and Prevention (2013) EpiInfo version 7. Clifton rd, Atlanta, GA, USA.
14. Vyas S, Kumaranayake L (2006) Constructing socio-economic status indices: how to use principal com-
ponents analysis. Health Policy Plan 21: 459–468. doi: 10.1093/heapol/czl029 PMID: 17030551
15. Statacorp (2013) Stata v13. College station, TX, USA.
16. Ministry of Health (2003) Kenya Household Health Expenditure and Utilization Survey. Nairobi.
17. Berkley J, Mwangi I, Griffiths K, Ahmed I, Mithwani S, et al. (2005) Assessment of severe malnutrition
among hospitalized children in rural Kenya: comparison of weight for height and mid upper arm circum-
ference. JAMA 294: 591–597. doi: 10.1001/jama.294.5.591 PMID: 16077053
18. Bejon P, Mohammed S, Mwangi I, Atkinson SH, Osier F, et al. (2008) Fraction of all hospital admissions
and deaths attributable to malnutrition among children in rural Kenya. Am J Clin Nutr 88: 1626–1631.
doi: 10.3945/ajcn.2008.26510 PMID: 19064524
19. Kevany S, Murima O, Singh B, Hlubinka D, Kulich M, et al. (2012) Socio-economic status and health
care utilization in rural Zimbabwe: findings from Project Accept (HPTN 043). J Public Health Africa 3:
46–51. doi: 10.4081/jphia.2012.e13 PMID: 22962629
20. Girma F, Jira C, Girma B (2011) Health services utilization and associated factors in Jimma zone,
south-west Ethiopia. Ethiop J Health Sci 21.
21. Muriithi MK (2013) The determinants of health-seeking behaviour in a Nairobi slum, Kenya. Eur Sci J 9:
151–164.
22. Chuma J, Maina T (2012) Catastrophic health care spending and impoverishment in Kenya. BMC
Health Serv Res 12: 413. doi: 10.1186/1472-6963-12-413 PMID: 23170770
23. Castro-Leal F, Dayton J, Demery L, Mehra K (2000) Public spending on health care in Africa: do the
poor benefit? Bull World Health Organ 78: 66–74. PMID: 10686734
24. Onwujekwe O, Ojukwu J, Uzochukwu B, Dike N, Ikeme A, et al. (2005) Where do people from different
socio-economic groups receive diagnosis and treatment for presumptive malaria, in south-eastern
Nigeria? Ann Trop Med Parasitol 99: 473–481. doi: 10.1179/136485905X51283 PMID: 16004706
25. Onwujekwe O (2005) Inequities in healthcare seeking in the treatment of communicable endemic dis-
eases in Southeast Nigeria. Soc Sci Med 61: 455–463. doi: 10.1016/j.socscimed.2004.11.066 PMID:
15893059
26. Glenngard AH, Maina TM (2007) Reversing the trend of weak policy implementation in the Kenyan
health sector?—a study of budget allocation and spending of health resources versus set priorities.
Health Res Policy Syst 5: 3. doi: 10.1186/1478-4505-5-3 PMID: 17394640
27. Buor D (2003) Analysing the primacy of distance in the utilization of health services in the Ahafo-Ano
South district, Ghana. Int J Health Plann Manage 18: 293–311. doi: 10.1002/hpm.729 PMID: 14727709
28. Gabrysch S, Campbell OM (2009) Still too far to walk: literature review of the determinants of delivery
service use. BMC Pregnancy Childbirth 9: 34. doi: 10.1186/1471-2393-9-34 PMID: 19671156
29. Abubakar A, Van Baar A, Fischer R, Bomu G, Gona JK, et al. (2013) Socio-cultural determinants of
health-seeking behaviour on the Kenyan coast: a qualitative study. PLoS One 8: e71998. doi: 10.1371/
journal.pone.0071998 PMID: 24260094
Health services utilization in rural Kenya
PLOS ONE | DOI:10.1371/journal.pone.0172728 February 27, 2017 12 / 12