
SPECIFICATION AND ANALYSIS OF RESOURCE UTILIZATION...
149
University of Massachuses - Amherst ScholarWorks@UMass Amherst Doctoral Dissertations May 2014 - current Dissertations and eses 2016 SPECIFICATION AND ANALYSIS OF RESOURCE UTILIZATION POLICIES FOR HUMAN-INTENSIVE SYSTEMS Seung Yeob Shin University of Massachuses - Amherst, [email protected] Follow this and additional works at: hp://scholarworks.umass.edu/dissertations_2 Part of the Soſtware Engineering Commons is Open Access Dissertation is brought to you for free and open access by the Dissertations and eses at ScholarWorks@UMass Amherst. It has been accepted for inclusion in Doctoral Dissertations May 2014 - current by an authorized administrator of ScholarWorks@UMass Amherst. For more information, please contact [email protected]. Recommended Citation Shin, Seung Yeob, "SPECIFICATION AND ANALYSIS OF RESOURCE UTILIZATION POLICIES FOR HUMAN-INTENSIVE SYSTEMS" (2016). Doctoral Dissertations May 2014 - current. Paper 805.
-
Upload
nguyennguyet -
Category
Documents
-
view
217 -
download
0
Transcript of SPECIFICATION AND ANALYSIS OF RESOURCE UTILIZATION...

University of Massachusetts - AmherstScholarWorks@UMass Amherst
Doctoral Dissertations May 2014 - current Dissertations and Theses
2016
SPECIFICATION AND ANALYSIS OFRESOURCE UTILIZATION POLICIES FORHUMAN-INTENSIVE SYSTEMSSeung Yeob ShinUniversity of Massachusetts - Amherst, [email protected]
Follow this and additional works at: http://scholarworks.umass.edu/dissertations_2
Part of the Software Engineering Commons
This Open Access Dissertation is brought to you for free and open access by the Dissertations and Theses at ScholarWorks@UMass Amherst. It hasbeen accepted for inclusion in Doctoral Dissertations May 2014 - current by an authorized administrator of ScholarWorks@UMass Amherst. For moreinformation, please contact [email protected].
Recommended CitationShin, Seung Yeob, "SPECIFICATION AND ANALYSIS OF RESOURCE UTILIZATION POLICIES FOR HUMAN-INTENSIVESYSTEMS" (2016). Doctoral Dissertations May 2014 - current. Paper 805.

SPECIFICATION AND ANALYSIS OF RESOURCE UTILIZATIONPOLICIES FOR HUMAN-INTENSIVE SYSTEMS
A Dissertation Presented
by
SEUNG YEOB SHIN
Submitted to the Graduate School of theUniversity of Massachusetts Amherst in partial fulfillment
of the requirements for the degree of
DOCTOR OF PHILOSOPHY
September 2016
Computer Science

c© Copyright by Seung Yeob Shin 2016
All Rights Reserved

SPECIFICATION AND ANALYSIS OF RESOURCE UTILIZATIONPOLICIES FOR HUMAN-INTENSIVE SYSTEMS
A Dissertation Presented
by
SEUNG YEOB SHIN
Approved as to style and content by:
Leon J. Osterweil, Co-chair
Yuriy Brun, Co-chair
Lori A. Clarke, Member
George S. Avrunin, Member
Hari Balasubramanian, Member
James Allan, Chair of the FacultyCollege of Information and Computer Sciences

DEDICATION
To my family

ACKNOWLEDGMENTS
First and foremost, I would like to express my sincere gratitude to my advisors: Leon
J. Osterweil and Yuriy Brun. I am so fortunate to have had the excellent experience of
benefiting from their advisorship concerning my graduate study and life. I have reached
this point because of their encouragement, patience, advice, and all other support. I cannot
imagine having better advisors and mentors for my graduate study.
I would also like to thank my committee members: Lori A. Clarke, George S. Avrunin,
and Hari Balasubramanian. In addition, I am also grateful to my domain expert, Philip
L. Henneman. Their valuable constructive feedback helped me improve the quality of my
dissertation. I appreciate having the great opportunity to collaborate with these amazing
researchers.
I also thank all members of the LASER lab at UMass Amherst. I really enjoyed working
at the lab because of their efforts to a create friendly working environment. I especially
thank Heather Conboy for her help in analyzing and extending the legacy source codes
developed in the LASER lab.
I am grateful to all my friends in Amherst. I was able to enjoy life in Amherst because
of them. The moments that we shared together are unforgettable and an exciting chapter
in my life. I would like to especially thank David Nielsen for his support and advice about
living in the USA.
Lastly, but most importantly, I would like to thank my family for all their love. My
family has been encouraging, supportive and shown belief in me. I never would have been
able to complete my thesis without their support. I’m especially thankful to my wife, Joo
Yeon Ryu. I would not be the person I am today without your love. I love you.
v

ABSTRACT
SPECIFICATION AND ANALYSIS OF RESOURCE UTILIZATIONPOLICIES FOR HUMAN-INTENSIVE SYSTEMS
SEPTEMBER 2016
SEUNG YEOB SHIN
B.Sc., SOGANG UNIVERSITY, KOREA
M.Sc., POHANG UNIVERSITY OF SCIENCE AND TECHNOLOGY, KOREA
M.Sc., UNIVERSITY OF MASSACHUSETTS AMHERST
Ph.D., UNIVERSITY OF MASSACHUSETTS AMHERST
Directed by: Professor Leon J. Osterweil and Professor Yuriy Brun
Contemporary systems often require the effective support of many types of resources,
each governed by complex utilization policies. Sound management of these resources
plays a key role in assuring that these systems achieve their key goals. To help system
developers make sound resource management decisions, I provide a resource utilization
policy specification and analysis framework for (1) specifying very diverse kinds of resources
and their potentially complex resource utilization policies, (2) dynamically evaluating
the policies’ effects on the outcomes achieved by systems utilizing the resources, and
(3) formally verifying various kinds of properties of these systems.
Resource utilization policies range from simple, e.g., first-in-first-out, to extremely
complex, responding to changes in system environment, state, and stimuli. Further, policies
may at times conflict with each other, requiring conflict resolution strategies that add extra
vi

complexity. Prior specification approaches rely on relatively simple resource models that
prevent the specification of complex utilization and conflict resolution policies. My approach
(1) separates resource utilization policy concerns from resource characteristic and request
specifications, (2) creates an expressive specification notation for constraint policies, and
(3) creates a resource constraint conflict resolution capability. My approach enables creating
specifications of policies that are sufficiently precise and detailed to support static and
dynamic analyses of how these policies affect the properties of systems constrained or
governed by these policies.
I provide a process- and resource-aware discrete-event simulator for simulating system
executions that adhere to policies of resource utilization. The simulator integrates the
existing JSim simulation engine with a separate resource management system. The separate
architectural component makes it easy to keep track of resource utilization traces during a
simulation run. My simulation framework facilitates considerable flexibility in the evaluation
of diverse resource management decisions and powerful dynamic analyses.
Dynamic verification through simulation is inherently limited because of the impos-
sibility of exhaustive simulation of all scenarios. I complement this approach with static
verification. Prior static resource analysis has supported the verification only of relatively
simple resource utilization policies. My research utilizes powerful model checking tech-
niques, building on the existing FLAVERS model checking tool, to verify properties of
complex systems that are also verified to conform to complex resource utilization policies.
My research demonstrates how to use systems such as FLAVERS to verify adherence
to complex resource utilization policies as well as overall system properties, such as the
absence of resource leak and resource deadlock.
I evaluated my approach working with a hospital emergency department domain expert,
using detailed, expert-developed models of the processes and resource utilization policies of
an emergency department. In doing this, my research demonstrates how my framework can
be effective in guiding the domain expert towards making sound decisions about policies for
vii

the management of hospital resources, while also providing rigorously-based assurances
that the guidance is reliable and well-founded.
My research makes the following contributions: (1) a specification language for resources
and resource utilization policies for human-intensive systems, (2) a process- and resource-
aware discrete-event simulation engine that creates simulations that adhere to the resource
utilization policies, allowing for the dynamic evaluation of resource utilization policies,
(3) a process- and resource-aware model checking technique that formally verifies system
properties and adherence to resource utilization policies, and (4) validated and verified
specifications of an emergency department healthcare system, demonstrating the utility of
my approach.
viii

TABLE OF CONTENTS
Page
ACKNOWLEDGMENTS . . . . . . . . . . . . . . . . . . . . . . . . . . . . . . . . . . . . . . . . . . . . . . . . . . . v
ABSTRACT . . . . . . . . . . . . . . . . . . . . . . . . . . . . . . . . . . . . . . . . . . . . . . . . . . . . . . . . . . . . . . vi
LIST OF FIGURES . . . . . . . . . . . . . . . . . . . . . . . . . . . . . . . . . . . . . . . . . . . . . . . . . . . . . . . xii
CHAPTER
1. INTRODUCTION . . . . . . . . . . . . . . . . . . . . . . . . . . . . . . . . . . . . . . . . . . . . . . . . . . . . . . 1
1.1 Motivating Example . . . . . . . . . . . . . . . . . . . . . . . . . . . . . . . . . . . . . . . . . . . . . . . . . 21.2 Contributions . . . . . . . . . . . . . . . . . . . . . . . . . . . . . . . . . . . . . . . . . . . . . . . . . . . . . . . 3
2. RESOURCE MANAGEMENT ISSUES . . . . . . . . . . . . . . . . . . . . . . . . . . . . . . . . . . . 5
2.1 Resource Characteristics . . . . . . . . . . . . . . . . . . . . . . . . . . . . . . . . . . . . . . . . . . . . . 52.2 Resource Requests . . . . . . . . . . . . . . . . . . . . . . . . . . . . . . . . . . . . . . . . . . . . . . . . . . 62.3 Resource Utilization Policies . . . . . . . . . . . . . . . . . . . . . . . . . . . . . . . . . . . . . . . . . . 7
3. RESOURCE MODELING . . . . . . . . . . . . . . . . . . . . . . . . . . . . . . . . . . . . . . . . . . . . . . . 9
3.1 Resource Characteristics . . . . . . . . . . . . . . . . . . . . . . . . . . . . . . . . . . . . . . . . . . . . 103.2 Resource Requests . . . . . . . . . . . . . . . . . . . . . . . . . . . . . . . . . . . . . . . . . . . . . . . . . 153.3 Resource Utilization Policies . . . . . . . . . . . . . . . . . . . . . . . . . . . . . . . . . . . . . . . . . 18
3.3.1 Permission Constraint Policy . . . . . . . . . . . . . . . . . . . . . . . . . . . . . . . . . . 183.3.2 Scheduling Policy . . . . . . . . . . . . . . . . . . . . . . . . . . . . . . . . . . . . . . . . . . . 203.3.3 Conflict Resolution Policy . . . . . . . . . . . . . . . . . . . . . . . . . . . . . . . . . . . . 23
3.3.3.1 Priority Conflict Resolution . . . . . . . . . . . . . . . . . . . . . . . . . . 233.3.3.2 Case Conflict Resolution . . . . . . . . . . . . . . . . . . . . . . . . . . . . . 25
4. DYNAMIC ANALYSIS THROUGH PROCESS- ANDRESOURCE-AWARE DISCRETE-EVENT SIMULATION . . . . . . . . . . . . . . 28
ix

4.1 Platform for Process- and Resource-Aware Discrete-Event Simulation . . . . . . 28
4.1.1 Little-JIL: Process Modeling . . . . . . . . . . . . . . . . . . . . . . . . . . . . . . . . . . 28
4.2 Process- and Resource-Aware Discrete-Event Simulator . . . . . . . . . . . . . . . . . . 31
4.2.1 Resource Manager Architecture . . . . . . . . . . . . . . . . . . . . . . . . . . . . . . . . 334.2.2 Specification of Simulation . . . . . . . . . . . . . . . . . . . . . . . . . . . . . . . . . . . 35
4.3 Constraint-Aware Resource Scheduling . . . . . . . . . . . . . . . . . . . . . . . . . . . . . . . . 36
4.3.1 Simulation-based Staffing Optimization . . . . . . . . . . . . . . . . . . . . . . . . . 36
4.3.1.1 Simulation-based Resource RequirementDetermination . . . . . . . . . . . . . . . . . . . . . . . . . . . . . . . . . . . 38
4.3.1.2 Staffing via Integer Linear Programming (ILP) . . . . . . . . . . 41
5. STATIC ANALYSIS THROUGH PROCESS- AND RESOURCE-AWAREMODEL CHECKING . . . . . . . . . . . . . . . . . . . . . . . . . . . . . . . . . . . . . . . . . . . . . . . 47
5.1 Resource-Aware Static Analysis . . . . . . . . . . . . . . . . . . . . . . . . . . . . . . . . . . . . . . 475.2 Platform for Process- and Resource-Aware Finite State Verification . . . . . . . . . 50
5.2.1 FLAVERS: FLow Analysis for VERification of Systems . . . . . . . . . . . 505.2.2 BIR: Bandera Intermediate Representation . . . . . . . . . . . . . . . . . . . . . . . 515.2.3 XPath: XML Path Language . . . . . . . . . . . . . . . . . . . . . . . . . . . . . . . . . . 52
5.3 Process- and Resource-Aware Model Checking . . . . . . . . . . . . . . . . . . . . . . . . . 54
5.3.1 BIR Translation Templates Encoding Resource Utilization . . . . . . . . . 56
5.3.1.1 BIR Template: Single Resource Allocation . . . . . . . . . . . . . . 565.3.1.2 BIR Template: Single Resource Release . . . . . . . . . . . . . . . . 585.3.1.3 BIR Template: Multiple Resource Allocations . . . . . . . . . . . 605.3.1.4 BIR Template: Multiple Resource Releases . . . . . . . . . . . . . 625.3.1.5 BIR Template: Permission Constraint Policy . . . . . . . . . . . . 635.3.1.6 BIR Template: Priority Conflict Resolution Policy . . . . . . . 645.3.1.7 BIR Template: Case Conflict Resolution Policy . . . . . . . . . . 66
5.3.2 Trace Flow Graph Encoding Resource Utilization . . . . . . . . . . . . . . . . . 665.3.3 Resource Constraint Finite State Machine . . . . . . . . . . . . . . . . . . . . . . . 695.3.4 Resource Property Finite State Machine . . . . . . . . . . . . . . . . . . . . . . . . . 735.3.5 Reachability Analysis for Resource Utilization . . . . . . . . . . . . . . . . . . . 75
6. EVALUATION . . . . . . . . . . . . . . . . . . . . . . . . . . . . . . . . . . . . . . . . . . . . . . . . . . . . . . . . . 79
6.1 Resource Modeling . . . . . . . . . . . . . . . . . . . . . . . . . . . . . . . . . . . . . . . . . . . . . . . . . 79
x

6.1.1 Patient Care Model Comparison . . . . . . . . . . . . . . . . . . . . . . . . . . . . . . . 80
6.2 Process- and Resource-Aware Discrete-Event Simulation . . . . . . . . . . . . . . . . . 83
6.2.1 Impact of Shift Length and Overlap . . . . . . . . . . . . . . . . . . . . . . . . . . . . 856.2.2 Comparison with Baystate Staffing Schedule . . . . . . . . . . . . . . . . . . . . . 89
6.3 Process- and Resource-Aware Model Checking . . . . . . . . . . . . . . . . . . . . . . . . . 90
6.3.1 Verification of Adherence to Resource Utilization Policy . . . . . . . . . . . 916.3.2 Reachability Analysis . . . . . . . . . . . . . . . . . . . . . . . . . . . . . . . . . . . . . . . . 956.3.3 Scalability Characteristics . . . . . . . . . . . . . . . . . . . . . . . . . . . . . . . . . . . . . 99
7. RELATED WORK . . . . . . . . . . . . . . . . . . . . . . . . . . . . . . . . . . . . . . . . . . . . . . . . . . . . 105
7.1 Modeling . . . . . . . . . . . . . . . . . . . . . . . . . . . . . . . . . . . . . . . . . . . . . . . . . . . . . . . . 105
7.1.1 Process Modeling . . . . . . . . . . . . . . . . . . . . . . . . . . . . . . . . . . . . . . . . . . 1057.1.2 Policy Modeling . . . . . . . . . . . . . . . . . . . . . . . . . . . . . . . . . . . . . . . . . . . . 108
7.2 Simulations . . . . . . . . . . . . . . . . . . . . . . . . . . . . . . . . . . . . . . . . . . . . . . . . . . . . . . 109
7.2.1 Simulations Tools . . . . . . . . . . . . . . . . . . . . . . . . . . . . . . . . . . . . . . . . . . 1107.2.2 Hospital Patient Care Simulations . . . . . . . . . . . . . . . . . . . . . . . . . . . . . 112
7.3 Static Analysis . . . . . . . . . . . . . . . . . . . . . . . . . . . . . . . . . . . . . . . . . . . . . . . . . . . . 112
7.3.1 Formal Verification Tools . . . . . . . . . . . . . . . . . . . . . . . . . . . . . . . . . . . . 1137.3.2 Static Resource Analysis . . . . . . . . . . . . . . . . . . . . . . . . . . . . . . . . . . . . . 113
7.4 Resource Management . . . . . . . . . . . . . . . . . . . . . . . . . . . . . . . . . . . . . . . . . . . . . 116
7.4.1 Resource Management in Operating Systems . . . . . . . . . . . . . . . . . . . 1167.4.2 Resource Management in Clouding Systems . . . . . . . . . . . . . . . . . . . . 117
8. CONCLUSIONS . . . . . . . . . . . . . . . . . . . . . . . . . . . . . . . . . . . . . . . . . . . . . . . . . . . . . . 118
8.1 Discussions . . . . . . . . . . . . . . . . . . . . . . . . . . . . . . . . . . . . . . . . . . . . . . . . . . . . . . 1188.2 Future Work . . . . . . . . . . . . . . . . . . . . . . . . . . . . . . . . . . . . . . . . . . . . . . . . . . . . . . 119
BIBLIOGRAPHY . . . . . . . . . . . . . . . . . . . . . . . . . . . . . . . . . . . . . . . . . . . . . . . . . . . . . . . . 125
xi

LIST OF FIGURES
Figure Page
3.1 The structure of resource characteristics describes the static relations of theentities that define a resource type. Cardinality 1..n denotes one or nnumbers. Cardinality 0..∗ represents zero or more. . . . . . . . . . . . . . . . . . . . . 10
3.2 An example of doctor resource type MD for the process of treatingpatients. . . . . . . . . . . . . . . . . . . . . . . . . . . . . . . . . . . . . . . . . . . . . . . . . . . . . . . . 13
3.3 Example states of six resource objects of MD type working during differentshifts at a system state of a patient care process in a hospital ED. . . . . . . . . 14
3.4 The structure of a resource request describes the static relations of theentities that define a resource request. . . . . . . . . . . . . . . . . . . . . . . . . . . . . . . . 15
3.5 Examples of resource requests from patient care activities in a hospitalED. . . . . . . . . . . . . . . . . . . . . . . . . . . . . . . . . . . . . . . . . . . . . . . . . . . . . . . . . . . . 17
3.6 The structure of the resource utilization policy specification describes thestatic relations between the policy’s entities. . . . . . . . . . . . . . . . . . . . . . . . . . 18
3.7 Examples of permission constraint policies in a patient care process in ahospital ED. . . . . . . . . . . . . . . . . . . . . . . . . . . . . . . . . . . . . . . . . . . . . . . . . . . . . 19
3.8 An example of a contention policy in a hospital ED. This example includesonly the key features specifications. . . . . . . . . . . . . . . . . . . . . . . . . . . . . . . . . 21
3.9 An example of a selection policy in a hospital ED. This example includesonly the key features specifications. . . . . . . . . . . . . . . . . . . . . . . . . . . . . . . . . 22
3.10 An example of priority conflict resolution policy in a hospital ED. Thisexample include only the key features specifications. . . . . . . . . . . . . . . . . . . 24
3.11 An example of a case conflict resolution policy in a hospital ED. Thisexample includes only the key features specifications. . . . . . . . . . . . . . . . . . 26
4.1 The Little-JIL definition of the patient testing process, which is part of thecare an acuity-level-four patient undergoes in an ED . . . . . . . . . . . . . . . . . . 29
xii

4.2 A view of the process- and resource-aware simulator that integrates JSimand Resource Manager. . . . . . . . . . . . . . . . . . . . . . . . . . . . . . . . . . . . . . . . . . . . 32
4.3 A resource manager architecture that enforces the specified resourceutilization policies while allocating resources. . . . . . . . . . . . . . . . . . . . . . . . . 33
4.4 These time distributions of steps are modeled from data of BaystateMedical Center, in Springfield, MA, USA. Second time unit is used intriangular distribution. . . . . . . . . . . . . . . . . . . . . . . . . . . . . . . . . . . . . . . . . . . . 35
4.5 Given the upper and lower utilization limits, the algorithm calculates howmany resources of type k are required during time block b = (t− i, t)and adjusts the number of available resources of type k to be assignedfor next time block nb = (t, t+ i). . . . . . . . . . . . . . . . . . . . . . . . . . . . . . . . . . 40
4.6 An instance of the algorithm execution for staffing demands:Rk
b = {r1,r2,r3}, Akb = {r2,r3}, dk
b = 3, Rknb = {r2,r3,r4,r5},
Aknb = {r3,r4,r5} where b = (t− i, t),nb = (t, t+ i) . . . . . . . . . . . . . . . . . . . . 41
4.7 Parameter values for MD staffing. B: twenty four time blocks. LMD: 8-hourshift length. SMD
b,l : time blocks in l length shift b. dMDb : staffing demands
per each time blocks driven by 70%–80% utilization target. pMDb,l :
non-overlapped three, 8-hour shifts. cMD: salary per hour. . . . . . . . . . . . . . . 43
4.8 Parameter values for RN staffing. B: twenty four time blocks. LRN :6,8,12-hour shift lengths. SRN
b,l : time blocks in l length shift b. dRNb :
staffing demands per each time blocks driven by 60%–70% utilizationtarget. pRN
b,l : three different shift lengths, and the staffing pattern allowsa shift to start at any time. cRN : salary per hour. . . . . . . . . . . . . . . . . . . . . . . 44
4.9 MD staffing solution of Figure 4.7. Three separate shifts, 7–14, 15–22 and23–6. Each shift has 9, 8 or 8 MDs. . . . . . . . . . . . . . . . . . . . . . . . . . . . . . . . . 45
4.10 RN staffing solution of Figure 4.8. Sixteen overlapped shifts. Shifts havedifferent lengths and start times. Total number of RNs 46 and RNsworking hours 392. . . . . . . . . . . . . . . . . . . . . . . . . . . . . . . . . . . . . . . . . . . . . . . 46
5.1 An example that shows the difference in verification results between theanalysis technique C and R. C-the property does not hold. R-theproperty holds. . . . . . . . . . . . . . . . . . . . . . . . . . . . . . . . . . . . . . . . . . . . . . . . . . . 48
5.2 An example that shows the different verification results between theanalysis technique C and R. C-the property holds. R-the property doesnot hold. . . . . . . . . . . . . . . . . . . . . . . . . . . . . . . . . . . . . . . . . . . . . . . . . . . . . . . . 49
xiii

5.3 An example that shows the difference in verification results between theanalysis technique C and R caused by resource deadlock. C-theproperty holds. R-the property does not hold. . . . . . . . . . . . . . . . . . . . . . . . . 49
5.4 Little-JIL diagram to illustrate how to use XPath expressions to navigateactivities. . . . . . . . . . . . . . . . . . . . . . . . . . . . . . . . . . . . . . . . . . . . . . . . . . . . . . . 53
5.5 XML representation of an unrolled Little-JIL diagram in Figure 5.4. ThisXML document is used only for purposes of explaining XPath. . . . . . . . . . 53
5.6 XPath expression examples that select activities in Figure 5.4. . . . . . . . . . . . . . 54
5.7 Overview of static process- and resource-aware model checking approach.My approach translates resource specifications into the inputs ofFLAVERS. . . . . . . . . . . . . . . . . . . . . . . . . . . . . . . . . . . . . . . . . . . . . . . . . . . . . . 55
5.8 BIR template that handles a single resource allocation request. Thisexample template assumes two resource objects that can handle Querywithout user specified resource utilization policies. . . . . . . . . . . . . . . . . . . . . 57
5.9 BIR template that handles a single resource release request that matchesFigure 5.8. . . . . . . . . . . . . . . . . . . . . . . . . . . . . . . . . . . . . . . . . . . . . . . . . . . . . . 59
5.10 BIR template that handles multiple allocation requests. This exampletemplate handles two allocation requests. . . . . . . . . . . . . . . . . . . . . . . . . . . . . 61
5.11 BIR template that handles multiple release requests. This example matcheswith Figure 5.10 . . . . . . . . . . . . . . . . . . . . . . . . . . . . . . . . . . . . . . . . . . . . . . . . . 62
5.12 BIR template that handles multiple permission constraint policies. Thisexample template encodes two permission constraint policies thatrestrict the possible allocation of two resource objects for a givenrequest. . . . . . . . . . . . . . . . . . . . . . . . . . . . . . . . . . . . . . . . . . . . . . . . . . . . . . . . . 64
5.13 This example BIR template encodes a priority conflict resolution policy. Aset of permission constraint policies of PA and PB has higher prioritythan a set of permission constraint policies of PB. . . . . . . . . . . . . . . . . . . . . 65
5.14 This example template encodes a case conflict resolution policy. A conflictcondition is defined when a permission constraint policy PA is satisfied,but PB is not satisfied. This specific conflict case is resolved byenforcing only PB. . . . . . . . . . . . . . . . . . . . . . . . . . . . . . . . . . . . . . . . . . . . . . . 67
5.15 BIR to TFG translation: resource allocation BIR template in Figure 5.8. . . . . . 68
xiv

5.16 BIR to TFG translation: resource release BIR template in Figure 5.9. . . . . . . . 69
5.17 Constraint FSM associated with the integer range variable (ResourceVar:range 0..1) to reference two resource objects. . . . . . . . . . . . . . . . . . . . . . . 70
5.18 Constraint FSM that excludes infeasible traces of handling multiplerequests from an activity. . . . . . . . . . . . . . . . . . . . . . . . . . . . . . . . . . . . . . . . . . 71
5.19 Template constraint FSM that excludes infeasible resource utilization tracesthat violate resource capacity constraints. . . . . . . . . . . . . . . . . . . . . . . . . . . . . 72
5.20 This property FSM encodes the same staff (e.g., MD and RN) property. Theidle and care states are accepting states. The violation state is atrap state. . . . . . . . . . . . . . . . . . . . . . . . . . . . . . . . . . . . . . . . . . . . . . . . . . . . . . . 73
5.21 An example of resource event binding for the same MD property assumingthree MD resource objects (md0, md1, and md2). The event names aredeclared in Figure 5.20 . . . . . . . . . . . . . . . . . . . . . . . . . . . . . . . . . . . . . . . . . . . 75
5.22 Overall ED process structure of Little-JIL and XPath expressions. . . . . . . . . . . 76
5.23 A node-tuple graph example: each vertex is associated with a unique statecombination in a property FSM, a set of constraint FSMs, and a TFGnode. Edges represent feasible state transitions. . . . . . . . . . . . . . . . . . . . . . . 77
6.1 Partial patient care process model by using Arena which incorporates sixMDs working in three separate 8-hour shifts. (a) The shift and samedoctor policies are included. (b) The shift, same doctor, and handoffpolicies are included. . . . . . . . . . . . . . . . . . . . . . . . . . . . . . . . . . . . . . . . . . . . . 81
6.2 MD and RN staffing demands curves using the staffing demands algorithmin Figure 4.5. For example, (a) is MD and RN staffing demands curveswhen MD’s and RN’s lower and upper utilization limits are set as 50%and 60%, respectively. I omitted other combinations of resourceutilization ranges for exposition. . . . . . . . . . . . . . . . . . . . . . . . . . . . . . . . . . . . 85
6.3 Simulation results of patient’s LoS, contribution margin according to eachutilization boundary. LoS Requirements is the LoS objective,so thatfour staffing, MD(50-60) RN(70-80), MD(60-70) RN(70-80),MD(70-80) RN(50-60) and MD(70-80) RN(60-70) satisfy it. . . . . . . . . . . 86
xv

6.4 ILP solutions of various RN staffing patterns: (a) and (C) 12-hour shiftsdisallowing and allowing shift overlap, respectively; (b) 8-hour shiftdisallowing shift overlap; and (d) allowing for combinations ofoverlapping 6-, 8-, and 12-hour shifts. Staff salaries (USD/day):(a) 27,720, (b) 24,640, (c) 27,060 and (d) 21,560. I omitted othercombinations such as 6-hour shifts allowing and disallowing shiftoverlap for exposition. . . . . . . . . . . . . . . . . . . . . . . . . . . . . . . . . . . . . . . . . . . . 87
6.5 LoS comparison among various staffing . . . . . . . . . . . . . . . . . . . . . . . . . . . . . . . . 88
6.6 Number of handoffs comparison among various staffing . . . . . . . . . . . . . . . . . . 88
6.7 Utilization comparison among various staffing . . . . . . . . . . . . . . . . . . . . . . . . . . 89
6.8 Patient’s LoS and contribution margin comparison: RN(BMC) RN staffingof Baystate Medical Center, RN(50–60) RN staffing derived byutilization limits 50%–60%, RN(60–70) RN staffing derived byutilization limits 60%–70%, and RN(70–80) RN staffing derived byutilization limits 70%–80% . . . . . . . . . . . . . . . . . . . . . . . . . . . . . . . . . . . . . . . 90
6.9 Utilization comparison: RN(BMC) RN staffing of Baystate Medical Center,RN(50–60) RN staffing derived by utilization limits 50%–60%,RN(60–70) RN staffing derived by utilization limits 60%–70%, andRN(70–80) RN staffing derived by utilization limits 70%–80% . . . . . . . . . 91
6.10 Utilization comparison over 24 hours a day: RN Utilization(BMC) RNutilization of Baystate Medical Center, RN Utilization(70-80) RNutilization derived by utilization limits 70%–80% . . . . . . . . . . . . . . . . . . . . . 92
6.11 This property FSM encodes the shift property assuming there are threediscrete time events: time 0, time 8, and time 16. . . . . . . . . . . . . . . . . . . 93
6.12 Timer process that generates three discrete time events: time 0, time 8,and time 16. . . . . . . . . . . . . . . . . . . . . . . . . . . . . . . . . . . . . . . . . . . . . . . . . . . . 93
6.13 An example of resource event binding for the shift property assuming threeMD resource objects (md0, md1, and md2). The event names aredeclared in Figure 6.11. . . . . . . . . . . . . . . . . . . . . . . . . . . . . . . . . . . . . . . . . . . 94
6.14 Doctor’s capacity property FSMs. (a) A doctor can be reserved for threepatients at most. (b) A doctor can care for one patient at the sametime. . . . . . . . . . . . . . . . . . . . . . . . . . . . . . . . . . . . . . . . . . . . . . . . . . . . . . . . . . . 94
6.15 An example of resource event binding for the capacity property of anresource object (md0). The event names are declared in Figure 6.14. . . . . . . 95
xvi

6.16 A counterexample violates that a request assign event must be followedby an associated assign event. . . . . . . . . . . . . . . . . . . . . . . . . . . . . . . . . . . . . 96
6.17 This same staff property represents a medical provider can care for a patientonly during the medical provider’s shift hours. . . . . . . . . . . . . . . . . . . . . . . . 97
6.18 An example of resource event binding for the same staff property inFigure 6.17. . . . . . . . . . . . . . . . . . . . . . . . . . . . . . . . . . . . . . . . . . . . . . . . . . . . . 97
6.19 A resource deadlock trace in the critical patient care process in my EDmodel. . . . . . . . . . . . . . . . . . . . . . . . . . . . . . . . . . . . . . . . . . . . . . . . . . . . . . . . . . 98
6.20 Two process specification having a resource deadlock problem and nothaving the problem. . . . . . . . . . . . . . . . . . . . . . . . . . . . . . . . . . . . . . . . . . . . . . . 98
6.21 This property FSM represents a patient care process must be completedonce started. started event is bound to the started event of the rootactivity of my ED activity model. completed event is bound to thecompleted event of the root activity of my ED activity model. . . . . . . . . . 100
6.22 Comparison of how many patients can be included in analysis settingswhich vary the combination of policies. . . . . . . . . . . . . . . . . . . . . . . . . . . . . 100
6.23 Comparison of the sizes of analysis problems associated with verificationswith all processes in Figure 6.22. . . . . . . . . . . . . . . . . . . . . . . . . . . . . . . . . . . 101
6.24 Comparison of the sizes of analysis problems by only changing propertyFSMs. . . . . . . . . . . . . . . . . . . . . . . . . . . . . . . . . . . . . . . . . . . . . . . . . . . . . . . . . 101
6.25 Comparison of how many patients can be included in analysis settingswhich vary capacity constraint FSMs and policies. . . . . . . . . . . . . . . . . . . . 102
6.26 Comparison of the sizes of analysis problems by changing only handoffpolicy. . . . . . . . . . . . . . . . . . . . . . . . . . . . . . . . . . . . . . . . . . . . . . . . . . . . . . . . . 102
6.27 Verification results by changing the number of doctor resource objects.(a) compares the number of TFG nodes. (b) compares the elapsedverification times. . . . . . . . . . . . . . . . . . . . . . . . . . . . . . . . . . . . . . . . . . . . . . . 103
6.28 Comparison of the sizes of analysis problems by changing the combinationsof including different resource types. . . . . . . . . . . . . . . . . . . . . . . . . . . . . . . 103
xvii

CHAPTER 1
INTRODUCTION
Human-intensive systems, where human, software, and hardware resources must be
synergistically integrated to perform key functions, play an important role in our society.
Because access to these resources is usually limited both by their small quantity and by
restrictions on their availability, contention for them is often a serious problem. The
problem is addressed by creating policies that are driven by system goals, regulations, or the
need to satisfy the interests of different stakeholders. Resource utilization policies usually
significantly impact system behaviors and results. Resource utilization policies range from
simple, e.g., sickest patient first, to extremely complex, responding to changes in system’s
environment, state, and stimuli. Thus, for example, a hospital’s staffing policy influences
staff workload, costs, quality of patient care, etc. Therefore, resource utilization policies
should be thoroughly evaluated and rigorously analyzed.
In addition to the inherent complexity of some policies, an additional major challenge
in analyzing resource utilization policies is that policies can conflict with each other. This
conflict may postpone system execution, or may even cause significant damage to the system
such as creating a life-threatening situation in a hospital. Ideally, such conflicts should be
anticipated so that if they arise, smooth operation of the system can nevertheless continue.
However, as system size and complexity grow, policies tend to grow as well, both in number
and in complexity. This increases the likelihood of conflicts and the difficulty of anticipating
and resolving all of them. Therefore, evaluation and analysis of resource utilization policies
have become even more challenging.
1

1.1 Motivating Example
Even though my research is designed to be generally applicable for human-intensive
systems, this work focuses on a specific healthcare domain for exposition and evaluation -
patient care processes in a hospital emergency department (ED). The patient care system
integrates various kinds of resources and their utilization policies. Aspects of the system
relevant for critical care require careful analysis of resource utilization policies before
executing the policies in a real-world setting. In the worst case, inadequate analysis of
resource utilization policies may result in life-threatening situations in a hospital ED.
Assuring sound management of the diverse kinds of human and other resources in a
hospital ED is complex and made more so by the need for policies that must be sufficiently
flexible to deal with many different kinds of circumstances. Thus, for example, nurses
may perform technicians’ activities such as Electrocardiogram (EKG) testing in crowded
situations to alleviate the heavy workload on technicians, whereas these activities are
performed only by technicians under normal circumstances. In addition, hospital staff can
care for patients only during their shift hours. However, their shift hours may be changed
if the hospital decides to make scheduling policy changes, for example to prepare for
an increased incidence of accidents during a vacation season. Therefore, these dynamic
changes in resources’ system participation must be carefully considered to assure efficient
and effective resource management.
In addition, the participation in patient care by hospital staff is restricted by various
resource utilization policies that often conflict with each other. For instance, a patient in a
hospital ED should be cared for by the same doctor and nurse while the patient stays in the
ED. Under unusual circumstances, however, a hospital may allow violation of this policy
to improve efficiency in patient care. For instance, if a highly-skilled nurse is too busy to
care for his non-severe patients, he may be allowed to delegate his work (e.g., monitoring or
discharge) to another nurse even though this delegation policy conflicts with the same nurse
policy. Similarly, policies that define the work hours of shifts may also lead to conflicts with
2

the same doctor policy, for example when a patient is unable be discharged until after the
end of the shift of the admitting doctor. To address this policy conflict, hospitals necessarily
incorporate a handoff policy requiring that a departing doctor hands over her patients to
an incoming doctor. This handoff policy becomes even more complex when taking into
account a doctor’s workload, length of patient stay (LOS), and other patient care quality
measurements.
Suboptimal policies for resolving hospital resource management conflicts can result
in such problems as overcrowding, inefficient staff utilization, very long LOS, and other
medical or financial problems. To address these problems, hospitals are always seeking
better resource utilization policies. I believe my approach supports such efforts by facil-
itating (1) the exploration of various changes in resource utilization policies through the
concentration of resource utilization policy issues into a separate component containing
all resource allocation and conflict resolution specifications, (2) the use of discrete-event
simulation to evaluate the effects of diverse alternative resource utilization policies, and
(3) the verification of the adherence of these simulations to specified resource utilization
and conflict resolution policies.
1.2 Contributions
My research provides a framework consisting of resource utilization policy specification
and analysis for human-intensive systems. This framework extends an iterative process
improvement framework [4, 10, 51] by focusing on resource utilization improvement. The
specification approach describes resources and their interactions in a system formally
according to separated resource concerns such as resource characteristics, resource request
and resource utilization policy concerns. My approach separates resource utilization policy
concerns from other resource characteristics and resource request concerns. My approach
provides three types of policy specifications: permission constraint policies to restrict the
capability support of a resource, conflict resolution policies to resolve a conflict between
3

multiple resource utilization policies, and scheduling policies to define precedence among
requests or resources. For analysis, my research develops a process- and resource-aware
discrete-event simulator that adheres to the resource utilization policy specification to support
dynamic analysis of the effects of diverse resource utilization policies. In addition, my
approach provides a process- and resource-aware model checking technique that supports
static analysis of resource utilization policies in a system. For example, my static resource
analyzer guarantees the absence of violations of resource utilization policies as well as other
general resource utilization properties related to resource capacity, deadlock and leak.
My research makes the following main contributions:
• Precise specification language for resources and resource utilization policies (permis-
sion constraints, conflict resolutions, and schedules)
• Process- and resource-aware discrete-event simulations that adhere to the resource
utilization policy specifications
• Process- and resource-aware model checking that verifies system properties and
adherence to resource utilization policies
• Elaborated patient care process models based on real-world data and the domain
expert’s knowledge
• A case study applying my approach to validate and verify patient care processes in a
hospital ED
4

CHAPTER 2
RESOURCE MANAGEMENT ISSUES
This chapter describes challenges in making efficient and effective resource management
decisions. I categorize the issues into the three concerns: resource characterization, resource
request specification, and resource utilization policy definition.
2.1 Resource Characteristics
Characterizing resources is an essential basis for resource management. In previous
work [59], I showed that resources can be considered to be objects that are instances of
well-defined types. In this dissertation, I have extended the facilities for resource definition
in ways that are detailed in the following section of this dissertation, responding to new
challenges in addressing ED process details. As noted in [51], I identify the following issues
in defining resource types:
• Resource diversity: The range of resources to define is unusually broad, encompass-
ing all kinds of hardware, software, and human resources. For instance, the resources
in a hospital system include doctors, porters, EHRs, CT scanners, beds, and blood. I
treat all as objects of types having internal state, and defined in terms of their abstract
interfaces. Thus I define categories of resources such as doctors and infusion pumps to
be types, characterized primarily by the capabilities that they offer and their attribute
sets. Individual doctors and infusion pumps are defined as objects of these types,
differentiated from each other primarily by the values of their attributes.
• Resource attributes: Resource attributes are used to characterize objects sufficiently
well to support intelligent decision-making about their suitability for satisfying re-
5

quests. Thus all resources have a Capacity attribute. Human resources typically
have such attributes as name, age, title, and education. Hardware resource attributes
can include model number, serial number, date purchased, and power requirements.
Software resource attributes often include programming language, operating system
requirements, size, and speed.
• Resource capabilities: The abstract interface to a resource consists primarily of a
set of capabilities, each of which corresponds to a specification of a kind of task that
this resource can be counted upon to be able to perform. Thus, for example, a nurse
resource should have the inject medication capability, and an Electronic Healthcare
Record (EHR) should have the get most recent Electrocardiogram capability.
• Dynamic characteristics: In the work described in this dissertation, I addressed the
new challenge of recognizing that resource characteristics and capabilities change
dynamically over time and with changes in system environment. Thus, while [51]
addressed the need for the values of a resource’s attributes (e.g., location, availability,
and even skill levels) to change over time, in this new work I address the need
for the set of capabilities offered by a resource to also change over time for various
reasons such as breaks, lunches, power outages, network unavailability, and cool-down
periods.
2.2 Resource Requests
Characterizing the need for a resource is no less essential to effective resource manage-
ment. Again, earlier work [59] characterized a need for a resource as an object, defined
principally as a set of attributes. The principal attribute is the type of capability being re-
quested. But in the work described in this dissertation I have added rigor in the specification
of some additional attributes. Thus, for example, I have added the purpose attribute, to
support reservation of resources. I observe that hospital resources such as beds, doctors, and
nurses may sometimes need to be reserved in advance to minimize delay in providing care
6

for an incoming patient. Such resources are expected then to be allocated only when the
patient actually arrives, but might also be preempted to meet a greater need, as determined by
some defined policy (to be discussed shortly). The purpose attribute supports differentiation
between reservation and allocation.
Other attributes are intended to provide help in handling resource contention, a central
problem in resource management. Because operating efficiency demands that systems not
be resourced too generously, there will be simultaneous requests for identical or similar
capabilities. In some cases an exact resource instance (e.g. the same doctor who performed
the most recent procedure) is required, but in other cases substitutions are acceptable. When
a requested resource is not immediately available, there are circumstances under which the
requestor is willing to wait, and some where waiting is intolerable. Accordingly, a resource
request object can specify whether substitutions are acceptable or not, and whether the
request is a blocking request or not. Other such attribute specifications are incorporated into
my request language.
2.3 Resource Utilization Policies
The matching of resource requests to resource specifications is typically governed by
policies that may be diverse, complex, and even inconsistent with each other. Policy diversity
results from the need to address the desires and constraints of many different stakeholders.
Attempting to meet all of these needs in turn leads to policies each of which can be intricate,
complex, and varying over time. The growth in the number of such policies then leads to
the possibility that some will come into conflict with each other, perhaps only under some
circumstances, and at different times.
For instance, a hospital ED allows the use of hallway beds only when the ED is crowded,
most of its main beds are occupied, and the patients waiting for bed placement are not
severely ill. This policy references different characterizations of the system environment
(level of ED crowding, level of main ED bed utilization, acuity level of patients awaiting
7

admission, etc.), but any of these characterizations might change with changing circumstance.
Thus, for example, in an emergency situation, a different level of acuity might be used to
determine the suitability of a waiting patient for admission to a hallway bed.
Ultimately, the principal goal of all of these notations is to support defining policies
whose application resolves resource contention problems. Policies that resolve resource
contention problems greatly affect the behavior of systems, and the more critical the system,
the more vital it is to have effective resource contention policies. Such policies can resolve
problems in variety of ways, for example by prioritizing and sequencing competing resource
requests, or by identifying alternatives to requested resources, For instance, a policy might
specify that a nurse can be allowed to perform a doctor’s task such as prescribing medication,
but only under stringently restricted circumstances. Or the policy might instead mandate
that the prescribing task must simply wait for the availability of a doctor. That policy, on the
other hand, might cause the violation of other policies, however, such as a policy that might
limit the amount of time that the prescribing task can be allowed to wait. In case of such
policy conflicts it is important that the resolution of such conflicts also be precisely defined.
Thus it is easy to see that it can be difficult to define policies precisely and completely,
but that precision and completeness are essential in order to support the need both to be sure
that policies are enforced correctly, and also to detect the possibility of policy conflicts, and
the satisfactory resolution of such conflicts. The next chapter of this dissertation describes
my approach to supporting such specifications.
8
CHAPTER 3
RESOURCE MODELING
This chapter describes my specification approach which describes resources and resource
utilization policies in human-intensive systems. My specification approach has been inspired
by the resource specification approach developed by Raunak [50]. Raunak provides a
resource specification method according to resource requests and characteristics. However,
his approach has limitations in specifying complex resource utilization policies. To be
specific, specifying a constraint policy is difficult if the constraint policy is related to
multiple resources, requests and other contexts. In addition, he does not support any cases
of conflict resolutions.
Resource utilization policies influence the utilization of resources in systems and are
derived from business goals, regulations, or other agreements among stakeholders. For
example, in hospitals, staff members are available to participate in patient care only during
their shift hours. A shift scheduling policy is designed to meet a variety of needs such as
maximizing profits, providing high quality patient care, accommodating preferences of staff
members’ working hours, adhering to labor regulations, and so on. Resource utilization
policies are often related to a system’s aspects such as time, resources, activities and artifacts.
To improve the specification and analysis capabilities of resource utilization policies, my
specification approach to resources and resource utilization policies is orthogonal to, and
separate from, other specifications such as activity and data flow specifications. I provide a
set of resource specifications consisting of resource characteristics, requests and utilization
policies.
9

Resource Type
Capability Attribute Declaration
Assignment Effort Needed
Reservation Effort Needed
0..*
1..n : Entity
Legend
0..* / 1..n : Cardinality
Capacity Effort Needed
1..n
Characteristics
Maximum Reservation
Capacity
Current Reservation
Level
Maximum Assignment
Capacity
Current Assignment
Level
: AND relation
Figure 3.1. The structure of resource characteristics describes the static relations of theentities that define a resource type. Cardinality 1..n denotes one or n numbers. Cardinality0..∗ represents zero or more.
To describe the rest of this chapter - resource characteristics, resource requests, and
resource utilization policies - I use some basic notations. Let P be a process of interest.
Let AP represents the set of all different activities of process P. An activity A ∈ AP is an
atomic activity that requires a set of resource objects to be performed. Let SP be the set of
all possible system states of process P. A specific system state S ∈ SP is characterized by
the information of time, activities’ execution states (e.g., see the states of steps in [72]), and
artifact (or data) values associated with each activity. I assume that each state is discretized
by time. States related to resources are not included in S ∈ SP which are defined in the
remaining sections.
3.1 Resource Characteristics
Resource characteristics are separately specified from other resource concerns such as
requests and resource utilization policies. Figure 3.1 describes the structure of resource
characteristics. As can be seen in Figure 3.1, a resource type is modeled as the composition
of a set of attribute declarations and a set of capabilities. Attribute declarations of a resource
type describe the common nature across resource objects of the same type, and its capability
set is the set of services that a resource object of the type can provide to perform activities.
10

Definition 1 and Definition 2 show the rigorous definitions of an attribute declaration and a
capability, respectively.
Definition 1 (Attribute declaration). An attribute declaration, AD, is a 2-tuple (IDAD,VAD),
where
• IDAD is the string identifier representing the attribute name of AD.
• VAD is the set of elements that represents the attribute values of AD.
Attributes such as the resource’s age, experience, job title, and skill are used in charac-
terizing individual resource objects. Then, an attribute declaration defines the name of an
attribute and the possible values of the attribute. A resource type includes a set of attribute
declarations. Given Definition 1, let ADP be the set of all attribute declarations of all
resource types used in process P.
Definition 2 (Capability). A capability, C, is a service that a resource object is able to
provide in performing an activity A ∈ AP.
A resource type also includes a set of capabilities - the services that a resource object
of the type is able to provide in performing activities. For instance, suppose P is a patient
care process in a hospital ED. Then, AP includes activities to care for patients. Capabilities
needed to support the patient care activities might include prescribing medications, ordering
tests, assigning bed-placement priorities, and other capabilities of hospital resources. Given
Definition 2, let CA be the set of elements representing resource capabilities required by
activity A ∈ AP to be performed. Then, let CP be the set of all capabilities required by all
activities in AP such that CP =⋃
A∈APCA.
Other particularly important attributes are the capacity attributes used to determine the
ability to take on new allocations of a resource object. As can be seen in Figure 3.1, each
resource type includes four capacity attribute declarations such as Maximum Reservation
Capacity, Current Reservation Level, Maximum Assignment Capacity, and Current
11

Assignment level. I define the capacity attribute declarations in Definition 3 where N
refers to the set of all natural numbers.
Definition 3 (Capacity attribute declaration). ADP has four distinguished elements: (CPMR,N),
(CPCR,N), (CPMA,N), and (CPCA,N), where
• (CPMR,N) is the attribute declaration of maximum reservation capacity.
• (CPCR,N) is the attribute declaration of current reservation level.
• (CPMA,N) is the attribute declaration of maximum assignment capacity.
• (CPCA,N) is the attribute declaration of current assignment level.
A resource object then has four distinguished capacity attributes according to the capacity
attribute declarations in Definition 3 The maximum reservation capacity of a resource object
quantifies the maximum amount of effort that the resource object can provide to handle
reservation requests at any given time. The resource manager will not reserve an additional
activity to the resource object if it determines that the sum of the current reservation level
and the reservation effort-needed required by the new activity will exceed the resource
object’s maximum reservation capacity. The reservation effort-needed for a capability
support defines the amount of effort that a resource object must reserve in order to be able to
provide the capability at some future time. Similarly, the attributes of maximum assignment
capacity, current assignment level, and assignment effort-needed of a resource object are
used for assignment requests. I define the effort-needed attribute declarations in Definition 4.
Definition 4 (Effort-needed attribute declaration). ADP has 2×|CP| distinguished elements:
(EFRE,C,N) and (EFAE,C,N) for all C ∈ CP, where
• (EFRE,C,N) is an attribute declaration of reservation effort-needed for C.
• (EFAE,C,N) is an attribute declaration of assignment effort-needed for C.
Given the above definitions, I define a resource type in Definition 5 that classifies a set
of resource objects sharing the resource characteristics of attributes and capabilities.
12
Resource type : MD
Attributedeclarations
Characteristics (name,String), (shiftStart,Time), (shiftEnd,Time)Capacity (CPMR,N), (CPCR,N), (CPMA,N), (CPCA,N)Effort-needed (EFRE,MDTreat,N), (EFAE,MDTreat,N)
Capabilities {MDTreat}
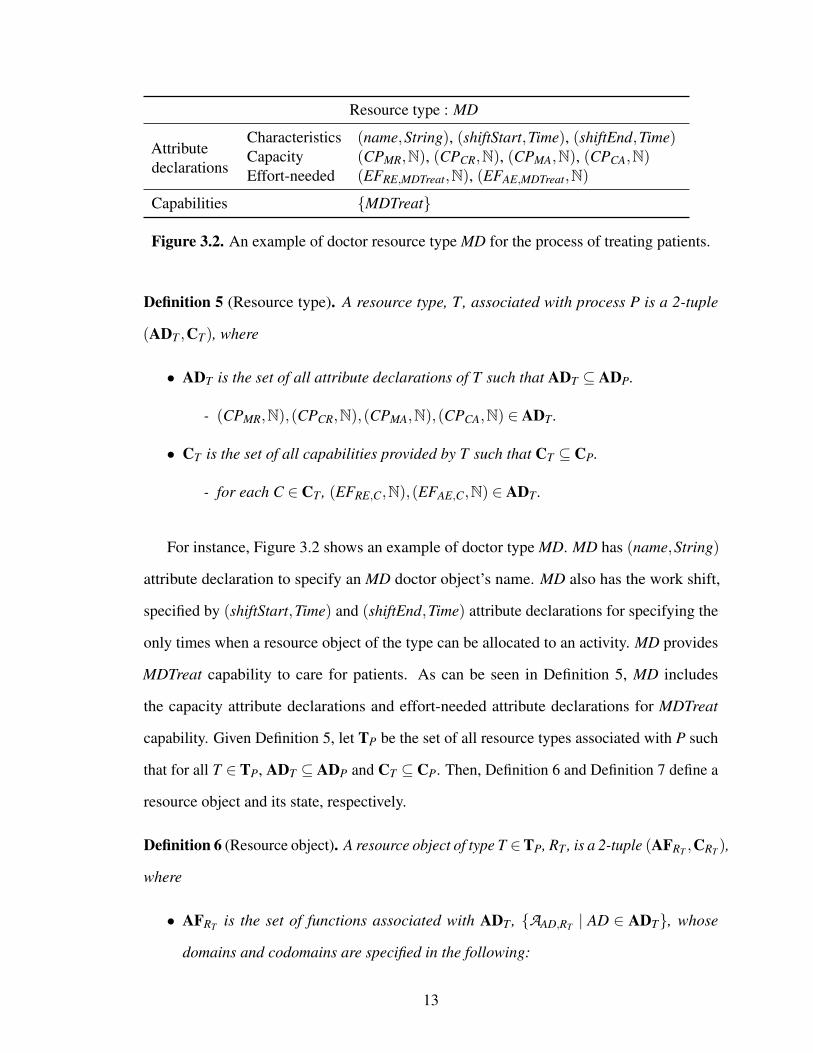
Figure 3.2. An example of doctor resource type MD for the process of treating patients.
Definition 5 (Resource type). A resource type, T, associated with process P is a 2-tuple
(ADT ,CT), where
• ADT is the set of all attribute declarations of T such that ADT ⊆ ADP.
- (CPMR,N),(CPCR,N),(CPMA,N),(CPCA,N) ∈ ADT .
• CT is the set of all capabilities provided by T such that CT ⊆ CP.
- for each C ∈ CT , (EFRE,C,N),(EFAE,C,N) ∈ ADT .
For instance, Figure 3.2 shows an example of doctor type MD. MD has (name,String)
attribute declaration to specify an MD doctor object’s name. MD also has the work shift,
specified by (shiftStart,Time) and (shiftEnd,Time) attribute declarations for specifying the
only times when a resource object of the type can be allocated to an activity. MD provides
MDTreat capability to care for patients. As can be seen in Definition 5, MD includes
the capacity attribute declarations and effort-needed attribute declarations for MDTreat
capability. Given Definition 5, let TP be the set of all resource types associated with P such
that for all T ∈ TP, ADT ⊆ ADP and CT ⊆ CP. Then, Definition 6 and Definition 7 define a
resource object and its state, respectively.
Definition 6 (Resource object). A resource object of type T ∈TP, RT , is a 2-tuple (AFRT ,CRT ),
where
• AFRT is the set of functions associated with ADT , {AAD,RT | AD ∈ ADT}, whose
domains and codomains are specified in the following:
13

MD resource object Attribute values
md0name = DA, shiftStart = 00 : 00, shiftEnd = 08 : 00CPMR = 4, CPCR = 2, CPMA = 1, CPCA = 0EFRE,MDTreat = 1, EFAE,MDTreat = 1
md1name = DB, shiftStart = 00 : 00, shiftEnd = 08 : 00CPMR = 4, CPCR = 4, CPMA = 1, CPCA = 1EFRE,MDTreat = 1, EFAE,MDTreat = 1
md2name = DC, shiftStart = 08 : 00, shiftEnd = 16 : 00CPMR = 4, CPCR = 0, CPMA = 1, CPCA = 0EFRE,MDTreat = 1, EFAE,MDTreat = 1
md3name = DD, shiftStart = 08 : 00, shiftEnd = 16 : 00CPMR = 4, CPCR = 0, CPMA = 1, CPCA = 0EFRE,MDTreat = 1, EFAE,MDTreat = 1
md4name = DE, shiftStart = 16 : 00, shiftEnd = 24 : 00CPMR = 4, CPCR = 0, CPMA = 1, CPCA = 0EFRE,MDTreat = 1, EFAE,MDTreat = 1
md5name = DF, shiftStart = 16 : 00, shiftEnd = 24 : 00CPMR = 4, CPCR = 0, CPMA = 1, CPCA = 0EFRE,MDTreat = 1, EFAE,MDTreat = 1
Figure 3.3. Example states of six resource objects of MD type working during differentshifts at a system state of a patient care process in a hospital ED.
- AAD,RT is an attribute function, AAD,RT : SP→ VAD,
• CRT is the set of all capabilities provided by RT such that CRT = CT .
Given Definition 6, let RT be the set of resource objects of T type. Then, let RP be the
set of all resource objects used in process P such that RP =⋃
T∈TPRT .
Definition 7 (Resource state). AS(R,S) is the state of resource object R ∈ RP at state
S ∈ SP, where
• AS(R,S) = {(A ,A(S)) | A ∈ AFR}.
Figure 3.3 shows the states of six resource objects of MD type at a system state S ∈ SP
assuming P refers to a patient care process in a hospital ED. The six doctors work in pairs
14

Request
Sender Type Capability
Blocking Non-Blocking
Purpose
Assignment Reservation
: XOR relation : AND relation : Entity
Legend
Figure 3.4. The structure of a resource request describes the static relations of the entitiesthat define a resource request.
on three different shifts. md0 and md1 work from 00 : 00 to 08 : 00. md2 and md3 work
from 08 : 00 to 16 : 00. md4 and md5 work from 16 : 00 to 24 : 00. Maximum reservation
capacity CPMR = 4 means that a doctor is allowed to be responsible for the treatment of up
to four patients since EFRE,MDTreat = 1. On the other hand, maximum assignment capacity
CPMA = 1 means that a doctor can be delivering service to only one patient at a time because
EFAE,MDTreat = 1. In this example, doctor md0 has been reserved to care for two patients (see
CPCR = 2) and the doctor is not actually caring for any patients at state S (see CPCA = 0).
However, doctor md1 has already been reserved to care for four patients, so md1 is not able
to see new patients until she discharges her patients (i.e., released from her patients). At
state S, md1 is actually caring for one patient (see CPCA = 1).
3.2 Resource Requests
A resource model includes specifications of resource requests. Each activity in a
system generates a separate request for each resource object it needs. My resource request
specification restricts a valid set of resource objects which provide the capabilities necessary
to perform activities. For example, in a hospital, performing an EKG or drawing blood
is restricted to nurses or technicians who provide these required capabilities. However,
15

technicians are not allowed to assess patients. In addition, even though resource objects
provide the same requested capability, candidate resource objects to perform activities
are further restricted according to the request context such as request time and sender
information. For example, day shift doctors are not considered as candidates to care for
patients during night shifts.
Figure 3.4 shows the static relation of my resource request specification entities. A
resource request is either a Reservation or an Assignment request based on the purpose of
the request. Sender activity information is required to define a resource request to identify
the context information such as what other resource objects are requested and which artifacts
are used by the sender activity. Both reservation and assignment requests ask for a resource
object that performs a particular Capability. Which resource object is returned depends
on the dynamic state of the process. For example, a doctor may be assigned to draw a
patient’s blood, but only when all nurses are fully assigned, and only when the blood draw
task is considered to require a small amount of effort and a low skill level. My specification
approach separates out these dynamic state concerns to specify resource utilization policies.
Resource requests query a resource object through a capability. A Non-Blocking request
from an activity requires immediate notification from a resource manager if the request is
not able to be handled at that time. On the other hand, a Blocking request from an activity
is a request that blocks the execution of the activity until the request is handled by a resource
manager.
To define a resource request, I assume that each A ∈ AP generates unique requests for
exposition. Duplicated requests to allocate multiple resources can be easily distinguished by
using unique request identifiers during the implementation phase. I define a resource request
in Definition 8.
Definition 8 (Resource request). A resource request, Q, is defined as a 4-tuple (Qpurpose,
Qsender, Qcapability, Qtype), where
• Qpurpose is a request purpose of Q, either reservation or assignment.
16

Purpose Sender Capability Type
reservation Treat MDTreat blockingreservation Treat RNTreat blockingassignment Triage Triage blockingassignment Register Register blockingassignment PlaceInBed PlaceInBed blockingassignment RNAssess RNTreat blockingassignment MDAssess MDTreat blocking
Figure 3.5. Examples of resource requests from patient care activities in a hospital ED.
• Qsender is a request sender activity of Q such that Qsender ∈ AP.
• Qcapability is a requested capability of Q such that Qcapability ∈ CA, A = Qsender.
• Qtype is a query type of Q, either blocking or nonblocking.
Given Definition 8, let QA be the set of resource requests from activity A ∈AP. Then, let
QP be the set of all possible requests that process P may generate such that QP =⋃
A∈APQA.
Figure 3.5 shows some example specifications of resource requests from patient care
activities in a hospital ED. For instance, when a new patient presents in an ED, Treat activity
first reserves (reservation) a doctor who provides MDTreat capability to care for the patient.
The request working as blocking means that the new patient must wait until a doctor has
been reserved for the patient.
At some state S ∈ SP, let AS be the set of activities that are ready and waiting to get
started. Then, let QS be the set of resource requests from AS where they are not handled
yet such that QS =⋃
A∈ASQA. Among the resource requests in QS, a resource request
Q ∈ QS might be handled by a resource object R ∈ RP where Qcapability ∈ CR through
either reservation or assignment allocation based on query purpose Qpurpose. However, the
information about resources and requests is not sufficient to model real-world resource
allocation because there are too many possible allocations to specify resource utilization in
17

: XOR relation : AND relation : Entity
Legend
Resource Utilization Policy
Conflict Resolution Schedule
Case Priority Contention
Permission
resource request Selection guard
Figure 3.6. The structure of the resource utilization policy specification describes the staticrelations between the policy’s entities.
a real-world system. Feasible resource allocations are subject to capacity constraints and
various resource utilization policies.
3.3 Resource Utilization Policies
Human-intensive systems incorporate diverse kinds of resource utilization policies.
These resource utilization policies are related to many aspects in systems such as activities,
artifacts, requests and resources. I separate resource utilization policy concerns from oth-
ers such as resource characteristics and requests. Figure 3.6 shows that my specification
approach provides facilities for the specification of three different kinds of resource uti-
lization policies, namely permission constraint policies (Permission), scheduling policies
(Schedule), and conflict resolution policies (Conflict Resolution).
3.3.1 Permission Constraint Policy
A Permission constraint policy specifies the permissibility of a Resource to handle
a Request as restricted by a specified Guard condition. Definition 9 defines a permission
constraint policy. I define a permission constraint policy in Definition 9.
Definition 9 (Permission constraint policy). A permission constraint policy, PC, is defined
as a 3-tuple (QPC,RPC,GPC), where
18

Permission constraint policy (QPC,RPC,GPC)
SameMD (QMDTreat,RMD,GSameMD)ShiftMD (QMDTreat,RMD,GShiftMD)
Figure 3.7. Examples of permission constraint policies in a patient care process in a hospitalED.
• QPC is the set of all requests restricted by PC.
• RPC is the set of all resource objects restricted by PC.
• GPC : SP×QPC×RPC→{true, false} is a function that defines the guard of PC. GPC
is evaluated to be true only if R ∈ RPC can handle Q ∈ QPC at S ∈ SP. Otherwise,
G(PC) is evaluated to be false.
Given Definition 9, let PCP be the set of all permission constraint policies restricting
the utilization of all resource objects in process P. Satisfaction of a permission constraint
policy PC ∈ PCP is determined by the guard of PC. For example, the SameMD and ShiftMD
permission constraint policies can be specified as shown in Figure 3.7. QMDTreat refers to the
set of resource requests requiring MDTreat capability in a patient care process of a hospital
ED. Thus, QC = {Q | Q ∈QP; Qcapability = C}. The SameMD permission constraint policy
is used to determine which MD resource object in RMD is available to handle a request
requiring the MDTreat capability in QMDTreat. Similarly, the ShiftMD permission constraint
policy is used to define the MD resource object’s shift, namely the hours during which an
MD resource object in RMD is allowed to handle a request in QMDTreat. A guard function is
represented as a boolean expression that is evaluated to be true only when a resource object
can handle a request. For instance, I specify GShiftMD as t >= r.shiftStart&&t < r.shiftEnd
where r is one of the MD resource objects (RMD), md0, md1, md2 or other resource objects
in Figure 3.3. The Boolean expression is evaluated to be true only when an MD resource
object r is working on her shift when a request for MDTreat capability happens at time t.
19

To handle a request Q ∈QPC, the set of permission constraint policies, PCQ = {PC |
PC ∈ PCP; Q ∈ QPC}, restricts the set of specific resource objects that satisfies all the
guards of permission constraint policies. These resource objects are named as candidate
resource objects. Let CANS,Q,PC be the set of resource objects which can handle a request
Q ∈ QPC at a state S ∈ SP while satisfying PC ∈ PCQ such that CANS,Q,PC = {R | R ∈
RPC; GPC(S,Q,R) = true}. Then, let the set of candidate resource objects to handle a
request Q at state S, CANS,Q, be CANS,Q =⋂
PC∈PCQCANS,Q,PC.
3.3.2 Scheduling Policy
The next policy specification approach, the Schedule policy, supports the specification
of Contention and Selection policies. Contention policies specify precedence among
requests. Specifically, I support specification of built-in policies such as random, first-in
first-out (FIFO), last-in first-out (LIFO), and priority-based as well as custom-built policies
that can be built based on the use of dynamic system state variables, such as patient load.
In a hospital ED, for instance, when multiple patient care activities for different patients
require the service of more doctors than are currently available for allocation, an appropriate
scheduling policy is necessary to resolve the contention problem among the requests for the
services of all doctor resources. I define a contention policy in Definition 10.
Definition 10 (Contention policy). A contention policy, CT, is defined as 2-tuple (QCT ,CF CT),
where
• QCT is the set of all resource requests scheduled by CT that may cause a contention
problem among the requests.
• CF CT : SP×P (QCT) 7→QCT is a partial function defining a contention policy that
selects a request to be handled at a state. CF CT is undefined for an empty set of
requests at a state. P (QCT) refers to the power set of QCT .
As can be seen in Figure 3.8, the sickest patient first policy is a contention policy that
is often used in a hospital ED, specifying that a doctor cares for patients according to the
20
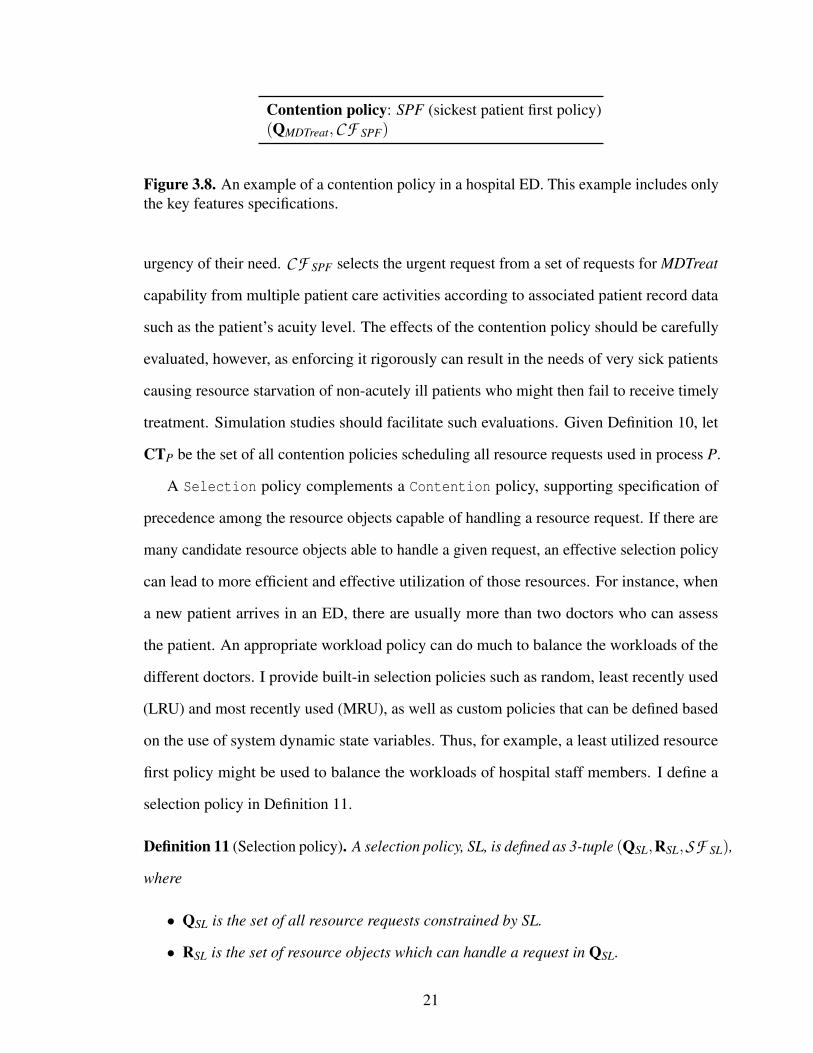
Contention policy: SPF (sickest patient first policy)(QMDTreat,CF SPF)
Figure 3.8. An example of a contention policy in a hospital ED. This example includes onlythe key features specifications.
urgency of their need. CF SPF selects the urgent request from a set of requests for MDTreat
capability from multiple patient care activities according to associated patient record data
such as the patient’s acuity level. The effects of the contention policy should be carefully
evaluated, however, as enforcing it rigorously can result in the needs of very sick patients
causing resource starvation of non-acutely ill patients who might then fail to receive timely
treatment. Simulation studies should facilitate such evaluations. Given Definition 10, let
CTP be the set of all contention policies scheduling all resource requests used in process P.
A Selection policy complements a Contention policy, supporting specification of
precedence among the resource objects capable of handling a resource request. If there are
many candidate resource objects able to handle a given request, an effective selection policy
can lead to more efficient and effective utilization of those resources. For instance, when
a new patient arrives in an ED, there are usually more than two doctors who can assess
the patient. An appropriate workload policy can do much to balance the workloads of the
different doctors. I provide built-in selection policies such as random, least recently used
(LRU) and most recently used (MRU), as well as custom policies that can be defined based
on the use of system dynamic state variables. Thus, for example, a least utilized resource
first policy might be used to balance the workloads of hospital staff members. I define a
selection policy in Definition 11.
Definition 11 (Selection policy). A selection policy, SL, is defined as 3-tuple (QSL,RSL,SF SL),
where
• QSL is the set of all resource requests constrained by SL.
• RSL is the set of resource objects which can handle a request in QSL.
21

Selection policy: LU, (least utilized first policy)(QMDTreat,RMDTreat,SF LU)
Figure 3.9. An example of a selection policy in a hospital ED. This example includes onlythe key features specifications.
• SF SL : SP×QSL×P (QSL) 7→ RSL is a partial function that selects a resource object
at a system state to handle a request. SF SL is undefined for a selection from an empty
set of resource requests at a system state. P (QSL) refers to the power set of QSL.
A selection policy, SL ∈ SLP, selects a resource object R ∈ RSL based on a system state
S ∈ SP and a resource request Q ∈ QSL. Given Definition 11, let SLP be the set of all
selection policies selecting resource objects for all resource requests used in process P.
Figure 3.9 shows the least utilization first policy. SF LU selects a resource object in
RMDTreat which provides MDTreat capability to handle a resource request in QMDTreat based
on utilization levels of the resource objects. The resource utilization level is calculated
based on information about dynamic system state variables such as the system’s execution
duration and resource allocation periods.
While a set of candidate resource objects CANS,Q for a request Q ∈QP at a state S ∈ SP
satisfies all the permission constraint policies related to Q, some resource objects may not
able to handle request Q at system state S because of their capacity constraints. Thus,
let AVLS,Q be the set of resource objects that are available to handle the request Q at the
state S such that AVLS,Q ⊆ CANS,Q. Then, the selection policy associated with Q selects a
resource object from AVLS,Q. In Figure 3.3, for example, md0 and md1 resource objects
are candidates to handle a request for MDTreat capability. However, only md0 is available
to handle the request because md1 will violate its capacity constraint (see CPMA = 1 and
CPCA = 1) if it handles the request.
Given the above definitions, valid resource allocations are determined by the following
iterative steps: (1) select a request Q ∈QS by considering a contention policy CT ∈ CTP
22

related to the request Q, (2) determine the set of candidate resource objects CANS,Q restricted
by the associated permission constraint policies, (3) select the set of available resource
objects AVLS,Q from CANS,Q considering the capacity constraints of the candidate resource
objects, (4) select a resource object from the set of available resource objects AVLS,Q by
using the associated selection policy SL ∈ SLP. However, enforcing multiple permission
constraint policies may create a conflict condition in which there are no candidate resource
objects that can handle request Q at state S, CANS,Q = ∅, satisfying all the permission
constraint policies. I address the conflict condition through conflict resolution policies.
3.3.3 Conflict Resolution Policy
Conflict resolution policies specify how to deal with other policies that may come into
conflict with each other. For the circumstances under which two or more policies cannot
be enforced at the same time, I provide capabilities for specifying Conflict Resolution
policies. I provide two kinds of conflict resolution policies: a Priority conflict resolution
policy and a Case conflict resolution policy.
3.3.3.1 Priority Conflict Resolution
A Priority conflict resolution policy specifies precedence among multiple sets of
permission constraint policies. A system first enforces a high priority set of permission
constraint policies; however, if a conflict condition occurs while forcing the permission
constraint policies, the system enforces a low priority set of permission constraint policies
to continue system services. Definition 12 defines this priority conflict resolution policy.
Definition 12 (Priority conflict resolution policy). A priority conflict resolution policy, PR,
is defined as 2-tuple (QPR,PRpriority), where
• QPR is the set of all resource requests restricted by PR.
23

Priority conflict resolution policy: HandoffMD(QMDTreat,({ShiftMD,SameMD},{ShiftMD}))
Figure 3.10. An example of priority conflict resolution policy in a hospital ED. Thisexample include only the key features specifications.
• PRpriority = (PCPR,1,PCPR,2, ...,PCPR,nPR). PCPR,i is an ith set of permission con-
straint policies of PR. PCPR,i has higher priority than PCPR,j if i < j. nPR is the
number of sets of permission constraint policies of PR.
For instance, in a hospital ED, how doctors hand off patients at the end of their shifts
can be defined using the priority conflict resolution policy in Figure 3.10. This conflict
resolution policy, (QMDTreat,({ShiftMD,SameMD},{ShiftMD})), specifies that enforcing
both the ShiftMD and SameMD permission constraint policies has higher priority than
enforcing only the ShiftMD permission constraint policy. In other words, this states that
the need to satisfy both ShiftMD and SameMD is considered first in allocating resource
objects. However, if no resource objects are able to satisfy all the permission constraint
policies, the permission constraint policy ShiftMD is applied next in considering possible
resource allocations. In Figure 3.3, for instance, if md0 ends her shift at 8PM, then md0 is
not able to care for her patients after 8PM because doing so would violate the ShiftMD policy.
According to the above priority specification, however, another doctor, either md2 or md3,
is then permitted to provide care for the patients of md0, assuming these other doctors are
on shift in the ED (i.e. assigning them must still satisfy the ShiftMD permission constraint
policy). After resolving such a conflict condition, the system returns to full enforcement of
all policies for subsequent resource allocation requests. Thus, for example, either md2 or
md3 (whoever has taken the handoff) is obliged to satisfy the same doctor policy until her
shift ends. Given Definition 12, let PRP be the set of all priority conflict resolution policies
enforced in process P.
24

This kind of conflict resolution specification offers broad applicability. I note, for
example, that the use of more highly skilled medical providers is generally preferred because
it typically results in the provision of higher quality patient care. But less skilled providers
may be allocated to certain tasks instead in order to improve the overall efficiency of the
healthcare system in providing patient care in various kinds of complex situations. Moreover,
as described in Section 1.1, in a particularly overcrowded ED, nurses may perform technician
tasks such as taking EKGs. Conversely, even though nurses may be the preferred providers
of certain kinds of patient care, a technician-use policy might dictate that technicians be
allowed to provide these specified kinds of care to certain classes of patients when nurses
are not available, perhaps due to nurse workload limitation policies. Similarly, the above
priority policy allows the delegation of a doctor’s work to another doctor when the first
doctor’s shift ends.
3.3.3.2 Case Conflict Resolution
In addition to a Priority conflict resolution policy, I provide another form of speci-
fication for conflict resolution, namely a Case conflict resolution policy. While a priority
conflict resolution policy seems more suitable for specifying relatively straightforward
conflict resolution, a case conflict resolution policy seems more suitable for complex conflict
resolution situations. A case conflict resolution policy resolves a specific case of a conflict
situation by a resolution action. Definition 13 defines a case conflict resolution policy.
Definition 13 (Case conflict resolution policy). A case conflict resolution policy, CR, is
defined as 2-tuple (QCR,CRconflict,PCCR,resolution), where
• QCR is the set of resource requests restricted by CR.
• CRconflict = (PCCR,true,PCCR,false) describes a specific conflict case.
- PCCR,true is the set of permission constraint policies that are satisfied when a
conflict occurs.
25

Case conflict resolution policy: FTB (fast-track bed utilization)(QPlaceInFastBed,({EmptyBed},{InFastTrack,FastTrackOpen}),{EmptyBed})
Figure 3.11. An example of a case conflict resolution policy in a hospital ED. This exampleincludes only the key features specifications.
- PCCR,false is the set of permission constraint policies that are not satisfied when
a conflict occurs.
• PCCR,resolution is the set of permission constraint policies to resolve the specific conflict
case, CRconflict.
As an example, consider the FTB (fast-track bed utilization) policy in Figure 3.11. Many
hospital EDs offer their patients care in two separate locations with separate facilities and
use somewhat different processes. These are often referred to as the main-track (for seriously
ill patients) and the fast-track (for all other patients). These are operated separately in order
to improve their overall efficiency and quality in providing ED patient care. While the
main-track operates 24 hours of every day, the fast-track is often closed during periods of
slack demand, such as late at night, in order to save money. If the locations of the two
tracks are not far from each other, hospitals often, especially during periods of heavy load,
find it useful to utilize fast-track beds for both main-track and fast-track patients, even if
the fast-track is closed. This policy can be be defined clearly and concisely using the case
conflict resolution policy, FTB. I do this by building upon some permission constraint
policies and combining them using the case conflict resolution policy specification approach.
Thus, I use the EmptyBed permission constraint policy, which enforces that a bed must not
already be occupied in order for it to be used to care for a new patient. I use the InFastTrack
permission constraint policy, which specifies that only fast-track patients are allowed to use
beds in the fast-track. I use the FastTrackOpen permission constraint policy, which specifies
the times during which the fast-track is open and closed. Given these three permission
constraint policies, I can specify the typical use of a fast-track ED bed when it is allocated to
26

accept a new fast-track patient in an open fast-track to be: only when a bed is not occupied
(EmptyBed satisfied), the bed and patient are located in the fast-track (InFastTrack satisfied),
and the fast-track is open (FastTrackOpen satisfied).
But a case conflict resolution policy specification can, in addition, support the specifica-
tion of the previously described conditions under which a fast-track bed can be allocated for
main-track use even when the fast-track is closed. This conflict situation as described in
Figure 3.11, is defined as ({EmptyBed},{InFastTrack,FastTrackOpen}), which defines the
situation in which a bed is not occupied, a patient is not located in the fast-track, and the
fast-track is closed. It then specifies the conflict resolution as described by {EmptyBed},
which specifies that it is allowable to enforce only the EmptyBed policy to resolve the
conflict situation (note that another schedule policy might be defined to enforce a preference
for using a main-track bed over a fast-track bed, when both are available). Therefore, this
conflict resolution policy specifies a flexible management of hospital bed resources by
utilizing fast-track beds when the fast-track is closed. Given Definition 13, let CRP be the
set of all case conflict resolution policies enforced in process P.
27

CHAPTER 4
DYNAMIC ANALYSIS THROUGH PROCESS- ANDRESOURCE-AWARE DISCRETE-EVENT SIMULATION
This chapter describes a process- and resource-aware discrete-event simulator that
dynamically analyze systems to evaluate diverse resource decisions that impact bottleneck,
performance and other quality measures of the systems. Utilizing this framework, I am able
to schedule resources to satisfy scheduling objectives and constraints.
4.1 Platform for Process- and Resource-Aware Discrete-Event Simu-
lation
My approach relies on the existence of a precise, well-defined system process model.
For the ED domain, this means a detailed model of the process by which patients are treated
in an ED. I used the Little-JIL language [72] to specify this model. This section describes
background information of Little-JIL which are relevant to my approach.
4.1.1 Little-JIL: Process Modeling
Little-JIL process definitions are based on the notion of functional decomposition of a
high-level process into a hierarchy of activities. Little-JIL has well-defined semantics based
on finite state machine (FSM) definitions, and is supported by a tool suite that includes
a graphical editor that renders process definitions as visualizations (Figure 4.1 shows an
example of such a visualization).
The central semantic element of a Little-JIL definition is the activity. Activities are
connected by edges to parents (above) and children (below), with edges also specifying the
28

sequential
choice
parallel
p(true) = x%
control flow
prerequisite
x%
Figure 4.1. The Little-JIL definition of the patient testing process, which is part of the carean acuity-level-four patient undergoes in an ED
flow of arguments between parents and children. Parent activities both define scopes, and
also specify the flow of control between children. The legend in Figure 4.1 indicates three
different control flow possibilities: sequential (children performed in left-to-right order),
parallel (children performed in any order, possibly concurrently), and choice (only one of
the children selected for performance). Each activity also incorporates a specification of
needed resources (e.g., doctor, nurse, x-ray machine) to be allocated at run time. Note that
these specifications can set up contentions that can further constrain execution order, for
example, by enabling or disabling concurrent execution.
29

My ED process model was developed based on the advice of a domain expert with
extensive experience as an emergency physician and ED manager at the Baystate Medical
Center, in Springfield, MA, USA. The full ED process model definition contains 178 activi-
ties, and is publicly available at http://people.cs.umass.edu/˜shin/ed/. Figure 4.1
illustrates one small part of this process definition, namely the patient testing process for
an acuity-level-four patient. Figure 4.1 specifies that AL4Test is a parallel activity, which
means a lab test process, AL4LabProc, can be performed in parallel with the other tests,
although contention for needed resources (in this case the MD) may make concurrency
impossible. As the Figure 4.1 legend notes, activities may have prerequisites that may be
used by my simulations to specify the relative frequency with which exceptions should be
thrown, or which of the alternatives specified as the children of a choice activity is the one
that should be selected. For example, the pre-requisite on AL4LabProc means that 92% of
acuity-level-four patients require the lab test. For the other tests, a nurse checks a patient’s
EKG first, RNECG, and then a doctor checks the EKG result, MDCkECG, because AL4ECGProc
controls its child activities sequentially. After the EKG, a nurse gives medication to the
patient, RNMedHi, and the patient is then transferred to either the CT or the x-ray room. This
behavior is represented by the AL4XrayOrCTOrNothing choice activity, only one of whose
child activities will be executed, with the choice made by the agent who performs the parent
activity.
I used Little-JIL to define my ED process because Little-JIL makes it easy to define and
represent visually some challenging, yet critical, features of the process. For example:
• Allowing For Process Variation: The Little-JIL choice activity makes it easy to
show that patients can arrive either by ambulance, when they are immediately placed
in a bed, or using their own transportation, with bed-placement based on classification
into one of six acuity levels. The choice activity also facilitates showing the different
treatment processes for the different levels.
30

• Supporting Human Decision Making: The choice activity also facilitates showing
where humans are free to choose among alternatives. Thus, for example, the choice
activity in Figure 4.1 modeled the doctor’s ability to choose either a CT or an X-Ray
for the patient. The choice activity also concisely and precisely defined the way
patients are given a bed-placement triage level between 1 and 5, and how this triage
level is then used to determine if a bed is to be allocated now or deferred.
• Concurrency: Some activities in some of the treatment processes can be performed in
parallel, and, indeed, further concurrency arises because the entire treatment process
is performed once for each patient in the ED. This can create contention for resources
such as MDs, RNs, and X-Ray machines, and makes the clear and precise specification
of the exact nature of the concurrency particularly important. The Little-JIL parallel
activity facilitates specifying this concurrency, and supports a clear visual depiction
of that seems readily accessible to ED domain experts.
• Exception Management: It is common for non-normative situations to arise in
EDs. For example, the lack of needed resources (e.g., beds, nurses) may necessitate
changes in treatment sequences or substitution of resources, and treatment procedures
that prove ineffective may necessitate new diagnostic procedures and diagnoses.
The Little-JIL exception management facilities, featuring scoped handling of typed
exceptions has proven particularly effective in defining clearly and precisely even
difficult exception management scenarios [33].
4.2 Process- and Resource-Aware Discrete-Event Simulator
My process- and resource-aware discrete-event simulator simulates processes whose
activities are modeled in Little-JIL, and whose resources are modeled in my resource
modeling approach. To this end, I have extended JSim [52], an existing discrete-event
simulator of Little-JIL processes. My extensions include support for (1) resource objects,
(2) the two-phase resource reservation and allocation, (3) permission constraint policies,
31

request request result system state
Little-JIL Interpreter / JSim
data flow component
activity coordination agent behavior discrete event
Resource Manager
resources, policies
Legend
Figure 4.2. A view of the process- and resource-aware simulator that integrates JSim andResource Manager.
(4) conflict resolution policies, and (5) contention policies to select preferred requests,
selection policy constrains to select preferred resources. These extensions enable the
simulator to support such scenarios as (1) allowing doctors to have varying shift constraints,
(2) enforcing the same doctor always handles a given patient, unless the doctor’s shift ends,
at which point the patient is handed off to a new doctor, (3) enabling a variety of scheduling
policies, such as handing the sickest patient first, or using the least utilized resource first.
Additionally I have redesigned the simulator’s architecture to improve the separation of
concerns and localization of key aspects of the system.
Figure 4.2 shows the extended JSim architecture that integrates Resource Manager
component. The architecture separates the activity issues from resource concerns, which
makes it easy to keep track of resource allocations, utilizations, waiting times, and other
properties that other simulators have difficulty reporting (see Section 7). In addition,
extended JSIM treats resource policies as a separate concern, which eases changing them,
facilitating experimentation with different resource allocation strategies.
The Little-JIL Interpreter is an abstract representation of a number of JSim
components not related to resource management. The activity coordination artifact
represents the Little-JIL activity definition. The agent behavior artifact specifies details
(such as speed and cost) of the way in which resource objects provide their capabilities.
The discrete event is an event arrival stream that triggers the execution of process
32

Request Handler Request Scheduler
Resource Specification Manager
Specification Parser
Allocation Manager
Outstanding
Request Pool
Resource
Instances
Policy
Specifications
Allocation
Table
Resource State Manager
Resource
Specifications
Resource Selector Permission Evaluator
Policy Selector
Request Management Specification Management
Allocation Management
Resource State Management
Conflict Resolver
Component Data Flow Repository Legend
Figure 4.3. A resource manager architecture that enforces the specified resource utilizationpolicies while allocating resources.
activities. During simulation, activities first allocate and then release resources by sending
requests to Resource Manager, which enforces the policies associated with each request
and determines which resources satisfy the request, and responds with either a satisfactory
resource, or a message that the needed resource is unavailable.
4.2.1 Resource Manager Architecture
Given the formal specifications of resource characteristics, requests and utilization
policies, I develop the architecture of the resource manager. This section explains the
architecture by focusing on the policy enforcement of resource allocation.
Figure 4.3 shows the architecture of the resource manager. While executing a sys-
tem, Request Handler inserts the number of requests that have arrived into Outstanding
Request Pool. For instance, the requests for multiple patients who are waiting to be
33

seen by a doctor are located in Outstanding Request Pool. Request Scheduler se-
lects a request based on a contention policy specification such as the sickest patient first
policy, then passes it to Allocation Manager for matching a resource instance to the re-
quest. Such resource specifications are managed by Resource Specification Manager.
Specifications of resource characteristics and utilization policies are located in Resource
Specifications and Policy Specifications repositories, respectively. Based on the
information of the selected request, Allocation Manager gathers related permission con-
straint policies from the Resource Specification Manager and resource instances from
the Resource State Manager. Resource State Manager keeps the dynamic state in-
formation of the resource manager, such as the internal states of each resource instance
and resource allocation traces. Policy Selector then selects a set of permission con-
straint policies to be evaluated based on the priority relations among policies. Permission
Evaluator evaluates the selected permission constraint policies to decide a set of candidate
resource instances for the selected request. For example, only doctors who are working
their shifts are considered as candidates to care for a patient. If there are no candidate
resource instances because of violation of the evaluated permission constraint policies,
Conflict Resolver considers this case as a conflict among the permission constraint poli-
cies. Conflict Resolver resolves this conflicted situation based on a conflict resolution
specification. If Permission Evaluator creates a set of candidate resource instances,
Allocation Manager adjusts the candidates based on the resource capacity constraint.
For instance, if a candidate doctor is caring for other patients at this point, Allocation
Manager excludes the doctor from the set of candidate resource instances. Last, Resource
Selector selects a resource instance among the available candidates according to the
selection policy related to the request.
34

<step name="RNECG"> <started> <complete><triangular min="233" mode="313" max="472" />
</complete> </started> </step>
<step name="MDCkECG"> <started> <complete><triangular min="11" mode="36" max="88" />
</complete> </started> </step>
<step name="RNMedHi"> <started> <complete><triangular min="181" mode="448" max="856" />
</complete> </started> </step>
Figure 4.4. These time distributions of steps are modeled from data of Baystate MedicalCenter, in Springfield, MA, USA. Second time unit is used in triangular distribution.
4.2.2 Specification of Simulation
A simulation run consisted of specifications of process activities, artifact flows, resources,
resource requests, and resource utilization policies (recall Chapter 3), as well as specifica-
tions of actual patient-care scenarios whose key variable components are: (1) rates of arrivals
of patients of different acuity levels over a 24-hour period and (2) activity performance
characteristics (such as the amount of time taken, the probability of exceptions, etc.) for each
resource object that might carry out each activity. The specifications used in my simulations
were based on observations taken at the Baystate Medical Center, in Springfield, MA, USA.
Each hourly patient arrival rate was modeled as a Poisson distribution around the observed
mean inter-arrival time. Resource quantities, characteristics, and constraints were modeled
after those considered typical at the Baystate Medical Center.
Estimates of the time required to perform each activity for each acuity level are specified
as triangular distributions based on data from the Baystate Medical Center. My medical
domain expert advised the use of the triangular distribution due to the small number of
observed time data. Figure 4.4 shows an example specifying the time distributions of three
leaf activities, RNECG, MDCkECG and RNMedHi, of the process shown in Figure 4.1. Thus,
for example, from the start of the RNECG activity the number of second until completion of
35

the activity is calculated to occur using the triangular distribution, (min=233, mode=313,
max=472). My simulation specifications also support other distributions such as normal,
linear range, and fixed time distributions.
4.3 Constraint-Aware Resource Scheduling
My process- and resource-aware discrete-event simulation framework facilitates ana-
lyzing resource utilization and exploring diverse resource utilization policies through the
separation of resource concerns. Given the simulation framework, I develop a method
for scheduling resources in complex systems that integrate humans with diverse hardware
and software components, and for studying the impact of resource schedules on system
characteristics. The method uses discrete-event simulation and integer linear programming
(ILP), and relies on detailed models of the system’s processes, specifications of the capa-
bilities of the system’s resources, and constraints on the operations of the system and its
resources. For exposition, this section addresses staffing problem in a hospital ED because
of its particularly complex resource scheduling requirements.
4.3.1 Simulation-based Staffing Optimization
Simulation-based staffing algorithm dynamically estimates and controls utilization
within pre-specified limits by changing the utilization levels of multiple human resources
simultaneously in complex service systems, and linking the resulting estimates to an ILP
that incorporates realistic staffing and shift constraints. Specifically, my approach consists
of three steps.
In the first stage, I use my simulator to generate an ED simulation, initially assuming
an infinite supply of all necessary resources. As this ED simulation executed, however, the
simulator add and remove resources as required to sustain the utilization targets for each
hour in the simulated 24-hour day, while also considering such other specifications as time
varying patient arrivals, different processes for each acuity level, resource interactions, and
36
other patient flow constraints. I call this the Staffing Demands Algorithm. The number of
replications of this simulation was determined by the desire to achieve a target confidence
interval (e.g., 95% confidence interval and a half-width within 2% of the mean of staff
utilization rates). After performing these simulation replications, I obtain the average
number of resources dkb required in time interval b to maintain the utilization target. For my
case-study, b is the index for hour of the day, and k refers type of staff - in my case, either
MDs or RNs. The exact details of how dkb is computed is provided in Section 4.3.1.1.
In the second stage, I use dkb, b = (0,1),(1,2), ...,(23,0), as input to an ILP whose
purpose was to obtain the minimum cost staffing schedule. The decision variables of the ILP
determine the number of type k resources to be scheduled in hour b to assure that the number
is greater than or equal to dkb. I also model some typical restrictions on shift lengths and
starting times, but also do studies where I model possible overlaps in shifts and differences
in shift lengths. The output of this second stage is xkb, the number of resources of type k
that need to be scheduled in hour b to minimize the total cost of salaries while meeting the
required constraints. The details of the ILP are provided in Section 4.3.1.2.
In the third stage, the staff schedule computed from the second stage ILP is used to
specify the exact numbers of MD and RN resources available for each hour in the simulated
24-hour day. I then run simulations using these staffing levels, and the other modeling
information as described in Chapter 3 to determine operational characteristics such as
patients’ length of stay, waiting times, contribution margin, and the actual utilization levels
of the resources (which, depending on the staffing constraints, could differ from original
targets), the number of patient handoffs etc.
For my studies, I ran batteries of simulations based on many different hypotheses about
staff utilization, shift length variation, shift overlapping, etc. Each different hypothesis
required carrying out all three of the stages just described. Each produced operational
characteristics that I used to compare and evaluate the effects of these different choices of
staff utilization levels and scheduling approaches. The results are presented in Chapter 6.
37

I now provide details of how I carry out each of these three stages in my simulation
approach.
4.3.1.1 Simulation-based Resource Requirement Determination
As the number of patient arrivals varies by the hour, the number of resources required
will also need to be varied so that the utilization of the resource remains within the pre-
specified utilization limits. The goal of the staffing demands algorithm is to dynamically
compute this distribution of required numbers of resources in the middle of a simulation
run. This approach allows the algorithm calculates the resource demands based on the
consideration of dynamic ED contexts such as patients’ arrivals/waits, utilization of other
resources (e.g., beds), interactions between resources, and other ED circumstances. In
addition, my algorithm can be executed on multiple resource types such as MD and RN at
the same time period during a simulation run.
Before I describe the algorithm, I distinguish between resource sets as follows. I assume
that there are some resources that are available for use during the entire duration of the bth
hour. In addition, there may also be other resources that may be used for some portion of
the hour, because they continue to be used to finish an activity that was begun during the
previous hour. For instance, if an MD’s shift ends before completing an x-ray check for
a patient, the MD will complete the x-ray check step thereby providing some amount of
MD resource during an hour that is beyond the MD’s original shift. Thus these additional
incremental amounts of resource availability must be added to the resource levels provided
by scheduled resources to accurately determine the levels of resources required for each
hour in the 24-hour day. When the MD completes the x-ray check step, the remaining steps
to care for the MD’s patients in beds are handed over to the other available MDs. This kind
of overtime work of a medical provider is frequently observed in real-world EDs. However,
my simulator does not supporting preemption. Which means that a handoff in the middle
of an activity execution is not supported. Due to this limitation, patient care steps in the
38

ED model are decomposed enough to model atomic activities in patient care that spend
small amount of time to prevent extensive overtime work. The notations in the algorithm for
staffing demands are:
i time interval between resource adjustment
l lower utilization limit to trigger decrementation of the number of resources required
for this time interval, 0 < l≤ u
u upper utilization limit to trigger incrementation of the number of resources required
for this time interval, 0 < u≤ 1
b time block tuple (f , t) from time f to t where | t− f |= i
k resource type
rb sum of busy periods for resource r during time block b
dkb staffing demand, the number of required staff, for resource r of type k during time
block b
Rk a set of resources of type k for which I want to determine required staffing levels
Rkb a set of resources of type k that are used during time block b, Rk
b ⊆ Rk
Akb a set of resources of type k that are available to be assigned during time block b,
Akb ⊆ Rk
b, Ak(0,i) = Rk where (0, i) is the first time block
Figure 4.5 describes the staffing demands algorithm. Rkb is the set of used resources of
type k during time block b. Akb is the set of available resources of type k during time block
b which means that only resource r ∈ Akb is available to be assigned during time block b.
Further, Akb ⊆ Rk
b.
For example, Figure 4.6 shows the execution of the algorithm for a single instance. As
per lines 7-15 of the algorithm, the resource utilization during time block b = (t− i, t) is
calculated. Here, Rkb = {r1,r2,r3} since resources r1, r2 and r3 are used from time t− i to t.
However, Akb = r2,r3 because resource r1 left at time c (some amount of resource utilization
in this time period was attributable to the overflow into this time period of some work begun
during the previous period). Therefore, r1 b = c− (t− i). After the algorithm calculates
39

1 StaffingDemands,AvailableResources2 calculateSaffingDemands (3 double l, double u,4 Time t, Time i,5 ResourceType k) {67 // calculate resource utilization8 TimeBlock b = (t-i,t);9 double denominator = 0;
10 double numerator = 0;11 for (∀ Resource r : r ∈ Rk
b) {12 denominator += (r ∈ Ak
b) ? i : rb;13 numerator += rb;14 }15 double utilization=numerator/denominator;1617 // calculate staffing demands18 StaffingDemands dk
b = 0;19 if (utilization ≥ l &&20 utilization ≤ u) {21 dk
b = count(Akb);
22 } else {23 double middle = (l+u)/2;24 dk
b = round(numerator/(middle*i));25 }2627 // select available resources28 TimeBlock nb = (t,t+i);29 AvailableResources Ak
nb = {};30 while(count(Ak
nb) != dkb) {
31 Resource r : r ∈ Rk;32 Ak
nb = Aknb ∪ {r};
33 }3435 return dk
b,Aknb
36 }
Figure 4.5. Given the upper and lower utilization limits, the algorithm calculates how manyresources of type k are required during time block b = (t− i, t) and adjusts the number ofavailable resources of type k to be assigned for next time block nb = (t, t+ i).
40

r1
r2
r3
time
r4
r5
t-i t t+i
busy period (numerator) working period (denominator) legend ri resource instance i
c
Figure 4.6. An instance of the algorithm execution for staffing demands: Rkb = {r1,r2,r3},
Akb = {r2,r3}, dk
b = 3, Rknb = {r2,r3,r4,r5}, Ak
nb = {r3,r4,r5} where b = (t− i, t),nb =(t, t+ i)
utilization at line 15, it determines how many resources are required to satisfy the desired
range of utilization levels l and u (lines 17-25). If the calculated utilization is between l and
u, it means that resources in Akb are utilized as expected. However, if utilization is outside
the limits l and u, the algorithm calculates staffing demands dkb based on the mid-point of
the utilization range middle = (l+u)/2 and actual assigned sub-periods numerator during
time t− i to t.
In addition to calculating staffing demands dkb, the algorithm adjusts the numbers of
resources Aknb for next time block, i.e., from t to t+ i (lines 27-33). The adjustment assumes
that there are no dramatic changes in patient arrivals in this next period. Therefore, I use dkb
to decide the size of Aknb.
4.3.1.2 Staffing via Integer Linear Programming (ILP)
In this section, I present my ILP-based staffing approach, which minimizes total staff
salaries, while meeting (a) hourly constraints on staff numbers calculated by the previously-
described staffing demands algorithm, and (b) constraints on allowed shift lengths and shift
start times. The ILP-based staffing approach divides a day into several discrete time blocks
(each an hour in length in my case-study). The ILP parameters are listed below.
B a set of time blocks in a day
41

Lk a set of shift lengths for resource type k
Skb,l a set of time blocks in a shift for resource type k where shift starting time block b ∈ B,
shift length l ∈ Lk
dkb staffing demands, the number of required resource, for resource type k during each
time block b ∈ B
pkb,l a staffing pattern for resource type k of a hospital
1 if a shift begins a time block b ∈ B and its shift length is l ∈ L;
0 otherwise
ck staffing cost per hour for resource type k
For instance, Figure 4.7 shows the ILP parameter values needed to determine MD staffing
levels. Parameter B divides a day into twenty four time blocks. Parameter pMDb,l establishes
three eight-hour, non-overlapping shifts a day for MDs. The staffing pattern parameter
pMDb,l can encode any staffing patterns of various shift lengths and start times; however, this
section demonstrates only this three shifts of MD for exposition. MD staffing demand dMDb
is assumed to have been derived using my previously-described simulation-based algorithm.
Alternatively, if an ED administration desires more flexibility to meet hourly variation in
demands, they may allow MDs and RNs to work a six, eight or twelve hour shift; further,
they may also allow shifts to start at any time. To accommodate this additional flexibility,
the ILP parameters for RN can be set as in Figure 4.8.
The decision variable in the ILP is xkb,l,i, which determines the number of a particular
staff type (e.g., MD or RN) needed in each hour of a shift. The number of xkb,l,i is equal to
| B | × | Lk | × | B | for all b, l, i combinations. I use the simplex method to solve the ILP,
NP-hard problem.
xkb,l,i the number of staff k in time block i in a shift
the shift starts at a time block b and its length is l ∈ Lk
42

B: {b0,b1,b2,b3,b4,b5, . . . ,b19,b20,b21,b22,b23}, bi = (i, i+1)LMD: {8}
SMDb,l : SMD
b0,8 = {b0,b1,b2,b3,b4,b5,b6,b7}, . . . ,SMD
b23,8 = {b23,b0,b1,b2,b3,b4,b5,b6}
dMDb :
0
1
2
3
4
5
6
7
8
9
10
b₀ b₁ b₂ b₃ b₄ b₅ b₆ b₇ b₈ b₉ b₁₀ b₁₁ b₁₂ b₁₃ b₁₄ b₁₅ b₁₆ b₁₇ b₁₈ b₁₉ b₂₀ b₂₁ b₂₂ b₂₃
pMDb,l : pMD
b7,8 = pMDb15,8 = pMD
b23,8 = 1, ∀b ∈ B\{b7,b15,b23},pMDb,8 = 0
cMD: USD188/hour
Figure 4.7. Parameter values for MD staffing. B: twenty four time blocks. LMD: 8-hourshift length. SMD
b,l : time blocks in l length shift b. dMDb : staffing demands per each time
blocks driven by 70%–80% utilization target. pMDb,l : non-overlapped three, 8-hour shifts.
cMD: salary per hour.
The ILP-based staffing fulfills staffing demands dkb, the minimum number of required
staff during each time block b. Equation (4.1) is the objective function of the ILP-based
staffing problem. The ILP objective function aims to minimize total staffing costs per day.
min ∑b∈B
∑l∈Lk
∑i∈B
ck · xkb,l,i (4.1)
The objective equation (4.1) is subject to the constraint equations (4.2), (4.3), and (4.4).
First, constraint equation (4.2) enforces that the number of scheduled staff k is always greater
than or equal to the number of required staff k for all time blocks while satisfying a given
staffing pattern. Second, constraint equation (4.3) states that the same number of staff k
43

B: {b0,b1,b2,b3,b4,b5, . . . ,b19,b20,b21,b22,b23}, bi = (i, i+1)LRN : {6,8,12}
SRNb,l :
SRNb0,6 = {b0,b1,b2,b3,b4,b5}, . . . ,
SRNb23,6 = {b23,b0,b1,b2,b3,b4},
SRNb0,8 = {b0,b1,b2,b3,b4,b5,b6,b7}, . . . ,
SRNb23,8 = {b23,b0,b1,b2,b3,b4,b5,b6},
SRNb0,12 = {b0,b1,b2,b3,b4,b5,b6,b7,b8,b9,b10,b11}, . . . ,
SRNb23,12 = {b23,b0,b1,b2,b3,b4,b5,b6,b7,b8,b9,b10}
dRNb :
0
5
10
15
20
25
b₀ b₁ b₂ b₃ b₄ b₅ b₆ b₇ b₈ b₉ b₁₀ b₁₁ b₁₂ b₁₃ b₁₄ b₁₅ b₁₆ b₁₇ b₁₈ b₁₉ b₂₀ b₂₁ b₂₂ b₂₃
pRNb,l : ∀b ∈ B,∀ l ∈ LRN ,pRN
b,l = 1
cMD: USD55/hour
Figure 4.8. Parameter values for RN staffing. B: twenty four time blocks. LRN : 6,8,12-hourshift lengths. SRN
b,l : time blocks in l length shift b. dRNb : staffing demands per each time
blocks driven by 60%–70% utilization target. pRNb,l : three different shift lengths, and the
staffing pattern allows a shift to start at any time. cRN : salary per hour.
members are working in a shift. Last, constraint equation (4.4) assures that a staff k member
is working on only the staff’s shift.
∑b∈B
∑l∈Lk
pkb,l · xk
b,l,i ≥ dki ,∀ i ∈ B (4.2)
xkb,l,i = xk
b,l,j,∀ i ∈ Skb,l,∀ j ∈ Sk
b,l (4.3)
44

i 0 1 2 3 4 5 6 7 8 9 10 11 12 13 14 15 16 17 18 19 20 21 22 23
𝑥 7,8 ,8,𝑖𝑀𝐷 9 9 9 9 9 9 9 9
𝑥 15,16 ,8,𝑖𝑀𝐷 8 8 8 8 8 8 8 8
𝑥 23,0 ,8,𝑖𝑀𝐷 8 8 8 8 8 8 8 8
Figure 4.9. MD staffing solution of Figure 4.7. Three separate shifts, 7–14, 15–22 and 23–6.Each shift has 9, 8 or 8 MDs.
xkb,l,i = 0,∀ i ∈ B\Sk
b,l (4.4)
To illustrate how the ILP works, an MD staffing solution for Figure 4.7 is displayed in
Figure 4.9. There are three separate shifts, 7–14, 15–22 and 23–6. Each shift has 9, 8, or 8
MDs, respectively.
However, the RN staffing solution in Figure 4.10 looks very different from the MD
staffing in Figure 4.9. This is because the ILP parameters for RN staffing in Figure 4.8
allow three different shift lengths, and a shift can start at any time (i.e., overlap in shifts
are allowed). Therefore, RN staffing in Figure 4.10 very closely approximates actual RN
staffing demands dRNb in Figure 4.8. I return to this key point while discussing the results of
actual simulations carried out as the third stage of my simulation-based staffing approach.
45

i 0 1 2 3 4 5 6 7 8 9 10 11 12 13 14 15 16 17 18 19 20 21 22 23
𝑥 0,1 ,8,𝑖𝑅𝑁 2 2 2 2 2 2 2 2
𝑥 1,2 ,8,𝑖𝑅𝑁 1 1 1 1 1 1 1 1
𝑥 7,8 ,6,𝑖𝑅𝑁 3 3 3 3 3 3
𝑥 8,9 ,6,𝑖𝑅𝑁 4 4 4 4 4 4
𝑥 9,10 ,6,𝑖𝑅𝑁 3 3 3 3 3 3
𝑥 10,11 ,12,𝑖𝑅𝑁 4 4 4 4 4 4 4 4 4 4 4 4
𝑥 11,12 ,6,𝑖𝑅𝑁 1 1 1 1 1 1
𝑥 11,12 ,8,𝑖𝑅𝑁 3 3 3 3 3 3 3 3
𝑥 12,13 ,12,𝑖𝑅𝑁 4 4 4 4 4 4 4 4 4 4 4 4
𝑥 13,14 ,12,𝑖𝑅𝑁 4 4 4 4 4 4 4 4 4 4 4 4
𝑥 14,15 ,6,𝑖𝑅𝑁 4 4 4 4 4 4
𝑥 15,16 ,12,𝑖𝑅𝑁 2 2 2 2 2 2 2 2 2 2 2 2
𝑥 19,20 ,12,𝑖𝑅𝑁 3 3 3 3 3 3 3 3 3 3 3 3
𝑥 20,21 ,6,𝑖𝑅𝑁 4 4 4 4 4 4
𝑥 21,22 ,8,𝑖𝑅𝑁 1 1 1 1 1 1 1 1
𝑥 22,23 ,6,𝑖𝑅𝑁 3 3 3 3 3 3
Figure 4.10. RN staffing solution of Figure 4.8. Sixteen overlapped shifts. Shifts havedifferent lengths and start times. Total number of RNs 46 and RNs working hours 392.
46

CHAPTER 5
STATIC ANALYSIS THROUGH PROCESS- ANDRESOURCE-AWARE MODEL CHECKING
My process- and resource-aware discrete-event simulation shows promising results
for the evaluation of diverse resource utilization policies in a flexible manner. However,
dynamic verifications via simulations are inherently unable to exhaustively execute all
possible simulation scenarios. To address this limitation, I develop a novel approach to
analyze resource utilization policies statically based on the use of an existing static analysis
technique.
Static analysis techniques, in general, investigate a system without performing actual
executions to verify whether a system holds a given property. Model checking is a static
analysis technology that has long been used in order to either demonstrate that all possible
executions of a program always adhere to specified properties, or to identify one or more
paths on which a property can be violated. In this past work, the properties were typically
event sequence specifications characterizing program functionality. In this current work, I
have used this technology to statically verify that all simulation executions always adhere to
resource utilization properties. I believe such verifications should increase the credibility of
the results of my simulation studies.
5.1 Resource-Aware Static Analysis
This section describes motivating examples that show the issues of omitting resource
concerns in static analysis and demonstrate how my resource-aware static analysis addresses
the issues. Each example includes a control flow graph. A node in the graph may require
47

A
B C
D
B
C
A,C,D
Control flow Property FSM Resource requests: - B requires r RB - C requires r RC
Resource objects: - RB = {} - RC = {rc1, rc2}
Figure 5.1. An example that shows the difference in verification results between the analysistechnique C and R. C-the property does not hold. R-the property holds.
a resource object to be executed, and a property FSM that specifies the desired sequences
of execution events of the control flow. In a property FSM, a solid circle is an unaccepting
state while a double circle is an accepting state. For purposes of explanation in this section,
I assume there are two static analysis techniques named C and R:
C a static analysis technique that analyzes only a control flow and a property FSM
R a static analysis technique that analyzes a control flow with resource utilization and a
property FSM
Figure 5.1 shows an example that results in the different verification outputs depend on
the consideration of resource utilization in a static analysis. The control flow graph has two
feasible execution traces without considering resource utilization such as A,B,D and A,C,D.
Given the feasible traces, the trace A,B,D is not held by the property FSM. However, the
trace A,B,D is actually infeasible because B node requires r ∈ RB, but RB = {}. Therefore, C
technique analyzes the property does not hold; however, R technique analyzes the property
holds.
The example system in Figure 5.2 results in different verification outputs from Figure 5.1.
Using the analysis technique C, both traces A,B,D and A,C,D in the control flow graph
are held by the property FSM. However, this example system does not have any resource
48

A
B C
D
A
B,C
D
Control flow Property FSM Resource requests: - B requires r RB - C requires r RC
Resource objects: - RB = {} - RC = {}
Figure 5.2. An example that shows the different verification results between the analysistechnique C and R. C-the property holds. R-the property does not hold.
A
B C
D
A
D
B,C
Control flow Property FSM Resource requests: - B requires r1 RB and r2 RC - C requires r1 RB and r2 RC
Resource objects: - RB = {rb1} - RC = {rc1}
Figure 5.3. An example that shows the difference in verification results between the analysistechnique C and R caused by resource deadlock. C-the property holds. R-the property doesnot hold.
objects (RB = {} and RC = {}). Therefore, R technique analyzes the property does not hold
because in that situation both A,B,D and A,C,D are infeasible.
The control flow in Figure 5.3 has two feasible traces A,B,C,D and A,C,B,D assuming
atomicity of all nodes in the control flow without considering resource utilization. Both
A,B,C,D and A,C,B,D are held by the given property using C technique. However, analysis
by R resource-aware static analysis technique reveals that the property does not hold if the
semantic of resource allocations allows the following resource utilization scenario. B node
in the control flow graph requires two resource objects of r1 ∈ RB and r2 ∈ RC. C node
49

also requires two resource objects of r1 ∈ RB and r2 ∈ RC. However, if B acquires rb1 and
C acquires rc1, both B and C nodes are not able to make progress. This trace of resource
deadlock is not held by the property FSM.
In addition to considering functional control events (A, B, C, and D events in this section),
resource events such as resource allocations and releases help analysts specify property
FSMs. My resource-aware static analysis allows analysts to describe the desired utilization
of resources as property FSMs based on using resource events.
5.2 Platform for Process- and Resource-Aware Finite State Verifica-
tion
My static analysis of resource utilization relies on the use of FLAVERS [21]: FLow
Analysis for VERification of Systems. To be specific, I develop my static resource analysis
approach based on FLAVERS/Little-JIL [10] which provides the Little-JIL to BIR (Bandera
Intermediate Representation) [27] translation method. This section describes background
information of FLAVERS and BIR which are relevant to my approach.
5.2.1 FLAVERS: FLow Analysis for VERification of Systems
FLAVERS is a model checking tool that can verify that all executions of a system satisfy
a given property or will report a counterexample scenario that violates the property. This
counterexample helps analysts identify the reason for the violation. FLAVERS requires
three kinds of inputs for verification: a trace flow graph (TFG), a property FSM, and a set
of constraint FSMs. A TFG is a conservative representation of all syntactically-feasible
event execution sequences of a system. A property FSM is a representation of a mechanism
for accepting only desired system event execution sequences. A property FSM has special
acceptance states to check the satisfaction of a property. A constraint FSM is a representation
of a mechanism for identifying when a system event execution sequence violates a specific
50

constraint that causes the sequence to become unacceptable. A constraint FSM has special
trap states to eliminate infeasible execution paths.
Given the three kinds of inputs, FLAVERS uses the state propagation algorithm to verify
whether all the execution paths of the given TFG always satisfy the property FSMs. The
analysis algorithm associates a set of tuples of states in the property FSMs and constraint
FSMs with each event node in the TFG. While propagating the tuples based on events in the
TFG, if a constraint FSM reaches a trap state, a corresponding execution path is excluded
from the analysis searching space. If a property FSM stays in an acceptance state at the end
of state propagation, analysis guarantees the system executions represented in the TFG hold
the property FSM.
Constraint FSMs in FLAVERS allow analysts to refine the entire system model incre-
mentally. TFG is a conservative representation of system executions that includes infeasible
execution paths in a system. Therefore, even though FLAVERS reports a counterexample,
this may not actually occur in real system executions. However, FLAVERS incorporates
constraint FSMs to exclude infeasible paths. This approach helps analysts add complexity
incrementally to analyze the entire system in a tractable manner.
5.2.2 BIR: Bandera Intermediate Representation
BIR is a guarded command language designed to support the translation of Java programs
to a variety of model checkers. FLAVERS/Little-JIL translates Little-JIL specifications to
a BIR program that consists of variable declarations, threads, and predicates. Given the
BIR program, FLAVERS/Little-JIL generates the inputs of FLAVERS to verify Little-JIL
specifications. This section describes BIR features which are relevant to understand my BIR
templates, that encodes resource utilization policies, described in the following sections.
BIR supports seven basic types of variables such as boolean, integer range, enumerated,
locks, arrays, records, and references. Among them, I use boolean and integer range variables
to encode the use of resources. An activity can be started only after necessary resource
51

objects have been allocated. A boolean variable is used to check whether a necessary
resource object is allocated or not. A request is often handled by one of multiple candidate
resource objects. These candidate resource objects are encoded by using an integer range
variable. The integer range variables are also used to enforce resource utilization policies
that restrict an allocation of a specific resource objects.
A BIR program is a single process consist of multiple threads. A thread is a directed
graph with a set of locations and transitions constrained by guard expressions. The thread
structure of a BIR program is determined by a given process specification which includes
various sequencings such as parallels, choices, and exceptions. States of an activity such as
STARTED and COMPLETED are encoded in a single BIR thread. I encode resource utilization
for each activity in an associated thread to the activity. A resource utilization policy often
restricts the use of resources over multiple activities in multiple threads. The enforcement
of the policy is encoded by using global variables that are accessible from multiple threads.
Predicates in a BIR program are named boolean expressions to capture states of the BIR
transition system. I use predicates to test thread locations which are related to resource uti-
lization of the system and a given resource property FSM. A predicate to test thread location
is evaluated to be true when the indicated thread is at the corresponding location. These
predicates are eventually used to generate resource events while FLAVERS is analyzing a
translated trace flow graph.
5.2.3 XPath: XML Path Language
XPath [74] is used to navigate through the elements and attributes in an XML document.
XPath selects a set of nodes through a hierarchic navigation path of a XML document tree.
Path expressions of XPath are similar to the file paths of a traditional computer file system.
For instance, an XPath expression /a/b means that /a selects the a element, then /b selects
all the b elements under the a element in an XML document. I use XPath expressions to
52

Figure 5.4. Little-JIL diagram to illustrate how to use XPath expressions to navigateactivities.
1 <A UID="A_0">2 <B UID="B_1">3 <D UID="D_2">/D>4 <B UID="B_3">5 <D UID="D_4"></D>6 <B UID="B_5"></B>7 </B>8 </B>9 <B UID="B_6">
10 <D UID="D_7"></D>11 <B UID="B_8">12 <D UID="D_9"></D>13 <B UID="B_10"></B>14 </B>15 </B>16 <C UID="C_11">17 <F UID="F_12"></F>18 <G UID="G_13"></G>19 </C>20 </A>
Figure 5.5. XML representation of an unrolled Little-JIL diagram in Figure 5.4. This XMLdocument is used only for purposes of explaining XPath.
navigate through activities in a graphical Little-JIL specification. XPath expressions are
used in specifying a resource property which is described in the following Section 5.3.4.
53

XPath expressionActivities in Figure 5.4(Activities in Figure 5.5)
//*all activities(all activities)
/A/CC activity(C UID="C 11")
/A/B[1]//*all activities under the first occurrence of B activity.(D UID=D 2, B UID=B 3, D UID=D 4 , B UID=B 5)
/A//FF activity(F UID="F 12")
Figure 5.6. XPath expression examples that select activities in Figure 5.4.
.
Figure 5.4 is an example Little-JIL diagram to illustrate how to use XPath expressions
to navigate activities in the specification. XPath expressions for Little-JIL are specified
based on an unrolled Little-JIL structure. In this example, the ? cardinality above the B
activity indicates that there are zero or many B activities having child activities. In addition,
the B reference activity without including child activities represents a recursion to repeat
the D activity. To explain XPath expressions for Little-JIL, I use an XML document which
describes an unrolled Little-JIL structure. Figure 5.5 is an XML document which describes
an unrolled Little-JIL diagram in Figure 5.4 by fixing the ? cardinality to be 2 and repeating
the D activity twice. As can be seen in Figure 5.5, sequencing information in Figure 5.4 is
omitted because the information is not required to distinguish each activity in a Little-JIL
diagram by using XPath. Figure 5.6 shows some example pairs of XPath expression and
a set of selected activities in Figure 5.4 which help to clarify XPath expressions in the
remaining sections.
5.3 Process- and Resource-Aware Model Checking
Figure 5.7 shows the overview of my static resource analysis approach. I extend
the components at Translation part of FLAVERS/Little-JIL. Process Builder cre-
54

Property FSM
Resource Specifications - Resource Characteristics - Resource Requests - Resource Utilization Policies
Process Specifications - Activity Coordination - Artifact Flow
User Input
Process Builder Resource Builder
Resource Utilization Policy Builder
Predicate Creator
BIR template BIR template
BIR program
Characteristics, Requests Policies
Resource Predicate Creator
BIR program
Process Specifications
Translation
TFG Translator Constraint FSM Translator
BIR program w/ resource predicates
Characteristics
Model Checker (FLAVERS)
TFG w/ resource events
Verification Results
Constraint FSMs w/ resource constraints
Verification
Figure 5.7. Overview of static process- and resource-aware model checking approach. Myapproach translates resource specifications into the inputs of FLAVERS.
ates a BIR template for each activity based on given Process Specifications that
include Activity Coordination and Artifact Flow. Process Builder collaborates
with Resource Builder to encode resource allocation and release behaviors into a BIR
template. Resource Builder uses the specifications of Resource Characteristics
and Resource Requests to encode which resource objects must be allocated and released
for a request. Resource Utilization Policy Builder is responsible for extending
a BIR template to enforce resource utilization policies based on the specifications of
Resource Utilization Policies. Predicate Creator creates necessary predicates
to generate events at the Verification phase. Resource Predicate Creator makes
predicates associated with resource events such as resource reservations, assignments, and re-
leases related to Constraint FSMs and Property FSM for a resource property verification.
TFG Translator converts the BIR program to a TFG with resource events for allocations
55

(reservations and assignments) and releases. Constraint FSM Translator generates a
set of constraint FSMs including resource constraints such as resource capacity constraints
based on a BIR program and the specifications of Resource Characteristics. Model
Checker (FLAVERS) takes the TFG and Constraint FSMs as inputs to verify whether the
system specifications satisfy a given Property FSM.
5.3.1 BIR Translation Templates Encoding Resource Utilization
FLAVERS/Little-JIL provides seven BIR template types to encode Little-JIL semantics
such as an activity start, completion, and other activity execution semantics. This section
presents seven new BIR templates by focusing on resource utilization.
5.3.1.1 BIR Template: Single Resource Allocation
Figure 5.8 is a BIR template that encodes resource allocation traces to handle a single
request from an activity. The template takes three parameters: Activity, Query, and
RequestMode. Activity is an activity object which sends a request. Activity information
comes from the specification of activity coordination. A request information described in the
resource request specifications is further decomposed into Query for a required capability
and RequestMode for either reservation or assignment. ResourceVar is an integer range
variable that encodes the number of resource objects which can handle the given request.
The integer range is determined by the specifications of resource characteristics that describe
the number of resource objects and sets of capabilities which resource objects provide. In
this example, ResourceVar can be either 0 or 1 that represents two resource objects can
handle a request (Query and RequestMode) from Activity.
Resource Allocation Traces in Figure 5.8 includes a set of locations and transitions
to encode a single thread transition system for a resource allocation. The first location, loc
Activity Query RequestMode REQUEST encodes that an Activity sends a request of the
Query by RequestMode. After sending a request, the transition system changes its location
from line 1 to line 4 (loc Activity Query RequestMode BRANCH). This transition is a
56

Template Parameters
1 template <Activity, Query, RequestMode>
Resource Variable Declarations
1 /* e.g., two resource objects that can handle Query */2 ResourceVar: range 0..1:= 0;
Resource Allocation Traces
1 loc Activity_Query_RequestMode_REQUEST:2 when true do {} goto Activity_Query_RequestMode_BRANCH;34 loc Activity_Query_RequestMode_BRANCH:5 when true do invisible { ResourceVar := 0; }6 goto Activity_ResourceVar0_RequestMode_ALLOCATE;7 when true do invisible { ResourceVar := 1; }8 goto Activity_ResourceVar1_RequestMode_ALLOCATE;9
10 loc Activity_ResourceVar0_RequestMode_ALLOCATE:11 when true do invisible { }12 goto Activity_Query_RequestMode_ALLOCATED;13 loc Activity_ResourceVar1_RequestMode_ALLOCATE:14 when true do invisible { }15 goto Activity_Query_RequestMode_ALLOCATED;1617 loc Activity_Query_RequestMode_ALLOCATED:18 when true do invisible { } goto /* Activity Start */;
Resource Allocation Events
1 predicates2 (REQUEST,Activity,Query,RequestMode) =3 THREAD@Activity_Query_RequestMode_REQUEST;4 (ALLOCATE,Activity,ResourceVar=0,RequestMode) =5 THREAD@Activity_ResourceVar0_RequestMode_ALLOCATE;6 (ALLOCATE,Activity,ResourceVar=1,RequestMode)=7 THREAD@Activity_ResourceVar1_RequestMode_ALLOCATE;8 (ALLOCATED,Activity,Query,RequestMode)=9 THREAD@tepObject_Query_RequestMode_ALLOCATED;
Figure 5.8. BIR template that handles a single resource allocation request. This exampletemplate assumes two resource objects that can handle Query without user specified resourceutilization policies.
57

visible transition to other threads which is allowed to be interleaved. Actual request handling
times are determined by complex conditions combined with schedule policies and system
contexts, so these resource allocation traces can be interleaved after sending a request. The
other transitions are invisible to other threads which encode the atomicity of actual resource
allocation traces (reservation or assignment). Lines 4-8 encode the ResourceVar value
setting by either 0 or 1 to keep the state of resource allocation for the Activity, then the
transition system changes its locations to loc Activity ResourceVar0 RequestMode -
ALLOCATE or loc Activity ResourceVar1 RequestMode ALLOCATE, respectively. loc
Activity ResourceVar0 RequestMode ALLOCATE represents that a resource object as-
sociated with 0 value has been allocated. Similarly, loc Activity ResourceVar1 -
RequestMode ALLOCATE indicates that a resource object associated with 1 value has been
allocated. Last, as can be seen in Lines 10-15, the transition system changes its location to
loc Activity Query RequestMode ALLOCATED for starting the Activity.
predicates in Figure 5.8 is generated from the Resource Allocation Traces to rec-
ognize resource allocation events such as REQUEST, ALLOCATE, and ALLOCATED events during
the model checking phase. For instance, (REQUEST,Activity,Query,RequestMode) is
evaluated to be true when a THREAD execution reaches to the Activity Query RequestMode -
REQUEST location. Then, FLAVERS eventually recognizes the event (REQUEST,Activity,-
Query,RequestMode) while analyzing a TFG node related to the location Activity Query -
RequestMode REQUEST.
5.3.1.2 BIR Template: Single Resource Release
Figure 5.9 shows a BIR template that releases an allocated resource from an Activity.
The template takes three parameters: Activity, ReleaseQuery, and RequestMode. An
Activity is executed with an allocated resource object. ReleaseQuery requests which
resource object is needed to be released. RequestMode distinguishes the allocated resource
object is either reserved or assigned.
58
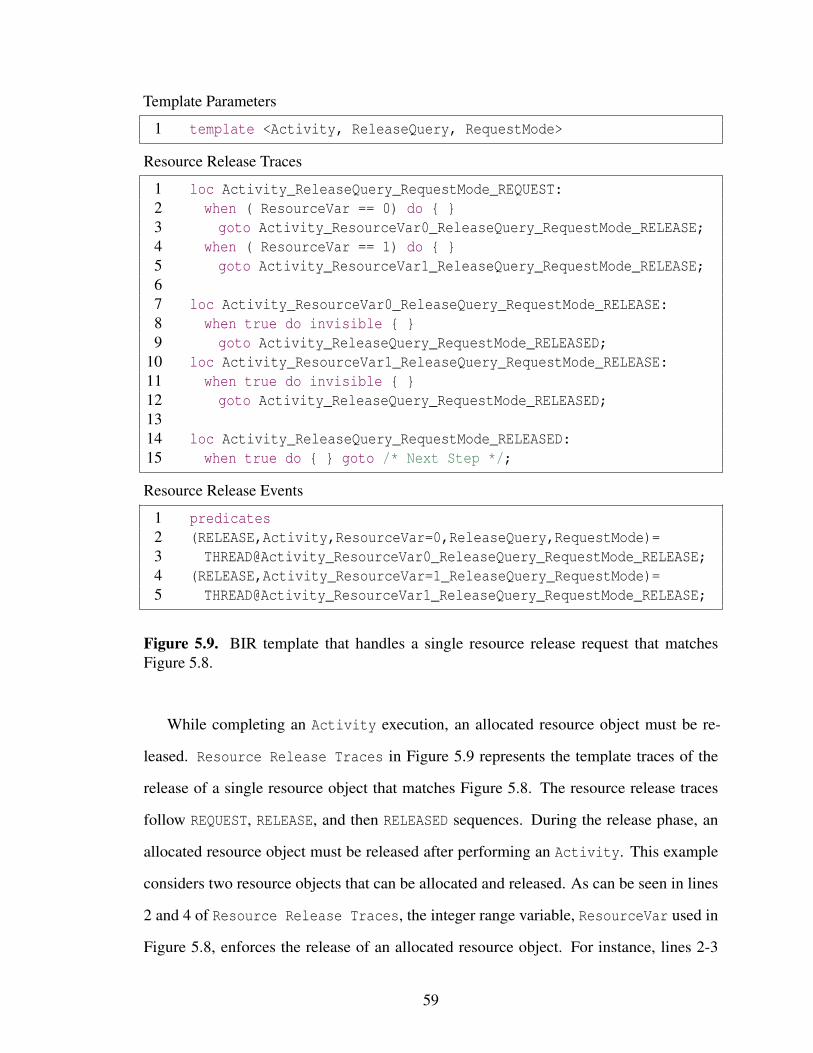
Template Parameters
1 template <Activity, ReleaseQuery, RequestMode>
Resource Release Traces
1 loc Activity_ReleaseQuery_RequestMode_REQUEST:2 when ( ResourceVar == 0) do { }3 goto Activity_ResourceVar0_ReleaseQuery_RequestMode_RELEASE;4 when ( ResourceVar == 1) do { }5 goto Activity_ResourceVar1_ReleaseQuery_RequestMode_RELEASE;67 loc Activity_ResourceVar0_ReleaseQuery_RequestMode_RELEASE:8 when true do invisible { }9 goto Activity_ReleaseQuery_RequestMode_RELEASED;
10 loc Activity_ResourceVar1_ReleaseQuery_RequestMode_RELEASE:11 when true do invisible { }12 goto Activity_ReleaseQuery_RequestMode_RELEASED;1314 loc Activity_ReleaseQuery_RequestMode_RELEASED:15 when true do { } goto /* Next Step */;
Resource Release Events
1 predicates2 (RELEASE,Activity,ResourceVar=0,ReleaseQuery,RequestMode)=3 THREAD@Activity_ResourceVar0_ReleaseQuery_RequestMode_RELEASE;4 (RELEASE,Activity_ResourceVar=1_ReleaseQuery_RequestMode)=5 THREAD@Activity_ResourceVar1_ReleaseQuery_RequestMode_RELEASE;
Figure 5.9. BIR template that handles a single resource release request that matchesFigure 5.8.
While completing an Activity execution, an allocated resource object must be re-
leased. Resource Release Traces in Figure 5.9 represents the template traces of the
release of a single resource object that matches Figure 5.8. The resource release traces
follow REQUEST, RELEASE, and then RELEASED sequences. During the release phase, an
allocated resource object must be released after performing an Activity. This example
considers two resource objects that can be allocated and released. As can be seen in lines
2 and 4 of Resource Release Traces, the integer range variable, ResourceVar used in
Figure 5.8, enforces the release of an allocated resource object. For instance, lines 2-3
59

show that a transition from loc Activity ReleaseQuery RequestMode REQUEST to loc
Activity ResourceVar0 ReleaseQuery RequestMode RELEASE is only possible when
ResourceVar == 0.
Resource Release Events in Figure 5.9 shows when resource release events are hap-
pening while traversing the Resource Release Traces. Unlike with resource allocation
events, resource release events are always handled without being restricted by any policies.
Therefore, the resource analysis requires that the events of actual resource release happenings
as can be seen in the predicates. For instance, (RELEASE, Activity, ResourceVar=0,
ReleaseQuery, RequestMode) event happens when the current location reaches to the
Activity ResourceVar0 ReleaseQuery RequestMode RELEASE.
5.3.1.3 BIR Template: Multiple Resource Allocations
Figure 5.10 is a BIR template that handles multiple resource allocations. This example
template handles two resource allocations by taking of the following five parameters:
Activity, Query0, RequestMode0, Query1, and RequestMode1. The Activity sends the
two requests. Each pair of Query0 and RequestMode0; and Query1 and RequestMode1
encodes a request.
Resource Variable Declarations in Figure 5.10 declares two boolean variables
for encoding states of request handling. For instance, Query0Handled == false denotes
that Query0 is not handled. On the other hand, Query0Handled == true represents that
Query0 is handled.
Resource Allocation Traces in Figure 5.10 shows a part of a transition system that
handles multiple resource allocations. As can be seen in lines 1-4, I serialize two requests
to reduce the complexity of a BIR program. In this example, Query0 is requested first
and then Query1 is requested. Even though I serialize the sequence of sending requests,
it does not enforces the order of actual request handles. An order of request handle is
determined through Lines 6-12 that encode the behavior of fetching requests. If both requets
60

Template Parameters
1 /* E.g., a step object sends two requests */2 template <Activity, Query0, RequestMode0, Query1, RequestMode1>
Resource Variable Declarations
1 Query0Handled: boolean;2 Query1Handled: boolean;
Resource Allocation Traces
1 loc Activity_Query0_RequestMode0_REQUEST:2 when true do { } goto Activity_Query1_RequestMode1;3 loc Activity_Query1_RequestMode1_REQUEST:4 when true do { } goto Activity_REQUEST_FETCH;56 loc Activity_REQUEST_FETCH:7 when (Query0Handled == false)8 do invisible {Query0Handled := true;}9 goto Activity_Query0_RequestMode0_BRANCH;
10 when (Query1Handled == false)11 do invisible {Query1Handled := true;}12 goto Activity_Query1_RequestMode1_BRANCH;1314 loc Activity_Query0_RequestMode0_BRANCH:15 /* Allocate a resource object */16 loc Activity_Query0_RequestMode0_ALLOCATED:17 when true do invisible {} goto Activity_REQUEST_FETCH_LOOP;1819 loc Activity_Query1_RequestMode1_BRANCH:20 /* Allocate a resource object */21 loc Activity_Query1_RequestMode1_ALLOCATED:22 when true do invisible {} goto Activity_REQUEST_FETCH_LOOP;2324 loc Activity_REQUEST_FETCH_LOOP:25 when ((Query0Handled == false) || (Query1Handled == false))26 do { } goto Activity_REQUEST_FETCH;27 when ((Query0Handled == true) && (Query1Handled == true))28 do { } goto /* Activity Start */;
Figure 5.10. BIR template that handles multiple allocation requests. This example templatehandles two allocation requests.
61

Template Parameters
1 template <Activity, ReleaseQuery0, RequestMode0,2 ReleaseQuery1, RequestMode1>
Resource Release Traces
1 loc Activity_ReleaseQuery0_RequestMode0_REQUEST:2 /* Release a resource allocated for Query0 */3 loc Activity_ReleaseQuery0_RequestMode0_RELEASED:4 when true do invisible { }5 goto Activity_ReleaseQuery1_RequestMode1_REQUEST;67 loc Activity_ReleaseQuery1_RequestMode1_REQUEST:8 /* Release a resource allocated for Query1 */9 loc Activity_ReleaseQuery1_RequestMode1_RELEASED:
10 when true do { } goto /* Next Step */;
Figure 5.11. BIR template that handles multiple release requests. This example matcheswith Figure 5.10
haven’t been handled, the BIR statements allow nondeterministic choices of handling either
Query0 or Query1. After fetching a request to handle, lines 14-22 allocate a resource object
for the fetched request. Each resource allocation trace, lines 15 and 20, is described in
Section 5.3.1.1. After handling the fetched request, lines 24-28 determine whether there are
remaining requests to be handled before starting the Activity. The Activity that sends
two requests can start its execution only when the two requests have been properly handled.
The generation of resource allocation events is not different between single and multiple
allocation traces. As can be seen in Figure 5.8, REQUEST, ALLOCATE, and ALLOCATED events
are generated for each request.
5.3.1.4 BIR Template: Multiple Resource Releases
Figure 5.11 shows a BIR template that encodes multiple resource releases. In this
example, an Activity sends two release requests of ReleaseQuery0, RequestMode0 and
ReleaseQuery1, RequestMode1.
62

Resource Release Traces in Figure 5.11 releases two allocated resource objects in
Figure 5.10. As can be seen in the traces, two releases are sequentialized to reduce the
complexity of the entire transition system. The serialization does not influence the analysis
results because a resource manager releases resource objects immediately without being
restricted by any policies. Actual resource release traces at lines 2 and 8 can be found in
Figure 5.9.
Each resource release generates RELEASE event as can be seen in Figure 5.9. This
example generates two RELEASE events when the transition system reaches a location that
actually releases a resource object at either line 2 or 8.
5.3.1.5 BIR Template: Permission Constraint Policy
Figure 5.12 encodes the enforcement of permission constraint policies. An Activity
sends a request (Query, RequestMode). The request can be handled by two candidate
resource objects which are encoded by using an integer range variable, ResourceVar,
in Resource Variable Declarations part. An allocation for the given request by the
two resource objects is determined by two permission constraint policies: PA and PB.
PA.G0 and PB.G0 are guard expressions that are evaluated to be true when the resource
object encoded by the range variable 0 can handle the given request while satisfying
permission constraint policies PA and PB, respectively. Similarly, PA.G1 and PB.G1 are
guard expressions associated with the resource object encoded by 1.
In this example, two permission constraint policies PA and PB must be satisfied while
allocating a resource object. For instance, as can be seen at line 5 in Resource Allocation
Traces, a resource object 0 can handle the given request only when PA.G0 && PB.G0 ==
true.
As can be seen in Figure 5.12, permission constraint policies influence only guards on
transitions, lines 5 and 8. Actual resource allocation and release traces can be found in
Figure 5.8 and Figure 5.9, respectively.
63
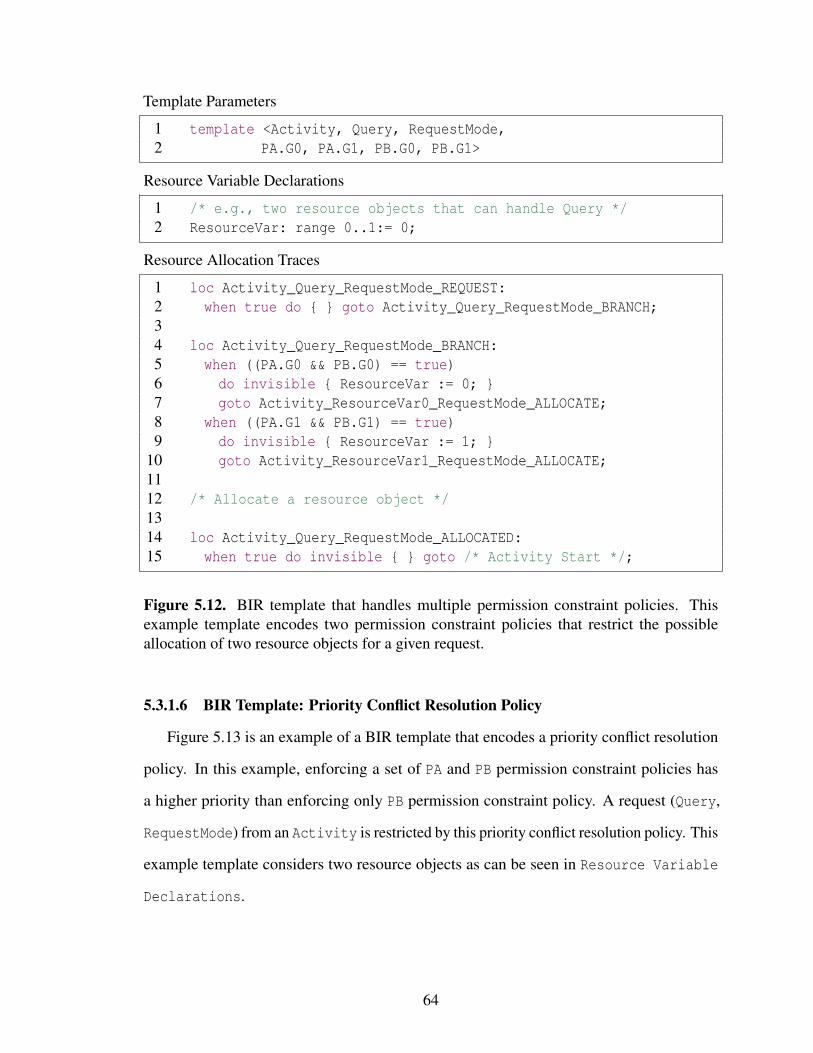
Template Parameters
1 template <Activity, Query, RequestMode,2 PA.G0, PA.G1, PB.G0, PB.G1>
Resource Variable Declarations
1 /* e.g., two resource objects that can handle Query */2 ResourceVar: range 0..1:= 0;
Resource Allocation Traces
1 loc Activity_Query_RequestMode_REQUEST:2 when true do { } goto Activity_Query_RequestMode_BRANCH;34 loc Activity_Query_RequestMode_BRANCH:5 when ((PA.G0 && PB.G0) == true)6 do invisible { ResourceVar := 0; }7 goto Activity_ResourceVar0_RequestMode_ALLOCATE;8 when ((PA.G1 && PB.G1) == true)9 do invisible { ResourceVar := 1; }
10 goto Activity_ResourceVar1_RequestMode_ALLOCATE;1112 /* Allocate a resource object */1314 loc Activity_Query_RequestMode_ALLOCATED:15 when true do invisible { } goto /* Activity Start */;
Figure 5.12. BIR template that handles multiple permission constraint policies. Thisexample template encodes two permission constraint policies that restrict the possibleallocation of two resource objects for a given request.
5.3.1.6 BIR Template: Priority Conflict Resolution Policy
Figure 5.13 is an example of a BIR template that encodes a priority conflict resolution
policy. In this example, enforcing a set of PA and PB permission constraint policies has
a higher priority than enforcing only PB permission constraint policy. A request (Query,
RequestMode) from an Activity is restricted by this priority conflict resolution policy. This
example template considers two resource objects as can be seen in Resource Variable
Declarations.
64

Template Parameters
1 template <Activity, Query, RequestMode,2 PA.G0, PA.G1, PB.G0, PB.G1>
Resource Variable Declarations
1 /* e.g., two resource objects that can handle Query */2 ResourceVar: range 0..1:= 0;
Resource Allocation Traces
1 loc Activity_Query_RequestMode_REQUEST:2 when true do { }3 goto Activity_Query_RequestMode_BRANCH;45 loc Activity_Query_RequestMode_BRANCH:6 when (((PA.G0 && PB.G0)==true)7 || ((((PA.G1 && PB.G1)==false)8 && ((PA.G0 && PB.G0)==false))9 && (PB.G0==true))
10 do invisible { ResourceVar := 0; }11 goto Activity_ResourceVar0_RequestMode;12 when (((PA.G1 && PB.G1)==true)13 || ((((PA.G0 && PB.G0)==false)14 && ((PA.G1 && PB.G1)==false))15 && (PB.G1==true))16 do invisible { ResourceVar := 1; }17 goto Activity_ResourceVar1_RequestMode;1819 /* Allocate a resource object */2021 loc Activity_Query_RequestMode_ALLOCATED:22 when true do invisible { } goto /* Activity Start */;
Figure 5.13. This example BIR template encodes a priority conflict resolution policy. A setof permission constraint policies of PA and PB has higher priority than a set of permissionconstraint policies of PB.
Resource Allocation Traces in Figure 5.13 shows the transitions for the enforce-
ment of a priority conflict resolution policy. For instance, line 6 shows that a resource object
0 can handle the given request if the high prioritized a set of permission constraint policies of
PA and PB are satisfied, PA.G0 && PB.G1 == true. In this example template, the priority
65

conflict resolution policy enforces only the PB permission constraint policy when there are
no candidate resource objects that satisfy both the PA and PB permission constraint poli-
cies. Lines 7-8, ((PA.G1 && PB.G1) == false) && ((PA.G0 && PB.G0) == false),
represents that both resource objects 0 and 1 are not able to satisfy PA and PB together. Then,
line 9 encodes that enforcing only PB permission constraint policy, PB.G0 == true.
5.3.1.7 BIR Template: Case Conflict Resolution Policy
Figure 5.14 shows a BIR template that encodes a case conflict resolution policy. In
this example, a conflict condition of the case conflict resolution policy happens when PA
permission constraint policy is satisfied, but the PB permission constraint policy is not
satisfied. When this conflict condition happens, the case conflict resolution policy enforces
only PB. A request (Query, RequestMode) from the Activity is restricted by this case
conflict resolution policy. As can be seen in Resource Variable Declarations, this
example template considers two resource objects as candidates to handle the given request.
Resource Allocation Traces is a template transition system that enforces the case
conflict resolution policy. For instance, if no conflict happens such as line 6, (PA.G0 &&
PB.G0) == true, 0 resource object can handle the given request. However, if a conflict
happens, the case conflict resolution policy allows the enforcement of only PB. Lines 7-8,
((PA.G1 && PB.G1) == false) && (PA.G0 == true && PB.G0 == false), encode
the specific case of a conflict condition. Given the satisfaction of the condition, line 9 allows
enforcing only PB permission constraint policy.
5.3.2 Trace Flow Graph Encoding Resource Utilization
After generating a BIR program, TFG Translator in Figure 5.7 translates the BIR
program to a TFG for FLAVERS. FLAVERS/Little-JIL already provides the BIR to TFG
translator. Therefore, this section describes some examples to illustrate how the BIR
templates in Section 5.3.1 are translated to TFGs. The generated TFG varies depending
on various optimization techniques provided by FLAVERS/Little-JIL such as the variable
66

Template Parameters
1 template <Activity, Query, RequestMode,2 PA.G0, PA.G1, PB.G0, PB.G1>
Resource Variable Declarations
1 /* e.g., two resource objects that can handle Query */2 ResourceVar: range 0..1:= 0;
Resource Allocation Traces
1 loc Activity_Query_RequestMode_REQUEST:2 when true do { }3 goto Activity_Query_RequestMode_BRANCH;45 loc Activity_Query_RequestMode_BRANCH:6 when (((PA.G0 && PB.G0)==true)7 || ((((PA.G1 && PB.G1)==false)8 && (PA.G0==true && PB.G0==false))9 && (PB.G0==true))
10 do invisible { ResourceVar := 0; }11 goto Activity_ResourceVar0_RequestMode;12 when (((PA.G1 && PB.G1)==true)13 || ((((PA.G0 && PB.G0)==false)14 && (PA.G1==true && PB.G1==false))15 && (PB.G1==true))16 do invisible { ResourceVar := 1; }17 goto Activity_ResourceVar1_RequestMode;1819 /* Allocate a resource object */2021 loc Activity_Query_RequestMode_ALLOCATED:22 when true do invisible { } goto /* Activity Start */;
Figure 5.14. This example template encodes a case conflict resolution policy. A conflictcondition is defined when a permission constraint policy PA is satisfied, but PB is notsatisfied. This specific conflict case is resolved by enforcing only PB.
inlining heuristic, partial order reduction, and other optimization algorithms. This section,
however, shows an intuitive translation approach to better explain how a BIR program with
resource utilization is represented by using a TFG.
67

a1
a2
a3 a4
a5 a6
a7
Figure 5.15. BIR to TFG translation: resource allocation BIR template in Figure 5.8.
Figure 5.15 shows how the BIR template of resource allocation transitions in Figure 5.8
is translated into a TFG. Each location that encodes states of resource allocation in the
BIR template is mapped to a unique node in the TFG. In addition, each resource variable
assignment action (e.g., ResourceVar := 0) in the BIR template is also mapped to a unique
node in the TFG because the assignment changes a system state. In this example, either
ResourceVar := 0 or ResourceVar := 1 restricts the feasible resource release traces
(see Figure 5.9).
Figure 5.16 illustrates a transition from the BIR template of resource release transitions
in Figure 5.9 to a TFG. In addition to the mapping from BIR locations to TFG nodes, each
guard condition in the BIR template is also mapped to a unique node in the TFG. For
example, ResourceVar == 0 and ResourceVar == 1 are mapped to two different TFG
nodes. The evaluation of these guard expressions determines resource utilization traces after
the evaluation. Therefore, the guard expressions associated with resource utilization must be
included in a TFG for analyzing resource utilization. For example, if ResourceVar := 0
68

r1
r2 r3
r4 r5
r6
Figure 5.16. BIR to TFG translation: resource release BIR template in Figure 5.9.
in Figure 5.15 is traversed, traces after ResourceVar == 1 in Figure 5.16 must be excluded
from analysis space.
The other templates in Section 5.3.1 are translated into a TFG in a similar way. Spec-
ification of resource utilization policies often generates complex guard expressions in a
BIR program; however, translation from a guard expression in a BIR program to a TFG is
straightforward.
5.3.3 Resource Constraint Finite State Machine
A TFG is a conservative representation that includes infeasible traces. For instance,
assuming the TFG in Figure 5.15 and the TFG in Figure 5.16 are associated with the same
activity, then the resource utilization trace, a1 → a2 → a3 → a5 → a7 → . . .→ r1
→ r3 → r5 → r6, is an infeasible trace because ResourceVar := 0 at a3 is executed in
this example trace, but ResourceVar == 1 at r3 is evaluated to be false. These infeasible
traces in a TFG are excluded from the analysis searching space in FLAVERS by using
a set of constraint finite state machines. Constraint FSM Translator in Figure 5.7
generates constraint FSMs to exclude infeasible resource utilization traces in a BIR program.
FLAVERS/Little-JIL provides the Constraint FSM Translator component, but I extend
69

0 1
violation
ResourceVar := 1
ResourceVar := 0
ResourceVar <= 0 ResourceVar == 0 ResourceVar >= 0 ResourceVar != 1 ResourceVar <= 1 ResourceVar < 1 ResourceVar := 0
ResourceVar != 0 ResourceVar >= 0 ResourceVar <= 1 ResourceVar == 1 ResourceVar >= 1 ResourceVar > 0 ResourceVar := 1
ResourceVar != 0 ResourceVar == 1 ResourceVar >= 1 ResourceVar > 0
ResourceVar <= 0 ResourceVar == 0 ResourceVar != 1 ResourceVar < 1
Figure 5.17. Constraint FSM associated with the integer range variable (ResourceVar:range 0..1) to reference two resource objects.
the component to enforce resource capacity constraints. This section focuses on describing
constraint FSMs related to excluding infeasible resource utilization traces and enforcing
resource capacity constraints.
Figure 5.17 shows a constraint FSM that restricts valid expressions at each state re-
lated to ResourceVar: range 0..1 integer range variable such as ResourceVar <= 0,
ResourceVar == 0, and other expressions. The constraint FSM has three states: 0, 1, and
violation. 0 and 1 states represent the value of ResourceVar variables. State violation
represents a trap which means all expressions are invalid at the violation state. This
constraint FSM is used to enforce resource allocation-release matching and resource utiliza-
tion policies. For instance, a trace a1 → a2 → a3 → a5 → a7 → . . .→ r1 → r3
→ r5 → r6 in Figure 5.15 and Figure 5.16 is determined to be an infeasible trace. a3
70

false true
violation
Query0Handled := true
Query0Handled := false
Query0Handled == false Query0Handled != true Query0Handled := false
Query0Handled == true Query0Handled != false Query0Handled := true
Query0Handled == true Query0Handled != false
Query0Handled == false Query0Handled != true
Figure 5.18. Constraint FSM that excludes infeasible traces of handling multiple requestsfrom an activity.
generates ResourceVar := 0 event, so the event triggers staying in 0 state. However, r3
generates ResourceVar == 1, then the event triggers the transition from 0 to violation
state. FLAVERS uses the violation state to determine whether a trace is infeasible or
not. Concerning resource utilization policies, as can be seen in Figure 5.12, 5.13, and
5.14, resource utilization policies are encoded by using guard expressions in a BIR program.
Thus, constraint FSMs similar to Figure 5.17 is generated to enforce the specified resource
utilization policies.
Figure 5.18 shows a constraint FSM that enforces valid sequences of handling multiple
requests from an activity. The constraint FSM has three states: false, true, and violation.
false and true states represent the value of the Query0Handled boolean variable. As can
be seen in Figure 5.10, Query0Handled variable is used to keep distinguishing whether
the Query0 request is handled or not while handling multiple requests. For instance, if
Query0Handled is updated as true at the line 8 in Figure 5.10, the constraint FSM changes
its state from false to true. Then, a trace that revisits the line 8 is infeasible because
Query0Handled == false at line 7 changes the constraint FSM’s state from true to
71

1 0 violation
(RELEASE,Activity,ResourceVar=0,ReleaseQuery,RequestMode) … other release events …
(RELEASE,Activity,ResourceVar=0,ReleaseQuery,RequestMode) … other release events …
(ALLOCATE,Activity,ResourceVar=0,RequestMode) … other allocation events …
(ALLOCATE,Activity,ResourceVar=0,RequestMode) … other allocation events …
Figure 5.19. Template constraint FSM that excludes infeasible resource utilization tracesthat violate resource capacity constraints.
false. Similar constraint FSMs are generated to handle each request when an activity
requires multiple resources.
A resource object has capacity limits for handling multiple reservation and assignment
requests and spends a certain amount of effort while providing capabilities. This capacity
constraint of a resource object is encoded by using a resource capacity constraint FSM.
To generate the constraint FSM, Constraint FSM Translator takes a specification of
resource characteristics and a BIR program. The capacity constraint is specified in a
specification of resource characteristics (see Section 3.1). A BIR program includes the
information of resource allocation and release events. The creation of a resource constraint
FSM is straightforward, but it assumes static capacity and effort-needed values because
FLAVERS supports finite state verification.
Figure 5.19 shows a template of a resource capacity constraint FSM assuming a resource
object has the capacity limit of 1 for the RequestMode of either reservation or assignment,
and spends 1 amount of effort in providing a requested capability from the Activity. 1 and
0 states represent the remaining capacity of a resource object. violation state is a trap
state to test the feasibility of allocation and release event traces. Transitions between the
72
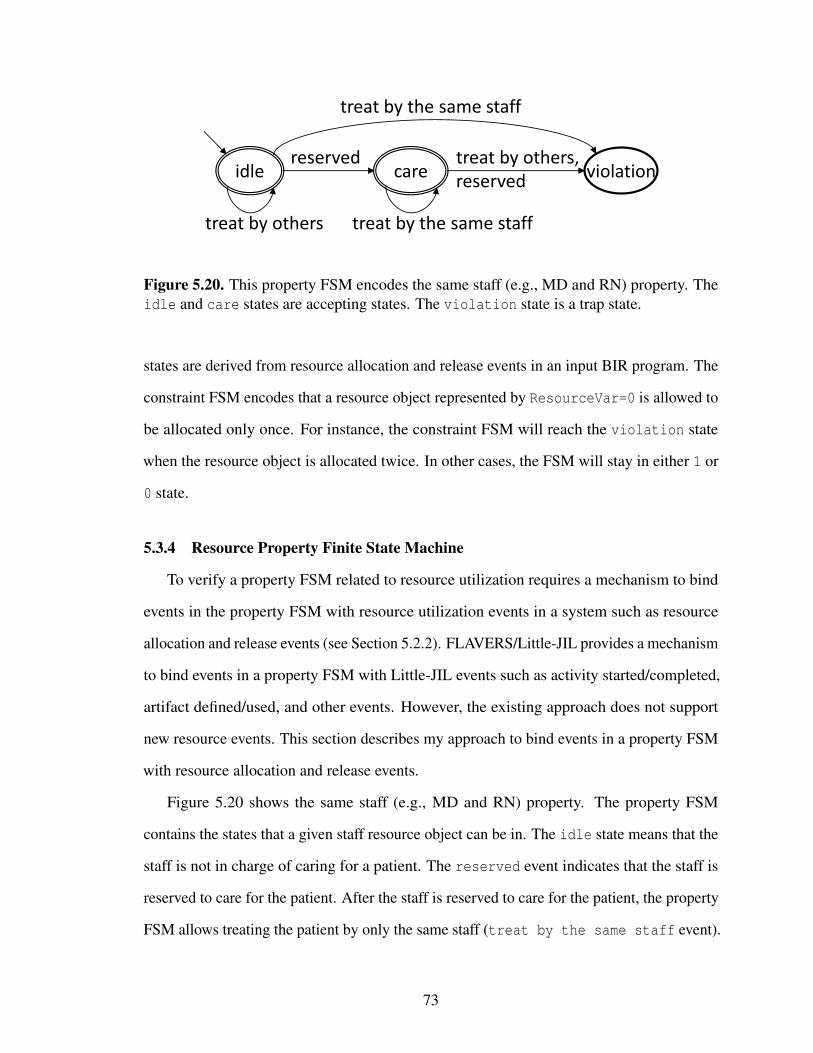
idle violation care reserved
treat by the same staff
treat by others, reserved
treat by others
treat by the same staff
Figure 5.20. This property FSM encodes the same staff (e.g., MD and RN) property. Theidle and care states are accepting states. The violation state is a trap state.
states are derived from resource allocation and release events in an input BIR program. The
constraint FSM encodes that a resource object represented by ResourceVar=0 is allowed to
be allocated only once. For instance, the constraint FSM will reach the violation state
when the resource object is allocated twice. In other cases, the FSM will stay in either 1 or
0 state.
5.3.4 Resource Property Finite State Machine
To verify a property FSM related to resource utilization requires a mechanism to bind
events in the property FSM with resource utilization events in a system such as resource
allocation and release events (see Section 5.2.2). FLAVERS/Little-JIL provides a mechanism
to bind events in a property FSM with Little-JIL events such as activity started/completed,
artifact defined/used, and other events. However, the existing approach does not support
new resource events. This section describes my approach to bind events in a property FSM
with resource allocation and release events.
Figure 5.20 shows the same staff (e.g., MD and RN) property. The property FSM
contains the states that a given staff resource object can be in. The idle state means that the
staff is not in charge of caring for a patient. The reserved event indicates that the staff is
reserved to care for the patient. After the staff is reserved to care for the patient, the property
FSM allows treating the patient by only the same staff (treat by the same staff event).
73

If the patient is cared for by another staff, the property FSM reaches the violation state
which indicates a violation of the same staff property.
For FLAVERS verification, the events in the property FSM (e.g., treat by the same
staff) are matched to the nodes in the TFG that represent resource utilization such as
resource allocations or releases. To select a set of resource utilization events by users, I
provide the following six resource event templates:
• request reserve(resource object, XPath expression): a set of resource reserva-
tion request events that are associated with the requests of a resource object from
activities pointed by an XPath expression.
• request assign(resource object, XPath expression): a set of resource assign-
ment request events that are associated with the requests of a resource object from
activities pointed by an XPath expression.
• reserve(resource object, XPath expression): a set of resource reservation events
that are associated with the reservations of a resource object to perform activities
pointed by an XPath expression.
• assign(resource object, XPath expression): a set of resource assignment events
that are associated with the assignments of a resource object to perform activities
pointed by an XPath expression.
• release reserved(resource object, XPath expression): a set of resource release
events that are associated with the releases of a reserved resource object from
activities pointed by an XPath expression.
• release assigned(resource object, XPath expression): a set of resource release
events that are associated with the releases of a assigned resource object from
activities pointed by an XPath expression.
For instance, Figure 5.21 shows an example of resource event binding for the prop-
erty FSM in Figure 5.20. The reserved event is associated with a set of resource reservation
events by reserve(md0, /ED//InsideED[1]). The reserve(md0, /ED//InsideED[1])
74

Event name Resource event binding
reserved reserve(md0, /ED//InsideED[1])treat by the same staff assign(md0, /ED/InsideED[1]//*)
treat by othersassign(md1, /ED//InsideED[1]//*),assign(md2, /ED//InsideED[1]//*)
Figure 5.21. An example of resource event binding for the same MD property assumingthree MD resource objects (md0, md1, and md2). The event names are declared in Figure 5.20
.
represent a resource reservation event that happens when the md0 is reserved to perform the
InsideED activity to care for the first patient. Figure 5.22 shows which activity is pointed
by /ED//InsideED[1]. After the reservation, only the same md0 is allowed to care for
the first patient. Therefore, the treat by the same staff event is mapped to a set of
resource assignment events by assign(md0, /ED//InsideED[1]//*). As can be seen
in Figure 5.22, the /ED//InsideED[1]//* selects a set of activities which cares for the
first patient under the InsideED activity. The treat by others event is mapped to a set
of resource assignment events associated with md1 and md2. Similarly, users can bind RN
resource objects to verify the same RN property.
5.3.5 Reachability Analysis for Resource Utilization
Even though property FSM verifications using FLAVERS is applicable to verify a variety
kinds of resource related properties, system analysts require additional analyses to achieve
sound resource utilization which are free from resource leaks, resource deadlocks, and
conflicts between policies of resource utilization. FLAVERS uses the state propagation
algorithm to verify a property FSM with a TFG and a set of constraint FSMs. For instance,
while FLAVERS propagates states, a trace that causes a resource deadlock is deleted
from analysis searching space because the trace violates the resource capacity constraints.
To be specific, if both two concurrent activities, A and B, require two resource objects,
r0 and r1, this system has a resource deadlock problem assuming both r0 and r1 are
75

…
…
…
Overall ED process structure (Little-JIL) XPath expressions
/ED//InsideED[1]
/ED//InsideED[1]//*
Figure 5.22. Overall ED process structure of Little-JIL and XPath expressions.
allowed to be assigned once at most. For example, if r0 resource object is assigned
to A activity and r1 resource object is assigned to B activity, A waits to acquire r1 and
B waits to acquire r0. While FLAVERS analyzes the system, for instance, all traces
after assign r0 to A→ assign r1 to B are deleted because they violates the resource
capacity constraints. Therefore, the problem traces are not captured at the end of state
propagation when FLAVERS tests the property satisfaction. I utilize a node-tuple graph of
FLAVERS to facilitate reachability analysis for the verification of the soundness of resource
utilization: free from resource leaks, resource deadlocks, and conflicts between policies.
FLAVERS/Little-JIL generates a node-tuple graph for purposes of detailed examination
of analysis. A node-tuple graph is a representation of how FLAVERS propagates states asso-
ciated with a property FSM and constraint FSMS while traversing a given TFG. Therefore,
the node-tuple graph presents all the possible state changes of a system. Each vertex in the
graph represents a unique state combination in a property FSM, a set of constraint FSMs,
76

…
request r0 for A
request r1 for A
request r0 for B
request r1 for B
L
assign r0 to A
assign r1 to B
…
…
…
Figure 5.23. A node-tuple graph example: each vertex is associated with a unique statecombination in a property FSM, a set of constraint FSMs, and a TFG node. Edges representfeasible state transitions.
and a TFG node. Edges in the graph represent feasible state transitions. Given the node-tuple
graph, I associate resource events with relevant vertices in the graph. Given the association,
I provide a reachability analysis for a pair (e1,e2) of two resource events representing e1
must be followed by e2. Resource leaks can be analyzed by using a pair of allocation and
release events. For instance, if the md0 resource object is assigned to the activity MDCkCT,
the release event of md0 from MDCkCT must be followed. Resource deadlocks and conflicts
between policies can be found by a pair of resource request and allocation events because
both problems cause failures in resource allocation after requesting resources.
Figure 5.23 shows an example of a node-tuple graph. The trace to L vertex in Figure 5.23
is not reached to the end node of the node-tuple graph. This means that all the following
states from the L state is infeasible. This kind of partially feasible trace is captured in a node-
tuple graph that allows the analysis of problematic resource utilization. As can be seen in
77

Figure 5.23, all the resource request events are not followed by related resource assignment
events (see request r1 for A is not followed by assign r1 to A). The problem trace
can occur for various reasons such as resource deadlocks or conflict between policies. A
counterexample trace that violates the matching between request and assign events helps
users figure out the reason for the problem trace.
78

CHAPTER 6
EVALUATION
I evaluate my framework of resource utilization policy specification and analysis through
a case study applying the framework to a patient care system in a hospital ED. The evaluation
aims to test the following main hypothesis:
Main hypothesis: Separated resource utilization policy concerns in the specification
and analysis framework helps design sound resource management decisions in human-
intensive systems.
This main hypothesis of my framework will be tested through several decomposed
secondary hypotheses (described in the remaining sections) related to specification, process-
and resource-aware discrete-event simulation and process- and resource-aware finite state
verification. My evaluations show feasibility and effectiveness of my framework of resource
utilization policy specification and analysis.
6.1 Resource ModelingSecondary hypothesis 1: Separation of resource utilization policy concerns allows
specifying complex resource management constraints in a manageable manner.
A real-world hospital ED governs diverse and complex resource utilization policies to
achieve high quality patient care. Therefore, proper specification of the hospital resource
utilization policies is essential to reflect important real-world resource utilization policies.
In addition, flexible changes in resource utilization policies by simple modification of
specifications are required to expedite the evaluation of the effects of diverse alternatives of
79

resource utilization policies. Through my evaluations, I test the above secondary hypothesis
through qualitative comparisons with other approaches. In addition, Section 6.2 also
demonstrates the flexibility of my resource modeling approach through the evaluations of
various staffing options.
6.1.1 Patient Care Model Comparison
Patient care processes in a hospital ED have been widely studied by using analytical
approaches [13, 23, 35]. Many analytical approaches address scheduling problems in a
hospital ED. Green et al. [23] develop a method to create staffing with the consideration of
varying patient arrival rates, focusing on the lag between patient arrival and start of treatment
by using queuing models. Cochran et al. [13] provide a method for the capacity planning
of beds and staff resources. Li et al. [35] develop an analytical framework and suggest
redistributing resources to mitigate bottlenecks. These analytical approaches are attractive
because of closed form expressions can be relatively easy to calculate; however, most of
these studies simplify ED care processes considerably without incorporating key hospital
resource utilization policies such as the same doctor policy.
To compensate the limitations of creating reasonably complete and detailed analytical
models, discrete-event simulations are widely used to analyze the patient care processes [8,
69, 76]. Wang et al. [69] use a simulation model to identify potential changes to reduce
patients’ length of stay such as combining registration with triage, adding float nurses, and
so on. Zeng et al. [76] use a simulation model to study the ED of a community hospital
and suggest that a team nursing policy can significantly improve ED efficiency. Brenner
et al. [8] use simulations to identify bottlenecks and investigate the optimal numbers of
staff and equipment resources. In contrast to my work, these simulations still oversimplify
hospital resource utilization policies. For instance, none of these simulation studies include
the handoff policy.
80

Asssess by r {md0, md1, md2, md3, md4, md5}
Treat by r
Patient arrivals
(a) Without Handoff
Patient arrivals
Asssess1 by r {md0, md1}
Asssess2 by r {md2, md3}
Asssess3 by r {md4, md5}
Treat1 by r
Treat2 by r {md2, md3}
Treat3 by r {md4, md5}
Treat4 by r
Treat5 by r {md0, md1}
Treat6 by r {md4, md5}
Treat7 by r
Treat8 by r {md0, md1}
Treat9 by r {md2, md3}
t [0, 8)
t [8, 16)
t [16, 24)
t [0, 8)
t [8, 16)
t [16, 24)
t [8, 16)
t [0, 8)
t [16, 24)
t [16, 24)
t [0, 8)
t [8, 16)
(b) With Handoff
Figure 6.1. Partial patient care process model by using Arena which incorporates six MDsworking in three separate 8-hour shifts. (a) The shift and same doctor policies are included.(b) The shift, same doctor, and handoff policies are included.
Arena discrete-event simulation tool [54] is widely used to study patient care processes
in a hospital ED [3, 6, 20]. Figure 6.1 presents how the handoff policy increases complexity
in a patient care model using Arena. I built the model based on advice from a professor who
teaches Arena in his class and referenced an ED model in [6]. Arena uses a resource module
to specify resources in a system. Resources can be grouped together as a set of resources
(see {md0,md1, md2, md3, md4, md5} in Figure 6.1). These resources are allocated and
released by using process modules (rectangular box in Figure 6.1). At first, to support
the same doctor policy, for instance, I use an attribute named r associated with a patient
81

arrival in Figure 6.1(a). Assess activity is performed by a resource r which is one of the six
resources. To enforce the Treat activity to be performed by the same doctor who performs
the Assess activity, I specifically allocate the r resource to perform the Treat activity.
Second, I use a schedule module to specify the shift policy. A resource has a capacity which
determines the number of resource units. The capacity can be varied over a simulation run
by using a schedule module. A schedule module adjusts the capacity of a resource for a
given period of time. By using a schedule model, I can specify three separate shifts for each
resource (for instance, md0 and md1 work from 0 to 8 hours, md2 and md3 work from 8 to 16
hours, and md4 and md5 work from 16 to 24 hours a day). However, if availability depends
on the resource’s own characteristics, the resource model of Arena seems unsuitable to
specify this dependency because the resource module hasn’t been abstracted to characterize
a resource in general. For example, a doctor working in the fast-track cannot care for a
patient in the main-track. In addition, if the doctor moves to the main-track to help resolve a
crowded condition in the main-track, the doctor then becomes available to care for patients
only in the main-track. Last, Arena has difficulties specifying a conflict resolution among
multiple resource utilization policies. As can be seen in Figure 6.1(b), handoff logic is
embedded in the process model. For instance, when a patient arrives at 7.9 time (t ∈ [0,8)),
Assess1 is performed and r associated with a patient arrival is used to enforce the same
doctor policy. After Assess1, if the time becomes 8.1, the patient treated by r resource
must be handed over to another doctor. Then, Treat2 is executed to handle this handoff. In
addition, Arena supports schedule policies by adjusting patient queues that are associated
with each process module; however, if an administrator wants to change the constraints
from sickest-first to heuristic-based, entire patient queues have to be changed to support this
single change.
Many other simulation tools are used to study patient care processes such as SAS Simu-
lation Studio [56], SimEvents/Matlab [40], FlexSim [22], Simio [60], and ProModel [49].
In general, these simulation systems specify a resource as stationary or mobile resources
82

which are embedded in their process model. None of these simulation systems abstract
out resource management concerns which facilitates flexible support of complex resource
utilization policies as I did.
Static analysis techniques are also widely used in many application domains. However, to
the best of my knowledge, none of this previous work has been applied to study patient care
processes in a hospital ED. Li et al. [34] provide a resource constraints analysis approach for
process specifications. They classify resources into two types: shared and private resources.
They detect a potential resource contention by using resource dependency and reachability
information. Wang et al. [68] introduce resource-constrained process model as well as a
resource capacity analysis approach. They formally define resources and their participation
such as resource consumption for starting a task and resource production after executing a
task. In contrast to my approach, these previous studies have difficulties in specifying and
analyzing complex resource utilization policies. These prior static analyses have focused on
only a specific resource utilization problem such as resource contention and capacity limits
based on relatively simplified resource models.
6.2 Process- and Resource-Aware Discrete-Event Simulation
Secondary hypothesis 2: A separated resource management component enables anal-
yses of detailed behaviors of resource participants.
Resource utilization policies are related to other components of a system such as activi-
ties, artifacts, resources and even other resource utilization policies. Therefore, even small
changes in a resource utilization policy may greatly influence executions of the entire system.
Because of the influence of a resource utilization policy, domain experts require sufficient
information to make an efficient and effective resource utilization policy. My evaluations test
whether the detailed simulation traces of resource utilization provides sufficient information
to answer my domain expert’s questions.
83

This section describes how I used my simulation-based scheduling approach to study
the effects of different staffing levels and policies on the operational characteristics of my
example ED. For this work, I used the process model presented in Chapter 4, and the
resource specifications presented in Chapter 3. The ED model includes 2 triage nurses, 5
clerks, 48 beds, 2 x-ray rooms and 4 CT rooms. This ED resource distribution was based
on Baystate Medical Center data. I executed enough simulation replications to obtain 95%
confidence intervals and a half-width within 2% of the mean of staff utilizations. For each
replication, I simulated 72 hours of ED operations, using only the output of the middle
24-hours in my analysis to ensure that each replication had adequate amounts of warm-up
and wind-down times, but that these times did not influence my mean estimates. I used
Amazon EC2 to create a virtual server (c4.8xlarge type) to run my simulations. The server
instance took about 41 minutes for 100 simulation replications.
In these simulations I measured utilization rates for MDs and RNs, the average patient
LoS, the ED contribution margin, and the impact of staff shift scheduling on the number
of patient handoffs. I defined LoS as the time from a patient’s arrival to departure, and ED
contribution margin as the total revenue (using Medicare reimbursement levels) derived
from treating all patients in the simulated 24-hour period minus costs for staffing, supplies,
and medications.
I begin by presenting results of the staffing demands algorithm, which yields the number
of MDs and RNs needed in each hour of the day to ensure that utilization falls in a pre-
specified range. I tested this algorithm for various combinations of MD and RN utilization
levels suggested by my domain expert. Figure 6.2 shows some example results where I have
assumed that staffing levels can change every hour as needed, allowing shifts to be as short
as one hour, but assuring that the number of MDs and RNs is equal exactly to the results
produced by the staffing demands algorithm.
Figure 6.3 compares LoS for a number of different combinations of staff utilization
levels. The figure uses a gray band to indicate average LoS that lies between 130%-140% of
84

0
5
10
15
20
25
30
35
0 1 2 3 4 5 6 7 8 9 10 11 12 13 14 15 16 17 18 19 20 21 22 23
(a) MD 50%-60%,RN 50%-60%
0
5
10
15
20
25
30
35
0 1 2 3 4 5 6 7 8 9 10 11 12 13 14 15 16 17 18 19 20 21 22 23
(b) MD 70%-80%,RN 70%-80%
Figure 6.2. MD and RN staffing demands curves using the staffing demands algorithm inFigure 4.5. For example, (a) is MD and RN staffing demands curves when MD’s and RN’slower and upper utilization limits are set as 50% and 60%, respectively. I omitted othercombinations of resource utilization ranges for exposition.
the minimum possible value (116 minutes). The average LoS range as determined by my
domain expert’s expertise is used as an objective for staff scheduling. I define the minimum
average LoS based on ignoring all wait times caused by resource contention problems (i.e.,
assuming infinite supply of resources). The calculation of the minimum average LoS is
straightforward by using the static process structure and steps’ execution times of my ED
model. The Figure shows that four staffing solutions, MD(50%–60%) RN(70%–80%),
MD(60%–70%) RN(70%–80%), MD(70%–80%) RN(50%–60%), and MD(70%–80%)
RN(60%–70%), satisfy that LoS objective. Among them, MD(70%–80%) RN(60%–70%)
staffing maximizes the contribution margin at 55,113 USD/day.
6.2.1 Impact of Shift Length and Overlap
To consider the impact of shift length and overlap, I ran simulations that allowed RN
shift lengths to be 6, 8 or 12 hours, and compared the effect of prohibiting shifts to overlap
(i.e. start and stop at the same time) to the case where overlap is allowed. Figure 6.4
shows RN staffing solutions output from the ILP-based staffing algorithm in Section 4.3.1.2,
compared to results generated by the staffing demands algorithm. Note that the results
85

Figure 6.3. Simulation results of patient’s LoS, contribution margin according to eachutilization boundary. LoS Requirements is the LoS objective,so that four staffing, MD(50-60) RN(70-80), MD(60-70) RN(70-80), MD(70-80) RN(50-60) and MD(70-80) RN(60-70)satisfy it.
produced by the ILP for a given shift length and overlap constraint are always equal to or
higher than the staffing demands curve.
Figure 6.4(a) and Figure 6.4(c) show that 12-hour shift lengths cannot cover staffing
demands as closely as 8-hour shift lengths, and comparing Figure 6.4(c) to Figure 6.4(a),
shows that overlapping shifts cover the staffing demands curves more closely than non-
overlapping shifts. Figure 6.4(d) shows that staffing with overlapped shifts of 6, 8 or 12-hour
lengths (flexible staffing) is almost indistinguishable from the staffing demands curve itself.
Figure 6.5 shows that average LoS for the different shift length and overlap combinations
does not differ significantly, although Figure 6.5 shows staffing based on 12-hour shift
lengths, with or without overlapped shifts, creates shorter LoS than 6-hour and 8-hour
staffing. This makes intuitive sense because 12-hour shifts allow more RNs to be scheduled
in more hours (see Figure 6.4(c) and Figure 6.4(a)), reducing RN contention and thus
86

0
5
10
15
20
25
30
35
0 1 2 3 4 5 6 7 8 9 10 11 12 13 14 15 16 17 18 19 20 21 22 23
(a) 12-hour shift length, no-overlap
0
5
10
15
20
25
30
35
0 1 2 3 4 5 6 7 8 9 10 11 12 13 14 15 16 17 18 19 20 21 22 23
(b) 8-hour shift length, no-overlap
0
5
10
15
20
25
30
35
0 1 2 3 4 5 6 7 8 9 10 11 12 13 14 15 16 17 18 19 20 21 22 23
(c) 12-hour shift length, overlap
0
5
10
15
20
25
30
35
0 1 2 3 4 5 6 7 8 9 10 11 12 13 14 15 16 17 18 19 20 21 22 23
(d) 6/8/12-hour shift length, overlap
Figure 6.4. ILP solutions of various RN staffing patterns: (a) and (C) 12-hour shiftsdisallowing and allowing shift overlap, respectively; (b) 8-hour shift disallowing shiftoverlap; and (d) allowing for combinations of overlapping 6-, 8-, and 12-hour shifts. Staffsalaries (USD/day): (a) 27,720, (b) 24,640, (c) 27,060 and (d) 21,560. I omitted othercombinations such as 6-hour shifts allowing and disallowing shift overlap for exposition.
reducing patient waiting time. In general, staffing without overlap creates lower LoS than
staffing with overlap. Comparing 1-hour and flexible staffing options in Figure 6.5, flexible
staffing results in longer LoS than 1-hour staffing. This long LoS is caused by the same MD
and RN: the patient will more frequently have to wait to be attended by the same MD and
RN.
Figure 6.6 compares the number of handoffs among various staffing options. Shorter
shifts (especially one-hour shifts) necessitate more handoffs, which should be minimized,
as my domain expert believes they lead to increased errors. Indeed, Figure 6.6 shows that
87

0
20
40
60
80
100
120
140
160
180
200
6-Hour 8-Hour 12-Hour 1-Hour Flexible
Shift Length
Lo
S (
min
ute
s)
No-Overlap Overlap
Figure 6.5. LoS comparison among various staffing
1
2
4
8
16
32
64
128
256
512
1024
2048
6-Hour 8-Hour 12-Hour 1-Hour Flexible
Shift Length
# o
f M
D H
an
do
ffs
No-Overlap Overlap
(a) Number of MD handoffs
1
2
4
8
16
32
64
128
256
512
1024
2048
6-Hour 8-Hour 12-Hour 1-Hour Flexible
Shift Length
# o
f R
N H
an
do
ffs
No-Overlap Overlap
(b) Number of RN handoffs
Figure 6.6. Number of handoffs comparison among various staffing
longer shifts result in fewer handoffs and that 1-hour staffing produces a larger number of
RN handoffs than all other staffing options.
Finally, Figure 6.7 shows mean RN utilization for all the staffing options. It shows that,
because overlapped staffing is closer to the staffing demands curve than staffing without
overlap, overlapping leads to higher utilization. In addition, 6-hour and 8-hour staffing
88

0
10
20
30
40
50
60
70
80
90
100
6-Hour 8-Hour 12-Hour 1-Hour Flexible
Shift Length
MD
Uti
liza
tio
n (
%)
No-Overlap Overlap
(a) MD utilization
0
10
20
30
40
50
60
70
80
90
100
6-Hour 8-Hour 12-Hour 1-Hour Flexible
Shift Length
RN
Uti
liza
tio
n (
%)
No-Overlap Overlap
(b) RN utilization
Figure 6.7. Utilization comparison among various staffing
show subtle differences in utilization, but 12-hour staffing shows lower utilization both for
overlapping and non-overlapped staffing.
6.2.2 Comparison with Baystate Staffing Schedule
Figure 6.8 depicts RN staffing data for Baystate Medical Center (RN(BMC)), while
RN(50-60), RN(60-70) and RN(70-80) represent the RN staffing results obtained from
my scheduling studies. Figure 6.8 compares LoS and contribution margin. As can be seen,
when I set the utilization range to 70% - 80% RN(70-80), the simulation results obtained
are similar to RN(BMC) staffing. Note also that the simulations designed to assure lower staff
utilization levels provide interesting contrasts. For example, LoS is 20 minutes lower in
RN(50-60) but so is the contribution margin.
Figure 6.9, comparing average RN utilizations for a 24-hour day, and their standard
deviations, shows that the variation in RN utilization levels is much lower in staffing results
generated by my approach, and also for the RN(70-80) case, which has approximately the
same average as RN(BMC).
Figure 6.10 provides insight into why RN(BMC) has higher utilization variation compared
to RN(70-80), showing that RNs are underutilized in the less busy hours of the night, but
are overutilized in the busy hours of the afternoon. Higher utilization in these busy hours
implies increased LoS, while low utilization during less busy hours implies that personnel
89

0
10000
20000
30000
40000
50000
60000
0
20
40
60
80
100
120
140
160
180
RN(BMC) RN(50-60) RN(60-70) RN(70-80)
Co
ntr
ibu
tio
n M
arg
in (
US
D/d
ay
)
Lo
S (
min
ute
s)
Contribution Margin LoS
Figure 6.8. Patient’s LoS and contribution margin comparison: RN(BMC) RN staffing ofBaystate Medical Center, RN(50–60) RN staffing derived by utilization limits 50%–60%,RN(60–70) RN staffing derived by utilization limits 60%–70%, and RN(70–80) RN staffingderived by utilization limits 70%–80%
costs are being wasted. However, as can be seen in Figure 6.10, my scheduling approach
creates the improved RN staffing from the perspective of balancing the level of resource
utilization over 24-hour period. The balanced resource utilization is one of the important
goals in hospital resource management which leads to keeping the same quality of patient
care over 24-hour period while optimizing resource utilization.
6.3 Process- and Resource-Aware Model Checking
Secondary hypothesis 3: Formal resource policy specifications allow verifying re-
source properties.
My process- and resource-aware discrete-event simulation provides detailed trace in-
formation about resource utilization to dynamically analyze different resource utilization
policies. However, this dynamic analysis is valid only when the simulations of resource
90

0
1
2
3
4
5
6
7
8
9
10
0
10
20
30
40
50
60
70
80
90
100
RN(BMC) RN(50-60) RN(60-70) RN(70-80)
Sta
nd
ard
Dev
iati
on
(o
ver
24
ho
urs
)
Mea
n (
RN
Uti
liza
tio
ns
ov
er 2
4 h
ou
rs)
Mean Standard Deviation
Figure 6.9. Utilization comparison: RN(BMC) RN staffing of Baystate Medical Center,RN(50–60) RN staffing derived by utilization limits 50%–60%, RN(60–70) RN staffingderived by utilization limits 60%–70%, and RN(70–80) RN staffing derived by utilizationlimits 70%–80%
utilization always adhere to the intended resource utilization policies. Therefore, I test the
above secondary hypothesis to show that the formality of my specification enables analysts
to verify resource properties such as the absence of violations of resource utilization policies
and the absence of deadlock.
Given the entire ED specifications in Chapter 4, this chapter demonstrates how my static
analysis approach verifies the adherence to policies/constraints such as the same doctor
policy, shift policy, and capacity constraints in Section 6.3.1; and finds conflict among
policies or detects a resource deadlock in Section 5.3.5. Last, Section 6.3.3 shows scalability
characteristics of my approach.
6.3.1 Verification of Adherence to Resource Utilization Policy
First, I verified whether the specified patient care processes in an ED satisfy the same
doctor property or not. For this verification, I used three doctors (md0, md1, and md2 all
91

0
10
20
30
40
50
60
70
80
90
100
0 1 2 3 4 5 6 7 8 9 10 11 12 13 14 15 16 17 18 19 20 21 22 23
Uti
liza
tio
n (
%)
Time (hours)
RN Utilization (BMC) RN Utilization (70-80)
Figure 6.10. Utilization comparison over 24 hours a day: RN Utilization(BMC) RNutilization of Baystate Medical Center, RN Utilization(70-80) RN utilization derived byutilization limits 70%–80%
working on the same shift) , one patient, and including only the same doctor policy. Even
though I include only one patient in this verification setting, there are still many possible
cases that can violate the same doctor property such as faults in the specified policies. Given
the same staff property in Figure 5.20, I bound events in the property FSM to concrete
resource utilization events as presented in Figure 5.21. My verification reports that the ED
model always adheres to the same doctor policy.
Second, I verified the adherence to the shift policy in my ED model. To verify the
adherence, I specified the shift property FSM as presented in Figure 6.11. My approach
of using FLAVERS and Little-JIL does not support continuous times. To verify the shift
property which requires time information, I added a timer process into my patient care
processes which generates three discrete time events: time 0, time 8, and time 16.
Figure 6.12 shows a timer process specifying the time progress of (0→ 8→ 16→
0→ . . .). As can be seen in Figure 6.12, the timer process is parallel with the patient care
92

0
violation
8 16 assign 0, time 0
time 8 time 16
assign 8, time 8
assign 16, time 16
time 0
assign 8, assign 16, time 16,
assign 0, assign 16, time 0, assign 0,
assign 8, time 8,
Figure 6.11. This property FSM encodes the shift property assuming there are three discretetime events: time 0, time 8, and time 16.
Figure 6.12. Timer process that generates three discrete time events: time 0, time 8, andtime 16.
processes. This parallel structure allows all possible interleaving executions between the
time progress and sequences of patient care activities. Time events of the shift property FSM
in Figure 6.11 are bound to the associated start events of Time leaf activities in Figure 6.12.
To verify the shift property, I used three MD resource objects: md0, md1, and md2 where
md0 works [0,8) times, md1 works [8,16) times, and md2 works [16,24) times. Thus, as can
be seen in Figure 6.13, assign 0 event, resource assignments at 0 time, is bound to all
resource utilization events of the md0’s assignments to any patient care activities (see //* in
Figure 6.13). Similarly, I mapped assign 8 and assign 16 events to concrete resource
93

Event name Resource event binding
assign 0 assign(md0, //*)assign 8 assign(md1, //*)assign 16 assign(md2, //*)
Figure 6.13. An example of resource event binding for the shift property assuming threeMD resource objects (md0, md1, and md2). The event names are declared in Figure 6.11.
3 2 violation 1 0
reserve reserve reserve
release reserved
reserve
release reserved
release reserved
release reserved
(a) Reservation capacity property FSM
1 0 violation
release assigned
release assigned
assign
assign
(b) Assignment capacity property FSM
Figure 6.14. Doctor’s capacity property FSMs. (a) A doctor can be reserved for threepatients at most. (b) A doctor can care for one patient at the same time.
utilization events. This verification study includes only the shift policy. Based on the shift
verification, I can assure that my ED model always adheres to the shift policy.
Last, I verified my ED model to see whether it always adheres to the capacity constraints.
Since I decompose an allocation into a reservation and assignment, the resource capacity
properties can be specified by using reservation and assignment events as can be seen in
Figure 6.14. Given the event binding in Figure 6.15, Figure 6.14(a) states that a doctor
must not be reserved for more than three patients. Figure 6.14(b) represents that a doctor is
94

Event name Resource event binding
reserve reserve(md0, //*)assign assign(md0, //*)release reserved release reserved(md0, //*)release assigned release assigned(md0, //*)
Figure 6.15. An example of resource event binding for the capacity property of an resourceobject (md0). The event names are declared in Figure 6.14.
allowed to care for only one patient at a time. For the verification of the two properties, I
did not include other policies and I separately verified each patient care process of different
patient acuity level (i.e., acuity level 1, 2, 3, 4, 5, and critical patient care processes) due to
the scalability issues described in Section 6.3.3. For instance, I verified the acuity level 1
patient care process with four patient arrivals and 1 doctor resource object. This verification
reported that the two properties hold.
As can be seen in this section, my approach allows analysts to select which policies to
include in verification. This policy selection capability enables identifying which policies
create a conflict condition while enforcing them together (see Section 6.3.2). In addition, the
policy selection facilitates incremental verifications of resource utilization policies. However,
even though the above verifications demonstrate the feasibility of verifying adherence to
resource utilization policy, their verification settings related to patients, doctors, other
resources, and patient care processes are simpler than the simulation settings because of the
scalability issues (see Section 6.3.3). The scalability issues require further research.
6.3.2 Reachability Analysis
As described in Section 5.3.5, the existing FLAVERS is not able to detect the conflict
problem between multiple policies. For instance, even if I include the shift and same
doctor policies in my ED model, both the shift and same doctor properties still hold when
using FLAVERS because the problem traces are deleted by a set of constraint FSMs. This
95
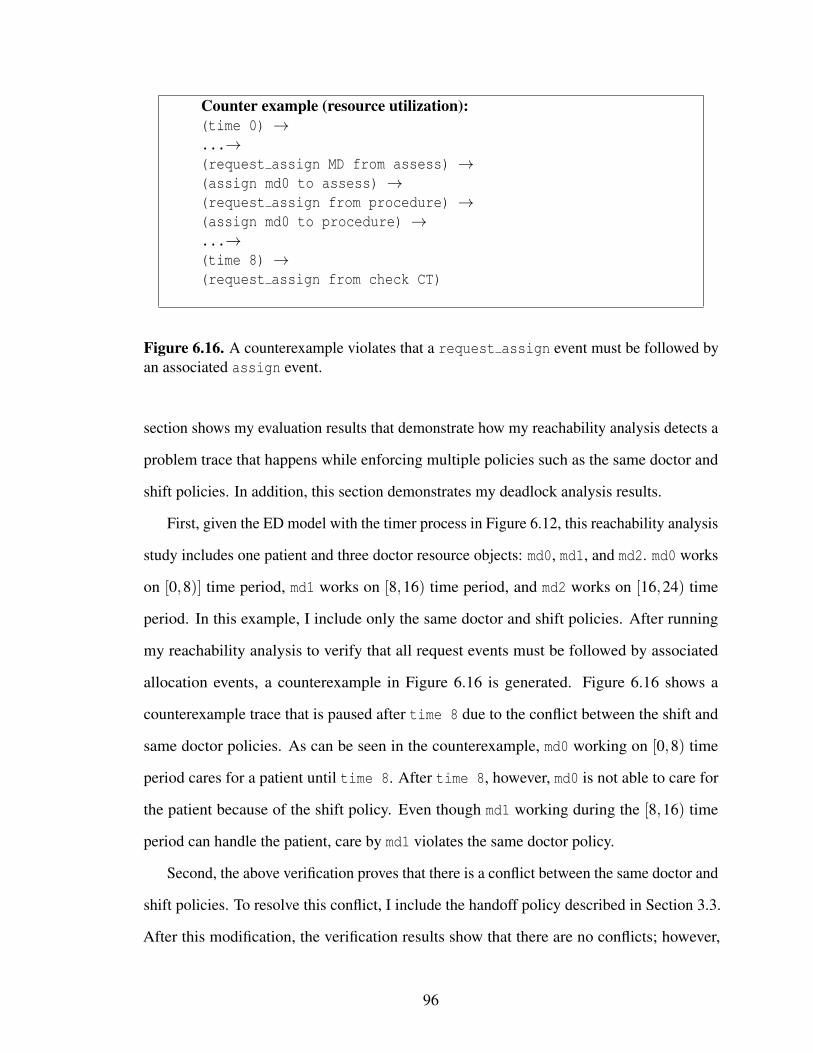
Counter example (resource utilization):(time 0) →...→(request assign MD from assess) →(assign md0 to assess) →(request assign from procedure) →(assign md0 to procedure) →...→(time 8) →(request assign from check CT)
Figure 6.16. A counterexample violates that a request assign event must be followed byan associated assign event.
section shows my evaluation results that demonstrate how my reachability analysis detects a
problem trace that happens while enforcing multiple policies such as the same doctor and
shift policies. In addition, this section demonstrates my deadlock analysis results.
First, given the ED model with the timer process in Figure 6.12, this reachability analysis
study includes one patient and three doctor resource objects: md0, md1, and md2. md0 works
on [0,8)] time period, md1 works on [8,16) time period, and md2 works on [16,24) time
period. In this example, I include only the same doctor and shift policies. After running
my reachability analysis to verify that all request events must be followed by associated
allocation events, a counterexample in Figure 6.16 is generated. Figure 6.16 shows a
counterexample trace that is paused after time 8 due to the conflict between the shift and
same doctor policies. As can be seen in the counterexample, md0 working on [0,8) time
period cares for a patient until time 8. After time 8, however, md0 is not able to care for
the patient because of the shift policy. Even though md1 working during the [8,16) time
period can handle the patient, care by md1 violates the same doctor policy.
Second, the above verification proves that there is a conflict between the same doctor and
shift policies. To resolve this conflict, I include the handoff policy described in Section 3.3.
After this modification, the verification results show that there are no conflicts; however,
96

idle working
violation
shift end
shift start
shift end, assign others
shift start, assign
assign assign others
Figure 6.17. This same staff property represents a medical provider can care for a patientonly during the medical provider’s shift hours.
Event name Resource event binding
assign assign(md0, //*)assign others assign(md1, //*), assign(md2, //*)
Figure 6.18. An example of resource event binding for the same staff property in Fig-ure 6.17.
the same doctor property in Figure 5.20 is violated. This violation is caused by the handoff
policy that allows a situation in which a patient can be cared for by other doctors. I edit the
same doctor property by using shift restriction as presented in Figure 6.17, resource event
bindings in Figure 6.18. shift start and shift end events in Figure 6.17 is bound to
start events of time0 and time8 activities in Figure 6.12. Given this verification setting,
my verification results show that the same doctor and shift properties hold without having a
conflict between the same doctor and shift policies.
Last, based on this reachability analysis, I could find a resource deadlock trace in my
initial version of ED model. When I verified the critical patient care process in my ED model
with two patients, one doctor, and one nurse, a counterexample in Figure 6.19 is generated.
The counterexample trace is stopped after assigning md0 to prepare patient activity to
care for patient 1 and rn0 to prepare patient activity to care for patient 2. Resource
deadlock process in Figure 6.20 is a part of my critical care process which models the
97

Counter example (resource utilization):...→(request assign MD from prepare patient[1]) →(request assign RN from prepare patient[1]) →(assign md0 to prepare patient[1]) →(request assign MD from prepare patient[2]) →(request assign RN from prepare patient[2]) →(assign rn0 to prepare patient[2])
Figure 6.19. A resource deadlock trace in the critical patient care process in my ED model.
Resource deadlock No resource deadlock
Note: PreparePatient requires md0 and rn0
Note: MDPrepare requires md0 RNPrepare requires rn0
Figure 6.20. Two process specification having a resource deadlock problem and not havingthe problem.
preparation of a doctor and nurse for an arriving critical patient. Based on my domain
expert’s guide, I assume a critical patient is arriving by ambulance. While the patient is in
the ambulance, a doctor and nurse are preparing for the arrival (see PreparePatient activity
requires md0 and rn0). In this verification setting, if two patients arrive at the same time,
two PreparePatient activities for each patient can be blocked from waiting to acquire
resources which are held by each other as can be seen in the counterexample. This resource
deadlock problem is unlikely to happen in my simulations because critical patient arrivals
rarely happen in my ED model and the modeled ED has always sufficient doctors and nurses
98

to care for multiple critical patients. However, this resource deadlock problem can still occur
and if so, can influence the simulation results. To avoid the resource deadlock problem,
I decomposed PreparePatient activity into MDPrepare and RNPrepare activities where
each activity requires md0 and rn0, respectively. This modification eliminates the resource
deadlock problem because it does not create a condition of circular resource waiting among
multiple activities. Each of MDPrepare and RNPrepare requires only one resource object to
be executed.
6.3.3 Scalability Characteristics
To test the scalability of my static analysis approach, my verification evaluations were
run on an Amazon EC2 server (c3.8xlarge) with 34 virtual CPUs (2.5GHz) and 60GB
memory. Given the ED model, I ran various verification scenarios by changing the combina-
tions of policies, capacity constraints, the number of patients, and the number of resource
objects/types. Among the verification results, this section includes some experiments that
show the scalability characteristics of my approach. In this section, AL1, AL3, and AL4
stand for the patient care process to care for acuity level 1, 3, and 4 patients, respectively.
Critial stands for the patient care process to care for critical patients. All stands for the
entire patient care processes to care for acuity level 1,2,3,4,5, and critical patients. For the
scalability study, I terminated a verification run if it required more than 2 hours.
Figure 6.22 compares how many patients can be included in a verification setting to
verify each within 2 hours. No policies verification results came from verifications
without any policies. Same MD policy results are derived from verifications including only
the same MD policy. Shift policy verifications were run by including only the shift
policy. Same MD and Shift policies include both the same MD and shift policies in the
verifications. In this example, I included 2 doctor resource objects, did not include capacity
constraint FSMs, and verified the ED completion property in Figure 6.21. As can be seen in
Figure 6.22, there are subtle differences between No policies verifications and Same MD
99

idle started completed started completed
violation completed
started
started,completed
Figure 6.21. This property FSM represents a patient care process must be completed oncestarted. started event is bound to the started event of the root activity of my ED activitymodel. completed event is bound to the completed event of the root activity of my EDactivity model.
14 14
6
4
2
14 14
4 3
2
5 4
3 2 2
6 5
3 2 2
0
2
4
6
8
10
12
14
16
AL1 AL3 AL4 Critical All AL1 AL3 AL4 Critical All AL1 AL3 AL4 Critical All AL1 AL3 AL4 Critical All
No policies Same MD policy Shift policy SameMD and Shift policies
# of Patients
Figure 6.22. Comparison of how many patients can be included in analysis settings whichvary the combination of policies.
policy verifications. However, adding Shift policy significantly worsens the scalability
of handling multiple patients. However, interestingly, adding both Same MD and Shift
policies yields better results of the scalability than only including Shift policy. As can
be seen in Figure 6.23, the TFG size of the Same MD and Shift policies is smaller than
the Shift MD policy. In addition the verification of the Same MD and Shift policies
took 6 minutes which is shorter than the verification time of the Shift policy case, 19.8
minutes. Same MD policy creates dependency between resource allocations to allocate the
same doctor resource object to care for a patient. This dependency provides a better chance
for FLAVERS optimization.
100

No policies Same MD policy ShiftMD policy Same MD and Shift policies
# TFG nodes 304 446 1045 851
# TFG edges 12226 41181 124633 43838
# Tasks 21 21 21 21
# Constraint FSMs (CFSMs) 47 51 48 52
Mean # of States in CFSMs 9 11 25 19
Mean # of Transitions in CFSMs 41 58 200 174
Figure 6.23. Comparison of the sizes of analysis problems associated with verificationswith all processes in Figure 6.22.
ED completion property Shift property
# TFG nodes 1045 1217 # TFG edges 124633 124761 # Tasks 21 21 # Constraint FSMs (CFSMs) 48 48 Mean # of States in CFSMs 25 28 Mean # of Transitions in CFSMs 200 211
Figure 6.24. Comparison of the sizes of analysis problems by only changing propertyFSMs.
Figure 6.24 compares analysis problem sizes between two verification settings that vary
property FSMs (ED completion property and Shift property). For this verification
comparison, I used 2 doctor resource objects and 2 patients with all patient care processes
and only the shift policy (no capacity FSMs). As can be seen in Figure 6.24, there are subtle
differences between the two cases. Therefore, verification times for the two cases are also
similar: 19.8 minutes (ED completion property) and 20 minutes (Shift property).
I found similar results when I compared the verification of ED completion property
with the verification of Same MD property. The similarity in these sizes of the analysis
problems is caused by a resource utilization policy already adding associated resource
utilization complexities such as resource events and constraint FSMs to the analysis problem.
Therefore, verifying a resource property does not significantly worsen scalability.
Figure 6.25 compares the number of patients which can be verified within the 2 hours
verification time limit by configuring capacity constraint FSMs and policies. For this
comparison, I verified the ED completion property with 2 doctor resource objects. As can
be seen in Figure 6.25, adding capacity constraint FSMs worsens the scalability of handling
multiple patients significantly. Capacity constraint FSMs include all resource allocation and
101
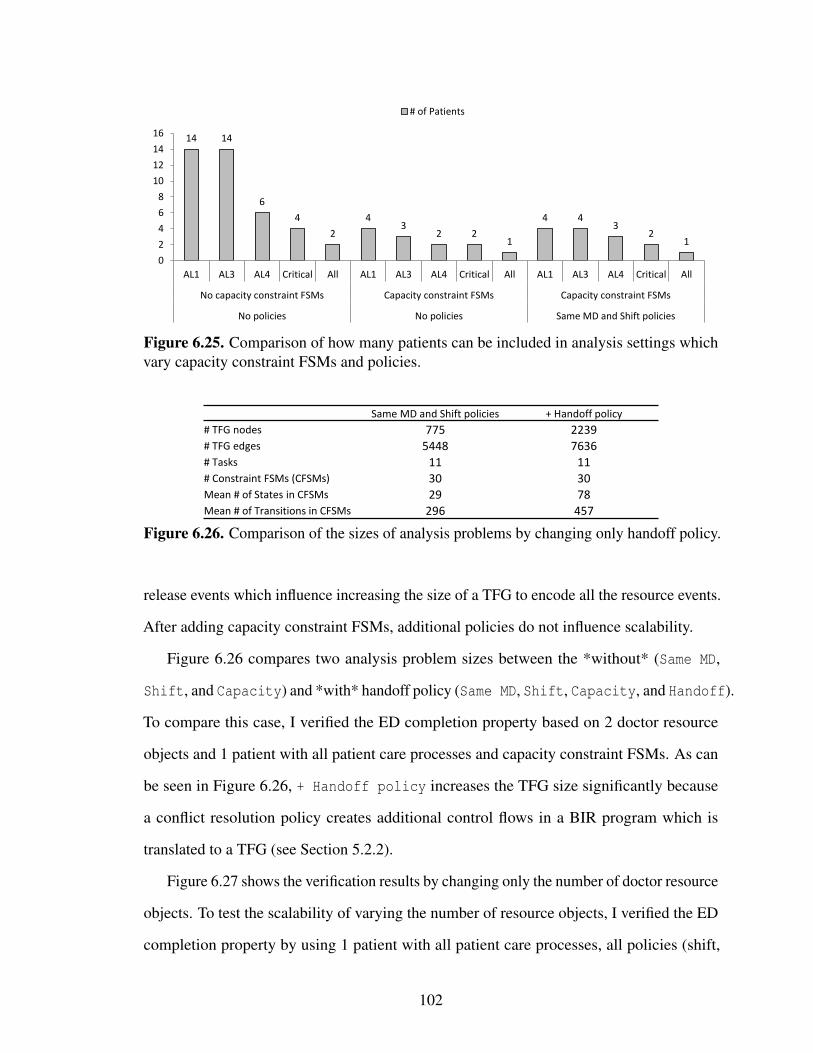
14 14
6
4
2
4 3
2 2 1
4 4 3
2 1
0
2
4
6
8
10
12
14
16
AL1 AL3 AL4 Critical All AL1 AL3 AL4 Critical All AL1 AL3 AL4 Critical All
No capacity constraint FSMs Capacity constraint FSMs Capacity constraint FSMs
No policies No policies Same MD and Shift policies
# of Patients
Figure 6.25. Comparison of how many patients can be included in analysis settings whichvary capacity constraint FSMs and policies.
Same MD and Shift policies + Handoff policy
# TFG nodes 775 2239 # TFG edges 5448 7636 # Tasks 11 11 # Constraint FSMs (CFSMs) 30 30 Mean # of States in CFSMs 29 78 Mean # of Transitions in CFSMs 296 457
Figure 6.26. Comparison of the sizes of analysis problems by changing only handoff policy.
release events which influence increasing the size of a TFG to encode all the resource events.
After adding capacity constraint FSMs, additional policies do not influence scalability.
Figure 6.26 compares two analysis problem sizes between the *without* (Same MD,
Shift, and Capacity) and *with* handoff policy (Same MD, Shift, Capacity, and Handoff).
To compare this case, I verified the ED completion property based on 2 doctor resource
objects and 1 patient with all patient care processes and capacity constraint FSMs. As can
be seen in Figure 6.26, + Handoff policy increases the TFG size significantly because
a conflict resolution policy creates additional control flows in a BIR program which is
translated to a TFG (see Section 5.2.2).
Figure 6.27 shows the verification results by changing only the number of doctor resource
objects. To test the scalability of varying the number of resource objects, I verified the ED
completion property by using 1 patient with all patient care processes, all policies (shift,
102

2255 3043
3931
4925 5851
6827 7657
8665
0
1000
2000
3000
4000
5000
6000
7000
8000
9000
10000
2 3 4 5 6 7 8 9
# of MDs
# TFG nodes
(a) Number of TFG nodes
0.2 0.3 0.4 0.7 1.3 3.7
13.9
81.9
0
10
20
30
40
50
60
70
80
90
2 3 4 5 6 7 8 9
# of MDs
Total Elapsed time (min)
(b) Verification time
Figure 6.27. Verification results by changing the number of doctor resource objects. (a) com-pares the number of TFG nodes. (b) compares the elapsed verification times.
2 MDs, 0 RNs 0 MDs, 2 RNs 2 MDs, 2 RNs
# TFG nodes 2255 2471 4784 # TFG edges 7624 5215 15378 # Tasks 11 11 11 # Constraint FSMs (CFSMs) 30 30 34 Mean # of States in CFSMs 79 86 144 Mean # of Transitions in CFSMs 459 482 679
Figure 6.28. Comparison of the sizes of analysis problems by changing the combinationsof including different resource types.
same MD, and handoff), and resource capacity constraints. As can be seen in Figure 6.27, the
number of TFG nodes increase linearly as the number of doctor resource object increases. As
can be seen in Section 5.3.2, TFG size depends on the number of resource objects. Similarly,
the number of constraint FSMs increases linearly. However, the verification time increases
exponentially because the verification time of FLAVERS is dependent exponentially on the
number of constraint FSMs.
Figure 6.28 shows the impacts of three resource configurations on the sizes of the analysis
problems: 2 MDs, 0 RNs, 0 MDs, 2 RNs, and 2 MDs, 2 RNs. For the comparison, I
verified the ED completion property with 1 patient, all patient care processes, all policies
(shift, same MD-RN, and handoff), and capacity constraints. As can be seen in Figure 6.28,
the TFG size of 2 MDs, 2 RNs is approximately similar to the sum of the TFG sizes of 2
103

MDs, 0 RNs and 0 MDs, 2 RNs. In addition, Figure 6.28 shows that the number of tasks
does not depends on the number of resource objects.
104

CHAPTER 7
RELATED WORK
Sound resource management is a very important but hard problem. Resource man-
agement problems have been widely studied in many kinds of systems such as healthcare
systems, operating systems, cloud systems and so on. This chapter describes prior works
that are closely relevant to my proposed research.
7.1 Modeling
Related to my model-based approach, there are many studies to specify various dimen-
sions of systems. In this section, I present prior work by focusing on how their approaches
describe resources. Based on my investigations, most of this prior work has difficulty in
specifying complex resource concerns such as resource utilization policies in a flexible man-
ner. However, my resource specification approach is capable of specifying diverse resource
characteristics, complex management constraints and conflict resolutions by separating these
resource concerns.
7.1.1 Process Modeling
Business Process Model and Notation (BPMN) [46] was developed by the Object
Management Group (OMG) to provide a single standard notation for business processes.
BPMN provides graphical notations for conceptual business processes that are intended to be
readily understandable by all business process stakeholders such as analysts, developers and
business people. This modeling approach specifies business processes through collaboration
diagrams, process diagrams and choreography diagrams. First, collaborations are defined
105

by a collection of participants in pools and their interactions by message flows. Second,
a process describes a sequence of activities in an organization. Third, a choreography
formalizes interactions between participants by focusing on the exchange of information. To
specify resources, BPMN uses two basic abstractions: resource and resource class. BPMN
defines a resource as anything or anyone involved in the performance of a process activity. A
resource class defines a set of resources with shared characteristics that can be referenced by
activities. A resource class can represent either a role or a group. A role classifies resources
based on what a resource can do or is expected to do. On the other hand, a group classifies
resources by an organization’s structure. These resource classes are captured by using pools.
Therefore, a collaboration diagram represents collaborations between resources by using
message flows. A choreography defines expected behavior - a procedural business contract
between interacting resources. However, BPMN does not include resource management
issues such as resource allocation under various constraints or conflict among multiple
utilization policies.
Yet Another Workflow Language (YAWL) [65] provides a workflow specification lan-
guage based on Petri nets. YAWL extends Petri nets to support various kinds of workflow
patterns [70] such as control-flow, data, resource, exception handling and managing process
model complexity patterns. YAWL divides workflow specification into control-flow, data
and resource perspectives. Control-flow perspective defines tasks and their interaction flow
relations. Data perspective specifies how and when data values are created, passed and
populated. Resource perspective defines what human and non-human resources are required
to perform the work items in a selected task. YAWL divides resources into primary and
secondary resources. Primary resources are human resources that actually perform a work
item. However, secondary resources consist of both human and non-human resources that
assist primary resources. Related to resource decisions such as work item offers, resource
allocations and work item starts, YAWL provides two interaction strategies (decision by
system and by user) for work items of a selected task. Interaction strategies can be decided
106
at three interaction points such as the offer, allocation or start. Offer by system strategy
means that a system selects a resource automatically to perform a work item. Offer by user,
however, requires an administrator to select a resource for a work item at runtime. In the
offer specification, YAWL provides constraints that specify which work items are allowed
or prevented from being performed by primary resources. At the allocation point, allocated
by system means that resources are selected by the system; however, allocated by user
allows resource participants to decide their work items by themselves. At start point, started
by system indicates work items will be immediately started after allocation. On the other
hand, started by user allows manual start of the work items by resource participants. This
approach separates resource concerns from control-flow and data perspectives. However,
the specification capabilities of resource constraints are restrictive. For instance, YAWL
does not support conflict resolution strategies among multiple resource utilization policies.
Web Services Business Process Execution Language (WS-BPEL) [44] specifies business
processes based on web services. WS-BPEL supports two kinds of specifications for
executable and abstract business processes. To support business transactions, WS-BPEL
extends the Web Services interaction model. WS-BPEL uses several XML specifications
such as WSDL, XML schema, XPath and XSLT. To define a data model, WS-BPEL specifies
the model by using WSDL messages and XML schema type definitions. XPath and XSLT
provide support for data manipulation. All business partners or external resources are
represented by using WSDL services that describe the functionality offered by a web service.
However, WS-BPEL does not include human interactions essential to business processes.
Therefore, BPEL4People [14] has been extended from WS-BPEL to incorporate role-based
human activities as well as web services. In contrast to my approach, WS-BPEL does not
provide any explicit specification to capture resource management characteristics in business
processes.
107
7.1.2 Policy Modeling
Systems incorporate policies to guide behavioral decisions of participants to achieve
system goals. Many prior studies have focused on policies to implement flexible and
adaptive systems for management of internet services, distributed systems and security
systems. Damianou et al. [16] divide policy specification languages into security and
management policies. Many prior works have provided security policy (or access control
policy) languages to specify that only authorized subjects are permitted to access targets
such as services or resources [19, 24, 45, 53, 55]. Sandhu et al. [55] provide role-based
access control models (RBAC). RBAC defines users, permissions and sessions that are
related to roles. In addition, they specify role hierarchy as well as constraints to restrict the
assignments of users or permissions to specific roles. Ribeiro et al. [53] provide an event-
driven policy language that supports access control, history-based and obligation-based
policies. XACML [45] defines information access control policies for securely browsing
documents over the Internet. In contrast to these security policy specification languages,
management policy specification languages define dynamically adaptable management
strategies [9, 36, 38, 42, 62] that facilitate modifying the management approach in a flexible
manner. Moore et al. [42] define a policy core information model for network policies.
Network policy defines the relation between clients using network resources and the network
elements providing those resources. Burgess et al. [9] provide configuration policies for a
system administration tool which automates configuration of all networked hosts. However,
none of these policy specification languages aim to address resource management problems
that my proposed research is considering. Resource utilization policies are important to be
considered carefully in system design and analysis phases as well as these access control
and configuration management policies of these prior studies.
Rei [30] is a policy specification language for pervasive computing applications. The
policy language, Rei, aims to be very expressive but lightweight and easily extensible. Rei
is based on deontic concepts and provides constructs for rights, prohibitions, obligations and
108

dispensations. An entity has rights of permission to perform the associated action only when
certain conditions are true. On the other hand, prohibitions are negative authorizations that
indicate an entity is not authorized to perform an associated action. Obligations are special
actions that an entity must perform when a set of conditions is true. Dispensations, however,
are special actions that an entity waives from existing obligations. To control these policies,
Rei provides four speech acts: delegation, request, cancel and revocation. Delegation allows
a transfer of a right between entities. Request defines queries for an action or a right.
Revoke acts as a prohibition by removing a right. An entity can cancel any requests by the
cancel speech act. Rei defines three cases of possible policy conflicts such as (1) conflict
of right and prohibition, (2) conflict of obligation and dispensation, and (3) conflict of
obligation and prohibition. Rei resolves these potential conflicts among multiple policies
by priority and precedence meta policies. For instance, a priority meta policy can state
that an ED policy overrides a hospital policy in the case of conflict. Precedence specifies
negative or positive modality precedence. If negative modality holds, prohibitions hold
over rights and dispensations are stronger than obligations for the entities that fulfill the
associated conditions in the precedence meta policy. My proposed resource utilization policy
specification is inspired by Rei. Resources have permissions that allow to perform an activity.
I separate conflict resolution specifications in order to resolve conflicts among multiple
resource utilization policies. However, Rei does not support any resource management
issues such as request or resource selection for effective and efficient management, complex
constraints in resource management and conflicts between multiple permissions.
7.2 Simulations
Simulation has been widely used to dynamically analyze the behavior of complex sys-
tems. This section describes prior works of simulations and their limitations from resource
management perspective. Overall, despite the large number of these previous studies, in my
view, none of them has supported the evaluation of complex resource utilization policies
109

in a flexible manner because most of them treat resources as other entities in their activity
coordination models. My approach separates resource concerns to facilitate flexible support
of resource decisions.
7.2.1 Simulations Tools
Arena [54] uses a resource module to specify resources in a system. The resources can
be grouped together as a pool of resources (i.e., resource set). These resources are allocated
and released by using seize and release modules. A resource has capacity which determines
the number of resource units. The capacity can be varied over a simulation run by using a
schedule module. A schedule module adjusts the capacity of a resource for a given period of
time. Arena supports change of resource availability through variable capacity specification;
however, if the availability depends on the resource’s own characteristics, the resource model
of Arena seems unsuitable to specify this dependency. For example, a doctor working in a
fast-track cannot care for a patient in a main-track. In addition, if the doctor moves to the
main-track to help resolve a crowded condition in the main-track, the doctor then becomes
available to care for patients only in the main-track. In addition, Arena has difficulties
specifying a conflict resolution among multiple resource utilization policies, for instance,
the handoff in a hospital. Arena supports multiple schedule policies by adjusting patient
queues; however, if an administrator wants to change the constraints from the sickest-first to
a heuristic-based, entire patient queues and related patients’ attribute modifiers have to be
changed to support this.
SAS Simulation Studio [56] provides mobile resources as a special type of entity that
flow in the model. A resource entity has attributes which can be used in processing like
other entities. Because resources are a special type of entity, they have to be first created
and then sent to a resource pool block to handle resource requests. Seize and release blocks
are used to model resource allocation and release. There is a predefined entity attribute
called ResourceUnits, which defines the number of units of a resource. By using a resource
110

schedule, the number of available resources can be varied during a simulation run. Attribute
values of a resource can be used to specify different characteristics of resources. However, it
is not sufficient to specify different kinds of resources that have different kinds of specialized
capabilities. For instance, a nurse can provide patient-care capabilities such as assessment,
ECG, blood work and so on. If the nurse becomes too busy to maintain high quality of
patient care, she could hand over her ECG and blood work to a technician. What’s more,
SAS Simulation Studio also has limitations in supporting complex resource utilization
policies as does Arena.
SimEvents [40] does not have resource-specific modeling modules; however, this does
not mean that resource management systems cannot be modeled by using SimEvents. Like
the approach of resource modeling in SAS Simulation Studio, an entity can be used to model
a resource. An entity generator creates a number of resource entities, and then a queue
stores the created resource entities. An entity combiner and an entity splitter can be used to
model resource allocation and release, respectively. However, the lack of resource-specific
modeling modules inherently increases the complexity of the entire system specification if
an analyst want to study the resource constraints of a system.
FlexSim [22], Simio [60], and ProModel [49] incorporate physical location information
in their models. In general, these simulation systems model a resource as stationary or mobile
resources. Stationary resources handle an arrival entity at their fixed locations; however,
mobile resources move to pick-up an entity to provide a service such as carrying an entity
to other locations. These simulation systems help us see how a system operates visually.
However, it is relatively difficult to specify resource constraints which involve inter-relations
among entities, resources and activities. For instance, the same doctor constraint in an ED
requires pairing a patient with a doctor. If the location of a patient is changed by a nurse, the
patient’s doctor should be aware of this changed location. These kinds of interactions would
significantly increase the complexity of their communication specifications.
111

7.2.2 Hospital Patient Care Simulations
Related to my case study , many studies use simulations to analyze hospital resource
management [6, 15, 20, 41, 47, 61]. Wang et al. [69] use a simulation model to identify
potential changes in operational policies to reduce patients’ length of stay. They suggest
reassignment of nurse jobs, combining registration with triage, adding float nurses, manda-
tory requirement of physician’s visit within 30 min, and the simultaneous improvement of
durations of the most sensitive procedures to decrease the length of stay. Zeng et al. [76]
use a simulation model to study the ED of a community hospital. Based on their sensitivity
analysis, they suggest that adding nurses and CT scanners can reduce patient waiting times
and length of stay. They also suggest that a team nursing policy (creating pooled capacities)
can significantly improve ED efficiency. Brenner et al. [8] use simulation to identify bottle-
necks and investigate the optimal numbers of human and equipment resources. In contrast to
my work, these simulations oversimplify hospital resource utilization policies and even not
include time-varying patient arrival rates, which are particularly important to model patient
care in a hospital.
7.3 Static Analysis
My static analysis approach relies on the use of FLAVERS which is a finite state
verification tool to analyze resource utilization policies. This section presents prior static
analysis work which is related to formal verification and resource analysis. In contrast to
my static resource analysis, this previous work has difficulty analyzing complex resource
utilization policies. Encoding and analyzing complex resource utilization policies require a
lot of efforts in using prior formal verification techniques. In addition, prior static analyses
focusing on only a specific resource utilization problem such as resource contention and
capacity limits based on relatively simplified resource models.
112

7.3.1 Formal Verification Tools
Formal verification techniques guarantee that system specifications are free from the
violations of a given system property. Due to the fact that the precision demanded by today’s
systems is critical; many researchers have extensively studied formal verification techniques
such as model checking [12, 26, 31] and theorem proving [11, 37, 57]. Model checking
approaches build a system model by using a form of state transition system. They define a
system property based on temporal logic. Given these system models and properties, model
checking verifies whether the system satisfies the given property in all system executions.
A basic analysis algorithm incorporates exploring a set of reachable states of models to
assure a given property holds. These model checking approaches have wide applications.
For instance, SPIN [26] model checker is used to verify a banking system [58]. On the
other hand, theorem proving techniques do not require exhaustive searching of a system’s
state space to verify properties. Various kinds of logic and proof techniques, such as Hoare
logic and inductive proof, are used in many theorem provers. Theorem proving techniques
are also widely used in many applications. For example, Coq [11] theorem prover is used
to formalize and verify a mail server (SMTP server) [1]. However, tools for these formal
verification approaches often require a great deal of user expertise and effort. Analyzing
complex resource utilization policies by using these verification approaches requires much
intensive work by analysts. To circumvent this, my proposed research provides an automated
translation algorithm from my resource specifications to describe transition systems (such as
a FSM and an event trace graph) that can be used in a model checking approach (FLAVERS).
7.3.2 Static Resource Analysis
Li et al. [34] provide a resource constraints analysis approach for workflow specifications.
They classify resources into two types: shared resources and private resources. Shared
resources can be accessed by different activities; however, private resources are allowed to be
accessed by only one activity. Given this classification of resources, Li et al. are interested in
113

shared resources because these resources may create a conflict between competing activities
requiring the same shared resources. If multiple activities require the same shared resources,
Li et al. relate these activities as a resource dependency relation. Then, they define a
potential conflict in resource utilization as the simultaneous scheduling of activities in
a resource dependency relation. Their analysis aims to detect this potential conflict in
a workflow specification. They detect this conflict by using resource dependency and
reachability information. Briefly, they first check the reachability of two activities with
resource dependency. If an activity is reachable from another, they do not compete with
each other for the shared resources. Otherwise, they further check whether scheduling these
activities at the same time could result in a potential resource conflict. They extend this
potential conflict detection algorithm for timed workflow specifications. However, their
analysis capability is restricted to the resource contention problem. In addition, they do
not consider any complex constraints in resource management such as resource utilization
policies.
Wang et al. [68] introduce resource-constrained workflow model as well as a re-
source requirement analysis approach. They extend Workflows Intuitive Formal Approach
(WIFA) [67] to take resources into account when modeling and analyzing workflows. Given
the formal workflow definitions in WIFA, they formally define resources and their participa-
tion such as resource consumption for starting a task, resource production after executing
a task, and resource-ready for the required amount of resources to start a task and state
transition rules related to resources. Given a formal workflow description, they are interested
in a sufficient resource set (SRS). If an SRS is satisfied in a workflow, the workflow can
be executed without of resource shortage. To analyze an SRS, they find out the maximum
amount of each type of resources that can be held or consumed in the execution of a work-
flow by examining a workflow task-by-task from the starting task to ending task. Wang
et al. [66] improve this algorithm’s efficiency by using block or branch information in a
workflow. However, this approach analyzes resource capacity based on very simplified
114

resource models. Complex resource utilization policies significantly influence resource
capacity management that aims to improve efficiency in a workflow.
Besides these resource analyses in a workflow (or process) domain, many program
analysis techniques have been developed to address resource analysis problems related to
resource utilization such as deadlock [18, 43, 71] and resource leak [29, 63, 64]. Naik et
al. [43] provide an effective static deadlock detection approach for Java. Their algorithm uses
novel combinations of static analyses to detect a set of conditions that cause a deadlock. Sui
et al. [63] introduce a static memory leak detection algorithm by using full-sparse value-flow
analysis. They use a sparse value-flow graph to capture def-use chains and value flows for
all memory locations. Given the value-flow graph, they perform reachability analysis to
detect a memory leak. However, these resource analysis techniques for software programs
depend on specific resource types and resource utilization constructors provided by specific
languages. For instance, memory leak detection approaches depend on languages such
as C or Java based on the difference between explicit memory management and garbage
collection.
Unified Modeling Language (UML) is often used to design software; however, scattered
resource information in UML diagrams increase the difficulty in analyzing resource prop-
erties. Petriu et al. [48] introduce Core Scenario Model (CSM) to bridge between UML
based software specifications and performance analysis models such as layered queuing
networks and Petri Net. CSM extracts resource use information from UML specifications
because UML specifications have scattered resource information. They categorize resources
as ExternalOperation, ProcessingResource, and Component; and model resource usage flow
by using resource acquisition and release to specify how long resources are used and what
order they follow. However, CSM does not directly address the specification and analysis
challenges inherent in complex resource utilization policies.
115

7.4 Resource Management
This section presents prior work related to resource management in the area of broad
system research. In contrast to my approach, most of this resource management research
centers on strategies of resource allocation and scheduling. They have focused relatively
less on modeling diverse and complex resource characteristics and utilization policies.
7.4.1 Resource Management in Operating Systems
One of the main responsibilities of an operating system is resource management. Com-
peting applications share system resources such as processors, memory, caches, storage,
and I/O devices. These resources should be managed adequately to respond to changes in
application contexts under various constraints such as response time and power consump-
tion. Boyd-Wickizer et al. [7] provide a scheduling algorithm that maximizes utilization of
distributed on-chip memory in multicore processors. The main challenge in maximizing
on-chip memory utilization is that the memory be split up among the cores in the form of
many small caches. Their approach shows that scheduling based on scheduling objects and
operations to caches and cores, rather than scheduling to optimize CPU cycle utilization,
is better in terms of utilizing on-chip memory. Holey et al. [25] provide a novel shared
cache management policy for a heterogeneous multicore processor that takes advantage of
the CPU’s tolerance for memory access latency. Their shared cache management policy
not only improves performance but also reduces energy consumption in the cache module.
Xu et al. [75] provide automated power management approaches in OS-level for devices.
Current approaches place power management burdens on device driver developers, who have
often failed in the development of efficient power management. To address this problem,
they develop a central power management agent that automatically performs runtime power
management. Most of this research focuses on a specific resource type because system
resources’ utilization is often followed by fixed specifications of operating systems.
116

7.4.2 Resource Management in Clouding Systems
Resource management in a cloud environment plays a key role in today’s Internet ser-
vices. Jennings et al. [28] categorize the subjects of a cloud resource management system by
categorizing types of resources such as compute resources, networking resources, storage
resources, and power resources. Compute resources are a collection of physical machines. In
a clouding environment, physical machines are typically hidden by virtual machines which
may share the same physical resources. Ahn et al. [2] provide two cluster-level virtual ma-
chine scheduling techniques for traditional system resources such as cache and non-uniform
memory access affinity to mitigate the contentions among them. Efficient management of
networking resources is important because these physical machines are interconnected with
a high-bandwidth network. To provide predictable latency and bandwidth in a data center
network, the virtualization of a data center network is considered a promising approach [5].
Wood et al. [73] provide optimized support for live WAN migration of virtual machines that
minimizes the cost of transferring storage and virtual machine memory during migrations
over low bandwidth and high latency Internet links. Management of storage resources is
different from traditional database systems because scalability is critical in cloud systems.
Depending on the number of users, load, or data volume, storage services should be dynami-
cally scaled. To achieve scalable storage, distributed key-value stores such as Cassandra [32]
and Dynamo [17] are used for Facebook and Amazon, respectively. To address power
management issues in cloud systems, prior work has developed energy efficient techniques
for energy-aware resource management, low power components to improve hardware energy
efficiency, more efficient cooling systems, and applications. Mathew et al. [39] provide an
energy efficient content delivery network using an algorithm for cluster shutdown based on
realistic power models. Most of this prior work has focused on non-human resources and
plays little attention to the nature of resources and their utilization policies from a general
perspective.
117

CHAPTER 8
CONCLUSIONS
Contemporary systems often require effective support of many types of resources, each
governed by complex utilization policies. Efficient and effective management of these
resources is crucial in assuring that these systems achieve their key goals. To help system
developers make efficient and effective resource management decisions, I have developed a
framework of resource utilization policy specification and analysis.
8.1 Discussions
Many systems integrate various resources such as human, software, and hardware
resources necessary to perform activities in the systems. System participation by these
resources is often restricted by diverse resource utilization policies. Further, policies may
at times conflict with each other, requiring conflict resolution strategies that add extra
complexity. My resource specification approach (1) separates resource utilization policy
concerns from other system aspects, (2) creates an expressive specification notation for
utilization policies and (3) creates a policy conflict resolution capability. My approach
enables creating specifications of policies that are sufficiently precise and detailed to support
static and dynamic analyses of how these policies affect the properties of systems governed
by these policies.
I have built a process- and resource-aware discrete-event simulation engine for simu-
lating system executions that adhere to resource specifications. The engine’s evaluation
of a hospital ED healthcare system demonstrated that it supports considerable flexibility
in resource and utilization policy specification and provides powerful dynamic analyses.
118

Given the simulation’s capability, I developed an approach for scheduling the staffing of
hospital EDs by integrating simulations with integer linear programming. Because staffing is
dependent on the patient-care process, interactions among resources, and other operational
constraints, I have developed detailed and precise simulation models for the ED process of
caring for patients and for the relevant resources.
My simulation research shows promising results for flexible support of diverse resource
decisions and effective dynamic analysis through process- and resource-aware discrete-event
simulations. However, the approach is inherently limited because of the impossibility of
exhaustive simulations of all scenarios. To complement the simulation approach, I have
developed process- and resource-aware static analysis approach. My static analysis approach
utilizes powerful model checking techniques, building on the existing FLAVERS model
checking tool, to verify properties of complex systems that are also verified to conform
to complex resource utilization policies. In doing this, my research demonstrates how my
analysis framework can be effective in guiding the domain expert towards sound decisions
about policies for the management of hospital resources, while also providing rigorously-
based assurances that the guidance is reliable and well-founded.
8.2 Future Work
My case study shows promise that my framework helps system developers evaluate,
validate and verify diverse and complex resource utilization policies in a hospital ED system.
Related to this case study, my ED models are continuously evolving based on newly observed
real-world data and interactions with my domain expert. Therefore, continuous validation
through close comparison between real-world data and simulations outputs are required.
Concerning verifications, I have verified the adherence to hospital policies of my ED models.
However, key functional properties in a hospital ED, that needed to be verified, should be
identified.
119

Some continuations of my research may require long term research. I believe that the
following research questions also lead to very interesting research topics related to efficient
and effective resource management.
Future research question 1: How does my resource manager guarantee that it always
adhere to all the specified resource policies?
I have developed a process- and resource-aware discrete-event simulator by separating
a resource management component that adheres to my resource specifications. However,
developing software components of a resource manager may create errors that violate my
resource utilization policy specifications. Therefore, further research is required to guarantee
my resource manager always adheres to all the specified resource policies.
Future research question 2: How can analysts be guided to build resource function
properties?
A resource must sometimes follow a sequence of activities while participating in a
system. In my approach, this resource function property is satisfied by using a combination
of activity coordination and resource utilization policy specifications. Activity coordination
constrains a sequence of requests from activities. Resource utilization policies then constrain
which resources must be selected for given requests. My approach allows analysts to specify
these resource function properties by using a property FSM; however, specifying such
property specifications is often difficult for domain experts. Therefore, systematic guidance
is required to assist domain experts both identify and define resource function properties.
Future research question 3: How can resource time constraints be included in a static
analysis framework?
Static analysis of time constraints is well-known as an important but hard problem.
Some resource utilization policies are constrained by time. For example, shift policy in a
120

hospital ED is directly related to the time of a day. However, FLAVERS, that I use for static
resource analysis, does not support time analysis. Therefore, further research to specify
time-enriched static analysis models and time-analysis techniques is required to analyze
time-related resource utilization policies.
Future research question 4: How do my static and dynamic analyses assure that they
follow the same semantic of my resource specifications?
I have implemented behaviors of a resource manager for dynamic and static analysis.
These two different versions of implementations are intended to follow the same semantic
of my resource specifications. The absence of a proper analysis to verify that both imple-
mentations always adhere to the same semantic of resource specifications may threaten the
validity of analysis results. Therefore, further research is required to verify the equivalence
between different implementations that adhere to the same specifications.
Future research question 5: What aspects should be included to define resources in
systems?
My research provides a specification approach to define resource characteristics through
attributes (e.g., capacity and effort-needed) and capabilities. Even though the specification
approach aims to specify diverse kinds of resources across different domains, many issues
remain to be addressed.
A system integrates diverse kinds of components often including resources. In general, a
system distinguishes resources from other components based on an intuitive understanding
about resources in the system. For instance, a resource is an entity needed to perform an
activity in a system. However, an intuitive informal definition likely leads toward limitations
in analyzing complex and dynamic resources. Identifying key aspects to precisely define
resources in complex systems is a challenging problem. My approach attempts to identify
key aspects of resources to support powerful dynamic and static analyses of resource
121

utilization; however, further evaluations should follow by applying it to other complex
systems.
Resources in a system has complex relations with other system components such as
activities, artifacts and the resource themselves. My approach handles these relations from
the perspective of resource allocations. However, there are many research opportunities
investigating the relational aspect of resources. For instance, configuration of resources
varies over different phases in system operations such as build, runtime, upgrade, and
other phases. Each phase in a system may require and allow different forms of resource
configurations. Specifying and analyzing such complex resource relations present interesting
problems.
Future research question 6: What aspects should be included to define policies in
systems?
My research focuses on resource utilization policies in complex systems and provides
a resource-aware specification and analysis framework. In addition to resource utilization
policies, systems often incorporate diverse kinds of policies such as access controls, business
rules, guidelines, regulations and other policies. All these different policies influence system
behaviors by having direct or indirect relations among them. These policies also vary over
dynamic contexts such as time and a system’s environment. The complexity of policies
requires careful analyses to satisfy system requirements. However, it is hard to characterize
these policies precisely enough to support analyses.
I characterize resource utilization policies through permission constraints, schedules, and
conflict resolution policies. However, this approach should be further evaluated by applying
it to other complex systems. In addition, identifying common and various characteristics
among other kinds of policies (e.g., access control) across many systems is necessary to
understand the nature of policies which eventually allows policy analyses. Clear separation
of these policies and tractable interactions among policies and a system are required to
support policy analyses such as consistency checks, policy evaluations, and other analyses.
122

Any inconsistency between policies likely creates a conflict situation in which a system
has a problem in delivering its functions as required. There are many kinds of inconsistencies
or conflicts exist among diverse policies. In addition, there are different kinds of methods to
address each conflict condition. For instance, if two different access control policies enforce
a permission and a prohibition to access the same data entity at the same time, this conflict
should be avoided before or resolved after the conflict occurs. Different kinds of policies
may also create a conflict condition. For example, a resource utilization policy allocates a
resource to an activity; however, the resource does not have the authority to access artifacts
associated with the activity. Even though my research addresses analysis issues related to
resource utilization policies, further research should follow to address the analysis issues
concerning diverse policies.
Future research question 7: What are the differences between a model and a real-
world system from the perspective of policies?
In general, there are gaps between a model and a real-world system. Modeling activity
usually abstracts out unnecessary details in the real-world based on modeling purposes,
domain experts’ expertise, observed data, and other modeling related factors. For instance,
if a hospital administrator wants to evaluate the effects of a new staffing policy by using
a simulation, what aspects should be included in a simulation model? In addition, the
evaluation of new policy is challenging because there are no oracles for the new policy.
The hospital administrator, in this example, needs some kind of supporting evidence that
the simulation results are also expected in a real-world implementation of the new policy.
The details which were abstracted out may, in fact, greatly influence the real-world system
behaviors. A systematic approach to analyze the differences helps a system developer
improve policies in complex systems.
Executions in a model and a real-world system are also different. For instance, my
analysis framework uses a discrete time clock, interleaving semantics, strict enforcement
of policies, and other semantics facilitate my simulations and model checking. However,
123

a real-world human-intensive system does not exactly follow these semantics. The gap
between the different semantics may result in significantly different effects of the policies in
the two worlds. For instance, my constraint-aware scheduling approach assumes there are no
dramatic changes between discrete time blocks. However, if significantly dramatic changes
occur in a real-world system, my approach is not applicable. Developing new semantics or
providing exact differences and their consequences may bridge the semantic gap. In both
directions, my approach has to be further refined.
124
BIBLIOGRAPHY
[1] Affeldt, Reynald, and Kobayashi, Naoki. Formalization and verification of a mailserver in coq. In Proceedings of the 2002 Mext-NSF-JSPS International Conferenceon Software Security: Theories and Systems (Berlin, Heidelberg, 2003), ISSS’02,Springer-Verlag, pp. 217–233.
[2] Ahn, Jeongseob, Kim, Changdae, Han, Jaeung, Choi, Young-Ri, and Huh, Jaehyuk.Dynamic virtual machine scheduling in clouds for architectural shared resources. InProceedings of the 4th USENIX Conference on Hot Topics in Cloud Ccomputing(2012), HotCloud’12, USENIX Association, pp. 19–19.
[3] Alvarez, Rene, Sandoval, Guillermo A., Quijada, Sergio, and Brown, Adalsteinn D. Asimulation study to analyze the impact of different emergency physician shift structuresin an emergency department. In Proceedings of the 35th International Conference onOperational Research Applied to Health Services (ORAHS) (2009).
[4] Avrunin, George S., Clarke, Lori A., Osterweil, Leon J., Christov, Stefan C., Chen,Bin, Henneman, Elizabeth A., Henneman, Philip L., Cassells, Lucinda, and Mertens,Wilson. Experience modeling and analyzing medical processes: Umass/baystatemedical safety project overview. In Proceedings of the 1st ACM International HealthInformatics Symposium (New York, NY, USA, 2010), IHI ’10, ACM, pp. 316–325.
[5] Bari, Md. Faizul, Boutaba, Raouf, Esteves, Rafael Pereira, Granville, Lisandro Zam-benedetti, Podlesny, Maxim, Rabbani, Md Golam, Zhang, Qi, and Zhani, Mo-hamed Faten. Data center network virtualization: A survey. IEEE CommunicationsSurveys and Tutorials, 2 (2013), 909–928.
[6] Beck, Ekkehard. A discrete event simulation approach to resource management,process changes and task prioritization in emergency departments. Master’s thesis,Department of Mechanical and Industrial Engineering, University of Massachusetts,Amherst, MA, USA, 2009.
[7] Boyd-Wickizer, Silas, Morris, Robert, and Kaashoek, M. Frans. Reinventing schedul-ing for multicore systems. In Proceedings of the 12th Conference on Hot Topics inOperating Systems (Berkeley, CA, USA, 2009), HotOS’09, USENIX Association,pp. 21–21.
[8] Brenner, Stuart, Zeng, Zhen, Liu, Yang, Wang, Junwen, Li, Jingshan, and Howard,Patricia K. Modeling and analysis of the emergency department at university ofkentucky chandler hospital using simulations. Journal of Emergency Nursing 36(2010), 303–310.
125

[9] Burgess, Mark. A site configuration engine. Computing Systems 8, 3 (1995).
[10] Chen, Bin. Improving Processes Using Static Analysis Techniques. PhD thesis,University of Massachusetts Amherst, 2010.
[11] Chlipala, Adam. Certified Programming with Dependent Types. MIT Press, 2011.http://adam.chlipala.net/cpdt/.
[12] Clarke, E. M., Emerson, E. A., and Sistla, A. P. Automatic verification of finite-stateconcurrent systems using temporal logic specifications. ACM Trans. Program. Lang.Syst. 8, 2 (Apr. 1986), 244–263.
[13] Cochran, Jeffery K., and Roche, Kevin T. A multi-class queuing network analysismethodology for improving hospital emergency department performance. Computers& Operations Research 36 (2009), 1497–1512.
[14] Committee Specification. Ws-bpel extension for people (bpel4people) specificationversion 1.1. Tech. rep., OASIS, august 2010.
[15] Connelly, Lloyd G., and Bair, Aaron E. Discrete event simulation of emergencydepartment activity: A platform for system-level operations research. AcademicEmergency Medicine 11, 11 (2004), 1177–1185.
[16] Damianou, Nicodemos C., Bandara, Arosha K., Sloman, Morris S., and Lupu, Emil C.A survey of policy specification approaches. Tech. rep., Department of Computing,Imperial College of Science Technology and Medicine, 2002.
[17] DeCandia, Giuseppe, Hastorun, Deniz, Jampani, Madan, Kakulapati, Gunavardhan,Lakshman, Avinash, Pilchin, Alex, Sivasubramanian, Swaminathan, Vosshall, Peter,and Vogels, Werner. Dynamo: Amazon’s highly available key-value store. SIGOPSOper. Syst. Rev. 41, 6 (Oct. 2007), 205–220.
[18] Deshmukh, Jyotirmoy, Emerson, E. Allen, and Sankaranarayanan, Sriram. Sym-bolic deadlock analysis in concurrent libraries and their clients. In Proceedings ofthe 2009 IEEE/ACM International Conference on Automated Software Engineering(Washington, DC, USA, 2009), ASE ’09, IEEE Computer Society, pp. 480–491.
[19] Dimoulas, Christos, Moore, Scott, Askarov, Aslan, and Chong, Stephen. Declarativepolicies for capability control. In CSF’14 (2014), pp. 3–17.
[20] Duguay, Christine, and Chetouane, Fatah. Modeling and improving emergency depart-ment systems using discrete event simulation. Simulation 83, 3 (2007), 311–320.
[21] Dwyer, Matthew B., Clarke, Lori A., Cobleigh, Jamieson M., and Naumovich, Gleb.Flow analysis for verifying properties of concurrent software systems. ACM Trans.Softw. Eng. Methodol. 13, 4 (Oct. 2004), 359–430.
[22] FlexSim Software Products. FlexSim. http://www.flexsim.com.
126

[23] Green, L. V., Soares, J., Gjulio, J., and Green, R. Using queuing theory to increase theeffectiveness of physician staffing in the emergency department. Academic EmergencyMedicine (2006).
[24] Hoagland, James, Pandey, Raju, and Levitt, Karl N. Security policy specification usinga graphical approach. Tech. Rep. CSE-98-3, University of California, Davis, 1998.
[25] Holey, Anup, Mekkat, Vineeth, Yew, Pen-Chung, and Zhai, Antonia. Performance-energy considerations for shared cache management in a heterogeneous multicoreprocessor. ACM Transactions on Architecture and Code Optimization (TACO) 12, 1(2015), 1–29.
[26] Holzmann, Gerard J. The model checker spin. IEEE Trans. Softw. Eng. 23, 5 (May1997), 279–295.
[27] Iosif, Radu, Dwyer, Matthew B., and Hatcliff, John. Translating java for multiplemodel checkers: The bandera back-end. Form. Methods Syst. Des. 26, 2 (Mar. 2005),137–180.
[28] Jennings, Brendan, and Stadler, Rolf. Resource management in clouds: Survey andresearch challenges. Journal of Network and Systems Management 23 (2015), 567–619.
[29] Ji, Xiujuan, Yang, Jufeng, Xu, Jing, Feng, Lei, and Li, Xiaohong. Interproceduralpath-sensitive resource leaks detection for c programs. In Proceedings of the FourthAsia-Pacific Symposium on Internetware (New York, NY, USA, 2012), Internetware’12, ACM, pp. 19:1–19:9.
[30] Kagal, Lalana, Finin, Tim, and Joshi, Anupam. A policy language for a pervasivecomputing environment. In Proceedings of the 4th IEEE International Workshopon Policies for Distributed Systems and Networks (Washington, DC, USA, 2003),POLICY ’03, IEEE Computer Society, pp. 63–.
[31] Kwiatkowska, Marta, Norman, Gethin, and Parker, David. Prism 4.0: Verification ofprobabilistic real-time systems. In Proceedings of the 23rd International Conferenceon Computer Aided Verification (Berlin, Heidelberg, 2011), CAV’11, Springer-Verlag,pp. 585–591.
[32] Lakshman, Avinash, and Malik, Prashant. Cassandra: A decentralized structuredstorage system. SIGOPS Oper. Syst. Rev. 44, 2 (Apr. 2010), 35–40.
[33] Lerner, Barbara Staudt, Christov, Stefan, Osterweil, Leon J., Bendraou, Reda, Kan-nengiesser, Udo, and Wise, Alexander E. Exception handling patterns for processmodeling. IEEE Transactions on Software Engineering 36, 2 (2010), 162–183.
[34] Li, Hongchen, Yang, Yun, and Chen, T. Y. Resource constraints analysis of workflowspecifications. J. Syst. Softw. 73, 2 (Oct. 2004), 271–285.
127

[35] Li, Jingshan, and Howard, Patricia K. Modeling and analysis of hospital emergencydepartment: An analytical framework and problem formulation. In Proceedings of the6th annual IEEE Conference on Automation Science and Engineering (Toronto, ON,Canada, August 2010), pp. 897–902.
[36] Lobo, Jorge, Bhatia, Randeep, and Naqvi, Shamim. A policy description language.In Proceedings of the Sixteenth National Conference on Artificial Intelligence andthe Eleventh Innovative Applications of Artificial Intelligence Conference InnovativeApplications of Artificial Intelligence (Menlo Park, CA, USA, 1999), AAAI ’99/IAAI’99, American Association for Artificial Intelligence, pp. 291–298.
[37] Loveland, Donald W. Automated Theorem Proving: A Logical Basis (FundamentalStudies in Computer Science). sole distributor for the U.S.A. and Canada, ElsevierNorth-Holland, 1978.
[38] Martinez, P., Brunner, M., Quittek, J., Strauss, F., Schonwalder, J., Mertens, S., andKlie, T. Using the script mib for policy-based configuration management. In NetworkOperations and Management Symposium (2002), NOMS 2002, IEEE, pp. 187–202.
[39] Mathew, Vimal, Sitaraman, Ramesh K., and Shenoy, Prashant J. Energy-efficientcontent delivery networks using cluster shutdown. In International Green ComputingConference, IGCC 2013, Arlington, VA, USA, June 27-29, 2013, Proceedings (2013),pp. 1–10.
[40] MathWorks. SimEvents. http://www.mathworks.com/products/simevents.
[41] McCarthy, M. L., Ding, R., Pines, J. M., and Zeger, S. L. Comparison of methodsfor measuring crowding and its effects on length of stay in the emergency department.Academic Emergency Medicine 18, 12 (2011), 1269–1277.
[42] Moore, B., Ellesson, E., Strassner, J., and Westerinen, A. Policy core informationmodel – version 1 specification, 2001.
[43] Naik, Mayur, Park, Chang-Seo, Sen, Koushik, and Gay, David. Effective staticdeadlock detection. In Proceedings of the 31st International Conference on SoftwareEngineering (Washington, DC, USA, 2009), ICSE ’09, IEEE Computer Society,pp. 386–396.
[44] OASIS Standard. Web services business process execution language version 2.0. Tech.rep., OASIS, april 2007.
[45] OASIS Standard. extensible access control markup language (xacml) version 3.0. Tech.rep., (OASIS), january 2013.
[46] Object Management Group. Business process model and notation (bpmn) version 2.0.Tech. rep., Object Management Group, jan 2011.
128

[47] Paul, Sharoda A., Reddy, Madhu C., and Deflitch, Christopher J. A systematic reviewof simulation studies investigating emergency department overcrowding. Simulation86, 8-9 (Aug. 2010), 559–571.
[48] Petriu, Dorin B., and Woodside, Murray. An intermediate metamodel with scenariosand resources for generating performance models from uml designs. Software &Systems Modeling 6 (2007), 163–184.
[49] ProModel. Simio. http://www.promodel.com.
[50] Raunak, Mohammad S. Resource Management in Complex and Dynamic Environments.PhD thesis, University of Massachusetts Amherst, 2009.
[51] Raunak, Mohammad S., and Osterweil, Leon J. Resource management for complexand dynamic environments. IEEE Transactions on Software Engineering 39 (2013),384–402.
[52] Raunak, Mohammad S., Osterweil, Leon J., Wise, Alexander, Clarke, Lori A., andHenneman, Philip L. Simulating patient flow through an emergency department usingprocess-driven discrete event simulation. In SEHC (2009).
[53] Ribeiro, Carlos, Zuquete, Andre, Ferreira, Paulo, and Guedes, Paulo. Spl: An accesscontrol language for security policies with complex constraints. In Network andDistributed System Security Symposium (2001), NDSS’01.
[54] Rockwell Automation. Arena. http://www.arenasimulation.com/.
[55] Sandhu, Ravi S., Coyne, Edward J., Feinstein, Hal L., and Youman, Charles E. Role-based access control models. Computer 29, 2 (Feb. 1996), 38–47.
[56] SAS. Simulation studio. http://www.sas.com/en_us/software/analytics/simulation-studio.html.
[57] Sekar, R. C., and Smith, Kevin N. Obj as a theorem prover with applications tohardware verification. In Current Trends in Hardware Verification and AutomatedTheorem Proving, Graham Birtwistle and P. A. Subrahmanyam, Eds. Springer-VerlagNew York, Inc., New York, NY, USA, 1989, pp. 218–267.
[58] Shi, Huiling, Ma, Wenke, Yang, Meihong, and Zhang, Xinchang. A case study ofmodel checking retail banking system with SPIN. JCP 7, 10 (2012), 2503–2510.
[59] Shin, Seung Yeob, Brun, Yuriy, Osterweil, Leon J., Balasubramanian, Hari, andHenneman, Philip L. Resource specification for prototyping human-intensive systems.In Proceedings of the 18th International Conference on Fundamental Approaches toSoftware Engineering (FASE) (London, England, April 2015), pp. 332–346. DOI:10.1007/978-3-662-46675-9 22.
[60] Simio LLC. Simio. http://www.simio.com.
129

[61] Sinreich, David, and Marmor, Yariv. Emergency department operations: The basis fordeveloping a simulation tool. IIE Transactions 37, 3 (2005), 233–245.
[62] Snir, Y., Ramberg, Y., Strassner, J., Cohen, R., and Moore, B. Policy quality of service(qos) information model, 2003.
[63] Sui, Yulei, Ye, Ding, and Xue, Jingling. Static memory leak detection using full-sparsevalue-flow analysis. In Proceedings of the 2012 International Symposium on SoftwareTesting and Analysis (New York, NY, USA, 2012), ISSTA 2012, ACM, pp. 254–264.
[64] Torlak, Emina, and Chandra, Satish. Effective interprocedural resource leak detec-tion. In Proceedings of the 32Nd ACM/IEEE International Conference on SoftwareEngineering - Volume 1 (New York, NY, USA, 2010), ICSE ’10, ACM, pp. 535–544.
[65] van der Aalst, W. M. P., and ter A. H. M. Hofstede. Yawl: Yet another workflowlanguage. Inf. Syst. 30, 4 (June 2005), 245–275.
[66] Wang, Jiacun, and Li, Demin. Resource modeling and analysis for workflows. In IEEEInternational Conference on Networking, Sensing and Control (2012), ICNSC 2012,IEEE, pp. 187–192.
[67] Wang, Jiacun, and Rosca, Daniela. Dynamic workflow modeling and verification. InProceedings of the 18th International Conference on Advanced Information SystemsEngineering (Berlin, Heidelberg, 2006), CAiSE’06, Springer-Verlag, pp. 303–318.
[68] Wang, Jiacun, Tepfenhart, William, Rosca, Daniela, and Tsai, Anni. Workflow resourcerequirement modeling and analysist. In IEEE International Conference on Networking,Sensing and Control (2008), ICNSC 2008, IEEE, pp. 246–251.
[69] Wang, Junwen, Li, Jingshan, Tussey, Kathy, and Ross, Kay. Reducing length ofstay in emergency department: A simulation study at a community hospital. IEEETRANSACTIONS ON SYSTEMS, MAN, AND CYBERNETICS?PART A: SYSTEMSAND HUMANS 42, 6 (2012).
[70] Wil van der Aalst and Arthur ter Hofstede. Workflow Patterns. http://www.workflowpatterns.com/.
[71] Williams, Amy, Thies, William, and Ernst, Michael D. Static deadlock detection forjava libraries. In Proceedings of the 19th European Conference on Object-OrientedProgramming (Berlin, Heidelberg, 2005), ECOOP’05, Springer-Verlag, pp. 602–629.
[72] Wise, Alexander. Little-JIL 1.5 language report. Tech. Rep. 2006–051, Department ofComputer Science, University of Massachusetts, Amherst, 2006.
[73] Wood, Timothy, Ramakrishnan, K. K., Shenoy, Prashant, and van der Merwe, Jacobus.Cloudnet: Dynamic pooling of cloud resources by live wan migration of virtualmachines. In Proceedings of the 7th ACM SIGPLAN/SIGOPS International Conferenceon Virtual Execution Environments (2011), VEE ’11, ACM, pp. 121–132.
130

[74] World Wide Web Consortium. Xpath. https://www.w3.org/TR/xpath20/.
[75] Xu, Chao, Lin, Felix Xiaozhu, Wang, Yuyang, and Zhong, Lin. Automated os-leveldevice runtime power management. In Proceedings of the Twentieth InternationalConference on Architectural Support for Programming Languages and OperatingSystems (2015), ASPLOS ’15, ACM, pp. 239–252.
[76] Zeng, Zhen, Ma, Xiaoji, Hu, Yao, Li, Jingshan, and Bryant, Deborah. A simulationstudy to improve quality of care in the emergency department of a community hospital.Journal of Emergency Nursing 38 (2012), 322–328.
131


