Utilization of Community Corrections Centers · Casey Bowdish, Student Research Assistant Field...
63
Utilization of Community Corrections Centers Statistical Report, FY 2006 The Commonwealth of Massachusetts Trial Court Office of Community Corrections Stephen V. Price, Executive Director January 2007
Transcript of Utilization of Community Corrections Centers · Casey Bowdish, Student Research Assistant Field...

Utilization of Community Corrections Centers
Statistical Report, FY 2006
The Commonwealth of Massachusetts Trial Court Office of Community Corrections
Stephen V. Price, Executive Director
January 2007

Office of Community Corrections One Center Plaza, Ninth Floor
Boston, MA 02108
Voice: 617-878-0757 Fax: 617-227-8834


OFFICE OF COMMUNITY CORRECTIONS
Administrative Office Stephen V. Price, Executive Director
Pat Horne, Deputy Director of Operations Patty Campatelli, Statewide Program Supervisor
Karen Noonan, Office Manager Phyllis James, Administrative Assistant
Carol Campbell, Administrative Assistant Sandra Brown, Program Manager Sharon Brady, Program Specialist
Addie R. Walker, Program Specialist Kimberly Norton, Fiscal Manager
Melissa Repici, Fiscal Operations Supervisor Casey Bowdish, Student Research Assistant
Field Managers William Friedman, Regional Program Manager
Tim Gagnon, Regional Program Manager Pamerson Ifill, Regional Program Manager Kevin Kearney, Regional Program Manager
Vincent L. Lorenti, Regional Program Manager John Monahan, Regional Program Manager
John Quinn, Regional Program Manager
Juvenile Resource Center Boston Terry Ryan, Program Manager
Birchfield Aymer, Program Specialist Angela Griffin, Administrative Assistant
Juvenile Resource Center New Bedford Scott Gomes, Program Manager
Debra Ostroski, Administrative Assistant
i

Community Service Program David Skocik, Acting Statewide Supervisor
Christopher Cannata, Acting Assistant Statewide Supervisor Lisa Hickey, Assistant Statewide Supervisor
Michael LeCours, Assistant Statewide SupervisorTim Callahan, Acting Assistant Statewide Supervisor
Yardley Theolien, Assistant Statewide SupervisorCourt Services Assistant Court Services Coordinators Coordinators Michael Bolles Tina Bongo
Timothy Callahan Mark Casimiro Domenico Cirelli Brian Clune Connor Doherty Michael Collins
Nicole Dublin Martino Cunniff Michael Elias Patrick Curran Joseph Finn Nancy Demello
John Gibbons Robert Doherty William Mannix James Ferrera Luis Melendez Peter Feeley Walter Skinner John Glennon
Kevin Spitz Eric Iwaniec Paula Therrien Brian Kennedy
Julie Toner Amy Kinzer John Woodward Philip Kirdulis
Mark Marcinko Anthony Mitrano Edmond Nadeau Timothy Pasquale
Michael Ponti Willie Powell
Andre Reeves Christopher Resendes
Matthew Rogers Thomas Rosatto James Schindler Nicole Sidlowski
Michael Spellman Amber Walker Peter Williams Shawn Wright
ii
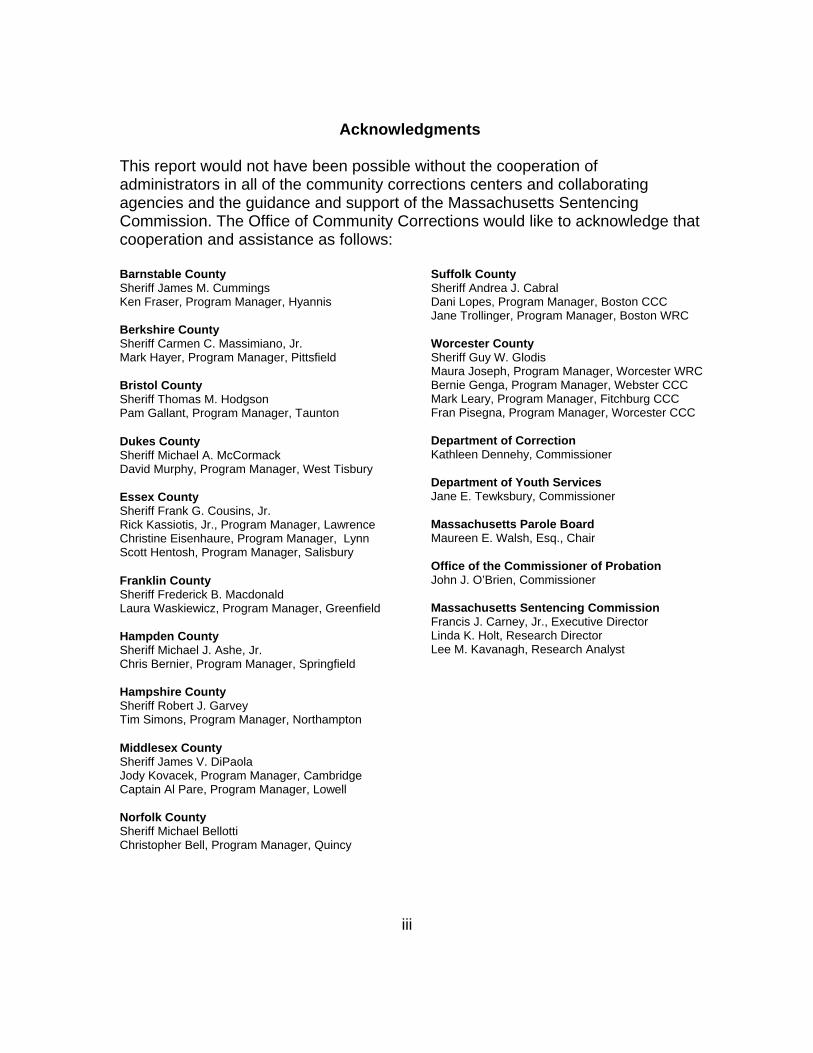
Acknowledgments
This report would not have been possible without the cooperation of administrators in all of the community corrections centers and collaborating agencies and the guidance and support of the Massachusetts Sentencing Commission. The Office of Community Corrections would like to acknowledge that cooperation and assistance as follows:
Barnstable County Suffolk County Sheriff James M. Cummings Sheriff Andrea J. Cabral Ken Fraser, Program Manager, Hyannis Dani Lopes, Program Manager, Boston CCC
Jane Trollinger, Program Manager, Boston WRC Berkshire County Sheriff Carmen C. Massimiano, Jr. Worcester County Mark Hayer, Program Manager, Pittsfield Sheriff Guy W. Glodis
Maura Joseph, Program Manager, Worcester WRC Bristol County Bernie Genga, Program Manager, Webster CCC Sheriff Thomas M. Hodgson Mark Leary, Program Manager, Fitchburg CCC Pam Gallant, Program Manager, Taunton Fran Pisegna, Program Manager, Worcester CCC
Dukes County Department of Correction Sheriff Michael A. McCormack Kathleen Dennehy, Commissioner David Murphy, Program Manager, West Tisbury
Department of Youth Services Essex County Jane E. Tewksbury, Commissioner Sheriff Frank G. Cousins, Jr. Rick Kassiotis, Jr., Program Manager, Lawrence Massachusetts Parole Board Christine Eisenhaure, Program Manager, Lynn Maureen E. Walsh, Esq., Chair Scott Hentosh, Program Manager, Salisbury
Office of the Commissioner of Probation Franklin County John J. O’Brien, Commissioner Sheriff Frederick B. Macdonald Laura Waskiewicz, Program Manager, Greenfield Massachusetts Sentencing Commission
Francis J. Carney, Jr., Executive Director Hampden County Linda K. Holt, Research Director Sheriff Michael J. Ashe, Jr. Lee M. Kavanagh, Research Analyst Chris Bernier, Program Manager, Springfield
Hampshire County Sheriff Robert J. Garvey Tim Simons, Program Manager, Northampton
Middlesex County Sheriff James V. DiPaola Jody Kovacek, Program Manager, Cambridge Captain Al Pare, Program Manager, Lowell
Norfolk County Sheriff Michael Bellotti Christopher Bell, Program Manager, Quincy
iii

iv
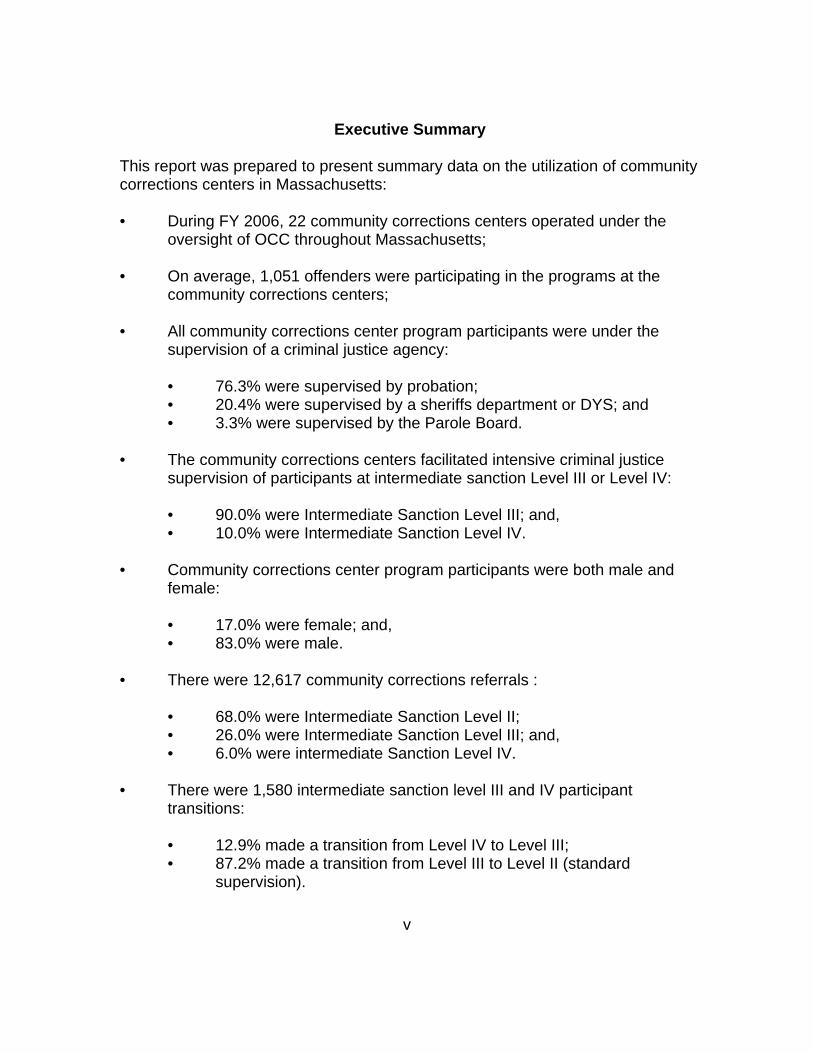
Executive Summary
This report was prepared to present summary data on the utilization of community corrections centers in Massachusetts:
• During FY 2006, 22 community corrections centers operated under the oversight of OCC throughout Massachusetts;
• On average, 1,051 offenders were participating in the programs at the community corrections centers;
• All community corrections center program participants were under the supervision of a criminal justice agency:
• 76.3% were supervised by probation; • 20.4% were supervised by a sheriffs department or DYS; and • 3.3% were supervised by the Parole Board.
• The community corrections centers facilitated intensive criminal justice supervision of participants at intermediate sanction Level III or Level IV:
• 90.0% were Intermediate Sanction Level III; and, • 10.0% were Intermediate Sanction Level IV.
• Community corrections center program participants were both male and female:
• 17.0% were female; and, • 83.0% were male.
• There were 12,617 community corrections referrals :
• 68.0% were Intermediate Sanction Level II; • 26.0% were Intermediate Sanction Level III; and, • 6.0% were intermediate Sanction Level IV.
• There were 1,580 intermediate sanction level III and IV participant transitions:
• 12.9% made a transition from Level IV to Level III; • 87.2% made a transition from Level III to Level II (standard
supervision).
v

• There were 3,005 intermediate sanction level III and IV participant terminations from community corrections:
• 15.2% of participants were terminated from Level IV; • 84.8% of participants were terminated from Level III.
• There were 15,681 referrals to the community service program. Among those referrals:
• 81.7% were male; • 20.9% were female.And:• 93.5% were adults; • 9.1% were juveniles.
• There were 901 participants who took the GED examination in FY 2006:
• 30.7% of those participants passed a portion of the exam; • 11.9% of those participants were awarded their GED; and • 57.2% of those participants did not pass the exam.
• There were 1,250 participants placed in jobs in FY 2006
• 13.2% of those participants received placement into part time jobs; • 86.7% of those participants received placement into full time jobs.
• There were 1,304 participants placed in aftercare in FY 2006.
• There were 140,198 specimens screened for illicit drugs in FY 2006:
• 83.0% reported negative results; • 17.0% reported positive results.
vi

vii

viii

Table of Contents
INTRODUCTION . . . . . . . . . . . . . . . . . . . . . . . . . . . . . . . . . . . . . . . . . . . . . . . . 1
METHOD . . . . . . . . . . . . . . . . . . . . . . . . . . . . . . . . . . . . . . . . . . . . . . . . . . . . . . 6 Study Sample . . . . . . . . . . . . . . . . . . . . . . . . . . . . . . . . . . . . . . . . . . . . . . 6 Study Period . . . . . . . . . . . . . . . . . . . . . . . . . . . . . . . . . . . . . . . . . . . . . . 6 Data Collection . . . . . . . . . . . . . . . . . . . . . . . . . . . . . . . . . . . . . . . . . . . . . 6 Data Analysis . . . . . . . . . . . . . . . . . . . . . . . . . . . . . . . . . . . . . . . . . . . . . . 8 Data Quality . . . . . . . . . . . . . . . . . . . . . . . . . . . . . . . . . . . . . . . . . . . . . . . 8
FINDINGS . . . . . . . . . . . . . . . . . . . . . . . . . . . . . . . . . . . . . . . . . . . . . . . . . . . . . 9 TOTAL POPULATION . . . . . . . . . . . . . . . . . . . . . . . . . . . . . . . . . . . . . . . 9 POPULATION BY GENDER . . . . . . . . . . . . . . . . . . . . . . . . . . . . . . . . . 16 NEW PARTICIPANTS . . . . . . . . . . . . . . . . . . . . . . . . . . . . . . . . . . . . . . 18 TRANSITIONS AND TERMINATIONS . . . . . . . . . . . . . . . . . . . . . . . . . 20 GED . . . . . . . . . . . . . . . . . . . . . . . . . . . . . . . . . . . . . . . . . . . . . . . . . . . . 28 JOB PLACEMENT . . . . . . . . . . . . . . . . . . . . . . . . . . . . . . . . . . . . . . . . . 30 AFTERCARE . . . . . . . . . . . . . . . . . . . . . . . . . . . . . . . . . . . . . . . . . . . . . 32 DRUG TESTING . . . . . . . . . . . . . . . . . . . . . . . . . . . . . . . . . . . . . . . . . . 34 COMMUNITY SERVICE . . . . . . . . . . . . . . . . . . . . . . . . . . . . . . . . . . . . 36
SUMMARY . . . . . . . . . . . . . . . . . . . . . . . . . . . . . . . . . . . . . . . . . . . . . . . . . . . . 39
APPENDIX . . . . . . . . . . . . . . . . . . . . . . . . . . . . . . . . . . . . . . . . . . . . . . . . . . . . 42
ix
List of Figures
Figure 1. Number of Community Corrections Centers, 1998 to 2006 . . . . . . . . . 4 Figure 2. Sentencing Guidelines Grid . . . . . . . . . . . . . . . . . . . . . . . . . . . . . . . . 5 Figure 3. Total Population by Month . . . . . . . . . . . . . . . . . . . . . . . . . . . . . . . . . . 9Figure 4. Average Population by Center . . . . . . . . . . . . . . . . . . . . . . . . . . . . . 10 Figure 5. Population by Supervising Agency . . . . . . . . . . . . . . . . . . . . . . . . . . 11 Figure 6. Average Population by Supervising Agency and Center . . . . . . . . . 13 Figure 7. Average Population by Intermediate Sanction Level . . . . . . . . . . . . 14 Figure 8. Average Population by Intermediate Sanctions Level and Center . . 15Figure 9. Average Population by Gender . . . . . . . . . . . . . . . . . . . . . . . . . . . . . 16 Figure 10. Average Population by Gender and Center . . . . . . . . . . . . . . . . . . 17 Figure 11. Referrals by Level . . . . . . . . . . . . . . . . . . . . . . . . . . . . . . . . . . . . . . 18 Figure 12. Referrals by Level and Agency . . . . . . . . . . . . . . . . . . . . . . . . . . . . 19 Figure 13. Transitions and Terminations from Centers . . . . . . . . . . . . . . . . . . 21 Figure 14. Transitions by Month and Level . . . . . . . . . . . . . . . . . . . . . . . . . . . 22 Figure 15. Transitions by Center and Level . . . . . . . . . . . . . . . . . . . . . . . . . . . 23 Figure 16. Terminations by Month and Level . . . . . . . . . . . . . . . . . . . . . . . . . . 24 Figure 17. Terminations by Center and Level . . . . . . . . . . . . . . . . . . . . . . . . . 25 Figure 18. Termination Reasons for Level III, IV . . . . . . . . . . . . . . . . . . . . . . . 26 Figure 19. Termination Reasons for Level II . . . . . . . . . . . . . . . . . . . . . . . . . . 27 Figure 20. GED Performance by Center . . . . . . . . . . . . . . . . . . . . . . . . . . . . . 29 Figure 21. Job Placement Performance by Center . . . . . . . . . . . . . . . . . . . . . 31 Figure 23. Aftercare Placement by Center . . . . . . . . . . . . . . . . . . . . . . . . . . . . 33 Figure 23. Percentage of Positive and Negative Drug Test Results by Center 35Figure 25. Adult Community Service Referrals by County . . . . . . . . . . . . . . . . 37 Figure 26. Juvenile Community Service Referrals by County . . . . . . . . . . . . . 38
x
List of Tables
Table 1. Community Corrections Centers Included in Study Sample . . . . . . . 43 Table 2. Average Population in Community Corrections Centers by Supervising
Agency, Intermediate Sanctions Level, Gender, and Reporting Week. 44Table 3. Average Population in Community Corrections Centers by Supervising
Agency, Intermediate Sanctions Level, Gender, and Center . . . . . . . 45 Table 4. Summary of Population Movement by Reporting Week . . . . . . . . . . 46 Table 5. Summary of Population Movement by Center . . . . . . . . . . . . . . . . . . 47
xi

xii
OFFICE OF COMMUNITY CORRECTIONS
UTILIZATION OF COMMUNITY CORRECTIONS CENTERS
STATISTICAL REPORT, FY 2006
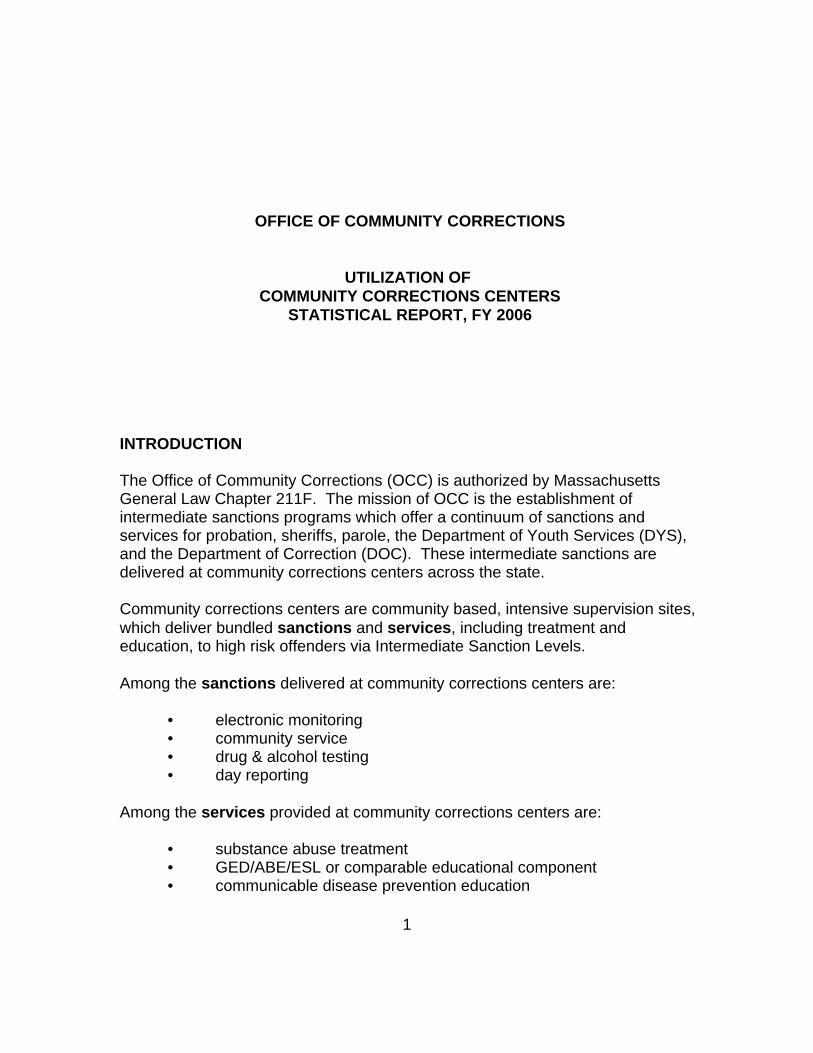
INTRODUCTION
The Office of Community Corrections (OCC) is authorized by Massachusetts General Law Chapter 211F. The mission of OCC is the establishment of intermediate sanctions programs which offer a continuum of sanctions and services for probation, sheriffs, parole, the Department of Youth Services (DYS), and the Department of Correction (DOC). These intermediate sanctions are delivered at community corrections centers across the state.
Community corrections centers are community based, intensive supervision sites, which deliver bundled sanctions and services, including treatment and education, to high risk offenders via Intermediate Sanction Levels.
Among the sanctions delivered at community corrections centers are:
• electronic monitoring • community service • drug & alcohol testing • day reporting
Among the services provided at community corrections centers are:
• substance abuse treatment • GED/ABE/ESL or comparable educational component • communicable disease prevention education
1

Office of Community Corrections
• job readiness training and placement • referral to Department of Public Health or Department of Mental
Health service providers • women's services
Community corrections centers are designed to provide a targeted criminal justice response to a specific group of offenders. Those offenders meet that response at the Community Corrections Center by assignment to an Intermediate Sanction Level. Intermediate Sanction Levels III and IV are intended for those offenders who possess a serious criminal history and are chronic substance abusers. In addition, this group may be underemployed or unemployed. Finally, Intermediate Sanction Levels III and IV are reserved for those offenders who hold a strong potential for eventual incarceration or who have served a term of incarceration and are returning to the community.
Intermediate Sanction Levels are adopted from the Massachusetts Sentencing Commission's Report to the General Court, April 10, 1996:
The commission . . . adopted the notion of a continuum of four levels of intermediate sanctions, based on the constraints on personal liberty associated with the sanction . . .
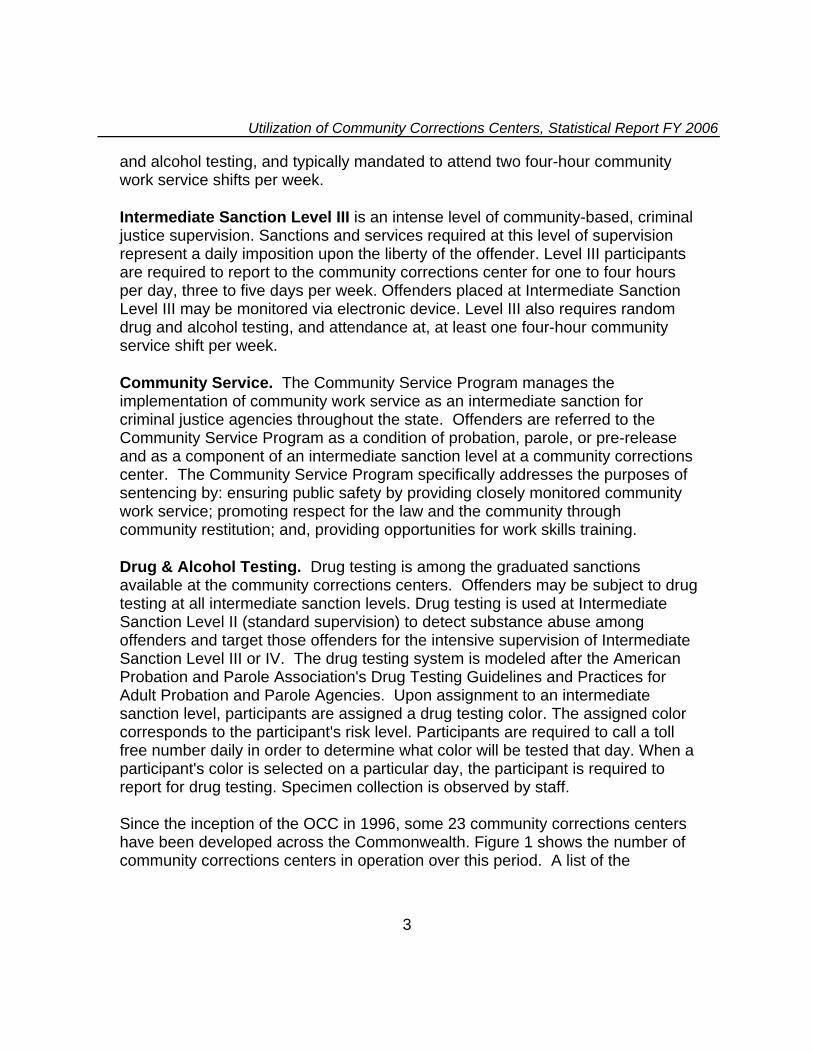
Figure 2 shows the sentencing guidelines grid proposed by the Massachusetts Sentencing Commission and the manner in which intermediate sanctions are integrated into the sentencing guidelines. The intermediate sanction levels represent the practical method by which a combination of sanctions and services are assigned to offenders. Community corrections centers are designed to provide for the intensive supervision of offenders, delivering a bundled program of sanctions and services to offenders at Intermediate Sanction Level III and Level IV. Community corrections centers also deliver sanctions to some offenders at Intermediate Sanctions Level II including community service and drug testing.
Intermediate Sanction Level IV is the most intense level of community based, criminal justice supervision. Sanctions and services required at this level of supervision represent a twenty-four hour restriction upon the liberty of the offender. Level IV participants are required to report to the community corrections center for four to six hours per day, six days per week. Additionally, offenders placed at Intermediate Sanction Level IV are monitored twenty-four hours per day via electronic device, required to submit to the highest category of random drug
2
Utilization of Community Corrections Centers, Statistical Report FY 2006
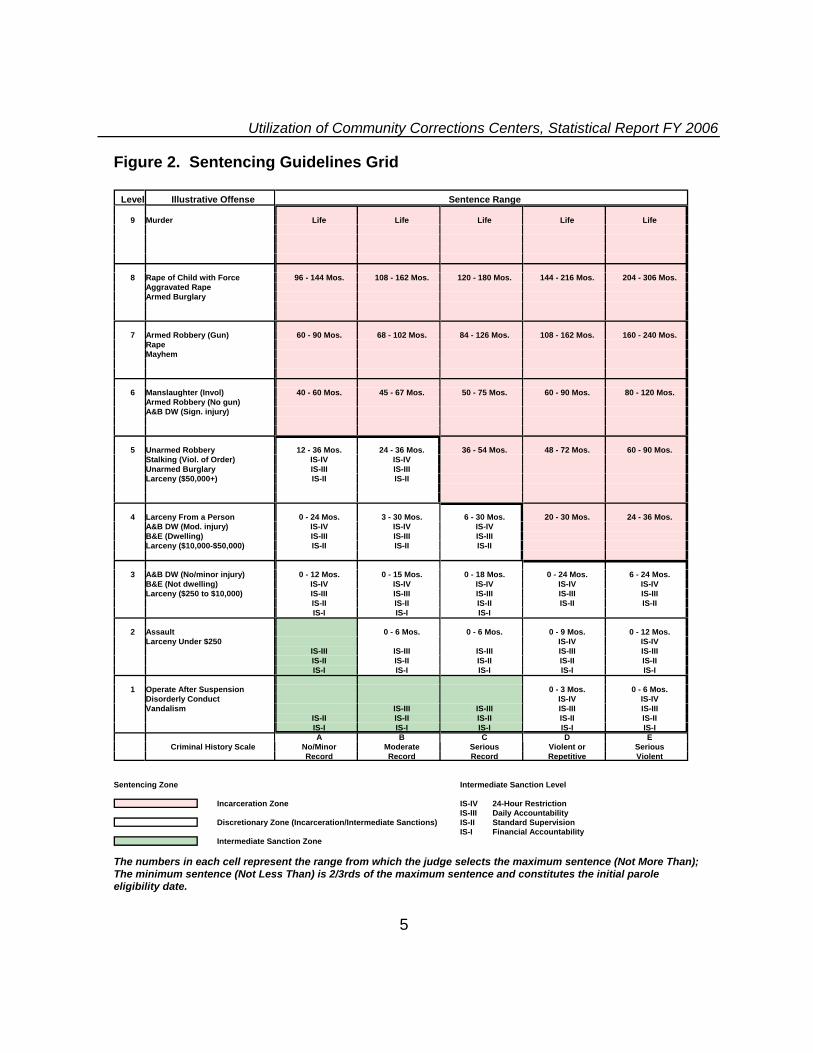
and alcohol testing, and typically mandated to attend two four-hour community work service shifts per week.
Intermediate Sanction Level III is an intense level of community-based, criminal justice supervision. Sanctions and services required at this level of supervision represent a daily imposition upon the liberty of the offender. Level III participants are required to report to the community corrections center for one to four hours per day, three to five days per week. Offenders placed at Intermediate Sanction Level III may be monitored via electronic device. Level III also requires random drug and alcohol testing, and attendance at, at least one four-hour community service shift per week.
Community Service. The Community Service Program manages the implementation of community work service as an intermediate sanction for criminal justice agencies throughout the state. Offenders are referred to the Community Service Program as a condition of probation, parole, or pre-release and as a component of an intermediate sanction level at a community corrections center. The Community Service Program specifically addresses the purposes of sentencing by: ensuring public safety by providing closely monitored community work service; promoting respect for the law and the community through community restitution; and, providing opportunities for work skills training.
Drug & Alcohol Testing. Drug testing is among the graduated sanctions available at the community corrections centers. Offenders may be subject to drug testing at all intermediate sanction levels. Drug testing is used at Intermediate Sanction Level II (standard supervision) to detect substance abuse among offenders and target those offenders for the intensive supervision of Intermediate Sanction Level III or IV. The drug testing system is modeled after the American Probation and Parole Association's Drug Testing Guidelines and Practices for Adult Probation and Parole Agencies. Upon assignment to an intermediate sanction level, participants are assigned a drug testing color. The assigned color corresponds to the participant's risk level. Participants are required to call a toll free number daily in order to determine what color will be tested that day. When a participant's color is selected on a particular day, the participant is required to report for drug testing. Specimen collection is observed by staff.
Since the inception of the OCC in 1996, some 23 community corrections centers have been developed across the Commonwealth. Figure 1 shows the number of community corrections centers in operation over this period. A list of the
3

Office of Community Corrections
community corrections centers and their dates of operation can be found in the Appendix.
This report provides summary statistical data on the utilization of community corrections centers in FY 2006. It is intended to inform judges, probation and parole officers, correctional staff, policy makers, and most importantly, the public about the development of significant criminal justice policy and practices in Massachusetts.
Figure 1. Number of Community Corrections Centers, 1998 to 2006
2 4
7 8
11
17 18
21 23 22 21 21 21 22 22
0
5
10
15
20
25 22 22
Jun-
98
Dec
-98
Jun-
99
Dec
-99
Jun-
00
Dec
-00
Jun-
01
Dec
-01
Jun-
02
Dec
-02
Jun-
03
Dec
-03
Jun-
04
Dec
-04
Jun-
05
Dec
-06
Jun-
06
4
Utilization of Community Corrections Centers, Statistical Report FY 2006
Figure 2. Sentencing Guidelines Grid
9
8
7 60 - 90 Mos. 68 - 102 Mos. 84 - 126 Mos. 108 - 162 Mos. 160 - 240 Mos.
6 40 - 60 Mos. 45 - 67 Mos. 50 - 75 Mos. 60 - 90 Mos. 80 - 120 Mos.
)
5 12 - 36 Mos. 24 - 36 Mos. 36 - 54 Mos. 48 - 72 Mos. 60 - 90 Mos.
Unarmed Burglary Larceny ($50,000+)
4 )
Larceny (
3 ( )
Larceny (
2
1
Vandalism
A B C D E Moderate Serious Serious
Violent
Level Illustrative Offense Sentence Range
Murder Life Life Life Life Life
Rape of Child with Force 96 - 144 Mos. 108 - 162 Mos. 120 - 180 Mos. 144 - 216 Mos. 204 - 306 Mos. Aggravated Rape Armed Burglary
Armed Robbery (Gun) Rape Mayhem
Manslaughter (Invol) Armed Robbery (No gun) A&B DW (Sign. injury
Unarmed Robbery Stalking (Viol. of Order) IS-IV IS-IV
IS-III IS-III IS-II IS-II
Larceny From a Person 0 - 24 Mos. 3 - 30 Mos. 6 - 30 Mos. 20 - 30 Mos. 24 - 36 Mos. A&B DW (Mod. injury IS-IV IS-IV IS-IV B&E (Dwelling) IS-III IS-III IS-III
$10,000-$50,000) IS-II IS-II IS-II
A&B DW No/minor injury 0 - 12 Mos. 0 - 15 Mos. 0 - 18 Mos. 0 - 24 Mos. 6 - 24 Mos. B&E (Not dwelling) IS-IV IS-IV IS-IV IS-IV IS-IV
$250 to $10,000) IS-III IS-III IS-III IS-III IS-III IS-II IS-II IS-II IS-II IS-II IS-I IS-I IS-I
Assault 0 - 6 Mos. 0 - 6 Mos. 0 - 9 Mos. 0 - 12 Mos. Larceny Under $250 IS-IV IS-IV
IS-III IS-III IS-III IS-III IS-III IS-II IS-II IS-II IS-II IS-II IS-I IS-I IS-I IS-I IS-I
Operate After Suspension 0 - 3 Mos. 0 - 6 Mos. Disorderly Conduct IS-IV IS-IV
IS-III IS-III IS-III IS-III IS-II IS-II IS-II IS-II IS-II IS-I IS-I IS-I IS-I IS-I
Criminal History Scale No/Minor Violent or Record Record Record Repetitive
Sentencing Zone Intermediate Sanction Level
Incarceration Zone IS-IV 24-Hour Restriction
Discretionary Zone (Incarceration/Intermediate Sanctions)
Intermediate Sanction Zone
IS-III IS-II IS-I
Daily Accountability Standard Supervision Financial Accountability
The numbers in each cell represent the range from which the judge selects the maximum sentence (Not More Than); The minimum sentence (Not Less Than) is 2/3rds of the maximum sentence and constitutes the initial parole eligibility date.
5

Office of Community Corrections
METHOD
Study Sample. All community corrections centers operating during FY 2006 were included in the sample. A list of the community corrections centers and their dates of operation is contained in the Appendix. In the tables, each of the community corrections centers is referred to by the city or town in which it is located. Some of the centers specialize services for select groups of offenders. The following abbreviations have been adopted:
• CCC community corrections center (adult males and females) • JRC juvenile resource center (juvenile males) • WRC women’s resource center (adult females)
For example Worcester CCC refers to the Worcester Community Corrections Center and Worcester WRC refers to the Worcester Women’s Resource Center.
Study Period. The study period covers FY 2006, or July 1, 2005 through June 30, 2006.
Data Collection. Data collection was done from monthly utilization reports and community service log reports submitted by each community corrections center and the Community Service Program to the OCC.
Monthly utilization reports formed one basis of the data collection for this report. Several variables of data were collected. These included variables related to the population flow through the center, and those related to the status of participants within the center. For each category of data that was collected the data was separated by intermediate sanction level (II, III or IV), the gender of the offender, and the supervising agency (probation, parole, sheriff, DYS, or DOC). Data was generally reported in the form of numbers of offenders participating in the program at the end of each month in a particular category, or the number served during each month. The categories of data are as follows:
New Participants. The monthly utilization reports provided the number of new participants by intermediate sanction level, gender and supervising agency for the reporting period.
Transitions. The monthly utilization reports provided data regarding offender progression from one level of supervision to another. This category was called transition. This includes the movement of a participant
6
Utilization of Community Corrections Centers, Statistical Report FY 2006
from Intermediate Sanction Level IV to Intermediate Sanction Level III, indicated as a Level IV transition or from Intermediate Sanction Level III to Intermediate Sanction Level II (standard supervision), indicated as Level III transition.
Terminations. The monthly utilization report also provided data regarding offender non-compliance that resulted in discharge from the community corrections center which was labeled termination. Such data was separated by level, gender and supervising agency and was further classified regarding the reason for offender termination. The reasons for termination from intermediate sanction level III and IV were codified on the form and included the following: warrant issued, violation of probation pending, incarcerated, returned to higher custody, sentence expired or paroled, placed in residential or inpatient treatment, transferred to another community corrections center, unable to continue due to medical issues. A separate set of codified termination reasons devised for intermediate sanction level II were the following: ninety days clean, excessive positive results or failure to report with no corrective action, violation of probation pending, returned to higher custody, transferred to another CCC or jurisdiction.
Community corrections centers also reported data corresponding to categories of program services or sanctions. These categories include GED, job placement, aftercare status, and drug testing.
GED. The monthly utilization reports provided the number of participants that took the GED examination, the number of participants that passed a portion of the examination, and the number of participants that passed the examination and received their GED.
Job Placement. The monthly utilization reports provided the number of participants that were placed in a part time job and the number of participants that were placed in a full time job.
Aftercare. The monthly utilization report provided the number of participants that made a successful transition to Intermediate Sanction Level II (standard supervision) and were placed in an aftercare program of low restriction or voluntary nature.
7

Office of Community Corrections
Drug Testing. The monthly utilization report provided the number of participants for which a negative drug test result was reported, the number of participants for which one or more positive results were reported on a particular specimen, and the number of participants that tested positive for a particular substance such as, cocaine, opiate, THC, etc.
Community Service Logs provided the second source of data collection and provided aggregate monthly information on the number of referrals to the program for each court site. Because community service is provided at court sites as well as community corrections center sites, these logs were maintained on a county level rather than a community corrections center level.
Data Analysis. The 12 monthly utilization reports for each center along with the community service logs formed the basis of the analysis. Some of the analysis displays aggregated data across all community corrections centers for each week. Other data analysis shows the average reported utilization by center across the entire study period. These averages did not include missing reports.
Data Quality. Monthly utilization reports were received from all of the community corrections centers for the entire study period.
8

Utilization of Community Corrections Centers, Statistical Report FY 2006
FINDINGS
TOTAL POPULATION
Figure 3 shows the total population in the 22 community corrections centers for each reporting month in the study. In March of 2006, community corrections centers reported a high total of 1,184 Intermediate Sanction Level III and IV participants. This was the second consecutive year in which the high total occurred in March. In November 2005, community corrections centers reported a low total of 963 intermediate sanction level participants.
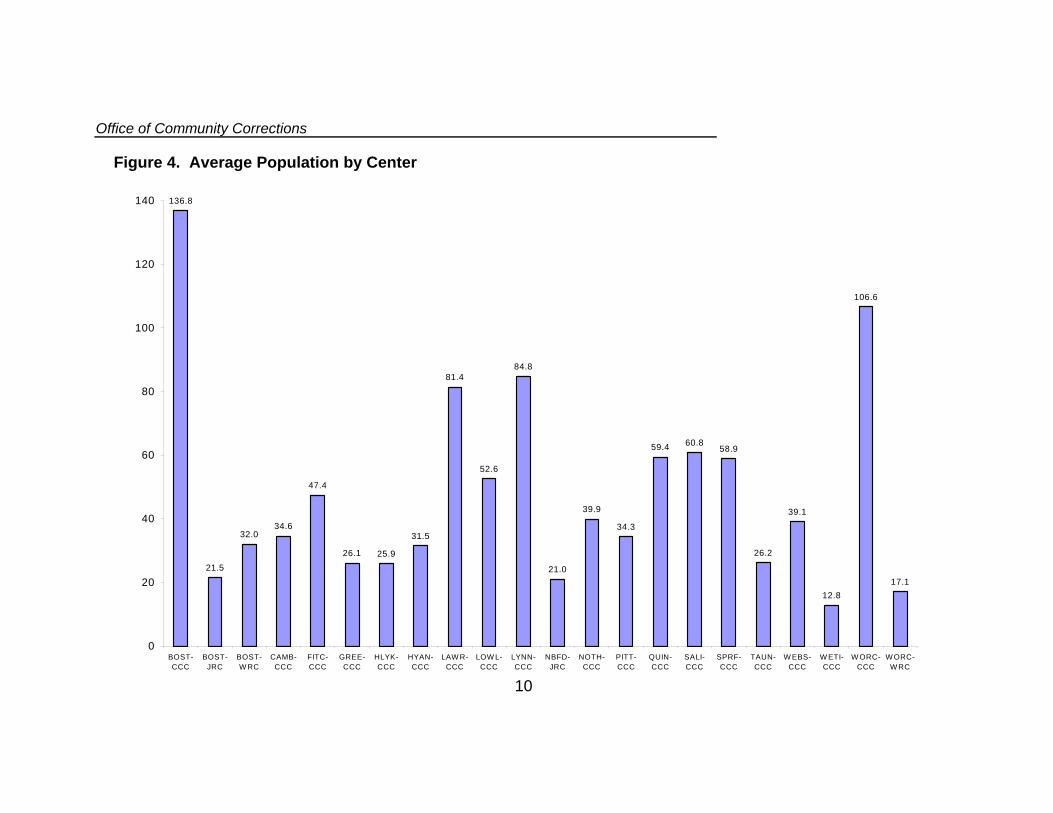
Figure 4 shows the average population in each of the community corrections centers for the study period. The community corrections centers ranged from an average of 12.8 participants at the West Tisbury CCC to an average of 136.8 participants at the Boston CCC. The cumulative average attendance across all centers was 1050.8 participants. Additional data on each community corrections center (minimum and maximum population) is shown in the Appendix.
Figure 3. Total Population by Month
997999
986
1000
963
1019
1054
1123
1184
1047
1121 1116
900.0
1000.0
1100.0
1200.0
Jul-05 Aug-05 Sep-05 Oct-05 Nov-05 Dec-05 Jan-06 Feb-06 Mar-06 Apr-06 May-06 Jun-06
9
Office of Community Corrections
Figure 4. Average Population by Center
136.8 140
120
100
80
60
40
20
0
21.5
32.0 34.6
47.4
26.1 25.9
31.5
81.4
52.6
84.8
21.0
39.9
34.3
59.4 60.8 58.9
26.2
39.1
12.8
106.6
BOST- BOST- BOST- CAMB- FITC- GREE- HLYK- HYAN- LAW R- LOW L- LYNN- NBFD- NOTH- PITT- QUIN- SALI- SPRF- TAUN- W EBS- W ETI- W ORC- W ORC-CCC JRC W RC CCC CCC CCC CCC CCC CCC CCC CCC JRC CCC CCC CCC CCC CCC CCC CCC CCC CCC W RC
10
17.1
Utilization of Community Corrections Centers, Statistical Report FY 2006
POPULATION BY SUPERVISING AGENCY
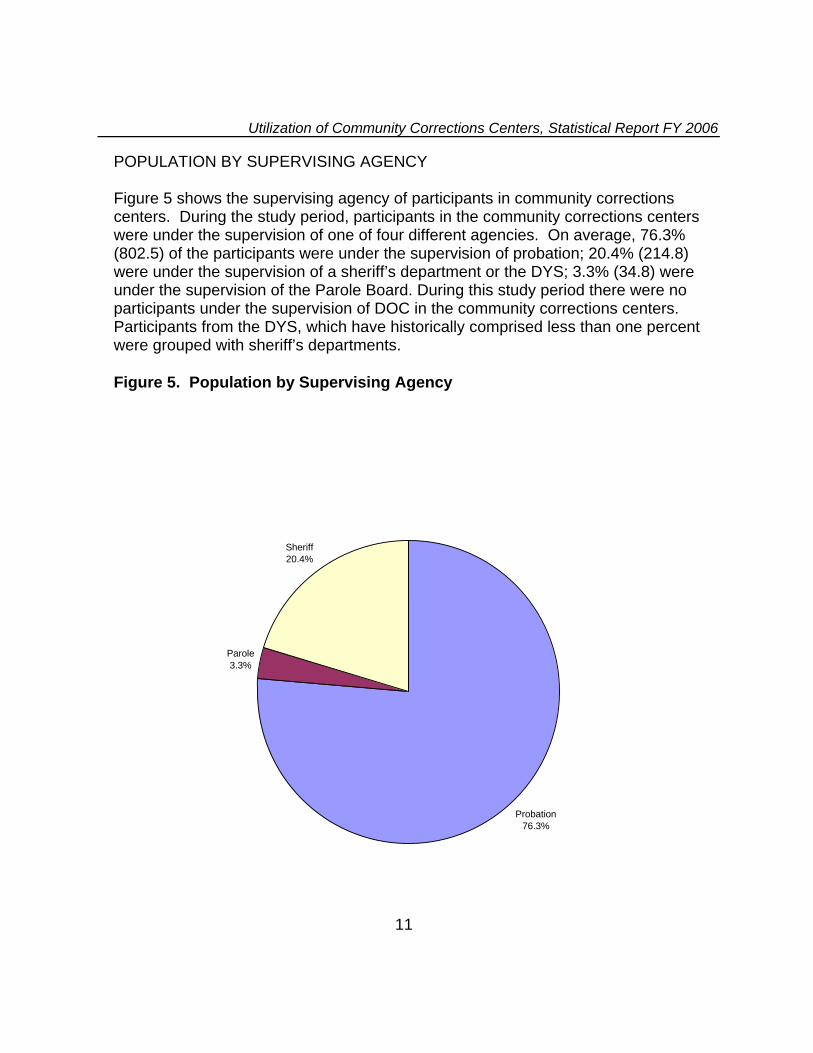
Figure 5 shows the supervising agency of participants in community corrections centers. During the study period, participants in the community corrections centers were under the supervision of one of four different agencies. On average, 76.3% (802.5) of the participants were under the supervision of probation; 20.4% (214.8) were under the supervision of a sheriff’s department or the DYS; 3.3% (34.8) were under the supervision of the Parole Board. During this study period there were no participants under the supervision of DOC in the community corrections centers. Participants from the DYS, which have historically comprised less than one percent were grouped with sheriff’s departments.
Figure 5. Population by Supervising Agency
le
i
Probation 76.3%
Paro3.3%
Sher ff 20.4%
11
Office of Community Corrections
Figure 6 shows the supervising agency of the participants at each of the community corrections centers during FY 2006. There were large differences in the population at each of the centers. Among adult centers, Taunton CCC had the highest average proportion of probation supervised participants (98.4%); Northampton CCC had the highest average proportion of parole supervised participants (34.2%); and, Worcester CCC had the highest average proportion of sheriff’s supervised participants (50.7%). The Boston JRC had the highest average proportion of DYS supervised participants (2.7%).
12

Utilization of Community Corrections Centers, Statistical Report FY 2006
Figure 6. Average Population by Supervising Agency and Center
0%
10%
20%
30%
40%
50%
60%
70%
80%
90%
100%
Sheriff le
i
CCC BOST- CAMB-
CCC CCC GREE-CCC
HLYK-CCC
HYAN-CCC
LAWR-CCC CCC
LYNN- NBFD- NBPT-CCC CCC CCC
SPRF-CCC
TAUN-CCC CCC
I-CCC CCC
23.9 0.6 4.0 1.4 13.5 0.0 0.0 1.4 7.8 5.6 30.8 0.1 14.5 0.8 9.3 15.3 10.2 0.0 14.3 3.8 54.1 3.4
Paro 2.8 0.0 0.8 0.1 0.9 0.7 0.5 3.3 2.8 0.5 2.8 0.0 1.5 11.8 0.7 2.3 2.3 0.4 0.0 0.8 0.0 0.1
Probat on 110.2 20.9 27.2 33.1 33.4 25.4 25.4 27.0 70.8 46.6 51.8 20.9 23.9 21.8 49.5 43.3 46.4 25.8 24.8 8.3 52.5 13.6
BOST- BOST-JRC WRC
FITC- LOWL-CCC JRC
NOTH-CCC
PITT- QUIN- WEBS- WET WORC- WORC-WRC
13

Office of Community Corrections
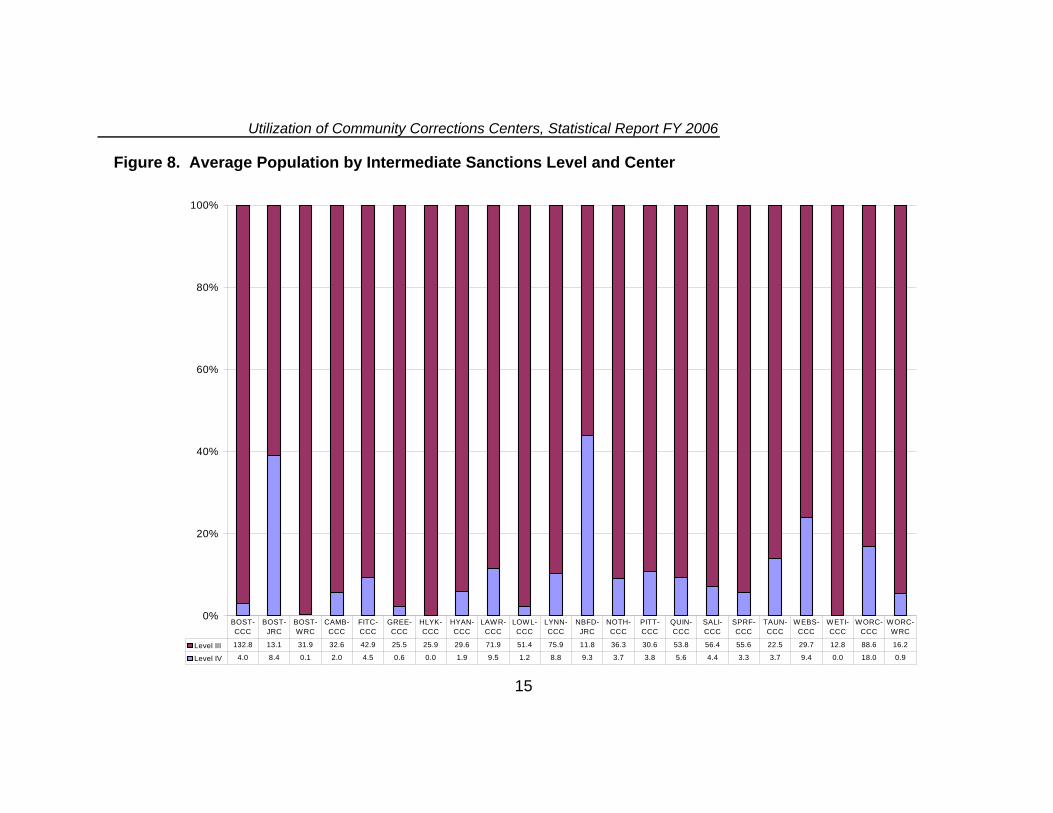
POPULATION BY LEVEL Figure 7 shows the distribution of the population in community corrections centers by intermediate sanction level in FY 2006. On average, 90% of the participants were supervised at Intermediate Sanction Level III and 10% were supervised at Intermediate Sanction Level IV. Figure 8 shows the distribution of the population by intermediate sanction level for each of the 22 community corrections centers. The New Bedford JRC had the highest proportion of participants at Intermediate Sanction Level IV (44.0%). West Tisbury CCC and Holyoke CCC had the highest proportion of participants at Intermediate Sanction Level III (100%).
Figure 7. Average Population by Intermediate Sanction Level
Level IV 10%
Level III 90%
14
Utilization of Community Corrections Centers, Statistical Report FY 2006
Figure 8. Average Population by Intermediate Sanctions Level and Center
0% BOST-CCC
BOST-CCC CCC CCC CCC CCC CCC
NOTH-CCC CCC CCC CCC CCC CCC CCC
20%
40%
60%
80%
100%
Level III 132.8 13.1 31.9 32.6 42.9 25.5 25.9 29.6 71.9 51.4 75.9 11.8 36.3 30.6 53.8 56.4 55.6 22.5 29.7 12.8 88.6 16.2
Level IV 4.0 8.4 0.1 2.0 4.5 0.6 0.0 1.9 9.5 1.2 8.8 9.3 3.7 3.8 5.6 4.4 3.3 3.7 9.4 0.0 18.0 0.9
JRC BOST-WRC
CAMB- FITC- GREE-CCC
HLYK- HYAN- LAWR- LOWL- LYNN-CCC
NBFD-JRC
PITT- QUIN- SALI- SPRF-CCC
TAUN- WEBS- WETI-CCC
WORC- WORC-WRC
15

Office of Community Corrections
POPULATION BY GENDER
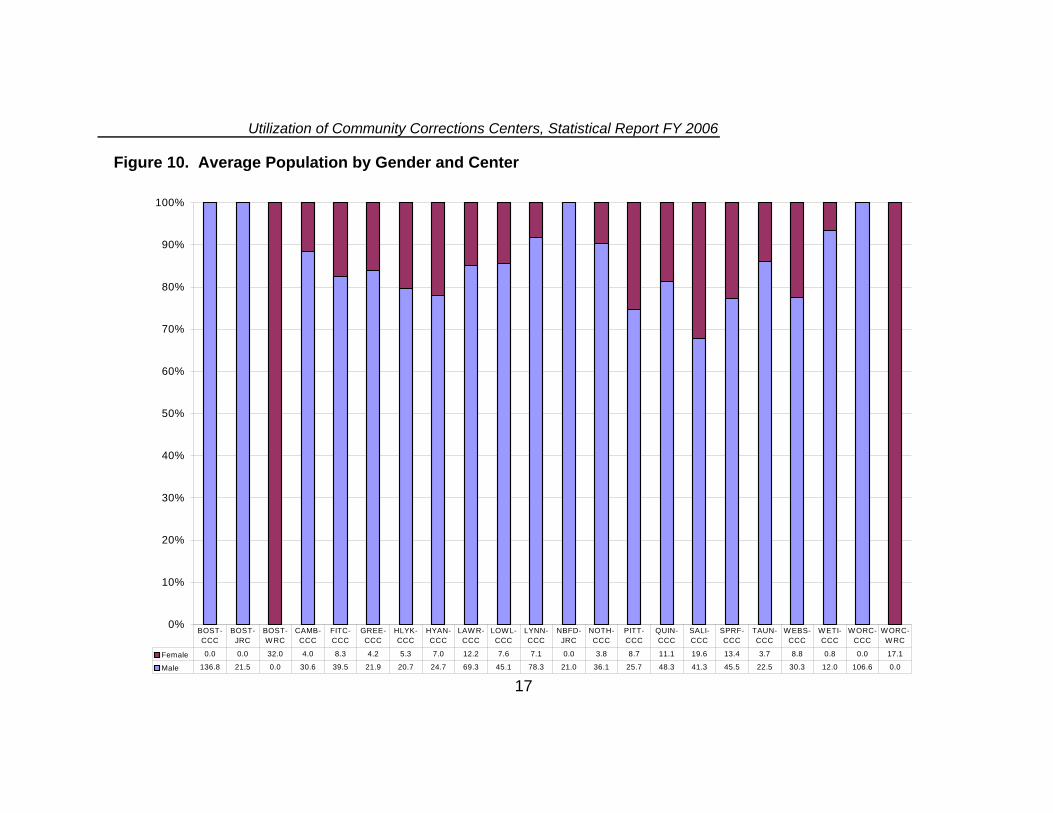
The community corrections centers provided services to both male and female participants. As shown in Figure 9, on average, 17% of the participants in the community corrections centers were female and 83% were male. Figure 10 shows the distribution of population by gender for each of the 22 community corrections centers. Two of the centers provided services exclusively to female participants: Boston WRC and Worcester WRC. There were corresponding male centers at the Boston CCC and Worcester CCC. The two Juvenile Resource Centers (Boston JRC and New Bedford JRC) provided services to male participants only. Among the centers providing services to both male and female participants, West Tisbury CCC had the highest average proportion of males (93.5%) and Salisbury CCC had the highest average proportion of females (32.2%).
Figure 9. Average Population by Gender
Male 83%
Female 17%
16
Utilization of Community Corrections Centers, Statistical Report FY 2006
Figure 10. Average Population by Gender and Center
0%
le
Male
CCC CCC CCC CCC CCC CCC CCC CCC CCC CCC
10%
20%
30%
40%
50%
60%
70%
80%
90%
100%
Fema 0.0 0.0 32.0 4.0 8.3 4.2 5.3 7.0 12.2 7.6 7.1 0.0 3.8 8.7 11.1 19.6 13.4 3.7 8.8 0.8 0.0 17.1
136.8 21.5 0.0 30.6 39.5 21.9 20.7 24.7 69.3 45.1 78.3 21.0 36.1 25.7 48.3 41.3 45.5 22.5 30.3 12.0 106.6 0.0
BOST-CCC
BOST-JRC
BOST-WRC
CAMB- FITC- GREE-CCC
HLYK-CCC
HYAN- LAW R- LOW L-CCC
LYNN-CCC
NBFD-JRC
NOTH- PITT- QUIN- SALI-CCC
SPRF-CCC
TAUN- WEBS- WETI- WORC-CCC
WORC-WRC
17
Office of Community Corrections
NEW PARTICIPANTS
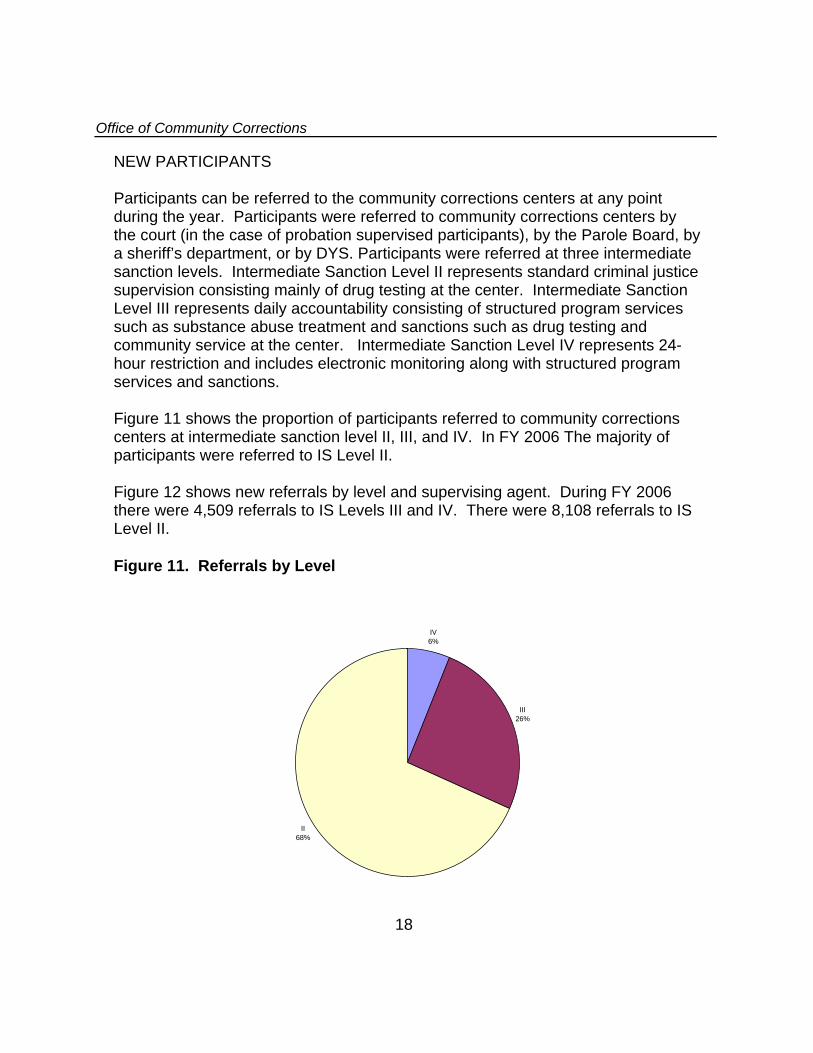
Participants can be referred to the community corrections centers at any point during the year. Participants were referred to community corrections centers by the court (in the case of probation supervised participants), by the Parole Board, by a sheriff’s department, or by DYS. Participants were referred at three intermediate sanction levels. Intermediate Sanction Level II represents standard criminal justice supervision consisting mainly of drug testing at the center. Intermediate Sanction Level III represents daily accountability consisting of structured program services such as substance abuse treatment and sanctions such as drug testing and community service at the center. Intermediate Sanction Level IV represents 24hour restriction and includes electronic monitoring along with structured program services and sanctions.
Figure 11 shows the proportion of participants referred to community corrections centers at intermediate sanction level II, III, and IV. In FY 2006 The majority of participants were referred to IS Level II.
Figure 12 shows new referrals by level and supervising agent. During FY 2006 there were 4,509 referrals to IS Levels III and IV. There were 8,108 referrals to IS Level II.
Figure 11. Referrals by Level
IV 6%
26%
II 68%
III
18

Utilization of Community Corrections Centers, Statistical Report FY 2006
Figure 12. Referrals by Level and Agency
Probation Parole Sheriff/DYS Total N % N % N % N %
Level 4 234 2% 4 1% 487 35% 725 6%
Level 3 2729 26% 180 23% 875 63% 3784 30% Elmo 222 2% 51 7% 515 37% 788 6% No Elmo 2507 24% 129 17% 360 26% 2996 24%
Subtotal 2963 28% 184 24% 1362 98% 4509 36%
Level 2 7486 72% 595 76% 27 2% 8108 64%
Total 10449 100% 779 100% 1389 100% 12617 100%
19

Office of Community Corrections
TRANSITIONS AND TERMINATIONS
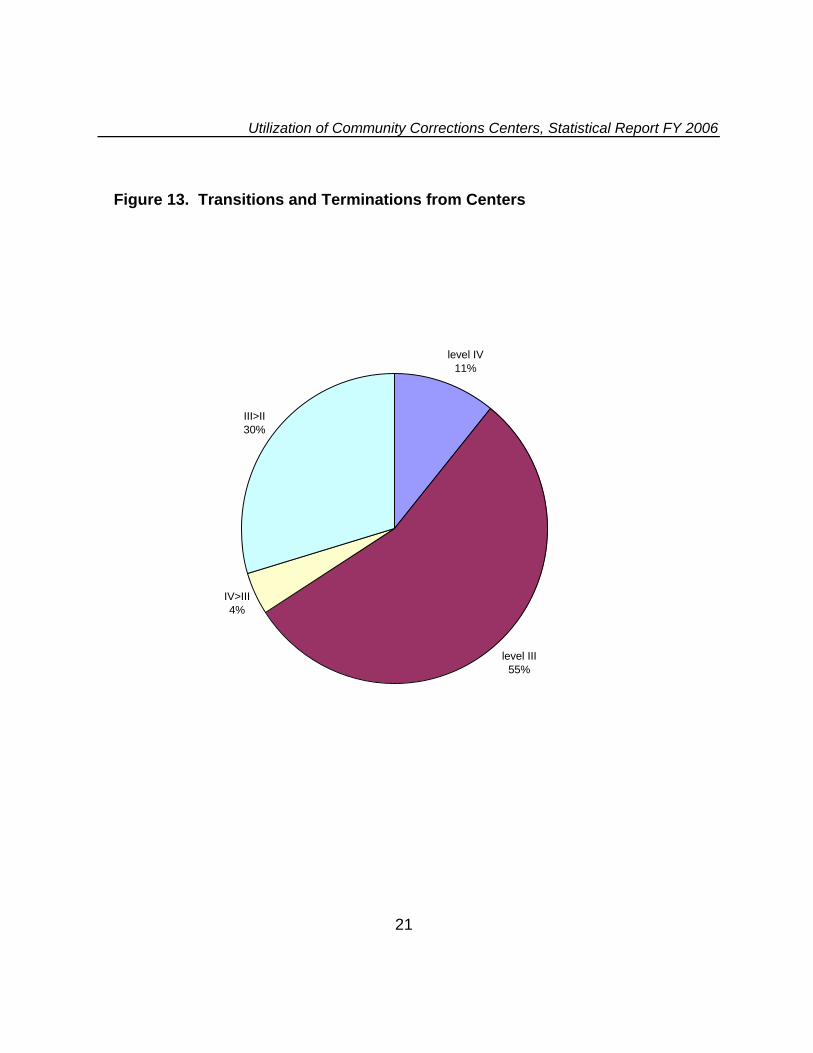
The terms transition and termination are used to describe the flow of participants through the community corrections center. Data reported here indicates participants whose status changed during FY 2006. Generally speaking a transition describes a participant that is progressing through intermediate sanction levels within the community corrections center paradigm while a termination describes a participant that has been discharged from the community corrections center.
There were 1,580 intermediate sanction level III and IV transitions and 3,005 intermediate sanction level III and IV terminations from community corrections centers during FY 2006. Transitions included all participants that moved from a higher to a lower intermediate sanction level during the reporting period. Terminations included participants that were discharged from community corrections centers for the following reasons: warrant issued, violation of probation pending, incarcerated, returned to higher custody, sentence expired/paroled, placed in residential or inpatient treatment, transferred to another community corrections center, unable to continue for medical reasons, inappropriate referral.
As shown in Figure 13:
• 4.0% of participants moved from Level IV to Level III; • 30.0% of participants moved from Level III to Level II or standard
supervision; • 11.0%of participants were terminated from Level IV ; • 55.0% of participants were terminated from Level III.
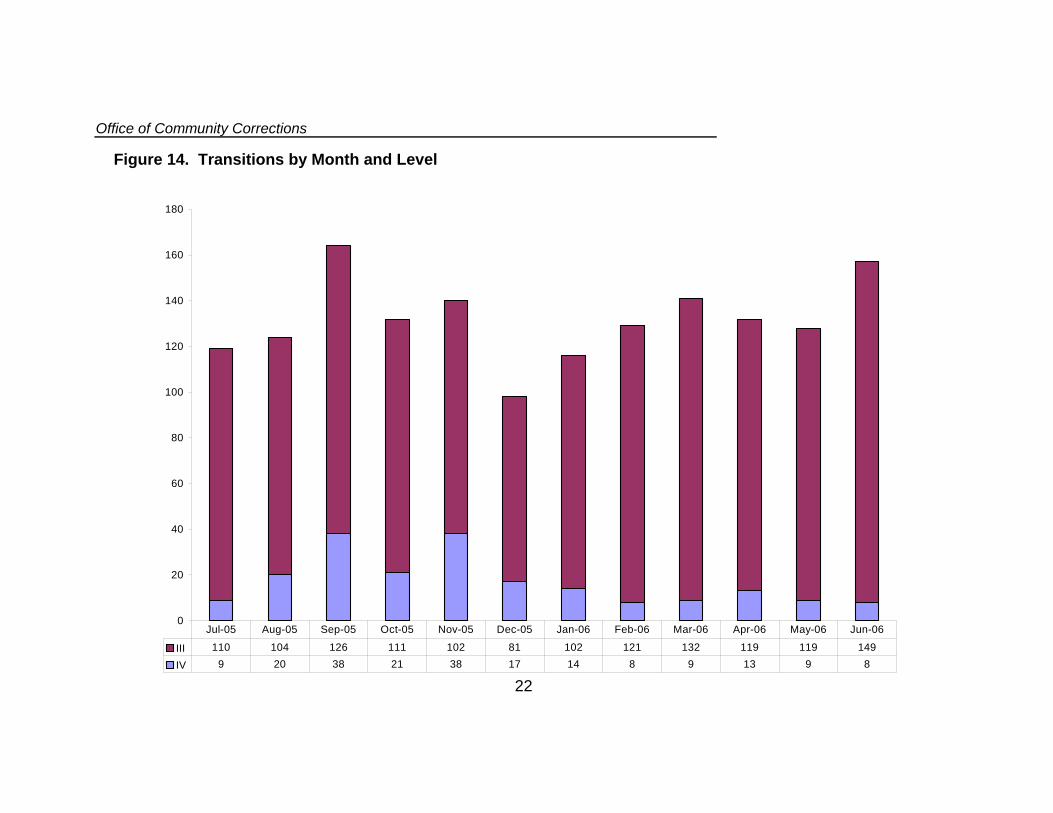
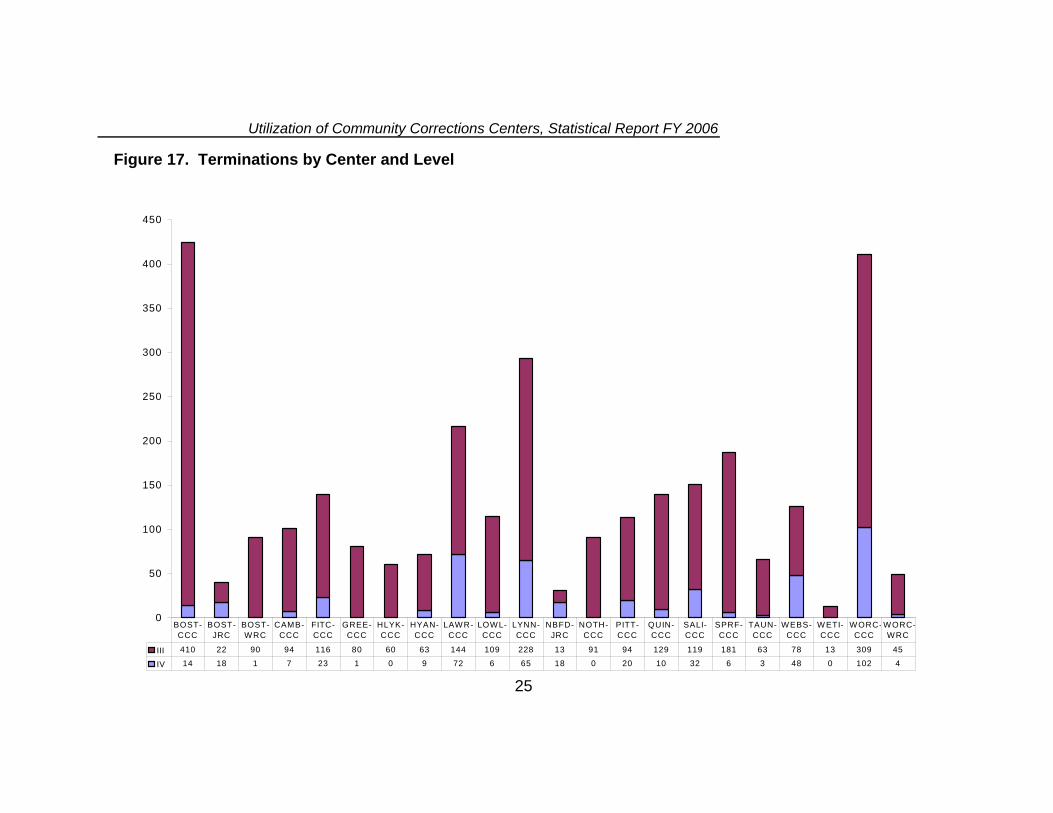
Figure 14 shows the number of transitions by month. Figure 15 shows the number of transitions by center. Figure 16 shows the number of terminations by month. Figure 17 shows the number of terminations by center.
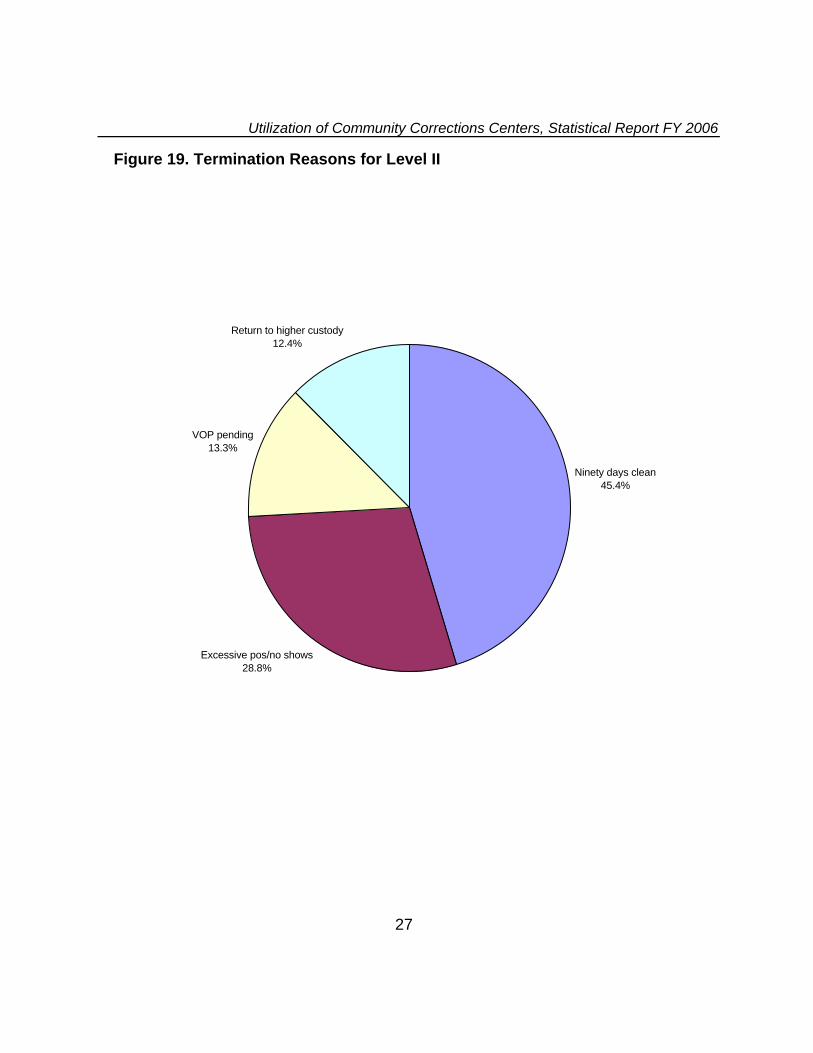
The reasons for intermediate sanction level III and IV terminations are featured in Figure 18. Among Level IV terminations the most prominent reasons reported were sentence expired / paroled at 34.4% and return to higher custody / incarcerated at 32.7%. For Level III terminations the most frequent reason was return to higher custody / incarcerated at 31.1%. It should be noted that the centers reported 3,010 Level III and IV terminations, and they reported reasons for 3,003. Figure 19. Shows the termination reasons for Level II participants for which ninety days clean was the most frequently reported at 45.4%.
20
Utilization of Community Corrections Centers, Statistical Report FY 2006
Figure 13. Transitions and Terminations from Centers
l IV 11%
level III 55%
4%
III>II
leve
IV>III
30%
21
Office of Community Corrections
Figure 14. Transitions by Month and Level
0
20
40
60
80
100
120
140
160
180
110 104 126 102 81 102 121 132 119 119
IV 9 8 9 9 8
Aug-05 Sep-05
III 111 149 20 38 21 38 17 14 13
Jul-05 Oct-05 Nov-05 Dec-05 Jan-06 Feb-06 Mar-06 Apr-06 May-06 Jun-06
22

Utilization of Community Corrections Centers, Statistical Report FY 2006
Figure 15. Transitions by Center and Level
0
20
40
60
80
100
120
140
160
180
120 21 38 55 34 61 140 33 75
6 0 1 2 0 5 2 0 5 2 5 8 2 9 0 2
WRC CCC CCC CCC NBFD-
JRC CCC CCC -
CCC -
III>II 47 75 106 15 24 123 83 91 29 68 24 93 21
IV>III 12 10 29 11 20 73
BOST-CCC
BOST-JRC
BOST- CAMB- FITC-CCC
GREE- HLYK-CCC
HYAN- LAWR-CCC
LOWL-CCC
LYNN-CCC
NOTH-CCC
PITT- QUIN-CCC
SALI-CCC
SPRF-CCC
TAUN-CCC
WEBS- WETI-CCC
WORC WORCWRC
23

Office of Community Corrections
Figure 16. Terminations by Month and Level
0
50
100
150
200
250
300
214 192 187 213 240 246 29 36 40 72 50 39 28 27 34 24
Level III 222 189 219 141 237 246
Level IV 44 36
Jul-05 Aug-05 Sep-05 Oct-05 Nov-05 Dec-05 Jan-06 Feb-06 Mar-06 Apr-06 May-06 Jun-06
24
Utilization of Community Corrections Centers, Statistical Report FY 2006
Figure 17. Terminations by Center and Level
0
50
100
150
200
250
300
350
400
450
116 60 63 228 91 94 45
IV 14 18 1 7 1 0 9 72 6 0 20 10 32 6 3 0 4
CCC CCC CCC CCC CCC CCC CCC CCC CCC -
CCC -
III 410 22 90 94 80 144 109 13 129 119 181 63 78 13 309
23 65 18 48 102
BOST- BOST-JRC
BOST-WRC
CAMB-CCC
FITC-CCC
GREE- HLYK- HYAN- LAWR-CCC
LOWL-CCC
LYNN-CCC
NBFD-JRC
NOTH- PITT- QUIN- SALI-CCC
SPRF-CCC
TAUN-CCC
WEBS- WETI- WORC WORCWRC
25

Office of Community Corrections
Figure 18. Termination Reasons for Level III, IV
Transferred to another ccc / jurisdiction
Unable to continue due to medical / mental health issues
Placed in residential treatment
Sentence expired/ paroled
Returned to higher custody / incarcerated
Violation of probation pending participant ordered not to report
Warrant issued
2.4%
2.9%
l
6.9%
32.7%
34.4%
20.7%
0.9%
2.0%
22.8%
12.3%
31.1%
20.6%
8.0%
2.2%
Level III Leve IV
0% 5% 10% 15% 20% 25% 30% 35% 40%
26
Utilization of Community Corrections Centers, Statistical Report FY 2006
Figure 19. Termination Reasons for Level II
Ninety days clean 45.4%
13.3%
12.4%
Excessive pos/no shows 28.8%
VOP pending
Return to higher custody
27

Office of Community Corrections
GED
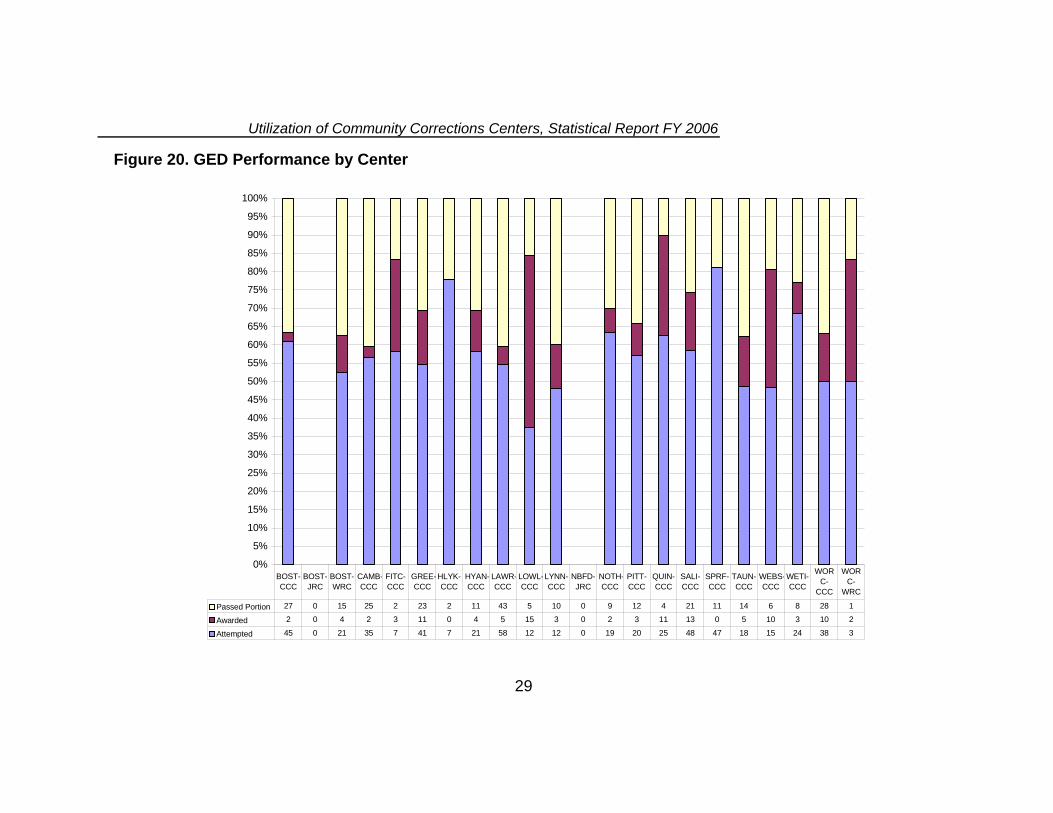
Education is among the service components at community corrections centers. Data was collected regarding General Education Degree preparation in FY 2006. Across the state 108 intermediate sanction level participants were awarded their GED in FY 2006. Additionally, community corrections centers reported the total number of participants that attempted the GED examination but did not pass and the number of participants that attempted the GED examination and passed only a portion. As indicated in Figure 20, the Lawrence CCC had the highest number of participants attempt the examination with 58. Lawrence CCC also had the highest number of participants pass some portion of the examination with 43. The Lowell CCC had the highest number of participants awarded a GED with15.
28
Utilization of Community Corrections Centers, Statistical Report FY 2006
Figure 20. GED Performance by Center
0%
5%
i 0 2 2 5 0 9 4 6 8 1
2 0 4 2 3 0 4 5 3 0 2 3 0 5 3 2
0 7 7 0 3
WRC -
CCC CCC -
CCC -
CCC - -
CCC CCC -
CCC PITT-CCC
QUICCC CCC CCC
TAUN- -CCC
I- C-CCC
C-WRC
10%
15%
20%
25%
30%
35%
40%
45%
50%
55%
60%
65%
70%
75%
80%
85%
90%
95%
100%
Passed Port on 27 15 25 23 11 43 10 12 21 11 14 28
Awarded 11 15 11 13 10 10
Attempted 45 21 35 41 21 58 12 12 19 20 25 48 47 18 15 24 38
BOST-CCC
BOST-JRC
BOST- CAMB FITC- GREE HLYK-CCC
HYAN LAWRCCC
LOWL LYNN- NBFD-JRC
NOTH N- SALI- SPRF-CCC
WEBS WETCCC
WOR WOR
29

Office of Community Corrections
JOB PLACEMENT
Job placement is another among the service components of community corrections centers. Figure 21 indicates the number of participants that were placed in full or part time jobs by job developers at the centers and the percentage of full time and part time job placements. There were a total of 1,250 job placements made across the state in FY 2006 of which 1,084 were full time and 166 were part time. The Lawrence CCC had the greatest success in full time employment placing 162 participants. The Northampton CCC had the greatest success in part time employment placing 29 participants.
30

Utilization of Community Corrections Centers, Statistical Report FY 2006
Figure 21. Job Placement Performance by Center
0%
5%
10%
15%
20%
25%
30%
35%
40%
45%
50%
55%
60%
65%
70%
75%
80%
85%
90%
95%
i 0 0 4 2 5 8 1 0 6 2 1 4 9 4 2 1
i 96 0 162 4 25 69 62 39 28 59 16 139 8
CCC CCC CCC CCC CCC CCC CCC CCC CCC CCC CCC CCC CCC CCC CCC -
CCC CCC -
CCC -
100%
Part T me 24 15 11 29 16 22
Full T me 22 13 48 43 11 20 137 65 18
BOST- BOST-JRC
BOST-WRC
CAMB- FITC- GREE- HLYK- HYAN- LAWR- LOWL- LYNN- NBFD-JRC
NOTH- PITT- QUIN- SALI- SPRF- TAUN- WEBS WETI- WORC WORCWRC
31

Office of Community Corrections
AFTERCARE
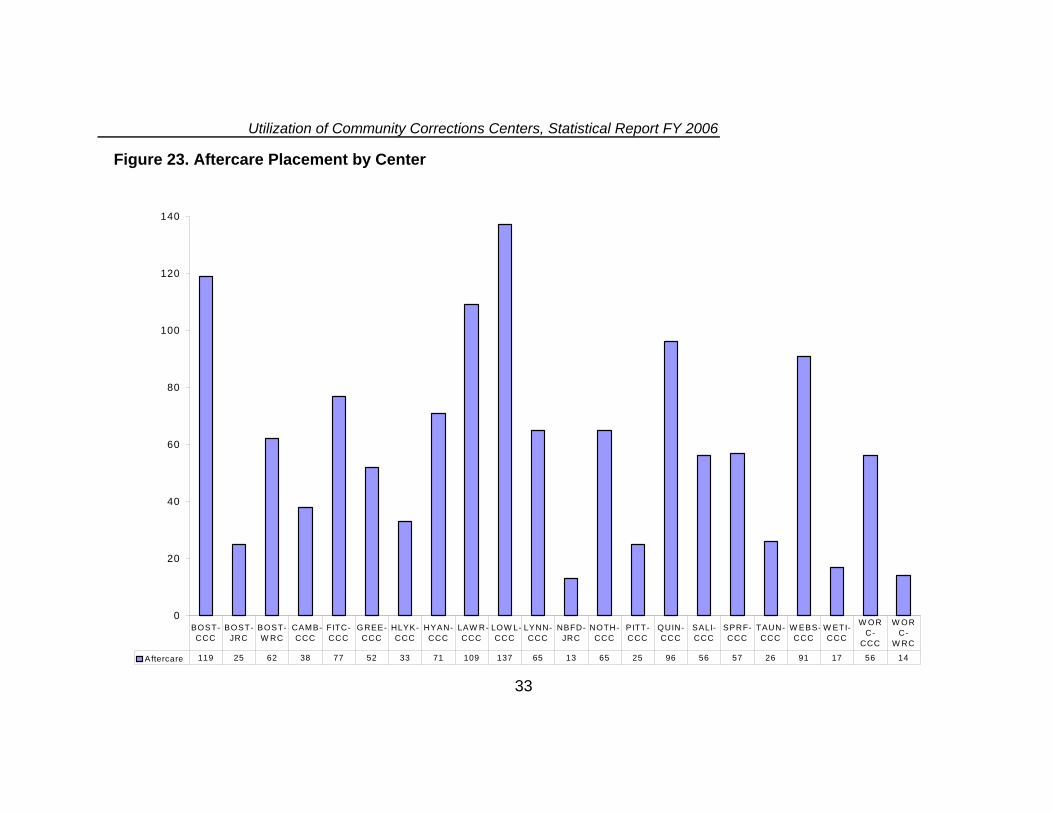
A final service component that was tracked on monthly reports was aftercare placements. Aftercare placements consist of referrals made to community based agencies in order to obtain the support services necessary to maintain a participant’s success at a lower level of supervison.
Figure 22 shows the number of aftercare placements at each center in FY 2006. There were a total of 1,304 aftercare placements made across the state in FY 2006. The Lowell CCC had the greatest number of aftercare placements with 137.
32
Utilization of Community Corrections Centers, Statistical Report FY 2006
Figure 23. Aftercare Placement by Center
0
20
40
60
80
CCC CCC CCC CCC CCC CCC CCC CCC CCC CCC CCC CCC CCC -
CCC CCC C-CCC
C-
100
120
140
Aftercare 119 25 62 38 77 52 33 71 109 137 65 13 65 25 96 56 57 26 91 17 56 14
BOST- BOST-JRC
BOST-W RC
CAMB- FITC- GREE- HLYK- HYAN- LAW R- LOW L- LYNN- NBFD-JRC
NOTH- PITT-CCC
QUIN-CCC
SALI- SPRF- TAUN- W EBS W ETI- W OR W OR
W RC
33
Office of Community Corrections
DRUG TESTING
Drug testing is among the most prominent sanctions administered by community corrections centers. Participants are tested randomly by virtue of a color code system in which the color assigned to a participant corresponds to risk level. There was variation in drug testing administration at different centers. Centers screened for different types or numbers of drugs and screened for different types or numbers of adulterants. However, all centers were contracted to screen in accordance with the standards for drug testing set forth in the American Probation and Parole Association’s Drug Testing Guidelines and Practices for Adult Probation and Parole Agencies.
Figure 23 shows the total number of urine specimens screened for illicit drugs by each center in FY 2006. The table indicates the total number of positive and negative results. The Boston CCC performed the greatest number of drug tests with 21,540. The Boston CCC had the greatest number of negative drug test results with 16,793. The Boston CCC also had the greatest number of positive results with 4,747.
Figure 24 also shows the percentage of positive and negative drug test results at centers in FY 2006. The average across all centers was 83% negative; 17% positive. The Worcester CCC had the greatest percentage of negative results at 91.2%. The Lowell CCC had the greatest percentage of positive results at 25.8%.
34

Utilization of Community Corrections Centers, Statistical Report FY 2006
Figure 23. Percentage of Positive and Negative Drug Test Results by Center
0%
5%
321 1438 755 462 332 627 1832 2123 1841 243 242 939 523 399 1302 1077 235
598 6199 4328 3239 1748 3098 11489 6109 14695 829 2444 7986 2784 1567 5220 11113 1246
CAMB-CCC CCC
LAWR- QUI SPRF- - WORC- -WRC
10%
15%
20%
25%
30%
35%
40%
45%
50%
55%
60%
65%
70%
75%
80%
85%
90%
95%
100%
Positive 4747 785 438 1790 130
Negative 16793 2806 3179 9394 753
BOST-CCC
BOST-JRC
BOST-WRC
FITC-CCC
GREE- HLYK-CCC
HYAN-CCC CCC
LOWL-CCC
LYNN-CCC
NBFD-JRC
NOTH-CCC
PITT-CCC
N-CCC
SALI-CCC CCC
TAUN-CCC
WEBSCCC
WETI-CCC CCC
WORC
35
Office of Community Corrections
COMMUNITY SERVICE
There were 15,681 Intermediate Sanction Level II referrals to the community service program in FY 2006. All participants at community corrections centers were referred to community service. In addition, referrals were made by the following court departments: Superior, District, Juvenile, and Probate.
Of the 15,681 referrals:
• 3,278 (20.9%) were females; • 12,823 (81.7%) were males;
• 14,670 (93.5%) were adults; • 1,431 (9.1%) were juveniles.
Figure 24 depicts the total number of adult referrals for community service by county and gender.
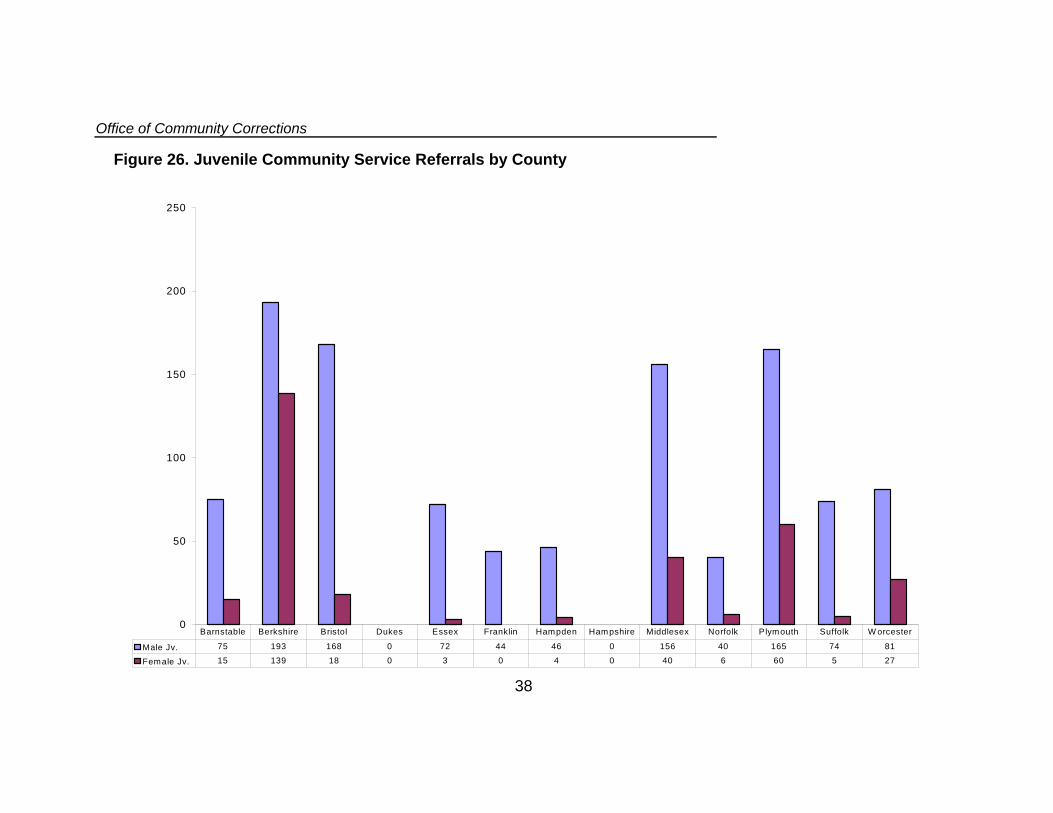
Figure 25 depicts the total number of juvenile referrals for community service by county.
36

Utilization of Community Corrections Centers, Statistical Report FY 2006
Figure 25. Adult Community Service Referrals by County
0
Male 684 434 495 776 448 813
le 54 191 62 292 148 166 264 103 690 257
i l lin i Mi Norf Pl folk
500
1000
1500
2000
2500
3000
3500
149 283 253 1380 1871 957 3166
Fema 132 403 199
Barnstable Berkshire Br sto Dukes Essex Frank Hampden Hampsh re ddlesex olk ymouth Suf Worcester
37
Office of Community Corrections
Figure 26. Juvenile Community Service Referrals by County
0
50
Mal 193 0 72 44 46 0 40
l 139 18 0 3 0 4 0 6 60 5
i i l lin Mi lk Pl lk
100
150
200
250
e Jv. 75 168 156 165 74 81
Fema e Jv. 15 40 27
Barnstable Berksh re Br sto Dukes Essex Frank Hampden Hampshire ddlesex Norfo ymouth Suffo W orcester
38
Utilization of Community Corrections Centers, Statistical Report FY 2006
SUMMARY
A main purpose of this report has been to provide data on the utilization of community corrections centers. Among the highlights are:
• the community corrections centers provided service to a large number of participants and the number of participants was increased compared to the previous year;
• the community corrections centers provided services in diverse locations across the Commonwealth;
• the community corrections centers delivered intermediate sanctions to participants from different components of the criminal justice system witnessing strong collaboration; however,
• the ratio of participants from different agencies remained disparate from center to center;
• just over 45% Level II participants removed from drug screening were terminated because they spent more than 90 days on the program without a positive result which was a decrease of about 5% from the previous year; and
• while about 66% of participants were terminated from intermediate sanction level an average of 27.5% of these terminations were due to the lapse of the sentence imposed on the participant.
The project developed a reliable measure of the utilization of community corrections centers.
Based on the cooperation of the community corrections centers, a consistent level of supervision across the commonwealth in 22 diverse communities and offender populations has been observed.
The project demonstrated the utility and feasibility of conducting research across all of the community corrections centers.
This research project was the result of a collaborative effort among 22 different community corrections centers which were able to provide a consistent set of information on program utilization enabling cross center comparisons.
The electronic submission of data from the community corrections centers to the OCC was vital to the efficiency and integrity of the report.
39

Office of Community Corrections
Due to the volume of cases serviced by the community corrections centers, electronic submission of data has allowed efficient use of OCC staff resources and greater data integrity. The current report reflects higher volume totals in many categories due in part to the collection of all monthly reports. This is the first time all monthly reports were submitted since this report was first issued in FY 2003. The OCC should continue to work with individual community corrections centers to extend this model of data collection. Further automation of data collection, specifically the electronic submission of all case level utilization reports will allow for even greater depth of analysis and more sophisticated data integrity measurements.
It will be important to develop case level data on CCC participants.
This analysis is based on aggregate statistics provided by the community corrections centers. In FY 2007 the OCC will continue to develop strategies for case level analysis. This effort has made significant progress on two fronts in FY 2006. First, the OCC has acquired state of the art analytical and mapping software. Second, program sites have nearly reached full compliance with the electronic data submission standard. In Summer of 2006 Worcester County became the final county to commence electronic submission of weekly utilization reports. With this increased ability to make case level analysis the OCC seeks to address the following question in FY 2007:
• what is the nature of the population served by the community corrections centers (demographics, current offense, criminal history, supervising agency)?
• does the program model match the population being served by the community corrections centers?
• what is the difference, if any, between those participants who successfully complete the community corrections center program and those who fail to complete the program?
• how long do participants participate in the community corrections center programs?
40

Utilization of Community Corrections Centers, Statistical Report FY 2006
• what is the recidivism rate of community corrections center program participants and how does the recidivism rate differ between those that transition to a lower sanction level and those that do not?
41

Office of Community Corrections
APPENDIX
This appendix contains additional information of the sample and detailed statistical tables.
• Table 1 shows a list of the 24 community corrections centers established by the office of community corrections and the date at which the center opened and closed.
• Table 2 shows summary data on the population of the communitycorrections centers (total population, supervising agency, intermediatesanction level, and gender) by reporting month.
• Table 3 shows summary data on the population of the communitycorrections centers (total population, supervising agency, intermediatesanction level, and gender) by community corrections center.
• Table 4 shows summary data on population movement (referrals, intakes, external and internal transitions) by reporting month.
• Table 5 shows summary data on population movement (referrals, intakes, external and internal transitions) by community corrections center.
42

Utilization of Community Corrections Centers, Statistical Report FY 2006
Table 1. Community Corrections Centers Included in Study Sample
City and Center Type Boston CCC Boston JRC Boston WRC Cambridge CCC Fitchburg CCC Greenfield CCC Holyoke CCC Hyannis CCC Lawrence CCC Lowell CCC Lynn CCC New Bedford JRC Northampton CCC Pittsfield CCC Quincy CCC Salisbury CCC Springfield CCC Taunton CCC Webster CCC West Tisbury CCC Worcester CCC Worcester WRC
Short Form Name County and Community Corrections Center Date of Opening BOST-CCC Suffolk Community Corrections Center Dec-98 BOST-JRC Suffolk Juvenile Resourse Center Mar-00 BOST-WRC Suffolk Women's Resource Center Nov-00 CAMB-CCC Middlesex Communtiy Corrections Center Dec-99 FITC-CCC Worcester Community Corrections Center Jun-98 GREE-CCC Franklin Community Corrections Center Dec-00 HOLY-CCC Hampden Community Corrections Center Jul-04 HYAN-CCC Barnstable Community Corrections Center Sep-98 LAWR-CCC Essex Community Corrections Center Mar-99 LOWL-CCC Middlesex Communtiy Corrections Center Mar-02 LYNN-CCC Essex Community Corrections Center Mar-01 NBFD-CCC Bristol Juvenile Resource Center Jan-02 NOTH-CCC Hampshire Communtiy Corrections Center Jan-99 PITT-CCC Berkshire Community Corrections Center Nov-00 QUIN-CCC Norfolk Communtiy Corrections Center Apr-99 SALI-CCC Essex Community Corrections Center Mar-05 SPFL-CCC Hampden Community Corrections Center Jun-98 TAUN-CCC Bristol Community Corrections Center Apr-00 WEBS-CCC Worcester Community Corrections Center Jul-99 WEST-CCC Dukes Community Corrections Center Oct-00 WORC-CCC Worcester Community Corrections Center Sep-01 WORC-WRC Worcester Community Corrections Center Sep-01
43

Office of Community Corrections
Table 2. Average Population in Community Corrections Centers by Supervising Agency, Intermediate Sanctions Level, Gender, and Reporting Week
Month Total
Supervision Type I.S. Level Gender Probation Parole Sheriff IV III Male Female
N % N % N % N % N % N % N % 7/1/2005 999 808 80.9% 36 3.6% 155 15.5% 124 12.4% 875 87.6% 827 82.8% 172 17.2% 8/1/2005 986 783 79.4% 33 3.3% 170 17.2% 130 13.2% 856 86.8% 813 82.5% 173 17.5% 9/1/2005 1000 767 76.7% 28 2.8% 205 20.5% 117 11.7% 883 88.3% 840 84.0% 160 16.0% 10/1/2005 997 748 75.0% 32 3.2% 217 21.8% 118 11.8% 879 88.2% 834 83.7% 163 16.3% 11/1/2005 963 742 77.1% 27 2.8% 194 20.1% 113 11.7% 850 88.3% 807 83.8% 156 16.2% 12/1/2005 1019 786 77.1% 36 3.5% 197 19.3% 113 11.1% 906 88.9% 843 82.7% 176 17.3% 1/1/2006 1054 812 77.0% 34 3.2% 223 21.2% 129 12.2% 925 87.8% 881 83.6% 188 17.8% 2/1/2006 1123 826 73.6% 39 3.5% 258 23.0% 73 6.5% 1050 93.5% 921 82.0% 202 18.0% 3/1/2006 1184 882 74.5% 50 4.2% 252 21.3% 83 7.0% 1101 93.0% 997 84.2% 187 15.8% 4/1/2006 1047 782 74.7% 35 3.3% 230 22.0% 81 7.7% 966 92.3% 871 83.2% 176 16.8% 5/1/2006 1121 850 75.8% 39 3.5% 232 20.7% 72 6.4% 1049 93.6% 950 84.7% 171 15.3% 6/1/2006 1116 844 75.6% 28 2.5% 244 21.9% 83 7.4% 1033 92.6% 946 84.8% 170 15.2%
Highest 1184 882 50 258 130 1101 997 202 Lowest 963 742 27 155 72 850 807 156
Average 1050.75 802.5 34.75 214.75 103 947.75 877.5 174.5
44

Utilization of Community Corrections Centers, Statistical Report FY 2006
Table 3. Average Population in Community Corrections Centers by Supervising Agency, Intermediate Sanctions Level, Gender, and Center
Label Total
Supervision Type I. S. Level Gender Probation Parole Sheriff IV III Male Female
Avg. Min. Max. Avg. % Avg. % Avg. % Avg. % Avg. % Avg. % Avg. % BOST-CCC 136.8 157 121 110.2 80.5% 2.8 2.0% 23.9 17.5% 4.0 2.9% 132.8 97.1% 136.8 100.0% 0.0 0.0% BOST-JRC 21.5 25 18 20.9 97.3% 0.0 0.0% 0.6 2.7% 8.4 39.1% 13.1 60.9% 21.5 100.0% 0.0 0.0% BOST-WRC 32.0 39 27 27.2 84.9% 0.8 2.6% 4.0 12.5% 0.1 0.3% 31.9 99.7% 0.0 0.0% 32.0 100.0% CAMB-CCC 34.6 55 23 33.1 95.7% 0.1 0.2% 1.4 4.1% 2.0 5.8% 32.6 94.2% 30.6 88.4% 4.0 11.6% FITC-CCC 47.4 63 30 33.4 70.5% 0.9 1.9% 13.5 28.5% 4.5 9.5% 42.9 90.5% 39.5 83.3% 8.3 17.6% GREE-CCC 26.1 34 21 25.4 97.4% 0.7 2.6% 0.0 0.0% 0.6 2.2% 25.5 97.8% 21.9 84.0% 4.2 16.0% HLYK-CCC 25.9 30 19 25.4 98.1% 0.5 1.9% 0.0 0.0% 0.0 0.0% 25.9 100.0% 20.7 79.7% 5.3 20.3% HYAN-CCC 31.5 41 23 27.0 85.7% 3.3 10.3% 1.4 4.5% 1.9 6.1% 29.6 93.9% 24.7 78.3% 7.0 22.2% LAWR-CCC 81.4 107 13 70.8 87.0% 2.8 3.4% 7.8 9.6% 9.5 11.7% 71.9 88.3% 69.3 85.1% 12.2 14.9% LOWL-CCC 52.6 65 44 46.6 88.6% 0.5 1.0% 5.6 10.6% 1.2 2.2% 51.4 97.8% 45.1 85.7% 7.6 14.4% LYNN-CCC 84.8 94 78 51.8 61.1% 2.8 3.2% 30.8 36.4% 8.8 10.4% 75.9 89.6% 78.3 92.3% 7.1 8.4% NBFD-JRC 21.0 28 16 20.9 99.6% 0.0 0.0% 0.1 0.4% 9.3 44.0% 11.8 56.0% 21.0 100.0% 0.0 0.0% NOTH-CCC 39.9 45 35 23.9 59.9% 1.5 3.8% 14.5 36.3% 3.7 9.2% 36.3 90.8% 36.1 90.4% 3.8 9.6% PITT-CCC 34.3 48 27 21.8 63.6% 11.8 34.2% 0.8 2.2% 3.8 10.9% 30.6 89.1% 25.7 74.8% 8.7 25.2% QUIN-CCC 59.4 77 40 49.5 83.3% 0.7 1.1% 9.3 15.6% 5.6 9.4% 53.8 90.6% 48.3 81.3% 11.1 18.7% SALI-CCC 60.8 76 45 43.3 71.1% 2.3 3.7% 15.3 25.2% 4.4 7.3% 56.4 92.7% 41.3 67.8% 19.6 32.2% SPRF-CCC 58.9 70 43 46.4 78.8% 2.3 4.0% 10.2 17.3% 3.3 5.7% 55.6 94.3% 45.5 77.2% 13.4 22.8% TAUN-CCC 26.2 37 21 25.8 98.4% 0.4 1.6% 0.0 0.0% 3.7 14.0% 22.5 86.0% 22.5 86.0% 3.7 14.0% WEBS-CCC 39.1 47 26 24.8 63.3% 0.0 0.0% 14.3 36.7% 9.4 24.1% 29.7 75.9% 30.3 77.6% 8.8 22.4% WETI-CCC 12.8 17 9 8.3 64.9% 0.8 5.8% 3.8 29.2% 0.0 0.0% 12.8 100.0% 12.0 93.5% 0.8 6.5% WORC-CCC 106.6 124 78 52.5 49.3% 0.0 0.0% 54.1 50.7% 18.0 16.9% 88.6 83.1% 106.6 100.0% 0.0 0.0% WORC-WRC 17.1 23 9 13.6 79.5% 0.1 0.5% 3.4 20.0% 0.9 5.4% 16.2 94.6% 0.0 0.0% 17.1 100.0%
Total 47.8 157 9 36.5 76.4% 1.6 3.3% 9.8 20.4% 4.7 9.8% 43.1 90.2% 39.9 83.5% 7.9 16.6%
45

Office of Community Corrections
Table 4. Summary of Population Movement by Reporting Week
Month
Admission Termination Transition IV III Total IV III Total IV III Total
N % N % N % N % N % N % N % N % N % 7/1/2005 65 18.7% 282 81.3% 347 100.0% 29 11.6% 222 88.4% 251 100.0% 9 7.6% 110 92.4% 119 100.0% 8/1/2005 72 22.2% 252 77.8% 324 100.0% 36 16.0% 189 84.0% 225 100.0% 20 16.1% 104 83.9% 124 100.0% 9/1/2005 83 21.8% 298 78.2% 381 100.0% 44 17.1% 214 82.9% 258 100.0% 38 23.2% 126 76.8% 164 100.0% 10/1/2005 80 22.7% 273 77.3% 353 100.0% 40 15.4% 219 84.6% 259 100.0% 21 15.9% 111 84.1% 132 100.0% 11/1/2005 69 19.1% 292 80.9% 361 100.0% 72 27.3% 192 72.7% 264 100.0% 38 27.1% 102 72.9% 140 100.0% 12/1/2005 77 21.0% 290 79.0% 367 100.0% 50 21.1% 187 78.9% 237 100.0% 17 17.3% 81 82.7% 98 100.0% 1/1/2006 68 19.1% 288 80.9% 356 100.0% 39 21.1% 146 78.9% 185 100.0% 14 11.9% 104 88.1% 118 100.0% 2/1/2006 40 9.5% 379 90.5% 419 100.0% 28 11.6% 213 88.4% 241 100.0% 8 6.2% 121 93.8% 129 100.0% 3/1/2006 46 10.0% 413 90.0% 459 100.0% 27 10.1% 240 89.9% 267 100.0% 9 6.4% 132 93.6% 141 100.0% 4/1/2006 40 11.8% 299 88.2% 339 100.0% 32 11.9% 237 88.1% 269 100.0% 13 9.8% 119 90.2% 132 100.0% 5/1/2006 38 9.5% 363 90.5% 401 100.0% 36 12.8% 246 87.2% 282 100.0% 9 7.0% 119 93.0% 128 100.0% 6/1/2006 47 12.0% 346 88.0% 393 100.0% 24 8.9% 246 91.1% 270 100.0% 8 5.1% 149 94.9% 157 100.0%
Total 725 16.1% 3775 83.9% 4500 100.0% 457 15.2% 2551 84.8% 3008 100.0% 204 12.9% 1378 87.1% 1582 100.0%
46

Utilization of Community Corrections Centers, Statistical Report FY 2006
Table 5. Summary of Population Movement by Center
Label
Admission Termination Transition Level III Level IV Total Level III Level IV Total Level III Level IV Total
N N N N % N % N % N % N % N % BOST-CCC 513 25 538 410 96.7% 14 3.3% 424 100.0% 120 95.2% 6 4.8% 126 100.0% BOST-JRC 22 31 53 22 55.0% 18 45.0% 40 100.0% 21 63.6% 12 36.4% 33 100.0% BOST-WRC 130 0 130 90 98.9% 1 1.1% 91 100.0% 47 100.0% 0 0.0% 47 100.0% CAMB-CCC 119 10 129 94 93.1% 7 6.9% 101 100.0% 38 97.4% 1 2.6% 39 100.0% FITC-CCC 134 43 177 116 83.5% 23 16.5% 139 100.0% 75 88.2% 10 11.8% 85 100.0% GREE-CCC 105 4 109 80 98.8% 1 1.2% 81 100.0% 55 96.5% 2 3.5% 57 100.0% HLYK-CCC 99 0 99 60 100.0% 0 0.0% 60 100.0% 36 100.0% 0 0.0% 36 100.0% HYAN-CCC 94 16 110 63 87.5% 9 12.5% 72 100.0% 61 92.4% 5 7.6% 66 100.0% LAWR-CCC 248 81 329 144 66.7% 72 33.3% 216 100.0% 106 98.1% 2 1.9% 108 100.0% LOWL-CCC 186 7 193 109 94.8% 6 5.2% 115 100.0% 140 100.0% 0 0.0% 140 100.0% LYNN-CCC 165 103 268 228 77.8% 65 22.2% 293 100.0% 33 86.8% 5 13.2% 38 100.0% NBFD-JRC 17 33 50 13 44.8% 16 55.2% 29 100.0% 15 34.1% 29 65.9% 44 100.0% NOTH-CCC 144 4 148 91 100.0% 0 0.0% 91 100.0% 75 97.4% 2 2.6% 77 100.0% PITT-CCC 92 22 114 94 82.5% 20 17.5% 114 100.0% 24 82.8% 5 17.2% 29 100.0% QUIN-CCC 145 31 176 129 92.8% 10 7.2% 139 100.0% 123 93.9% 8 6.1% 131 100.0% SALI-CCC 182 28 210 119 78.8% 32 21.2% 151 100.0% 83 97.6% 2 2.4% 85 100.0% SPRF-CCC 205 15 220 181 96.8% 6 3.2% 187 100.0% 91 91.0% 9 9.0% 100 100.0% TAUN-CCC 68 16 84 63 95.5% 3 4.5% 66 100.0% 29 72.5% 11 27.5% 40 100.0% WEBS-CCC 78 78 156 78 61.9% 48 38.1% 126 100.0% 68 77.3% 20 22.7% 88 100.0% WETI-CCC 37 0 37 13 100.0% 0 0.0% 13 100.0% 24 100.0% 0 0.0% 24 100.0% WORC-CCC 167 170 337 309 75.2% 102 24.8% 411 100.0% 93 56.0% 73 44.0% 166 100.0% WORC-WRC 53 8 61 45 91.8% 4 8.2% 49 100.0% 21 91.3% 2 8.7% 23 100.0% Total 3003 725 3728 2551 85.1% 457 14.9% 3008 100.0% 1378 86.9% 204 13.1% 1582 100.0%
47