Utica Shale Play - Energy Information AdministrationThe U.S. Energy Information Administration (EIA)...
18
Utica Shale Play Geology review April 2017 Independent Statistics & Analysis www.eia.gov U.S. Department of Energy Washington, DC 20585
Transcript of Utica Shale Play - Energy Information AdministrationThe U.S. Energy Information Administration (EIA)...

Utica Shale Play
Geology review
April 2017
Independent Statistics & Analysis
www.eia.gov
U.S. Department of Energy
Washington, DC 20585

U.S. Energy Information Administration | Utica Shale Play i
This report was prepared by the U.S. Energy Information Administration (EIA), the statistical and
analytical agency within the U.S. Department of Energy. By law, EIA’s data, analyses, and forecasts are
independent of approval by any other officer or employee of the United States Government. The views
in this report therefore should not be construed as representing those of the U.S. Department of Energy
or other federal agencies
EIA author contact: Dr. Olga Popova Email: [email protected]
April 2017
U.S. Energy Information Administration | Utica Shale Play 6
Introduction
The U.S. Energy Information Administration (EIA) is adding and updating geologic information and maps
of the major tight formations and shale plays for the continental United States. This document outlines
updated information and maps for the Utica shale play of the Appalachian basin. The geologic features
characterized include a contoured elevation of the formation top (structure), contoured thickness
(isopach), paleogeography elements, and tectonic structures (regional faults and folds, etc.), as well as
play boundaries, well location, and initial GOR (gas-to-oil ratio) of wells producing from January 2004
through December 2016.
EIA integrates these geologic elements into a series of maps. The Utica play map consists of layers of
geologic and production information that users can view either as separate thematic maps (such as
Figure 1) or as interactive layers of the U.S. Energy Mapping System. Additional map layers may be
added if additional geologic data (such as petrophysical and thermodynamic formation properties)
become available. Data sources include DrillingInfo Inc. (DI, a commercial oil and gas well database), the
United States Geological Survey (USGS), New York State Geological Survey, Ohio State Geological Survey,
Pennsylvania Bureau of Topographic & Geologic Survey, West Virginia Geological & Economic Survey,
Appalachian Oil & Natural Gas Research Consortium, EIA reports, peer-reviewed research papers, and
academic theses.
The Utica and Point Pleasant formation extent in the Appalachian
basin and play boundaries
The Utica is a stacked play that includes both the Utica formation and the underlying Point Pleasant
formation of Late Ordovician age as shown on the geologic cross section (Figure 3). Utica and Point
Pleasant are organic-rich formations that extend in the subsurface across the Appalachian basin from
New York state in the north to northeastern Kentucky and Tennessee in the south. The play has seen
substantial growth in natural gas production in the past four years. Currently, the deeper Point Pleasant
formation is more often targeted for drilling because of its higher productivity. The most prolific areas of
the Point Peasant formation are located in eastern Ohio and western Pennsylvania.
Utica and Point Pleasant formations cover about 115,000 and 108,000 square miles respectively with a
prospective area about 85,000 square miles. Formation structure and thickness are controlled by
basement tectonics. EIA estimates proven reserves of 6.4 trillion cubic feet (Tcf) for the Utica Play in
Ohio at the end of 2015. The Utica play footprint extends across four states: New York, Pennsylvania,
Ohio, and West Virginia. Like other low-permeability plays, key geologic criteria that control play
boundaries and high productivity areas include thermal maturity, total organic carbon (TOC) content,
formation thickness, porosity, depth, pressure, and the ability of the formation to be hydraulically
fractured.
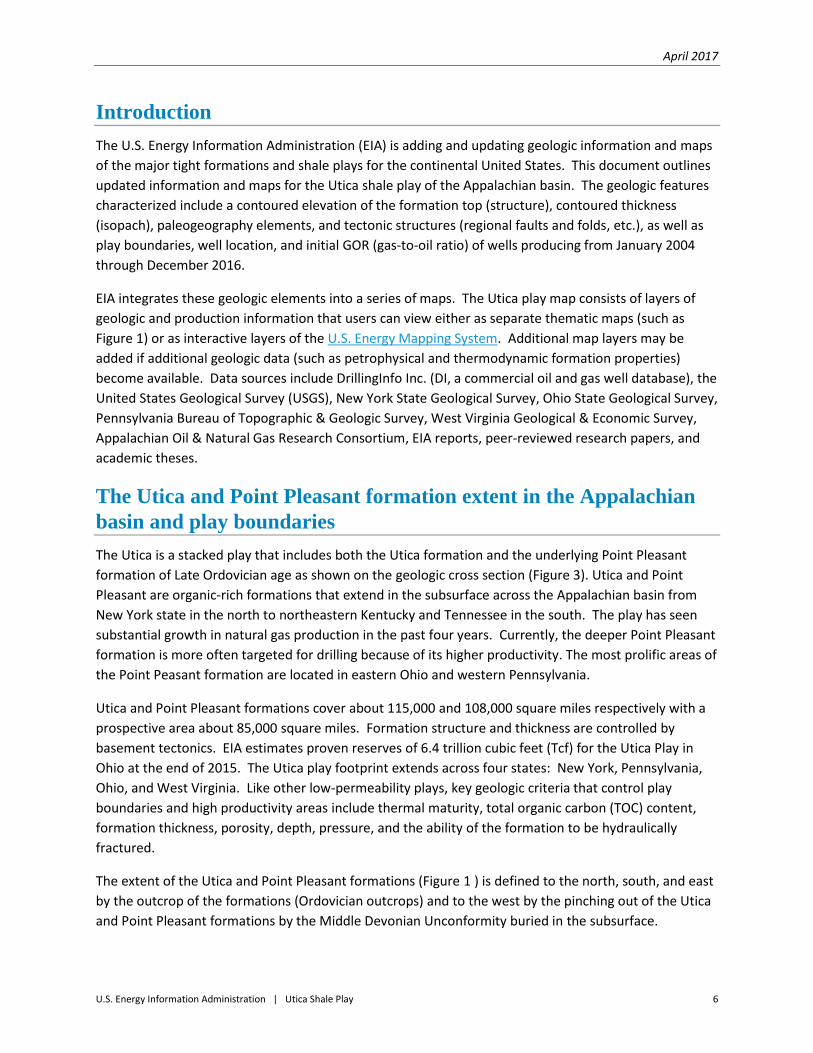
The extent of the Utica and Point Pleasant formations (Figure 1 ) is defined to the north, south, and east
by the outcrop of the formations (Ordovician outcrops) and to the west by the pinching out of the Utica
and Point Pleasant formations by the Middle Devonian Unconformity buried in the subsurface.

April 2017
U.S. Energy Information Administration | Utica Shale Play 7
The northwest boundary of the Utica Play is roughly defined by where the oil window ends and the
immature area begins, and the southeast boundary is defined by where the gas window ends and the
over-mature area begins, according to a study that used thermal maturity modeling calibrated to
published vitrinite reflectance (%Ro) data (Hohn, Pool, and Moore, 2015). The limits of the oil window
correlate to the subsea depth range of -4,000 to -8,000 feet, and the limits of the gas window
correspond to the subsea depth range of -7,000 to -12,000 feet. The change in depth in relation to
maturity reflects the amount of differential subsidence within the Appalachian basin and subsequent
uplift and erosion with certain basement blocks.
Structure maps of the Utica and Point Pleasant formations
Contoured structure maps (subsea depth to the top of a geologic formation) are constructed from two
types of data: (1) point-measurement depth data from oil and natural gas wells referenced to sea level,
and (2) formation outcrops. These data are used to show the elevation of a reservoir on a two-
dimensional map. Structure maps not only provide valuable geologic information, but they also lend
insight into the distribution of oil and gas throughout the play. (A surface elevation is also required to
determine the drilling depth to the formation.) To generate the structure maps of the Utica and Point
Pleasant formations (Figures 1A and 1B), EIA used stratigraphic correlations provided by the Appalachian
Oil & Natural Gas Research Consortium based on interpretations from 1,182 well logs.
In the southwest corner of Pennsylvania, the Point Pleasant formation reaches subsea depths of up to
-14,000 feet and is shallowest at the junction of Ohio, Indiana, and Kentucky and along the outcrops.
The Utica formation reaches subsea depths of up to -13,000 feet in a northeast trending arc through
Pennsylvania and is shallowest at the junction of Ohio, Indiana, and Kentucky and along the outcrops.
The area where most producing wells are found has a subsea depth ranging from -5,000 to -11,000 feet.
The Utica and Point Pleasant formations currently produce in four states: Pennsylvania, West Virginia,
Ohio, and New York. Because of the recent ban on hydraulic fracturing in New York, natural gas
production in New York state is from wells drilled prior to the ban in 2010.
As the structure map shows, the Appalachian basin is an asymmetric depression. The depths of the
Utica and Point Pleasant formations increase gradually from northwest to southeast, with an abrupt
uplift along the Appalachian Mountains’ structural front, where formations are exposed along the
outcrop belt. The deepest portions of both formations are related to the synclines adjacent to the
structural front.
April 2017
U.S. Energy Information Administration | Utica Shale Play 8
Figure 1. A) Structure map of the Utica formation and B) Structure map of the Point Pleasant formation
Source: U.S. Energy Information Administration based on DrillingInfo Inc., New York State Geological Survey, Ohio State Geological Survey, Pennsylvania Bureau of Topographic & Geologic Survey, West Virginia Geological & Economic Survey, Appalachian Oil & Natural Gas Research Consortium, and U.S. Geological Survey.
A)
B)
April 2017
U.S. Energy Information Administration | Utica Shale Play 9
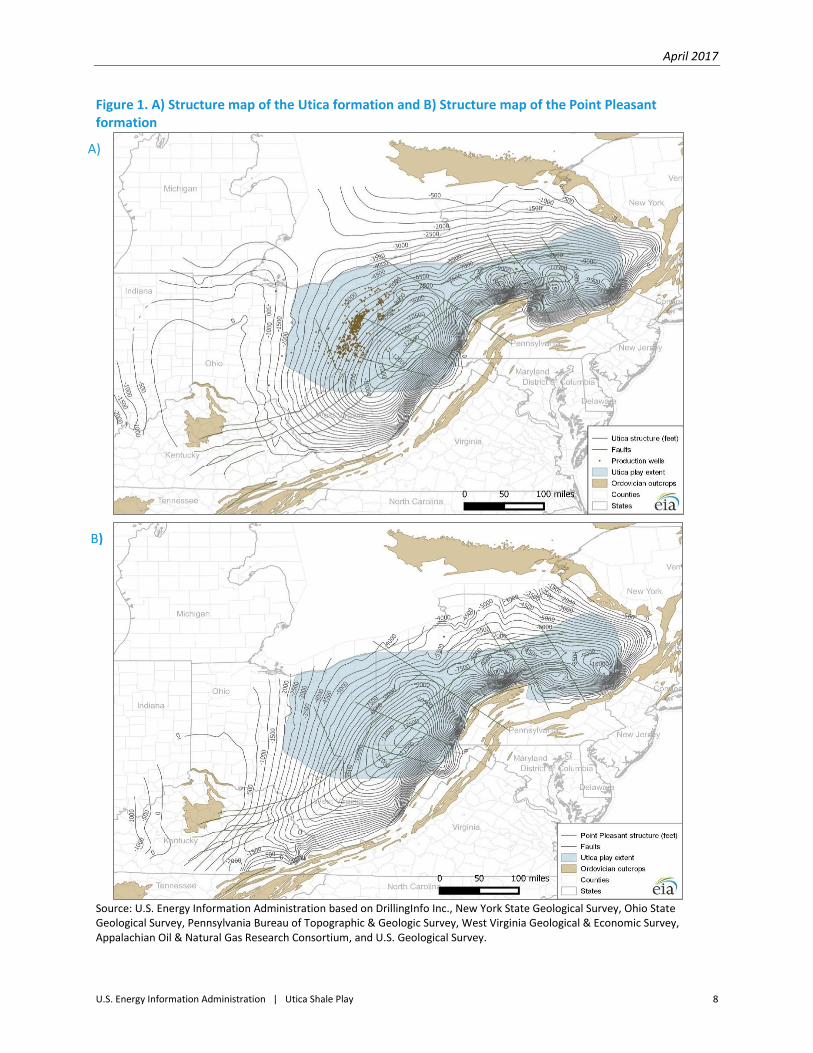
Thickness maps (isopach) of the Utica and Point Pleasant
formations
Thickness maps (isopachs) show spatial distribution of formation thickness across the formation.
Thickness values, combined with reservoir petrophysical properties such as porosity and thermodynamic
parameters (reservoir temperature and pressure), are used to calculate resource volume estimates such
as oil-in-place and gas-in-place.
The isopach maps for the Utica and the Point Pleasant formations (Figures 2A-2C) are constructed from
subsurface point measurements from individual wells that include both depth to the top and to the base
of the formations. These stratigraphic picks are provided by the Appalachian Oil & Natural Gas Research
Consortium based on well log interpretation from 1,182 wells. For the Utica formation map, the
difference between the top of the Utica formation and the top of the Point Pleasant formation was used
as a proxy for the Utica thickness. For the Point Pleasant thickness map, the top of the Point Pleasant
formation and the top of the underlying Trenton formation were used to define the thickness of the
Point Pleasant. The top of the Utica and the top of the Trenton were used to determine the combined
thickness. Formation thickness is a factor in calculating the amount of oil and gas held in the formation.
Figure 2. A) Isopach map of the Utica formation; B) Isopach map of the Point Pleasant formation; C)
Isopach map of the Utica–Point Pleasant interval
A)
April 2017
U.S. Energy Information Administration | Utica Shale Play 10
Source: U.S. Energy Information Administration based on DrillingInfo Inc., New York State Geological Survey, Ohio State Geological Survey, Pennsylvania Bureau of Topographic & Geologic Survey, West Virginia Geological & Economic Survey, Appalachian Oil & Natural Gas Research Consortium and U.S. Geological Survey.
B)
C)

April 2017
U.S. Energy Information Administration | Utica Shale Play 11
The Utica formation is thickest in western Ohio and the northwest corner of Pennsylvania at 200–300
feet and thins out to 50 feet or less in southern Ohio and northern Kentucky. The Point Pleasant
formation reaches a thickness of more than 200 feet in central Pennsylvania and thins out to less than
20 feet in the eastern part of Kentucky. The combined thickness of Utica and Point Pleasant is as thin as
100 feet or less where Ohio, West Virginia, and Kentucky meet. The combined thickness exceeds 300
feet in northwest and central Pennsylvania, and in northeast and central Ohio.
On the maps above, the outlined area of the Utica’s highest organic content shows the continuous
reservoir where productive wells would likely be drilled. This area has relatively high levels of total
organic carbon (TOC, an indication of the amount of hydrocarbon in the rock), which is important for
successful wells. Like structure maps, isopach maps provide valuable drilling information because
thickness of the reservoir is one component of the decision to drill a well and its subsequent success.
Most of the current production is located in areas where combined thickness of the Utica–Point
Pleasant interval is more than 150 feet.
Summary of the Utica Play geology
Regional stratigraphy and lithology
The Utica and Point Pleasant formations are parts of the ancient sedimentary system known as the
Appalachian basin. The Utica and Point Pleasant formations were deposited in a foreland basin roughly
paralleling the structural front of the present-day Appalachian Mountains during the Late Ordovician
time about 445 million years ago (Harper, 1999; Anderson et al., 1984, Patchen et al., 1985). The Utica-
Point Pleasant interval is described as carbonaceous grey to black shale that encloses scattered
carbonate concretions and locally abundant fossils. The Utica-Point Pleasant lithology varies significantly
across the Appalachian basin. This lithological heterogeneity is controlled by depositional and diagenetic
processes (Roen and Walker, 1996).
Typically, the Utica consists of interbedded gray to black and brown calcareous shale (10% to 60%
calcite), locally fossiliferous. This shale in often laminated, tends to be bioturbated, and generally has
TOC content of approximately 3.5%, which is lower than the underlying organic-rich carbonate facies of
the Point Pleasant and Lexington-Trenton (Smith, 2013). The Point Pleasant Formation is an organic-rich
calcareous shale with some limestone beds. It extends beneath the Utica Shale and is composed of
interbedded, fossiliferous limestone, shale, and minor siltstone. The Upper interval of the Point Pleasant
Formation is an organic-poor gray shale with abundant thin carbonate beds. TOC is generally low (in the
most samples it is less than 1%). This interval is considered to be primarily non-reservoir. The Lower
interval of the Point Pleasant Formation is organic-rich calcareous shale (roughly 40%–60% carbonate
content) with average TOC content 4%–5%.The Point Pleasant has abundant storm beds, is a clearly
storm-influenced formation, and has common burrows, even in the organic-rich facies (Luft, 1972;
McDowell, 1986; Harper, 2015).
April 2017
12
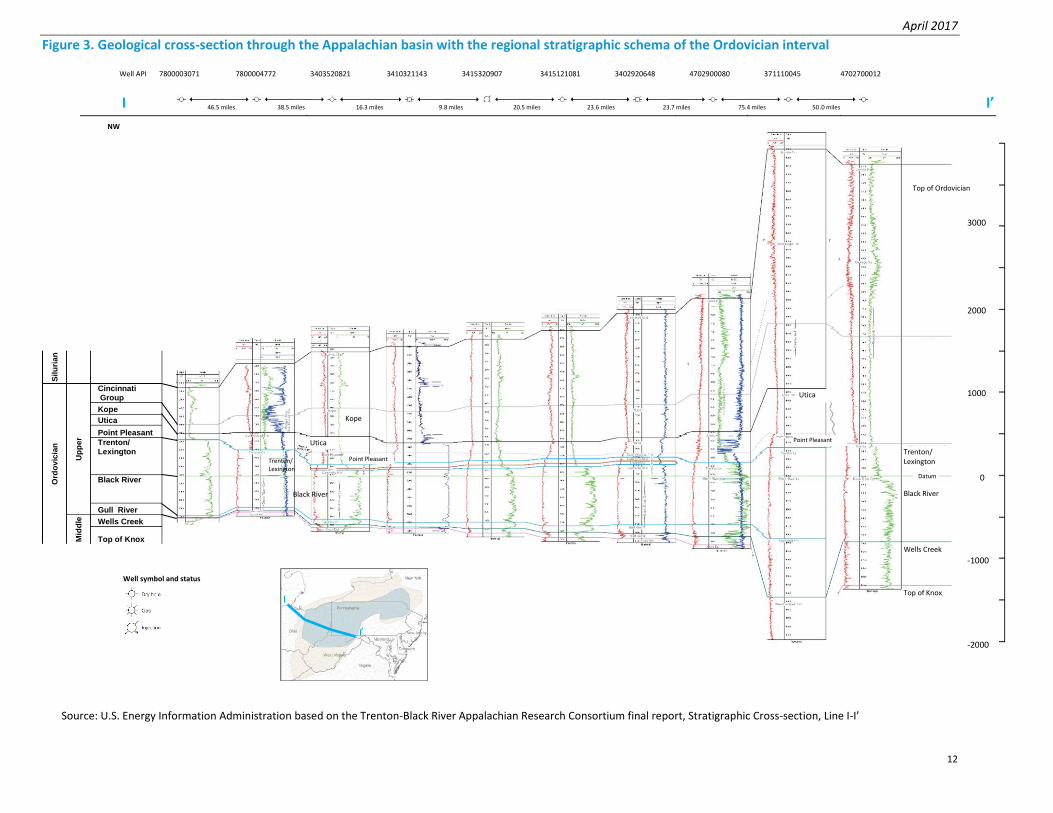
Figure 3. Geological cross-section through the Appalachian basin with the regional stratigraphic schema of the Ordovician interval
3000
2000
1000
0
-1000
-2000
Sil
uri
an
Ord
ov
icia
n
Up
pe
r
Cincinnati Group
Kope
Utica
Point Pleasant
Trenton/ Lexington
Black River
Gull River
Mid
dle
Wells Creek
Top of Knox
NW
Top of Ordovician
Kope
I’
I
Well symbol and status
Utica
Utica
Point Pleasant
Point Pleasant
Kope
Black River
Trenton/ Lexington
Wells Creek
Black River
Trenton/ Lexington
Datum
Top of Knox
Well API 7800003071 7800004772 3403520821 3410321143 3415320907 3415121081 3402920648 4702900080 371110045 4702700012
46.5 miles 38.5 miles 16.3 miles 9.8 miles 20.5 miles 23.6 miles 23.7 miles 75.4 miles 50.0 miles
SE
Source: U.S. Energy Information Administration based on the Trenton-Black River Appalachian Research Consortium final report, Stratigraphic Cross-section, Line I-I’
April 2017
U.S. Energy Information Administration | Utica Shale Play 13
Figure 3 shows the regional stratigraphy of the Ordovician system, including the Utica and Point Pleasant
Formations. The Utica-Point Pleasant overlies the Trenton formation and sits beneath the Cincinnati
Group (Bergsorm and Mitchell, 1992; Hickman et al., 1985).
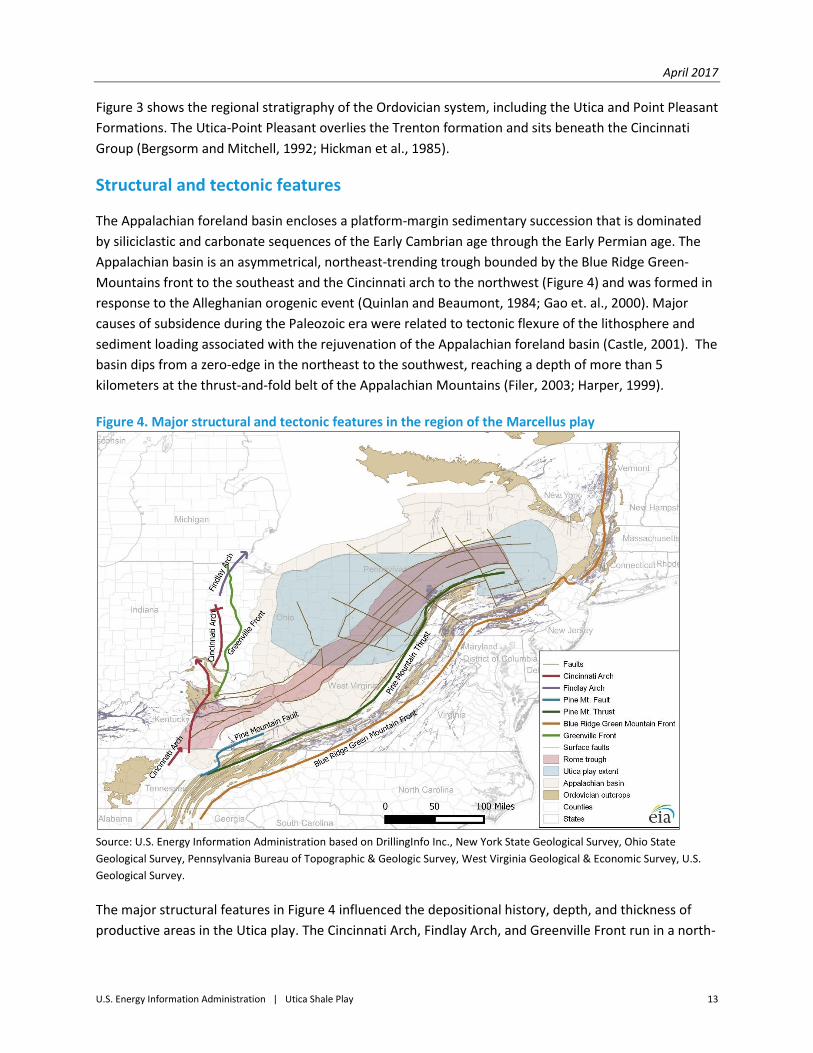
Structural and tectonic features
The Appalachian foreland basin encloses a platform-margin sedimentary succession that is dominated
by siliciclastic and carbonate sequences of the Early Cambrian age through the Early Permian age. The
Appalachian basin is an asymmetrical, northeast-trending trough bounded by the Blue Ridge Green-
Mountains front to the southeast and the Cincinnati arch to the northwest (Figure 4) and was formed in
response to the Alleghanian orogenic event (Quinlan and Beaumont, 1984; Gao et. al., 2000). Major
causes of subsidence during the Paleozoic era were related to tectonic flexure of the lithosphere and
sediment loading associated with the rejuvenation of the Appalachian foreland basin (Castle, 2001). The
basin dips from a zero-edge in the northeast to the southwest, reaching a depth of more than 5
kilometers at the thrust-and-fold belt of the Appalachian Mountains (Filer, 2003; Harper, 1999).
Figure 4. Major structural and tectonic features in the region of the Marcellus play
Source: U.S. Energy Information Administration based on DrillingInfo Inc., New York State Geological Survey, Ohio State
Geological Survey, Pennsylvania Bureau of Topographic & Geologic Survey, West Virginia Geological & Economic Survey, U.S.
Geological Survey.
The major structural features in Figure 4 influenced the depositional history, depth, and thickness of
productive areas in the Utica play. The Cincinnati Arch, Findlay Arch, and Greenville Front run in a north-
April 2017
U.S. Energy Information Administration | Utica Shale Play 14
south direction along the western boundary of the play. The Pine Mountain Fault, Pine Mountain Thrust,
and the Blue Ridge-Green Mountain Front run along the eastern edge of the formation in a northeast-
southwest direction. Ordovician outcrops run in the northeast-southwest direction along the southern
and eastern borders and in an east-west direction along the northern boundary of the formation. To the
west of the Pine Mountains thrust is the Rome trough, a Cambrian extensional feature that controlled
sedimentation of organic shale, deposition of reservoir sands, and facilitated natural fracturing through
reactivation of basement faults.
The basement structure of the Appalachian basin, along with major interpreted faults and the
projected position of the Rome trough, serves as tectonic features controlling depositional and burial
history of the sedimentary formations in the region, including the Utica-Point Pleasant interval. The
mapped basement faults fall into two categories: (1) faults that strike parallel to the basin and are
associated to the Rome trough and (2) transform faults that have been developed perpendicular to the
strike of the basin and are interpreted as cross-strike structural discontinuities (Harper and Laughrey,
1987). These basement faults represent zones of weakness assumed to have been reactivated several
times during the Paleozoic period and have continued well into the Quaternary (NegusDe Wyss, 1979;
Shumaker, 1993). Ordovician age faults and surface faults extend in both the northeast-southwest and
perpendicular northwest-southeast directions. A number of these faults coincide with other
subsurface features like the Greenville Front. These major features represent points of weakness that
often allow for enhanced movement and accumulation of oil and natural gas (Roen and Walker, 1996).
Paleogeography and depositional environment
A paleogeographic reconstruction of the Late Ordovician (445 Ma1) shows present-day West Virginia;
Pennsylvania; and parts of New York, Virginia, Maryland, Kentucky, and Ohio as a semi-enclosed
epicontinental sea (Woodrow, 1985; Blakey, 2011). Groups of associated fossils that likely were not
transported, fine layer sequences reflecting moving currents, and erosional surfaces indicative of
recurrent storms point to a depositional environment that was a shallow marine area that experienced
frequent storms and algal blooms. This environment led to a deposition of interbedded shale and
limestone with unconformities representing periods of erosion or non-deposition between the main
layers (McClain, 2013, Wickstrom and Shumway, 2014; Carter and Soeder, 2015; Hickman et al., 2015).
The depositional environment of the Point Pleasant Formation and upper Trenton Formation was a fairly
shallow, most likely less than 100 feet deep, storm-dominated, carbonate shelf that experienced
frequent algal blooms. Cross-sections demonstrate that water depth was did not vary much across the
organic-rich and organic-poor areas of deposition. The fossils present in the limestone indicate well-
oxygenated water that was exposed to sunlight. The storm-bedding throughout suggests deposition of
the Point Pleasant above the storm wave base (Hickman et al., 2015).
.
1 Ma is abbreviated from Latin mega-annum, a million years
April 2017
U.S. Energy Information Administration | Utica Shale Play 15
Figure 5. Late Ordovician paleogeographic reconstruction (445 Ma) exhibiting North America. Modified after Blakey (2011)
The Utica-Point Pleasant interval was deposited during a major transgression across the eastern United
States. The shale composition indicates a large influx of organic material, restricted circulation, and low
energy conditions. The Utica and Point Pleasant formations represent a deeper basin, relative to the
Trenton Platform milieu, with inter-platform, restricted circulation and anoxic depositional environment.
Deposition of this unit began contemporaneously with the Trenton carbonate buildup in response to
compression from the Taconic orogeny, which altered the basin shape and water bathymetry.
Deposition of these units ceased with complete inundation of the region by deeper water and open–
marine condition represented by the Cincinnati Group, which sits above the Utica formation (Patchen et
al., 2015).
Thermal maturity and initial GOR (gas-to-oil ratios of wells producing from the Utica-Point Pleasant)
Crude oil and natural gas are produced by heating the organic materials (i.e., kerogen) found in some
rocks. When organic-rich rocks, usually shales, are buried over long periods of time, they are exposed to
increasing temperatures and pressures. Heat causes the organic matter to change into the waxy
material known as kerogen, then into oil, and finally into natural gas as the temperature further
increases. Thermal maturity is a measure of the extent organic material has been converted (e.g.,
conversion of sedimentary organic matter to petroleum or cracking of oil to natural gas).
Vitrinite (a type of kerogen) reflectance (R₀) is a proxy to thermal maturity: the higher the R₀ percentage
value, the higher the maturity. In the case of Utica, the rocks are Ordovician in age, so vitrinite
Appalachian basin
contemporary footprint

April 2017
U.S. Energy Information Administration | Utica Shale Play 16
reflectance is calculated from conodont and bitumenen reflectance data (Jacob, 1989; Patchen et al.,
2015). The temperature ranges conducive to converting organic material to oil and natural gas are
referred to as the oil window and the gas window, respectively. The oil window has average R₀ values of
0.6–1.1% vitrinite reflectance. The wet gas window ranges from 1.1–1.4% vitrinite reflectance, the dry
gas window ranges from 1.4–3.2% vitrinite reflectance. East of the production area, the Utica play
becomes over mature with R₀ values up to 4.93%. Figure 6 shows consistency between production
trends and thermal maturity (Patchen et al., 2015).
Figure 6. Initial Gas-to-Oil Ratios of Utica Play Wells
Sources: U.S. Energy Information Administration, DrillingInfo, Inc., Appalachian Oil & Natural Gas Research Consortium, U.S. Geological Survey. Note: EIA calculated the initial gas-to-oil ratio for each well using the first six months of liquid and/or gas production. Vitrinite reflectance (Ro) is calculated from conodont and bitumenen reflectance data.
The oil window typically occurs at temperatures between 60 degrees and 120 degrees Celsius, while the
natural gas window occurs between 100 degrees and 200 degrees Celsius. Although this temperature
range is found at different depths below the surface throughout the world, a typical subsea depth for
the oil window in the Utica play is -4,000 feet to -8,000 feet, and the corresponding gas window is -7,000
feet to -12,000 feet.
Thermal maturity values (based on calculated vitrinite reflectance and measurements of core samples)
in the Utica-Point Pleasant interval generally increase in a southeastern direction, as shown in Figure 6,
ranging from 0.6% Ro to more than 4.5% Ro across the Appalachian basin.
April 2017
U.S. Energy Information Administration | Utica Shale Play 17
Figure 6 also shows the distribution of production across the play in terms of initial GOR. GORs
represent the ratio of natural gas produced to oil produced from a well, expressed in standard cubic feet
per barrel (scf/bbl). The distribution of oil and natural gas in a formation is mainly controlled by the
thermal maturity of the rock. In the map above, natural gas-rich wells in the Utica play are mostly
located in the eastern portion of the play, and oil-rich wells are typically located in the western portion.
This distribution of initial GORs matches a depth pattern as the oil-rich wells with lower initial GORs (less
than 10,000 scf/b) fall in the area of the formation where the subsea elevation to the top of Utica ranges
from -4,500 feet to -7,000 feet. As expected, the wells producing mostly natural gas with higher initial
GORs (greater than 10,000 scf/b) are in deeper areas where subsea elevation to the top of Utica ranges
from -7,000 feet to -9,500 feet. The established natural gas-productive areas in the northeastern part of
the play have a higher thermal maturity profile, with the most natural gas production occurring between
Ro values of 3.2% to more than 3.5%. The limits of the gas window in this area correspond to subsea
depth between -8,000 feet and -10,500 feet.
Recent Utica-Point Pleasant drilling activity suggests that the most substantial hydrocarbon production
takes place roughly in the southeastward of the 1.1% Ro maturity contour in eastern Ohio, in the
western parts of West Virginia, in the western and northern parts of Pennsylvania, and in southern New
York.
Total organic carbon (TOC)
Amorphinite2 is the major organic matter component of the Utica-Point Pleasant, which suggests an
algal source for most of the organic material in the rocks. Analytical results from multiple well core
samples indicate that TOC content in the Utica formation ranges from less than 1%–3.5%. It typically
has average carbonate content of 25%. The Upper interval of the Point Pleasant Formation is an
organic-poor gray shale with generally low TOC content (most samples are less than 1%). This interval is
considered to be primarily non-reservoir. The Lower interval of the Point Pleasant Formation is an
organic-rich calcareous shale with some limestone beds. The organic-rich facies have roughly 40%–60%
carbonate content, with TOC ranging from 3% to 8% (average 4%–5%). This interval is apparently the
target for drilling in most of the wells that have been drilled to date (Patchen et al., 2015).
During shale deposition, several factors play important roles in the preservation of radioactive elements
and the organic matter. The presence of potassium, uranium, and thorium in shales is indicative of the
depositional environment characteristics, as well as the way organic matter is deposited. Unlike the
Devonian Marcellus Shale, where the best proxy measurement of TOC content is its gamma-ray log
values3, the Ordovician shales in the Appalachian basin do not exhibit a correlation between gamma-ray
count and TOC content (Cluff and Holmes, 2013). The GR intensity for Utica and Point Pleasant is
2 Amorphinite is organic detritus related to algal remains. 3 Gamma ray logging is a method of measuring naturally occurring gamma radiation to characterize the rock or sediment in a
borehole or drill hole. It is a wireline logging method used in oil and gas well drilling and for formation evaluation. Different
types of rock emit different amounts and different spectra of natural gamma radiation. In particular, shales usually emit more
gamma rays than other sedimentary rocks, such as sandstone, coal, or limestone, because radioactive potassium is a common
component in their clay content, and because the cation exchange capacity of clay causes them to absorb uranium and
thorium.

April 2017
U.S. Energy Information Administration | Utica Shale Play 18
controlled by the presence of potassium, but there is no correlation between potassium and the amount
of organic matter deposited. Previous studies demonstrate that TOC does not directly relate to any
radioactive substance in the Utica-Point Pleasant interval. Other methods may be used for evaluating
TOC in the Ordovician shales, such as bulk density and electrical resistivity log method (Meyer and
Nederlof, 1984; Passey at al., 1990; Herron, 1991). When carbonate-content results and TOC
measurements were plotted with geophysical logs, graphs demonstrate that the GR log is mainly
influenced by carbonate and clay content, rather than by TOC content. These findings are different from
the Marcellus Shale play, where GR and TOC are correlated strongly with TOC. In the Utica and Point
Pleasant formations, the TOC and GR do not track each other, whereas the carbonate content trails the
GR closely (Erenpreiss, 2015).
Typically, the organic-rich portion is more carbonate-rich in the basal interval of the Utica and more
clay-rich upward. Most or all wells drilled in the Utica Play are targeting the Point Pleasant, which is the
organic- and carbonate-rich portion at the base of the organic-rich interval. In general, the organic-rich
interval in the Utica formation has an average carbonate content of about 25%. This means that the clay
content is in the 70% range, which is very high (which might prevent rock from being fracked
effectively). The Point Pleasant has an average clay content of about 50% (Patchen et al., 2015).
Acknowledgments
This document benefited from thoughtful suggestions by members of West Virginia Geological &
Economic Survey, Pennsylvania Bureau of Topographic & Geologic Survey, Ohio State Geological Survey,
and New York State Geological Survey.
References
Anderson, R. J., Avary, K.L., et al., 1984, American Association of Petroleum Geologists Correlation Chart; Series 1984.
Blakey, R., 2011, Ordovician (345 Ma), North American Paleogeogprahy: http://jan.ucc.nau.edu/rcb7/nam.html, accessed December 2016.
Castle, J. W., Appalachian basin stratigraphic response to convergent-margin structural evolution, 2001, Basin Research, 13 (4), p. 397–418.
Carter, Kristin M., and Soeder, Daniel J., 2015, Reservoir porosity and permeability, in Patchen, D.G. and
Carter, K.M., eds., A geologic play book for Utica Shale Appalachian basin exploration, Final report of the
Utica Shale Appalachian basin exploration consortium, p. 141-159, http://www.wvgs.wvnet.edu/utica,
accessed December 2016.
Cluff, Robert, and Michael Holmes, 2013, Petrophysics of unconventional resources, course handbook:
PTTC Technology Connections, Rocky Mountain Region, workshop, Colorado School of Mines, January
31-February 1, 2013.
April 2017
U.S. Energy Information Administration | Utica Shale Play 19
Eble, Cortland, Hickman, John, Harris, David, and Cooney, Michele, 2015, Source rock geochemistry, in
Patchen, D.G. and Carter, K.M., eds., A geologic play book for Utica Shale Appalachian basin exploration,
Final report of the Utica Shale Appalachian basin exploration consortium, p. 102-141,
http://www.wvgs.wvnet.edu/utica, accessed December 2016.
Erenpreiss, Matthew S., 2015, High resolution core photography and spectral gamma-ray logging, in
Patchen, D.G. and Carter, K.M., eds., A geologic play book for Utica Shale Appalachian basin exploration,
Final report of the Utica Shale Appalachian basin exploration consortium, p. 36-49,
http://www.wvgs.wvnet.edu/utica, accessed December 2016.
Filer, J. K., Stratigraphic evidence for a Late Devonian possible back-bulge basin in the Appalachian basin, United States, 2003, Basin Research, 15 (3), p. 417-429.
Gao, D., R. C. Shumaker, and T. H. Wilson, 2000, Along-Axis Segmentation and Growth History of the Rome Trough in the Central Appalachian Basin: AAPG Bulletin, v. 84, p. 75-99.
Harper, J.A., 1999, Devonian, in Shultz, C.H., ed., The geology of Pennsylvania: Pennsylvania Bureau of Topographic & Geologic Survey and Pittsburgh Geological Society, p. 108-127.
Harper, I.A.; Laughrey, C.D., Geology of oil and gas fields of southwestern Pennsylvania, 1987, in Mineral Resource Report, Harrisburg, PA, Pennsylvania Geological Survey publication, 4th ser., p. 148-166.
Harper, John A., 2015, Bulk mineralogy, in Patchen, D.G. and Carter, K.M., eds., A geologic play book for
Utica Shale Appalachian basin exploration, Final report of the Utica Shale Appalachian basin exploration
consortium, p. 74-81, http://www.wvgs.wvnet.edu/utica, accessed December 2016.
Herron, S.L., 1991, In situ evaluation of potential source rocks by wireline logs, in R.K. Merrill, ed.,
Treatise of petroleum geology: Handbook of petroleum geology, source and migration processes and
evaluation techniques, American Association of Petroleum Geologists, p.127- 134.
Hickman, John, Eble, Cortland, and Harris, David, 2015, Lithostratigraphy, in Patchen, D.G. and Carter,
K.M., eds., A geologic play book for Utica Shale Appalachian basin exploration, Final report of the Utica
Shale Appalachian basin exploration consortium, p. 19-21, http://www.wvgs.wvnet.edu/utica, accessed
December 2016.
Hickman, J., Eble, C., and Harris, D., 2015, Subsurface mapping and correlation through geophysical log
analysis, in Patchen, D.G. and Carter, K.M., eds., A geologic play book for Utica Shale Appalachian basin
exploration, Final report of the Utica Shale Appalachian basin exploration consortium, p. 22-35,
http://www.wvgs.wvnet.edu/utica, accessed December 2016.
Hohn, Michael, Pool, Susan, and Moore, Jessica, 2015, Utica play resource assessment, 2015, in Patchen,
D.G. and Carter, K.M., eds., A geologic play book for Utica Shale Appalachian basin exploration, Final
report of the Utica Shale Appalachian basin exploration consortium, p. 159-183,
http://www.wvgs.wvnet.edu/utica, accessed December 2016.
Jacob, H., 1989, Classification, structure, genesis, and practical important of natural solid bitumen
(“migrabitumen”): International Journal of Coal Geology, v.11(1), p.65-79.
McClain, T., 2013, Sequence Stratigraphy and Petrophysics of the late Ordovician Utica-Point Pleasant
Interval in the Middle Appalachian Basin, Eastern Ohio and Western Pennsylvania, M.S. Thesis, West
Virginia University, 97 p.
April 2017
U.S. Energy Information Administration | Utica Shale Play 20
Metzger, J. Garrecht, Fike, David A., and Smith, Langhorne, Jr., 2015, Carbon Isotopes, in Patchen, D.G.
and Carter, K.M., eds., A geologic play book for Utica Shale Appalachian basin exploration, Final report of
the Utica Shale Appalachian basin exploration consortium, p. 90-102,
http://www.wvgs.wvnet.edu/utica, accessed December 2016.
Negus-deWyss, J., 1979, The eastern Kentucky gas field: A geological study of the relationship of oil shale gas occurrence to structure, stratigraphy, lithology, and inorganic geochemical parameters: Ph.D. dissertation, West Virginia University, Morgantown, West Virginia, 199 p.
Nyahay, R., J. Leone, L. B. Smith, J. P. Martin, D. J.Jarvie, 2007, Update on regional assessment of gas potential in the Devonian Marcellus and Ordovician Utica shales of New York: Search and Discovery Article 10136: http://www.searchanddiscovery.com/documents/2007/07101nyahay/#05, accessed September 2016.
Passey, Q.R., Creaney, S., Kulla, J.B., Moretti, F.J., and J.D. Stroud, 1990, A practical model for organic
richness from porosity and resistivity logs: AAPG Bulletin, v. 74, no. 12, p. 1777- 1794.
Patchen, D.G. and Carter, K.M., eds., 2015, A geologic play book for Utica Shale Appalachian basin exploration, Final report of the Utica Shale Appalachian basin exploration consortium, 187 p. Available from: http://www.wvgs.wvnet.edu/utica, accessed September 2016.
Patchen, D. G., K. L. Avary, and R. B. Erwin, 1985, Correlation of Stratigraphic Units of North America (COSUNA) project-Northern Appalachian Region: American Association of Petroleum Geologists.
Quinlan, G.M., Beaumont, C., Appalachian thrusting, lithospheric flexure, and the Paleozoic stratigraphy of the Eastern Interior of North America. Canadian Journal of Earth Sciences, 1984, 21 (9), p. 973-996.
Riley, Ronald A., 2015, Regional drilling activity and production, in Patchen, D.G. and Carter, K.M., eds., A geologic play book for Utica Shale Appalachian basin exploration, Final report of the Utica Shale Appalachian basin exploration consortium, p. 11-19, Available from: http://www.wvgs.wvnet.edu/utica, accessed September 2016.
Roen, J. B.; Walker, B. J. (eds.), 1996, The atlas of major Appalachian gas plays. Morgantown, WV, West Virginia Geological and Economic Survey Publication 25, 1996, 201 p.
Schmoker, J., 1981, Determination of organic-matter content of Appalachian Devonian shales from gamma-ray logs: AAPG Bulletin, v. 65, p. 1285-1298.
Schultz, C.H., Ed., 2002, The Geology of Pennsylvania; Pennsylvania Geologic Survey and Pittsburgh Geological Society special publication: Pittsburgh, PA, 612 p.
Shumaker, R. C., 1996, Structural history of the Appalachian Basin, in B.Roen and B. J. Walker, eds., The atlas of major Appalachian gas plays: Morgantown, West Virginia, West Virginia Geological and Economic Survey Publication V-25, p. 8-10.
Smith, Langhorne B, Jr., 2015, Carbonate content, in Patchen, D.G. and Carter, K.M., eds., A geologic play
book for Utica Shale Appalachian basin exploration, Final report of the Utica Shale Appalachian basin
exploration consortium, p. 82-90, http://www.wvgs.wvnet.edu/utica, accessed December 2016.
Smith, Langhorne B., Jr., 2015, Core description, petrography, sedimentology, stratigraphy, TOC and
depositional environment, in Patchen, D.G. and Carter, K.M., eds., A geologic play book for Utica Shale
Appalachian basin exploration, Final report of the Utica Shale Appalachian basin exploration consortium,
p. 49-73, http://www.wvgs.wvnet.edu/utica, accessed December 2016.

April 2017
U.S. Energy Information Administration | Utica Shale Play 21
Smith, L.B., and Leone, J., 2010, Integrated Characterization of Utica and Marcellus Black Shale Gas
Plays, New York State, Search and Discovery Article #50289, based on oral presentation at AAPG Annual
Convention and Exhibition, Albany, NY, USA, April 11-14, 2010,
http://www.searchanddiscovery.com/documents/2010/50289smith/ndx_smith.pdf, accessed December
2016.
Woodrow, D.L., and Sevon, W.D., eds., 1985, The Catskill Delta: Geological Society of America, Special
Paper 201, 246 p.
Wickstrom, L., and Shumway, M., 2014, A First Look at Production and Completion Data from the Utica-
Point Pleasant Shale Play or…Having Fun with Numbers, Search and Discovery Article #10661, based on
oral presentation at AAPG 43d Eastern Section Meeting, London, Ontario, Canada, September, 2014,
http://www.searchanddiscovery.com/pdfz/documents/2014/10661wickstrom/ndx_wickstrom.pdf.html,
accessed December 2016.