Utah 2016 ACA
46
INDIVIDUAL & SMALL GROUP ENROLLMENT & PREMIUM RATES Utah 2016 ACA
Transcript of Utah 2016 ACA
I N D I V I D U A L & S M A L L G R O U P
E N R O L L M E N T & P R E M I U M R A T E S
Utah 2016 ACA
Disclaimer
Rate data is current as of 10/20/2015. It might still change under some very limited circumstances.
Enrollment numbers are point estimates taken from various sources. Enrollment from one slide may not match another slide because it was taken from a different source at a different time; however, we did check for reasonableness between sources.
Disclaimer
Determining the “average rate increase” over the prior year is non-trivial and has many interpretations. The calculation is complicated by: Discontinued plans and membership crosswalked from one plan to
another The granularity of the enrollment data Required benefit changes to keep within the +/- 2% de minimis Actuarial
Valur calculator metal ranges The Uniform Modification rules (benefit changes that are small enough
to say the plan is the same plan as last year and not a “new” plan) Changes in provider contracts that can affect the rates independently of
the benefits Changing assumptions in the relativity of the cost of care between rating
areas Differing plan availability by county A hundred other things that won’t fit on this slide
Enrollment: Individual
Source: Utah Insurance Department
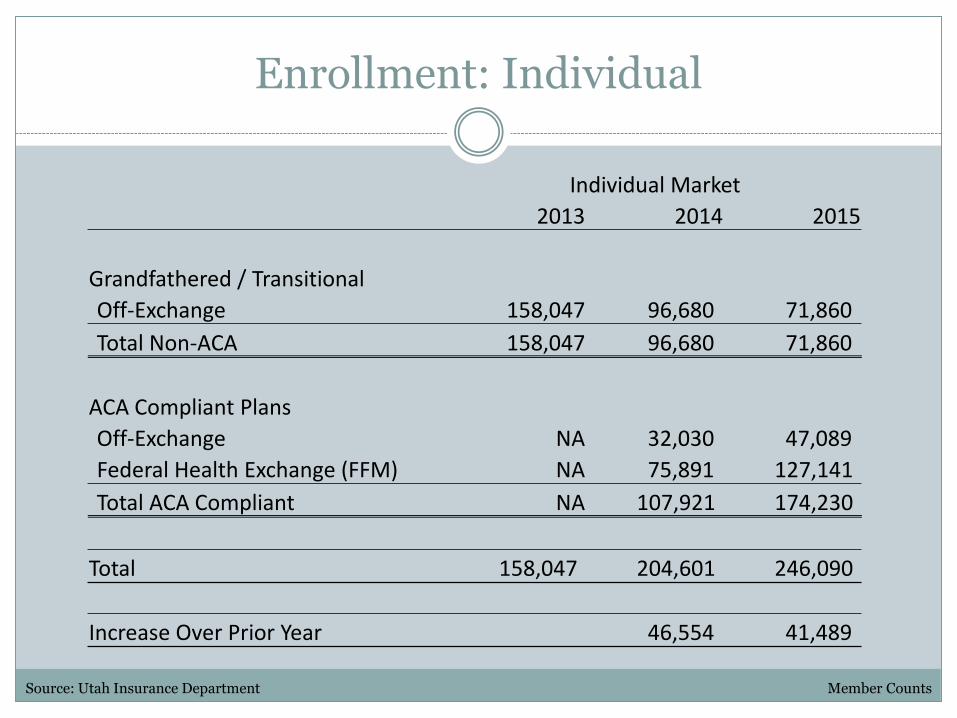
Individual Market
2013 2014 2015
Grandfathered / Transitional
Off-Exchange 158,047 96,680 71,860
Total Non-ACA 158,047 96,680 71,860
ACA Compliant Plans
Off-Exchange NA 32,030 47,089
Federal Health Exchange (FFM) NA 75,891 127,141
Total ACA Compliant NA 107,921 174,230
Total 158,047 204,601 246,090
Increase Over Prior Year 46,554 41,489
Member Counts
Enrollment: Individual
Source: https://www.cms.gov/Newsroom/MediaReleaseDatabase/Fact-sheets/2015-Fact-sheets-items/2015-06-02.htmlhttps://www.cms.gov/Newsroom/MediaReleaseDatabase/Fact-sheets/2015-Fact-sheets-items/2015-09-08.html Member Counts
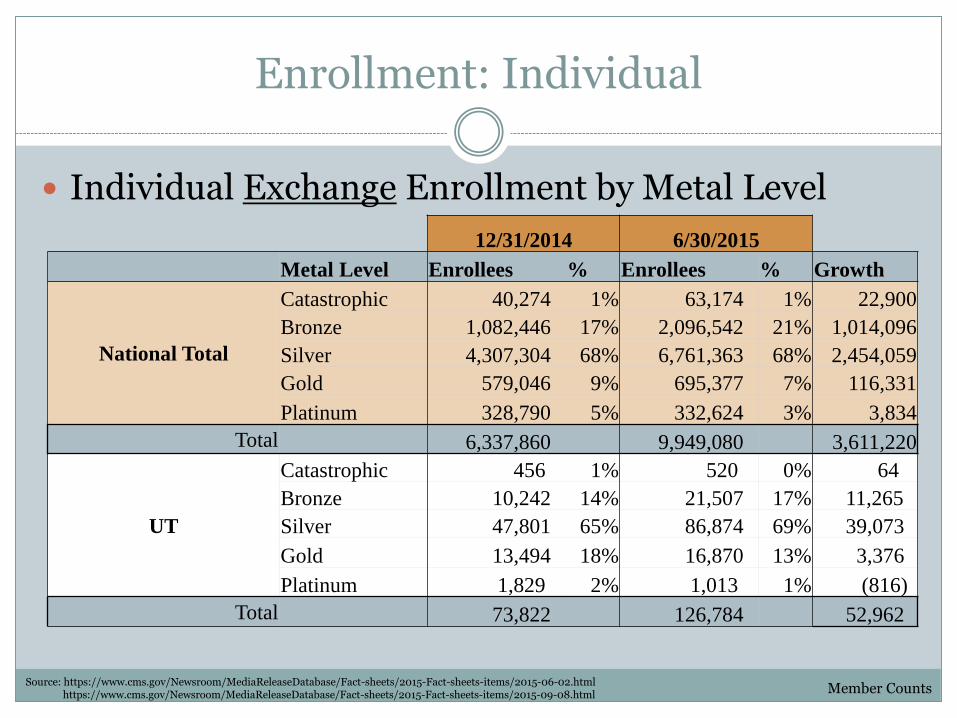
Individual Exchange Enrollment by Metal Level
12/31/2014 6/30/2015
Metal Level Enrollees % Enrollees % Growth
National Total
Catastrophic 40,274 1% 63,174 1% 22,900
Bronze 1,082,446 17% 2,096,542 21% 1,014,096
Silver 4,307,304 68% 6,761,363 68% 2,454,059
Gold 579,046 9% 695,377 7% 116,331
Platinum 328,790 5% 332,624 3% 3,834
Total 6,337,860 9,949,080 3,611,220
UT
Catastrophic 456 1% 520 0% 64
Bronze 10,242 14% 21,507 17% 11,265
Silver 47,801 65% 86,874 69% 39,073
Gold 13,494 18% 16,870 13% 3,376
Platinum 1,829 2% 1,013 1% (816)
Total 73,822 126,784 52,962
Enrollment: Individual
Source: https://www.cms.gov/Newsroom/MediaReleaseDatabase/Fact-sheets/2015-Fact-sheets-items/2015-09-08.html
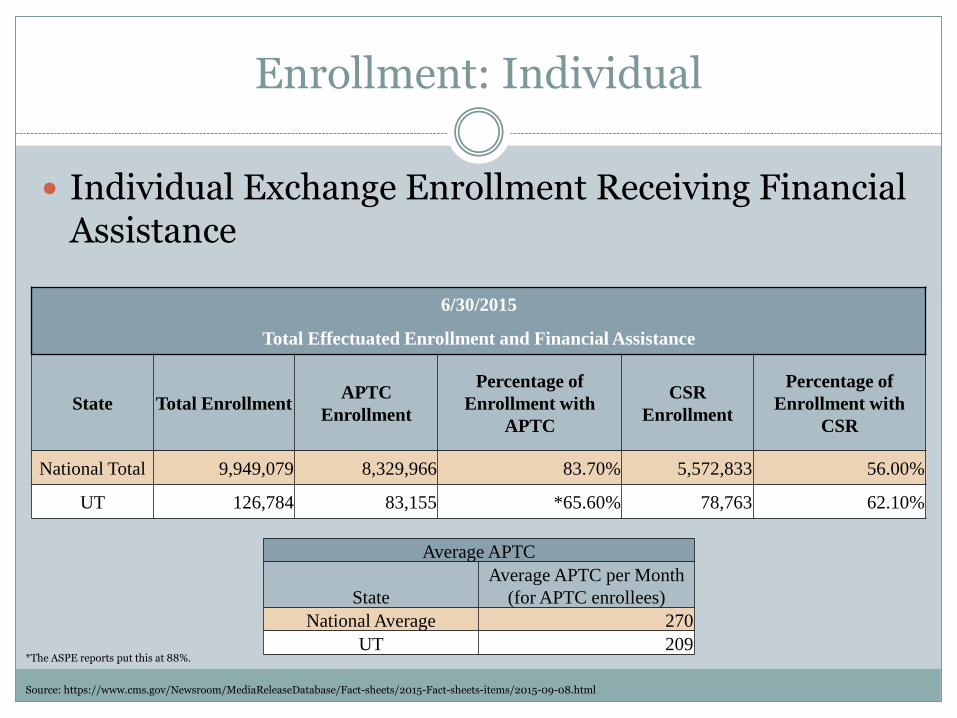
Individual Exchange Enrollment Receiving Financial Assistance
6/30/2015
Total Effectuated Enrollment and Financial Assistance
State Total EnrollmentAPTC
Enrollment
Percentage of
Enrollment with
APTC
CSR
Enrollment
Percentage of
Enrollment with
CSR
National Total 9,949,079 8,329,966 83.70% 5,572,833 56.00%
UT 126,784 83,155 *65.60% 78,763 62.10%
Average APTC
State
Average APTC per Month
(for APTC enrollees)
National Average 270
UT 209*The ASPE reports put this at 88%.
Enrollment: Individual
Source: March 10, 2015 ASPE Report - HEALTH INSURANCE MARKETPLACES 2015 OPEN ENROLLMENT PERIOD: MARCH ENROLLMENT REPORTMay 1, 2014 ASPE Report - ADDENDUM TO THE HEALTH INSURANCE MARKETPLACE SUMMARY ENROLLMENT REPORT FOR THE INITIAL ANNUAL OPEN ENROLLMENT PERIOD
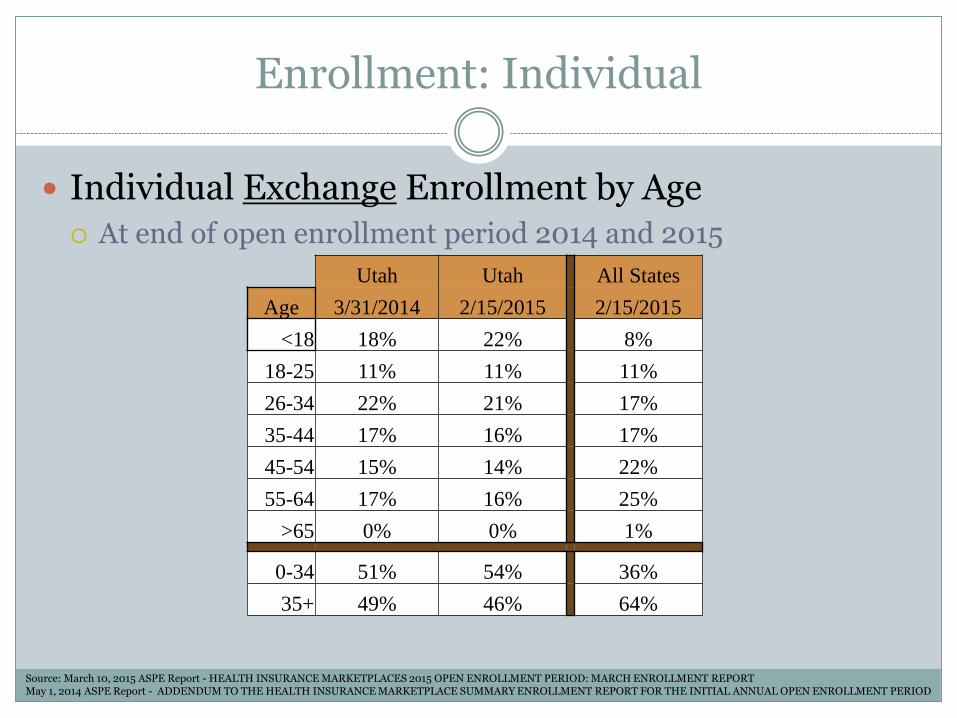
Individual Exchange Enrollment by Age
At end of open enrollment period 2014 and 2015
Utah Utah All States
Age 3/31/2014 2/15/2015 2/15/2015
<18 18% 22% 8%
18-25 11% 11% 11%
26-34 22% 21% 17%
35-44 17% 16% 17%
45-54 15% 14% 22%
55-64 17% 16% 25%
>65 0% 0% 1%
0-34 51% 54% 36%
35+ 49% 46% 64%
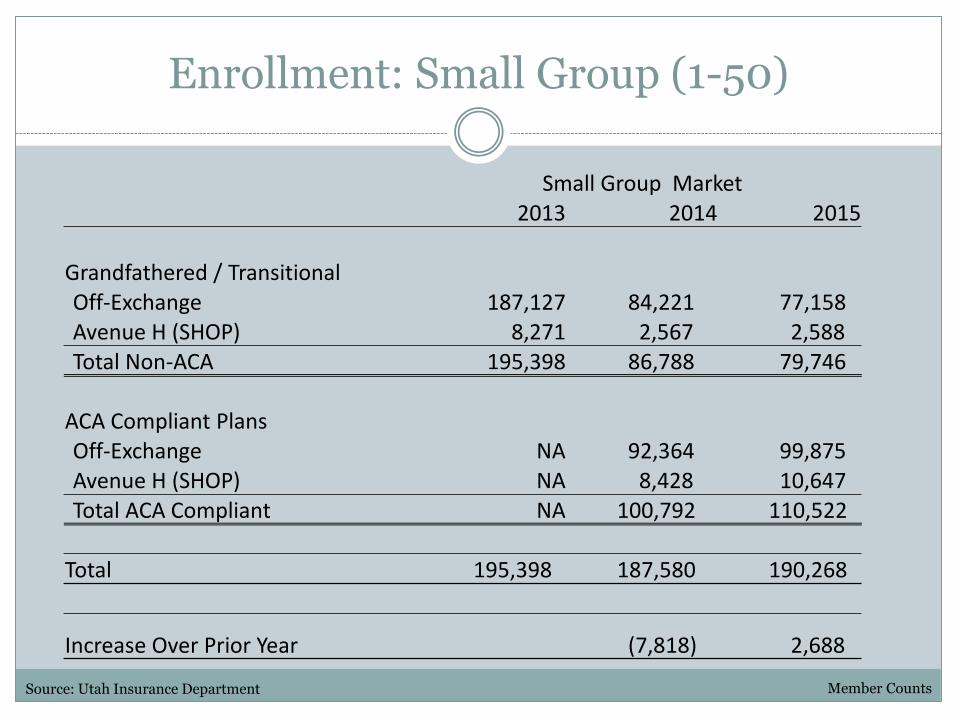
Enrollment: Small Group (1-50)
Source: Utah Insurance Department
Small Group Market2013 2014 2015
Grandfathered / TransitionalOff-Exchange 187,127 84,221 77,158 Avenue H (SHOP) 8,271 2,567 2,588 Total Non-ACA 195,398 86,788 79,746
ACA Compliant PlansOff-Exchange NA 92,364 99,875 Avenue H (SHOP) NA 8,428 10,647 Total ACA Compliant NA 100,792 110,522
Total 195,398 187,580 190,268
Increase Over Prior Year (7,818) 2,688
Member Counts

Individual Market - Medical
Count of Plans
IssuerNew in 2016? On Exchange Off Exchange
Aetna of Utah 0 16
Arches 11 25
BridgeSpan 0 3
Humana Ins Co 0 3
Humana of Utah 6 12
Molina 3 3
National Foundation Life 0 1
Regence BCBS of Utah 0 8
SelectHealth 60 60
UnitedHealthcare Life 0 9
University of Utah Health Plans X 5 5
Total 93 145
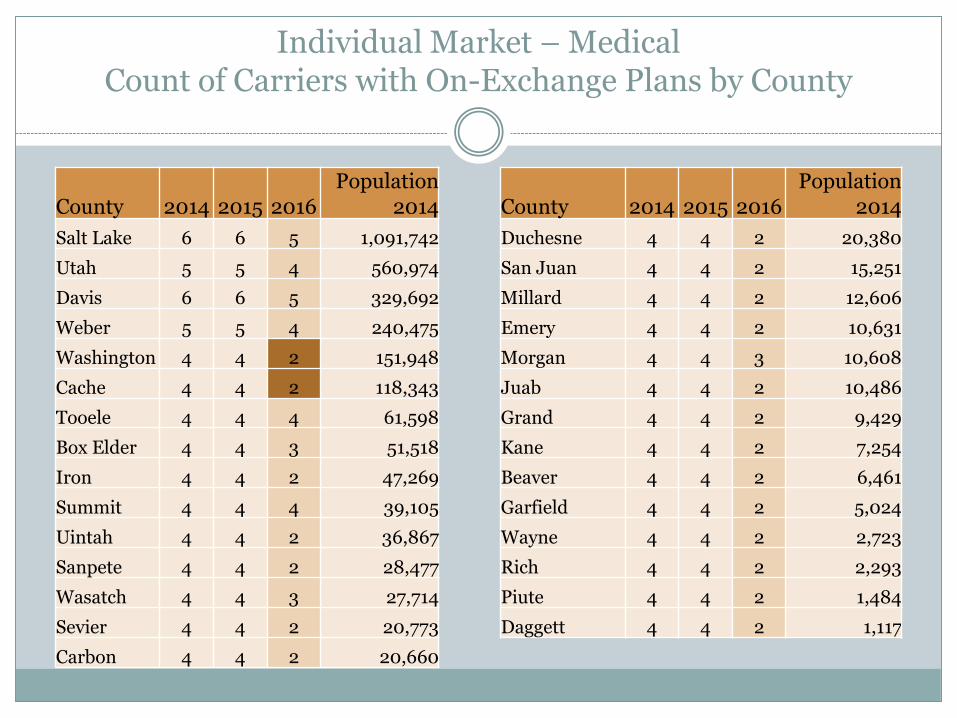
Individual Market – Medical Count of Carriers with On-Exchange Plans by County
County 2014 2015 2016Population
2014 County 2014 2015 2016Population
2014
Salt Lake 6 6 5 1,091,742 Duchesne 4 4 2 20,380
Utah 5 5 4 560,974 San Juan 4 4 2 15,251
Davis 6 6 5 329,692 Millard 4 4 2 12,606
Weber 5 5 4 240,475 Emery 4 4 2 10,631
Washington 4 4 2 151,948 Morgan 4 4 3 10,608
Cache 4 4 2 118,343 Juab 4 4 2 10,486
Tooele 4 4 4 61,598 Grand 4 4 2 9,429
Box Elder 4 4 3 51,518 Kane 4 4 2 7,254
Iron 4 4 2 47,269 Beaver 4 4 2 6,461
Summit 4 4 4 39,105 Garfield 4 4 2 5,024
Uintah 4 4 2 36,867 Wayne 4 4 2 2,723
Sanpete 4 4 2 28,477 Rich 4 4 2 2,293
Wasatch 4 4 3 27,714 Piute 4 4 2 1,484
Sevier 4 4 2 20,773 Daggett 4 4 2 1,117
Carbon 4 4 2 20,660
Individual Market: How robust were 2014 Rates?
One way to gauge is to look at the 2014 experience from the Unified Rate Review Template Data (URRT)
This is a federally required template which includes some historic premium and claims Premiums include all premium collected (including from federal
gov’t for low income)
Incurred claims exclude member cost sharing and cost sharing by HHS for low-income members
Experience includes some grandfathered / transitional business Grandfathered / transitional business is assumed to have better
experience than the ACA individual market so it should bring the experience loss ratio down

Individual Market: How robust were 2014 Rates?
3R Considerations
einsurance: UID made an adjustment for transitional reinsurance at the market level
isk Adjustment: at the market level it’s a zero sum game – so no adjustment needed
isk Corridors: risk corridors should not be explicitly considered for pricing
Other Considerations
Individual market rate increases for 2015 were modest (about 5-10%)
2016 is the first pricing year with a full year of experience data

Individual Market: How robust were 2014 Rates?
2014 Calendar Year Experience Total Fed Reins Adjusted TotalPremiums (net of MLR Rebate): 322,479,907 322,479,907 Incurred Claims 440,618,890 (79,626,958) 360,991,931
Member Months 1,594,906 1,594,906
Premiums PMPM 202.19 202.19 Incurred Claims PMPM 276.27 226.34
Incurred Loss Ratio 136.6% 111.9%
Without the federal reinsurance, the market experienced a 137% loss ratio – this is bad
After taking into account reinsurance, the loss ratio only drops to 112% for the market – this is not good
Target loss ratios are in the 80-85% range

Individual market rate increases for 2015 were modest Only 5-10%
A lot of moving parts – a lot of unknowns 3R’s
Better handle on the average risk of the market with 2014 data Reinsurance has different attachment points for 2016
2014 – 100% of claims between 45K and 250K 2015 – 50% of claims between 45K and 250K 2016 – 50% of claims between 90K and 250K 2017 – Program no longer available
Risk Corridors – 2016 is last year – will carriers be more conservative in rate setting knowing there’s no fall back in 2017?
Pent up demand – are high claims in 2014 just pent up demand? Or are the newly insured high utilizers?
Large increases affect low income disproportionately
Lick your finger – test the wind
Individual Market: Where should 2016 be?

Individual Market: Where should 2016 be?
2014 Calendar Year Experience Total Fed Reins Adjusted TotalPremiums (net of MLR Rebate): 322,479,907 322,479,907 Incurred Claims 440,618,890 (79,626,958) 360,991,931
Member Months 1,594,906 1,594,906
Premiums PMPM 202.19 202.19 Incurred Claims PMPM 276.27 226.34
Incurred Loss Ratio 136.6% 111.9%
Assuming an 8% trend and a desired 80% loss ratio…
The required rate increase is 63.2% over 2014
𝐶𝑢𝑟𝑟𝑒𝑛𝑡 𝐿𝑜𝑠𝑠 𝑅𝑎𝑡𝑖𝑜 ∗ 𝑇𝑟𝑒𝑛𝑑
𝐷𝑒𝑠𝑖𝑟𝑒𝑑 𝐿𝑜𝑠𝑠 𝑅𝑎𝑡𝑖𝑜− 1 =
111.9% 1.08 2
80%− 1

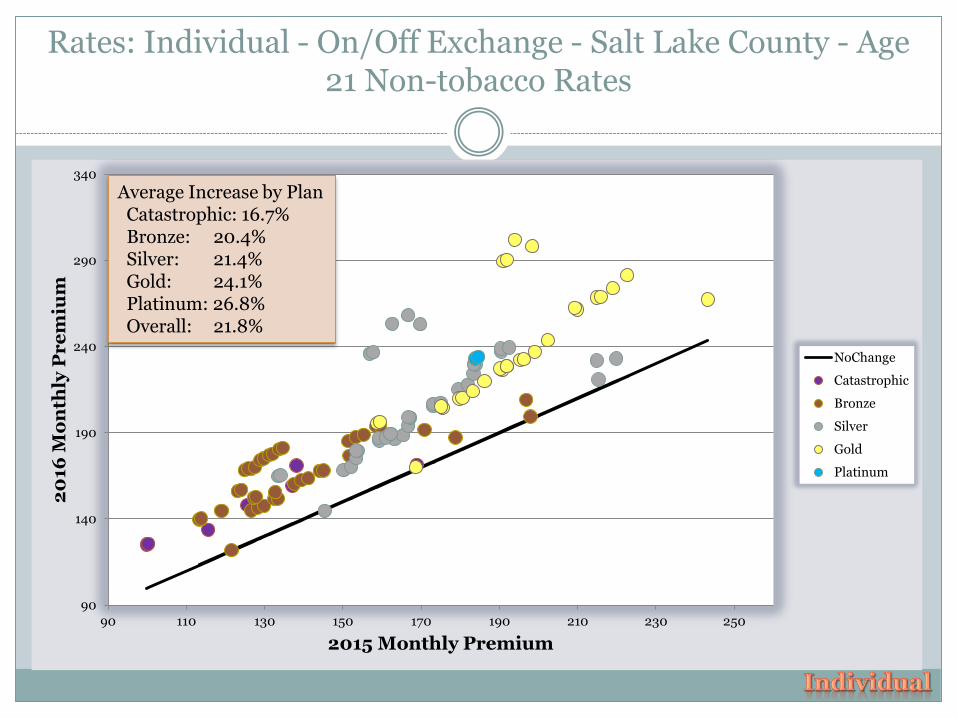
Rate Increase by Issuer - Individual
Individual – On/Off Exchange – Salt Lake County
These are not weighted by enrollment
This shows the straight average increase of plans that were offered in both 2015 and 2016 and maintained the same Plan ID number
IssuerRate Increase
PlanCount
Molina 0.2% 3
UnitedHealthcare Life 5.2% 8
Humana Ins Co 14.7% 3
Aetna of Utah 18.6% 8
SelectHealth 19.3% 60
Humana of Utah 23.7% 12
Arches 42.8% 21
All Issuers 21.8% 115
90
140
190
240
290
340
90 110 130 150 170 190 210 230 250
20
16 M
on
thly
Pr
em
ium
2015 Monthly Premium
NoChange
Catastrophic
Bronze
Silver
Gold
Platinum
Rates: Individual - On/Off Exchange - Salt Lake County - Age 21 Non-tobacco Rates
Average Increase by PlanCatastrophic: 16.7%Bronze: 20.4%Silver: 21.4%Gold: 24.1%Platinum: 26.8%Overall: 21.8%

90
140
190
240
290
340
90 110 130 150 170 190 210 230 250
20
16 M
on
thly
Pr
em
ium
2015 Monthly Premium
NoChange
Catastrophic
Bronze
Silver
Gold
Platinum
Rates: Individual – On Exchange - Salt Lake County - Age 21 Non-tobacco Rates
Average Increase by PlanCatastrophic: 20.5%Bronze: 21.0%Silver: 19.5%Gold: 21.4%Platinum: 26.8%Overall: 20.7%

90
140
190
240
290
340
90 110 130 150 170 190 210 230 250
20
16 M
on
thly
Pr
em
ium
2015 Monthly Premium
NoChange
Catastrophic
Bronze
Silver
Gold
Platinum
Rates: Individual - Exclusively Off Exchange - Salt Lake County - Age 21 Non-tobacco Rates
Average Increase by PlanCatastrophic: 12.2%Bronze: 19.6%Silver: 26.4%Gold: 32.2%Platinum: 26.8%Overall: 24.1%
90
140
190
240
290
340
20
16 M
on
thly
Pr
em
ium
Catastrophic
Bronze
Silver
Gold
Platinum
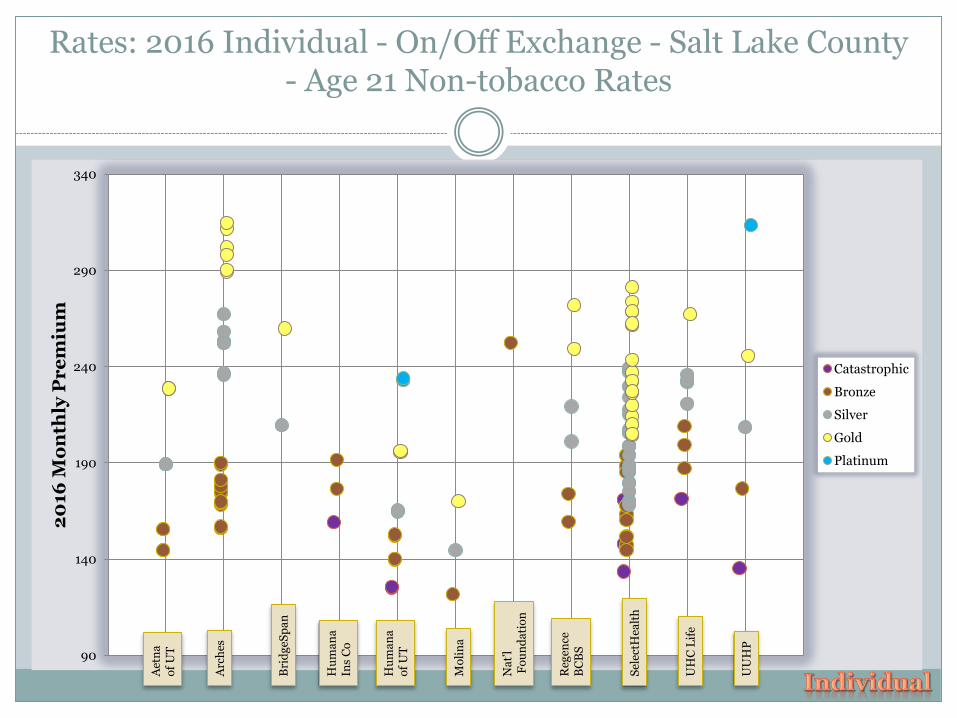
Rates: 2016 Individual - On/Off Exchange - Salt Lake County - Age 21 Non-tobacco Rates
Aet
na
o
f U
T
Arc
hes
Bri
dg
eSp
an
Hu
ma
na
Ins
Co
Hu
ma
na
of
UT
Mo
lin
a
Na
t’l
Fo
un
da
tio
n
Reg
ence
B
CB
S
Sel
ectH
ealt
h
UH
C L
ife
UU
HP
-
50
100
150
200
250
300
350
Min
Median
Max
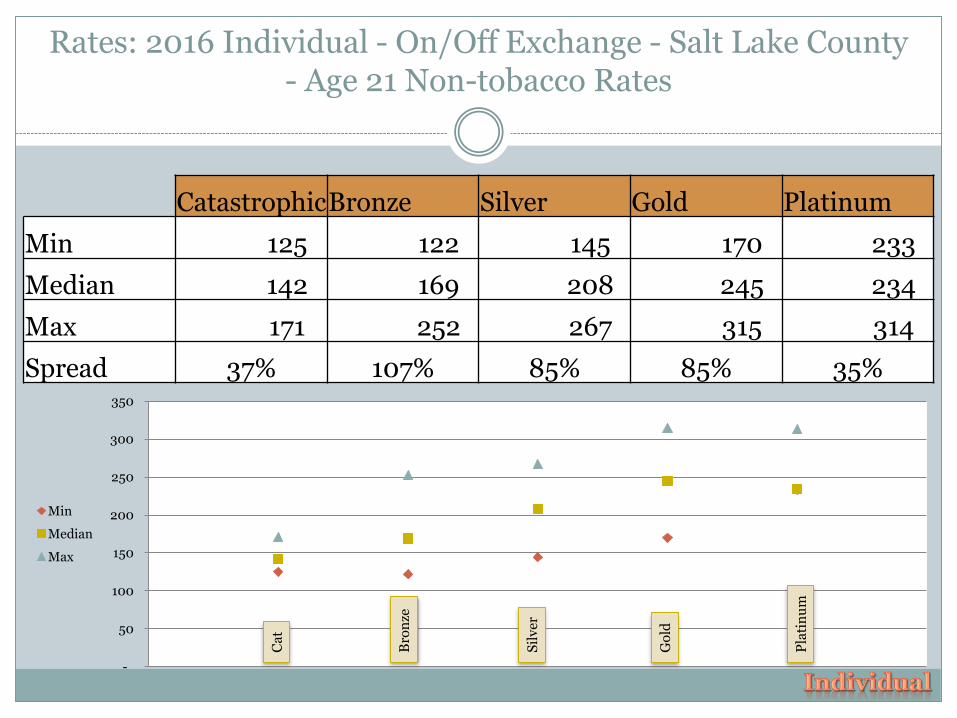
Rates: 2016 Individual - On/Off Exchange - Salt Lake County - Age 21 Non-tobacco Rates
CatastrophicBronze Silver Gold Platinum
Min 125 122 145 170 233
Median 142 169 208 245 234
Max 171 252 267 315 314
Spread 37% 107% 85% 85% 35%B
ron
ze
Ca
t
Sil
ve
r
Go
ld
Pla
tin
um

90
140
190
240
290
340
20
16 M
on
thly
Pr
em
ium
Catastrophic
Bronze
Silver
Gold
Platinum
Rates: Individual - On Exchange - Salt Lake County - Age 21 Non-tobacco Rates
Aet
na
o
f U
T
Arc
hes
Bri
dg
eSp
an
Hu
ma
na
Ins
Co
Hu
ma
na
of
UT
Mo
lin
a
Na
t’l
Fo
un
da
tio
n
Reg
ence
B
CB
S
Sel
ectH
ealt
h
UH
C L
ife
UU
HP

-
50
100
150
200
250
300
350
Min
Median
Max
Rates: Individual - On Exchange - Salt Lake County - Age 21 Non-tobacco Rates
CatastrophicBronze Silver Gold Platinum
Min 125 122 145 170 233
Median 135 166 199 233 273
Max 171 194 252 312 314
Spread 37% 63% 66% 70% 35%B
ron
ze
Ca
t
Sil
ve
r
Go
ld
Pla
tin
um
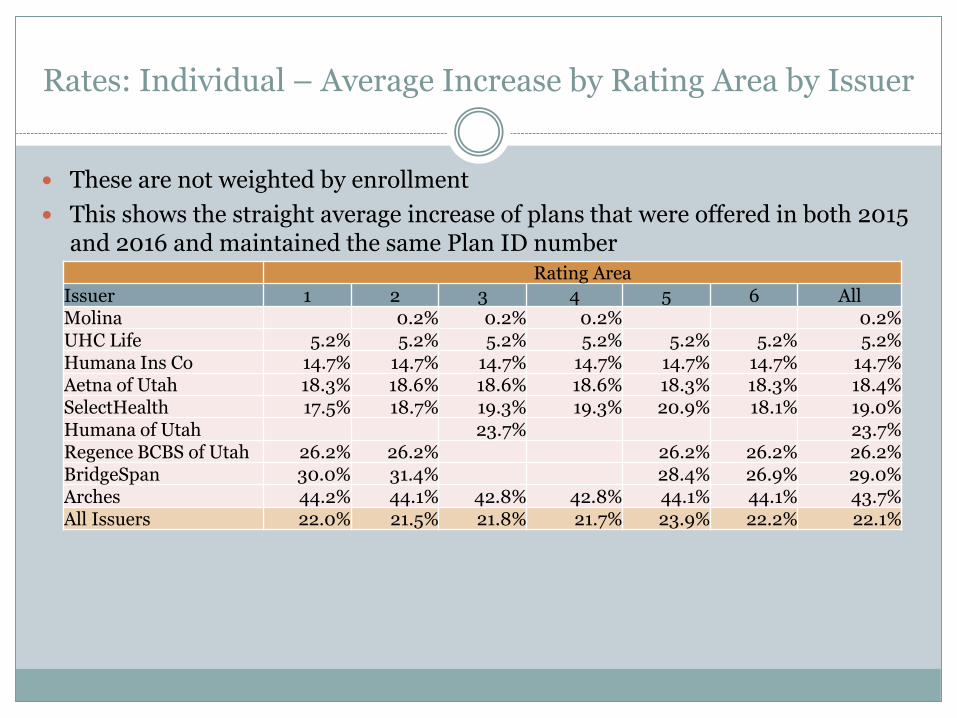
Rates: Individual – Average Increase by Rating Area by Issuer
These are not weighted by enrollment
This shows the straight average increase of plans that were offered in both 2015 and 2016 and maintained the same Plan ID number
Rating AreaIssuer 1 2 3 4 5 6 AllMolina 0.2% 0.2% 0.2% 0.2%UHC Life 5.2% 5.2% 5.2% 5.2% 5.2% 5.2% 5.2%Humana Ins Co 14.7% 14.7% 14.7% 14.7% 14.7% 14.7% 14.7%Aetna of Utah 18.3% 18.6% 18.6% 18.6% 18.3% 18.3% 18.4%SelectHealth 17.5% 18.7% 19.3% 19.3% 20.9% 18.1% 19.0%Humana of Utah 23.7% 23.7%Regence BCBS of Utah 26.2% 26.2% 26.2% 26.2% 26.2%BridgeSpan 30.0% 31.4% 28.4% 26.9% 29.0%Arches 44.2% 44.1% 42.8% 42.8% 44.1% 44.1% 43.7%All Issuers 22.0% 21.5% 21.8% 21.7% 23.9% 22.2% 22.1%

Individual: Silver Benchmark Plan
2nd Lowest Silver Plan by County by Year (age 21 rate)
County 2014 2015 2016 2015 / 2014 2016 / 2015 Rating Area
Cache 154 158 197 2% 25% 1
Rich 154 158 228 2% 44% 1
Box Elder 160 155 197 -3% 27% 2
Morgan 160 155 197 -3% 27% 2
Weber 149 153 176 3% 15% 2
Davis 141 145 165 3% 13% 3
Salt Lake 141 145 165 3% 13% 3
Summit 155 156 186 1% 19% 3
Tooele 155 156 186 1% 19% 3
Wasatch 155 156 189 1% 21% 3
Utah 150 155 173 3% 12% 4
Iron 162 166 198 2% 20% 5
Washington 162 166 198 2% 20% 5
Beaver 163 167 198 2% 19% 6
Carbon 167 167 229 0% 37% 6
Daggett 167 167 229 0% 37% 6
Duchesne 165 167 198 1% 19% 6
Emery 167 167 229 0% 37% 6
Garfield 165 167 198 1% 19% 6
Grand 167 167 229 0% 37% 6
Juab 165 167 198 1% 19% 6
Kane 167 167 229 0% 37% 6
Millard 163 167 198 2% 19% 6
Piute 163 167 198 2% 19% 6
San Juan 163 167 229 2% 37% 6
Sanpete 165 167 198 1% 19% 6
Sevier 163 167 198 2% 19% 6
Uintah 165 167 198 1% 19% 6
Wayne 163 167 198 2% 19% 6

Individual: Silver Benchmark Plan
2nd Lowest Silver Plan by County (age 21 rate)County 1st Lowest / 2nd Lowest Silver 1st Lowest 2nd Lowest Rating Area
Cache 1. SelectHealth / 2. SelectHealth 195 197 1
Rich 1. SelectHealth / 2. SelectHealth 225 228 1
Box Elder 1. SelectHealth / 2. SelectHealth 195 197 2
Morgan 1. SelectHealth / 2. SelectHealth 195 197 2
Weber 1. Molina / 2. SelectHealth 152 176 2
Davis 1. Molina / 2. Humana of Utah 145 165 3
Salt Lake 1. Molina / 2. Humana of Utah 145 165 3
Summit 1. Molina / 2. SelectHealth 145 186 3
Tooele 1. Molina / 2. SelectHealth 145 186 3
Wasatch 1. SelectHealth / 2. SelectHealth 186 189 3
Utah 1. Molina / 2. SelectHealth 152 173 4
Iron 1. SelectHealth / 2. SelectHealth 196 198 5
Washington 1. SelectHealth / 2. SelectHealth 196 198 5
Beaver 1. SelectHealth / 2. SelectHealth 196 198 6
Carbon 1. SelectHealth / 2. SelectHealth 226 229 6
Daggett 1. SelectHealth / 2. SelectHealth 226 229 6
Duchesne 1. SelectHealth / 2. SelectHealth 196 198 6
Emery 1. SelectHealth / 2. SelectHealth 226 229 6
Garfield 1. SelectHealth / 2. SelectHealth 196 198 6
Grand 1. SelectHealth / 2. SelectHealth 226 229 6
Juab 1. SelectHealth / 2. SelectHealth 196 198 6
Kane 1. SelectHealth / 2. SelectHealth 226 229 6
Millard 1. SelectHealth / 2. SelectHealth 196 198 6
Piute 1. SelectHealth / 2. SelectHealth 196 198 6
San Juan 1. SelectHealth / 2. SelectHealth 226 229 6
Sanpete 1. SelectHealth / 2. SelectHealth 196 198 6
Sevier 1. SelectHealth / 2. SelectHealth 196 198 6
Uintah 1. SelectHealth / 2. SelectHealth 196 198 6
Wayne 1. SelectHealth / 2. SelectHealth 196 198 6
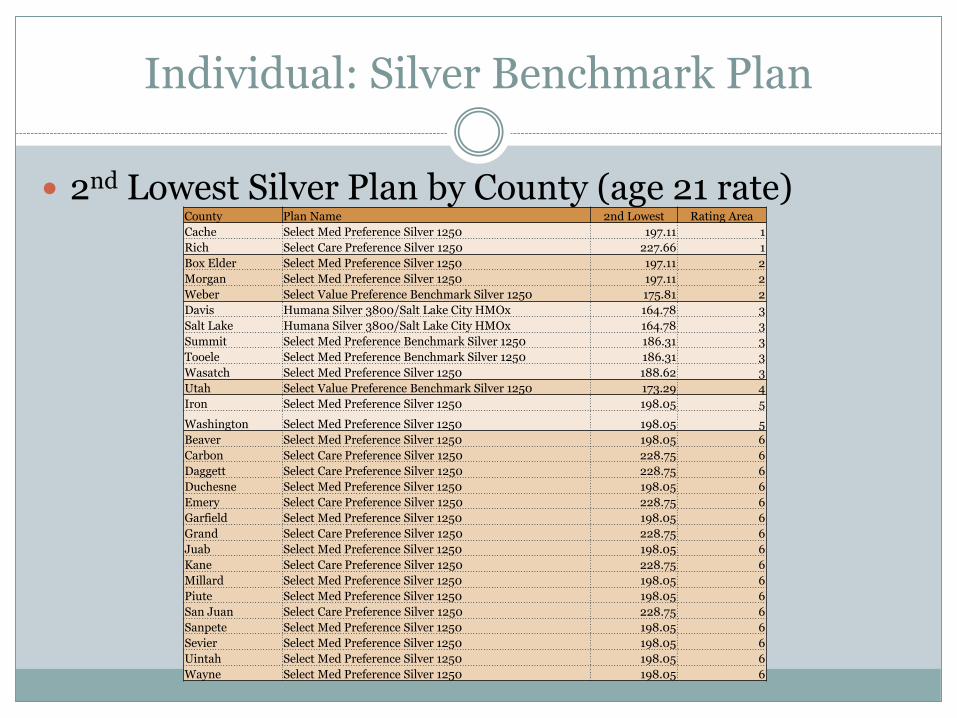
Individual: Silver Benchmark Plan
2nd Lowest Silver Plan by County (age 21 rate)County Plan Name 2nd Lowest Rating Area
Cache Select Med Preference Silver 1250 197.11 1
Rich Select Care Preference Silver 1250 227.66 1
Box Elder Select Med Preference Silver 1250 197.11 2
Morgan Select Med Preference Silver 1250 197.11 2
Weber Select Value Preference Benchmark Silver 1250 175.81 2
Davis Humana Silver 3800/Salt Lake City HMOx 164.78 3
Salt Lake Humana Silver 3800/Salt Lake City HMOx 164.78 3
Summit Select Med Preference Benchmark Silver 1250 186.31 3
Tooele Select Med Preference Benchmark Silver 1250 186.31 3
Wasatch Select Med Preference Silver 1250 188.62 3
Utah Select Value Preference Benchmark Silver 1250 173.29 4
Iron Select Med Preference Silver 1250 198.05 5
Washington Select Med Preference Silver 1250 198.05 5
Beaver Select Med Preference Silver 1250 198.05 6
Carbon Select Care Preference Silver 1250 228.75 6
Daggett Select Care Preference Silver 1250 228.75 6
Duchesne Select Med Preference Silver 1250 198.05 6
Emery Select Care Preference Silver 1250 228.75 6
Garfield Select Med Preference Silver 1250 198.05 6
Grand Select Care Preference Silver 1250 228.75 6
Juab Select Med Preference Silver 1250 198.05 6
Kane Select Care Preference Silver 1250 228.75 6
Millard Select Med Preference Silver 1250 198.05 6
Piute Select Med Preference Silver 1250 198.05 6
San Juan Select Care Preference Silver 1250 228.75 6
Sanpete Select Med Preference Silver 1250 198.05 6
Sevier Select Med Preference Silver 1250 198.05 6
Uintah Select Med Preference Silver 1250 198.05 6
Wayne Select Med Preference Silver 1250 198.05 6

Small Employer Market - Medical
Count of Plans
IssuerNew in 2016? On Exchange Off Exchange
Aetna Life 0 5
Aetna of Utah (Altius) 0 22
Arches 20 37
HSA Health X 6 6
Humana Ins Co 0 35
National Health Ins Co 0 16
Regence BCBS of Utah 0 42
SelectHealth 48 48
UnitedHealthcare Ins 0 55
UnitedHealthcare of Utah 16 94
WMI 0 12
Total 90 372
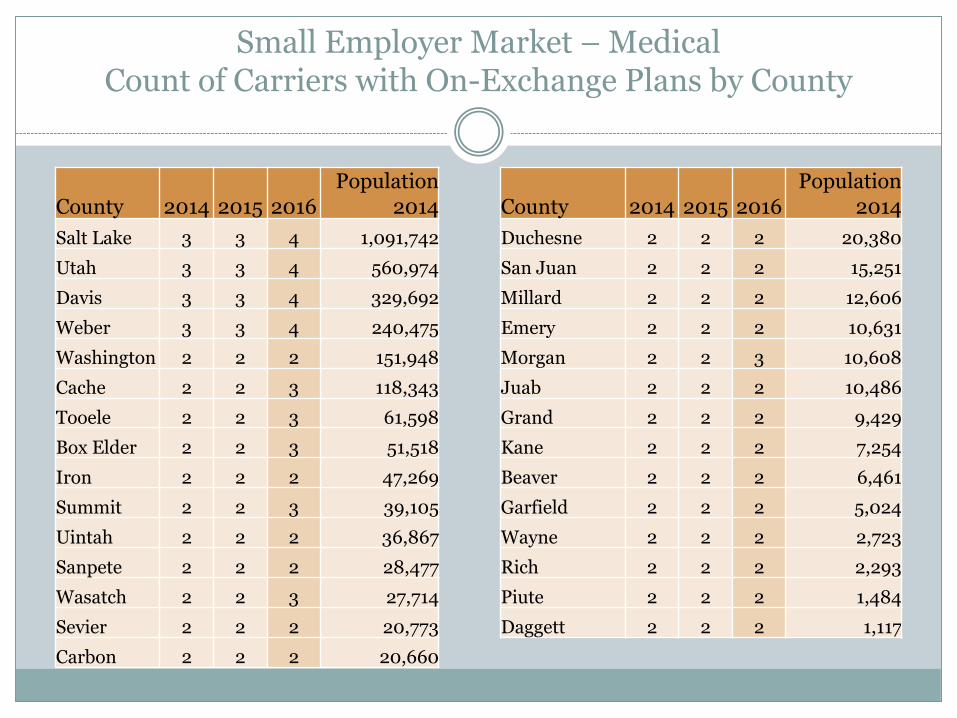
Small Employer Market – Medical Count of Carriers with On-Exchange Plans by County
County 2014 2015 2016Population
2014 County 2014 2015 2016Population
2014
Salt Lake 3 3 4 1,091,742 Duchesne 2 2 2 20,380
Utah 3 3 4 560,974 San Juan 2 2 2 15,251
Davis 3 3 4 329,692 Millard 2 2 2 12,606
Weber 3 3 4 240,475 Emery 2 2 2 10,631
Washington 2 2 2 151,948 Morgan 2 2 3 10,608
Cache 2 2 3 118,343 Juab 2 2 2 10,486
Tooele 2 2 3 61,598 Grand 2 2 2 9,429
Box Elder 2 2 3 51,518 Kane 2 2 2 7,254
Iron 2 2 2 47,269 Beaver 2 2 2 6,461
Summit 2 2 3 39,105 Garfield 2 2 2 5,024
Uintah 2 2 2 36,867 Wayne 2 2 2 2,723
Sanpete 2 2 2 28,477 Rich 2 2 2 2,293
Wasatch 2 2 3 27,714 Piute 2 2 2 1,484
Sevier 2 2 2 20,773 Daggett 2 2 2 1,117
Carbon 2 2 2 20,660
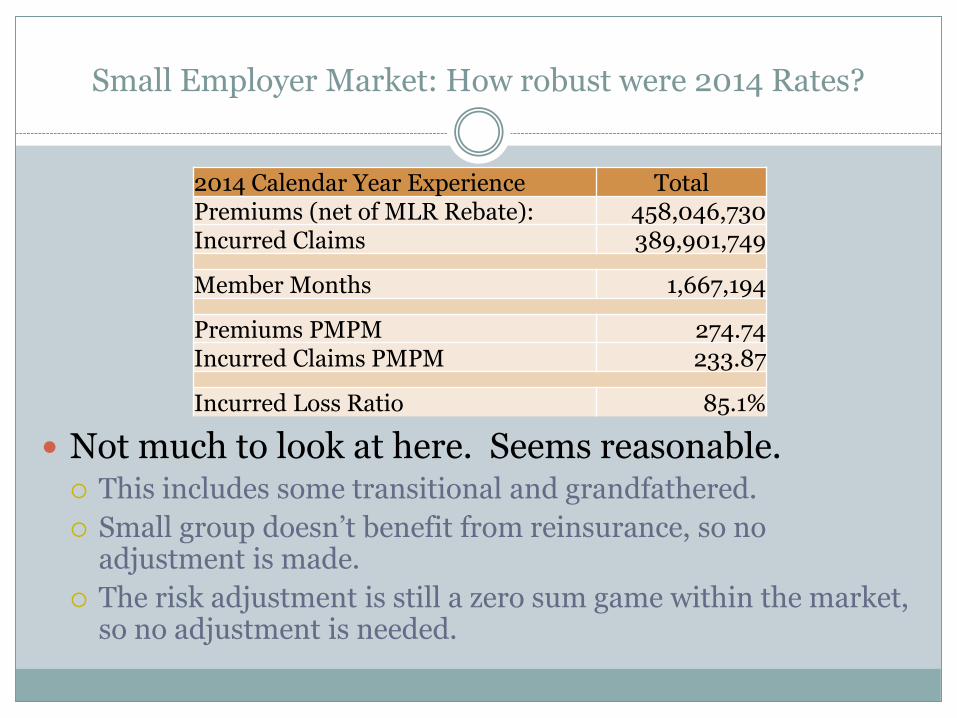
Small Employer Market: How robust were 2014 Rates?
2014 Calendar Year Experience TotalPremiums (net of MLR Rebate): 458,046,730 Incurred Claims 389,901,749
Member Months 1,667,194
Premiums PMPM 274.74Incurred Claims PMPM 233.87
Incurred Loss Ratio 85.1%
Not much to look at here. Seems reasonable. This includes some transitional and grandfathered.
Small group doesn’t benefit from reinsurance, so no adjustment is made.
The risk adjustment is still a zero sum game within the market, so no adjustment is needed.
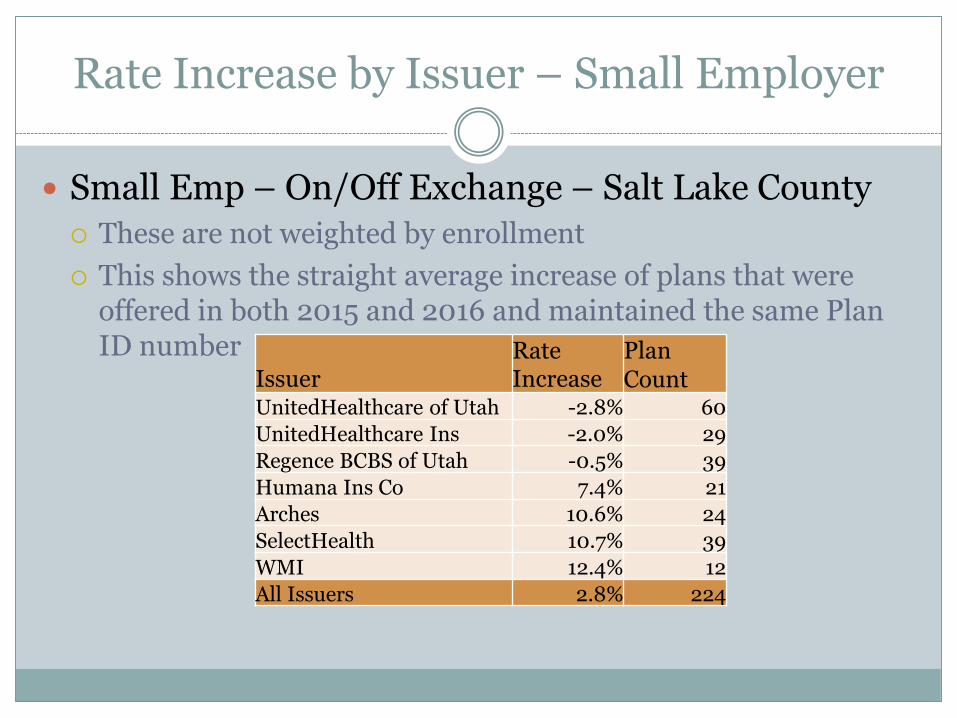
Rate Increase by Issuer – Small Employer
Small Emp – On/Off Exchange – Salt Lake County
These are not weighted by enrollment
This shows the straight average increase of plans that were offered in both 2015 and 2016 and maintained the same Plan ID number
IssuerRate Increase
PlanCount
UnitedHealthcare of Utah -2.8% 60
UnitedHealthcare Ins -2.0% 29
Regence BCBS of Utah -0.5% 39
Humana Ins Co 7.4% 21
Arches 10.6% 24
SelectHealth 10.7% 39
WMI 12.4% 12
All Issuers 2.8% 224

130
180
230
280
330
380
130 180 230 280 330 380
20
16 M
on
thly
Pr
em
ium
2015 Monthly Premium
NoChange
Bronze
Silver
Gold
Platinum
Rates: Small Employer - On/Off Exchange - Salt Lake County - Age 21 Non-tobacco Rates
Average Increase by PlanBronze: 3.6%Silver: 1.1%Gold: 4.4%Platinum: 3.1%Overall: 2.8%

130
180
230
280
330
380
130 180 230 280 330 380
20
16 M
on
thly
Pr
em
ium
2015 Monthly Premium
NoChange
Bronze
Silver
Gold
Platinum
Rates: Small Employer - On Exchange - Salt Lake County -Age 21 Non-tobacco Rates
Average Increase by PlanBronze: 7.7%Silver: 6.0%Gold: 9.1%
Overall: 7.6%
130
180
230
280
330
380
130 180 230 280 330 380
20
16 M
on
thly
Pr
em
ium
2015 Monthly Premium
NoChange
Bronze
Silver
Gold
Platinum
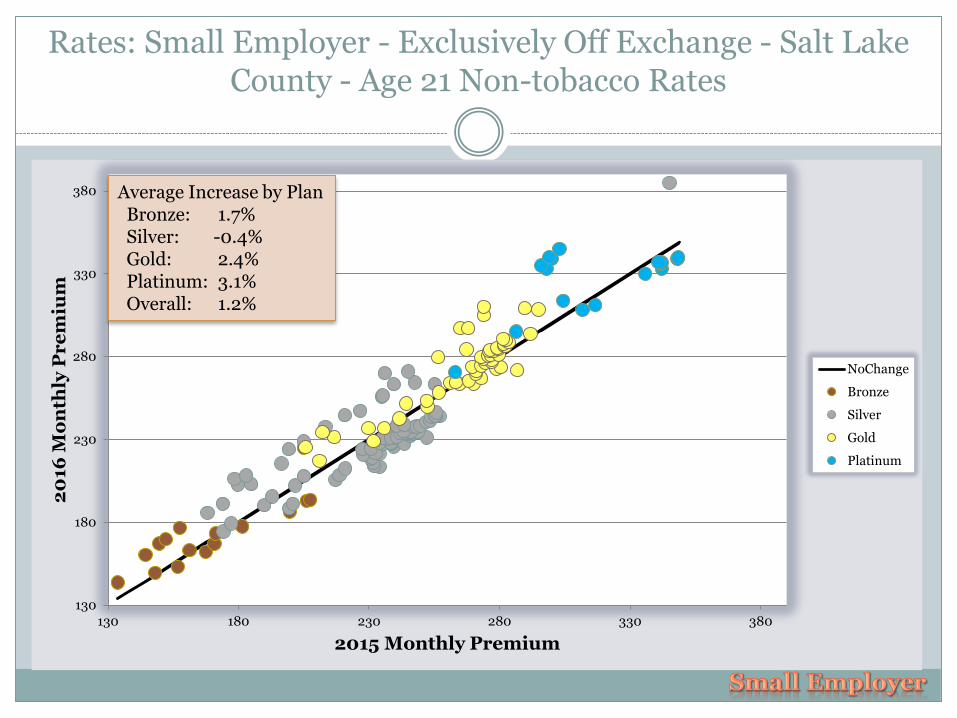
Rates: Small Employer - Exclusively Off Exchange - Salt Lake County - Age 21 Non-tobacco Rates
Average Increase by PlanBronze: 1.7%Silver: -0.4%Gold: 2.4%Platinum: 3.1% Overall: 1.2%

90
140
190
240
290
340
390
20
16 M
on
thly
Pr
em
ium
Bronze
Silver
Gold
Platinum
Rates: Small Employer - On/Off Exchange - Salt Lake County - Age 21 Non-tobacco Rates
Aet
na
Aet
na
of
UT
Arc
hes
HS
AH
ealt
h
Hu
ma
na
In
s
Na
t’l
Hea
lth
Reg
ence
BC
BS
Sel
ectH
ealt
h
UH
C I
ns
UH
C o
f U
T
WM
I

90
140
190
240
290
340
390
20
16 M
on
thly
Pr
em
ium
Bronze
Silver
Gold
Platinum
Rates: Small Employer - On Exchange - Salt Lake County -Age 21 Non-tobacco Rates
Aet
na
Aet
na
of
UT
Arc
hes
HS
AH
ealt
h
Hu
ma
na
In
s
Na
t’l
Hea
lth
Reg
ence
BC
BS
Sel
ectH
ealt
h
UH
C I
ns
UH
C o
f U
T
WM
I
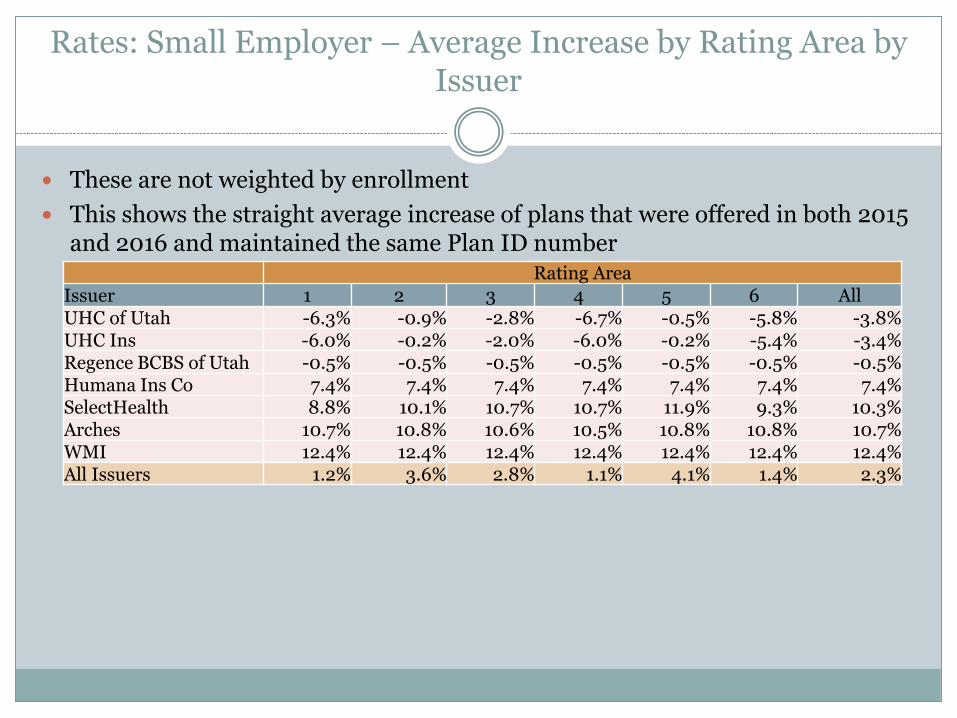
Rates: Small Employer – Average Increase by Rating Area by Issuer
These are not weighted by enrollment
This shows the straight average increase of plans that were offered in both 2015 and 2016 and maintained the same Plan ID number
Rating AreaIssuer 1 2 3 4 5 6 AllUHC of Utah -6.3% -0.9% -2.8% -6.7% -0.5% -5.8% -3.8%UHC Ins -6.0% -0.2% -2.0% -6.0% -0.2% -5.4% -3.4%Regence BCBS of Utah -0.5% -0.5% -0.5% -0.5% -0.5% -0.5% -0.5%Humana Ins Co 7.4% 7.4% 7.4% 7.4% 7.4% 7.4% 7.4%SelectHealth 8.8% 10.1% 10.7% 10.7% 11.9% 9.3% 10.3%Arches 10.7% 10.8% 10.6% 10.5% 10.8% 10.8% 10.7%WMI 12.4% 12.4% 12.4% 12.4% 12.4% 12.4% 12.4%All Issuers 1.2% 3.6% 2.8% 1.1% 4.1% 1.4% 2.3%

Rates: Individual vs Small Employer
2 of the three R’s disappear in 2017 pricingeinsurance and isk Corridors
This should result in higher individual premiums
There are logical reasons why the small employer rates should be lower than the individual rates You have to be kind of healthy to work
Employers contribute to premium costs so that more of the good risks will sign up
Wellness programs
Outside of open enrollment, employers have to meet participation rate requirements
…but right now, the individual rates are lower than small employer rates
Rates: Individual vs Small Employer
By October 2017 all of the transitional policies (individual and small employer) should enter the ACA market They’re assumed to have better experience than the current
market
Risk adjustment makes it unclear which direction this pushes rates
Small employer experience looks reasonable 85% 2014 loss ratio for overall market
Individual experience looks horrible 137% 2014 loss ratio for overall market (unadjusted for reins)
90
140
190
240
290
340
390
440
20
15 M
on
thly
Pr
em
ium
Catastrophic
Bronze
Silver
Gold
Platinum
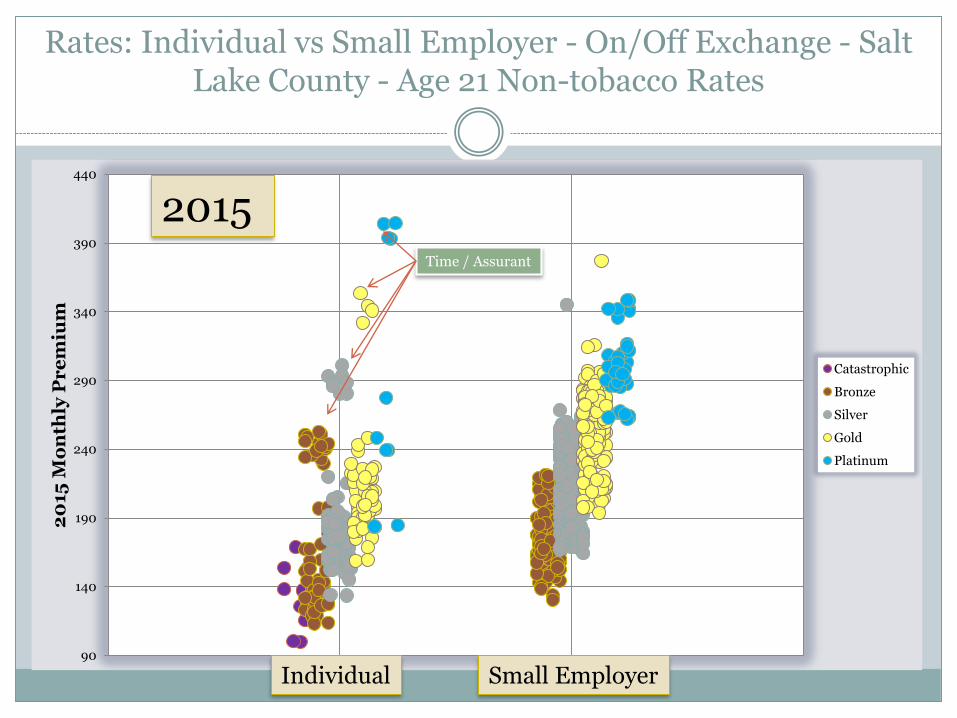
Rates: Individual vs Small Employer - On/Off Exchange - Salt Lake County - Age 21 Non-tobacco Rates
Individual Small Employer
2015Time / Assurant
90
140
190
240
290
340
390
440
20
15 M
on
thly
Pr
em
ium
Catastrophic
Bronze
Silver
Gold
Platinum
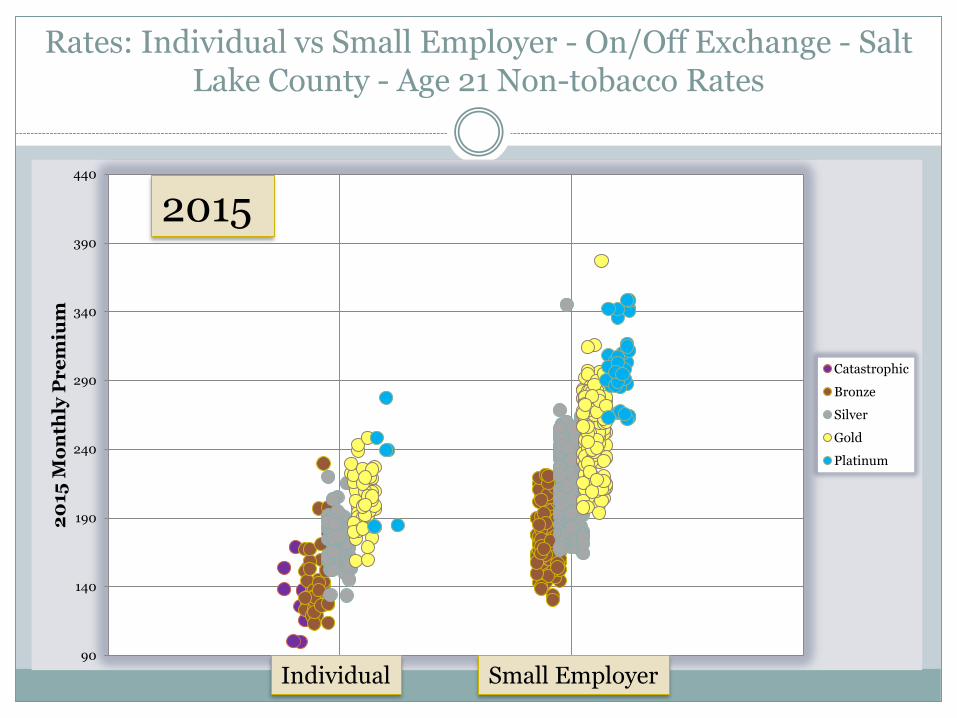
Rates: Individual vs Small Employer - On/Off Exchange - Salt Lake County - Age 21 Non-tobacco Rates
Individual Small Employer
2015

90
140
190
240
290
340
390
440
20
16 M
on
thly
Pr
em
ium
Catastrophic
Bronze
Silver
Gold
Platinum
Rates: Individual vs Small Employer - On/Off Exchange - Salt Lake County - Age 21 Non-tobacco Rates
2016
Individual Small Employer

Rates: Individual vs Small Employer
Will we see large increases in the individual market for 2017?
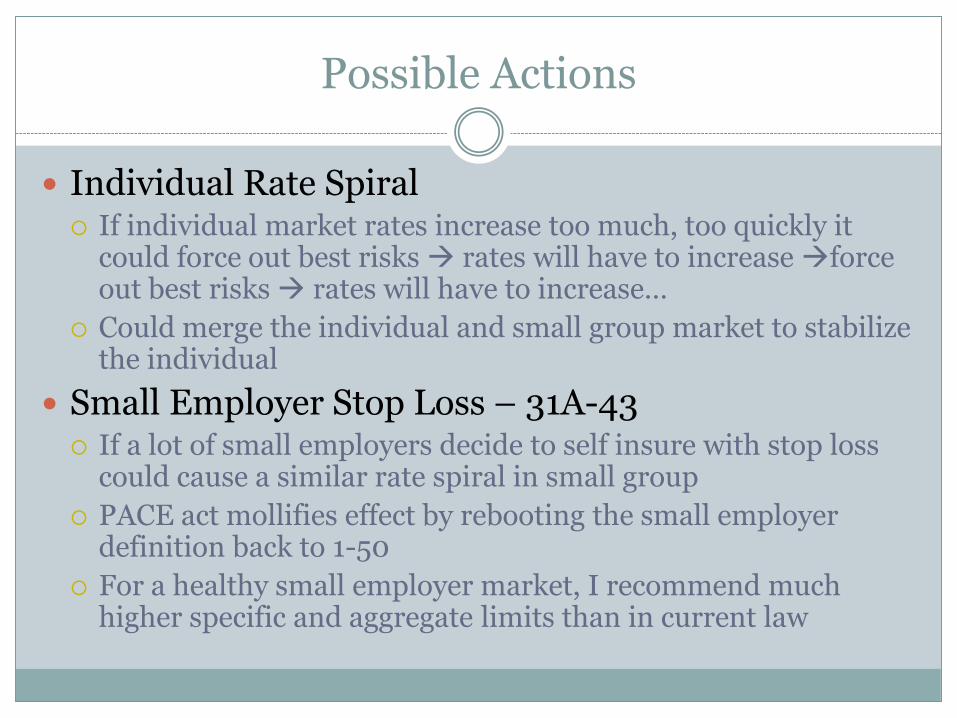
Possible Actions
Individual Rate Spiral If individual market rates increase too much, too quickly it
could force out best risks rates will have to increase force out best risks rates will have to increase…
Could merge the individual and small group market to stabilize the individual
Small Employer Stop Loss – 31A-43 If a lot of small employers decide to self insure with stop loss
could cause a similar rate spiral in small group
PACE act mollifies effect by rebooting the small employer definition back to 1-50
For a healthy small employer market, I recommend much higher specific and aggregate limits than in current law

Are we getting our fair share?
Cross Subsidization – 3R’s Some concern that we are subsidizing other states with the
3R’s.
isk adjustment is budget neutral at the market level, so no subsidization
isk Corridors – for 2014 Utah paid in $119K. Requested out $109M. Paid out at 12.6% = 13.8M.
Other states are subsidizing us
If it were a state level program, and budget neutral we would only be able to pay 0.1% of requests, so 12.6% is a good deal
einsurance – for 2014 Utah received about $80M. We may never know how much was paid in for Utah
Multi state companies pay the fee globally, not by state
koniec