UT System SmartBook · 4 Enrollment – UT System Fall 2014 Total 217,112 Academic 203,566 Health...
32
UT System SmartBook A Handy Reference v2 ‐ published January 21, 2015
Transcript of UT System SmartBook · 4 Enrollment – UT System Fall 2014 Total 217,112 Academic 203,566 Health...
UTSystemSmartBookA HandyReference
v2 ‐ published January 21, 2015
2
produced by the Office of Strategic Initiatives
CONTENTS
STUDENTS .................................. 3
NOTES PAGE ................................ 14
FACULTY / EMPLOYEES ............... 15
NOTES PAGE .............................. 20
RESEARCH / TECH TRANSFER ...... 21
BUDGET / FINANCE ..................... 25
NOTES PAGE ................................ 32
Notes:
Data has been updated to reflect the most recent numbers available from the draft THECB accountability system. Until these data are finalized, there is some chance that these numbers could change.
Some data may not be available for The University of Texas at Brownsville because of their unique enrollment partnership with Texas Southmost College. Though The University of Texas at Brownsville (UTB) began operating independently in the 2013‐14 academic year, its partnership with the community college, Texas Southmost College (TSC), will end by 8/31/2015.
The University of Texas Health Science Center at Tyler (UT Health Northeast) did not enroll students until fall 2012.

3
STUDENTS
Contents
Enrollment ................................................................................. 4
Undergraduate Demographics ................................................... 6
Cost of Attendance .................................................................... 7
Degrees Awarded ....................................................................... 8
Graduation Rates ..................................................................... 11
Post‐Graduation Wages for Baccalaureate Graduates ............. 12
Post‐Graduation Wages for Medical School Graduates ........... 13
STUDENTS

4
Enrollment–UTSystemFall 2014
Total 217,112 Academic 203,566 Health 13,546 Undergraduate + Post‐bacc 163,660 Graduate / Professional 53,452
59% of all UT System students—and 67% of undergraduates—are minority students (Hispanic, African‐American, Asian‐American, and Other).
Enrollment has increased 3% over the past five years, with the largest percent increase at the master’s and professional levels (11% and 3%, respectively).
White32%
Asian10%
Other (includes unknowns)
3%
Intl9%
Hispanic39%
African American
7%
by Ethnicity
STUDENTS

5
EnrollmentbyInstitutionFall 2014
Undergrad Post‐Bacc Master’s Doctoral Professional Total 5‐Yr Change UTA 24,476 1,261 8,032 1,099 0 34,868 5.7% UT Austin 39,523 0 5,352 4,817 1,620 51,312 0.2% UTB 6,924 76 923 86 0 8,009 ‐47.4% UTD 14,033 649 7,474 896 43 23,095 34.8% UTEP 19,815 99 2,434 612 83 23,043 4.5% UTPA 17,858 342 2,665 150 0 21,015 12.1% UTPB 4,661 333 566 0 0 5,560 36.8% UTSA 24,285 297 3,264 782 0 28,628 ‐5.4% UTT 5,634 378 1,914 110 0 8,036 24.7% Academic 157,209 3,435 32,624 8,552 1,746 203,566 2.8% UTSWMC 5 19 897 436 953 2,310 ‐6.4% UTMB 708 128 893 265 1,217 3,211 20.7% UTHSCH 657 370 1,153 958 1,418 4,556 1.6% UTHSCSA 825 12 537 287 1,486 3,147 ‐3.8% UTMDA 292 ‐ 11 ‐ ‐ 303 22.2% UTHSCT ‐ ‐ 19 ‐ ‐ 19 ‐ Health 2,487 529 3,510 1,946 5,074 13,546 3.2% Total 159,696 3,964 36,134 10,498 6,820 217,112 2.8%
STUDENTS
6
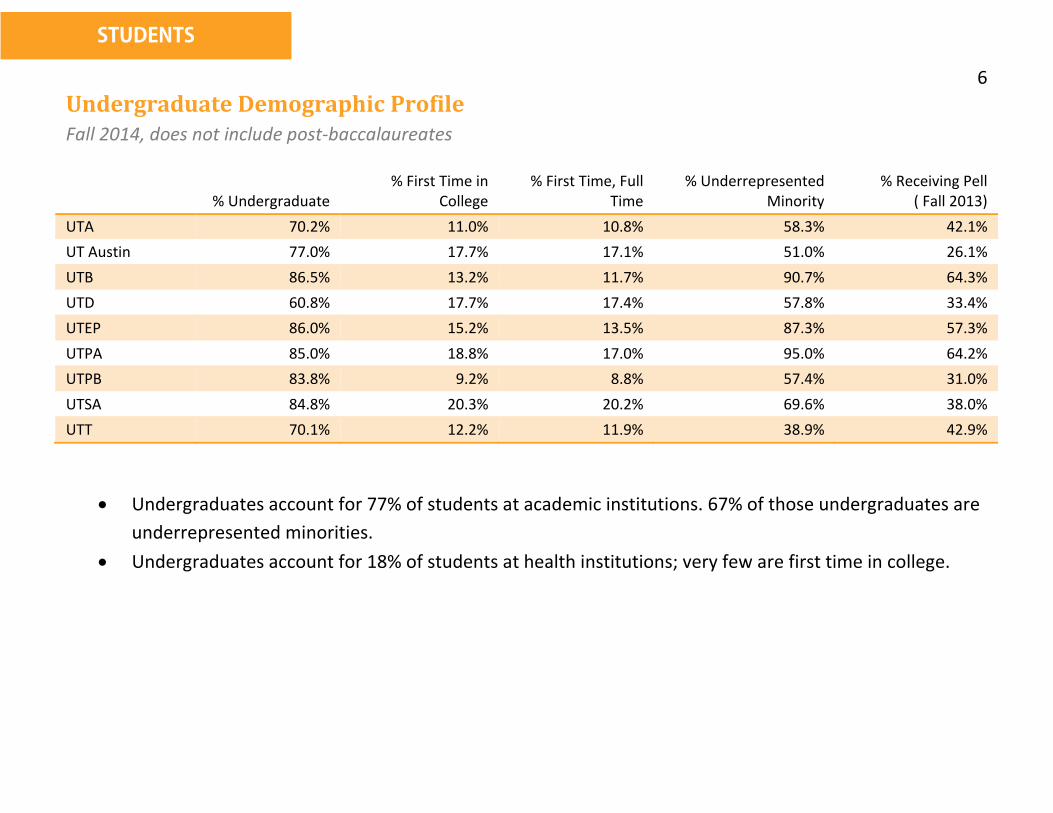
UndergraduateDemographicProfileFall 2014, does not include post‐baccalaureates
% Undergraduate
% First Time in College
% First Time, Full Time
% Underrepresented Minority
% Receiving Pell ( Fall 2013)
UTA 70.2% 11.0% 10.8% 58.3% 42.1% UT Austin 77.0% 17.7% 17.1% 51.0% 26.1% UTB 86.5% 13.2% 11.7% 90.7% 64.3% UTD 60.8% 17.7% 17.4% 57.8% 33.4% UTEP 86.0% 15.2% 13.5% 87.3% 57.3% UTPA 85.0% 18.8% 17.0% 95.0% 64.2% UTPB 83.8% 9.2% 8.8% 57.4% 31.0% UTSA 84.8% 20.3% 20.2% 69.6% 38.0% UTT 70.1% 12.2% 11.9% 38.9% 42.9%
Undergraduates account for 77% of students at academic institutions. 67% of those undergraduates are underrepresented minorities.
Undergraduates account for 18% of students at health institutions; very few are first time in college.
STUDENTS

7
CostofAttendance(In‐State)AY 2012‐13
Avg In‐State Total Academic Cost
% Receiving Need‐Based Grant Aid
Avg % Discount for those Receiving Aid
Avg Net Academic Cost Avg % Discount
UTA $9,292 54.5% 75.0% $5,493 40.9%
UT Austin 9,790 37.7 88.4 6,528 33.3
UTB 6,258 72.4 95.1 1,948 68.9
UTD 11,537 46.7 70.1 7,759 32.7
UTEP 7,116 66.6 99.8 2,383 66.5
UTPA 6,271 78.4 100.0 1,354 78.4
UTPB 6,708 55.7 89.6 3,358 49.9
UTSA 8,984 57.3 68.1 5,480 39.0
UTT 7,222 60.1 88.5 3,377 53.2
Average $8,782 54.0% 80.4% $4,970 43.4%
Average Total Academic Cost represents the sum of all statutory, designated, and board‐authorized tuition, along with mandatory fees (including college and course fees). It is derived from actual fee bills for resident undergraduate students enrolled for 15 semester credit hours in the fall and spring semesters.
Average Net Academic Cost for all full‐time students is derived by subtracting the total need‐based grant aid from the total academic costs of all students and then dividing by the total number of students.
STUDENTS STUDENTS

8
Degrees–UTSystemAY 2013‐14
Total 51,882 Academic 47,202 Health 4,680 Undergraduate 34,017 Graduate / Professional 17,865
49% of all UT System degrees—and 57% of undergraduate degrees—are awarded to minority students (Hispanic, African‐American, Asian‐American, and Other).
Degrees awarded have increased 20% over the past five years, with the largest percent increase at the master’s and doctoral levels (31% and 23%, respectively). Baccalaureate degrees awarded increased 17%.
STUDENTS
White39%
Asian‐American
10%
Other2%
Intl10%
Hispanic31%
African‐American
7%Unknown
2%
by Ethnicity

9
DegreesbyInstitutionAY 2013‐14
Baccalaureate Master’s Doctoral Professional All Certificates Total 5‐Yr Change UTA 6,738 2,502 225 0 182 9,647 35.3% UT Austin 9,482 3,145 877 477 0 13,981 5.5% UTB 1,069 276 2 0 0 1,347 7.0% UTD 2,811 2,960 178 10 27 5,986 27.1% UTEP 3,214 985 127 24 18 4,368 8.9% UTPA 2,785 740 18 0 6 3,549 7.8% UTPB 626 196 0 0 17 839 18.7% UTSA 4,552 1,180 105 0 0 5,837 15.4% UTT 1,084 550 11 0 3 1,648 8.4% Academic 32,361 12,534 1,543 511 253 47,202 16.4% UTSWMC 2 103 92 257 196 650 2.5% UTMB 456 244 50 286 107 1,143 26.4% UTHSCH 459 499 196 310 32 1,496 31.5% UTHSCSA 435 235 49 380 147 1,246 2.9% UTMDA 142 0 0 0 0 142 22.5% UTHSCT 0 3 0 0 0 3 ‐‐ Health 1,494 1,084 387 1,233 482 4,680 18.4% Total 33,855 13,618 1,930 1,744 735 51,882 16.6%
STUDENTS

10
STEMDegreesasaPercentofTotalDegreesAwardedUT System Academic Institutions, 2013
STEM Degrees as a Percent of Total Degrees Awarded
UT System Academic ‐ # of STEM Degrees
UT System Academic
Other TX Public Academic National Public
Baccalaureate 7,274 23.3% 18.8% 19.9% Master’s 2,567 20.3% 16.8% 18.2% Doctoral 665 47.3% 37.6% 44.3% Total 10,506 23.2% 18.7% 20.1%
Based on the National Science Foundation STEM classification. Includes chemistry; engineering; mathematics; physics/astronomy; the agricultural, computer, environmental, geo‐ and life/biological sciences; and technology/technician‐related fields such as electronic and computer engineering and environmental control technology.
STUDENTS

11
GraduationRates
4‐Year Same (2010 cohort) 5‐Yr Trend
6‐Year Same or Other
(2008 cohort) 5‐Yr Trend
4‐Yr Rate for Community
College Transfers 5‐Yr Trend
UTA 20.6% 2.6% 52.7% 2.0% 48.8% 1.8% UT Austin 53.5% 3.1% 83.6% 0.7% 70.9% 1.3% UTD 50.5% 5.9% 75.9% 5.2% 60.7% 0.9% UTEP 14.8% 3.8% 42.2% 4.8% 47.9% ‐2.4% UTPA 18.9% 2.0% 49.3% 10.4% 54.2% ‐5.9% UTPB 20.8% 3.3% 44.6% 0.0% 43.2% ‐7.7% UTSA 12.6% 2.8% 53.4% 9.4% 52.1% 2.8% UTT 23.1% ‐2.4% 58.2% 8.6% 54.3% 0.1%
Graduation rates are for first‐time, full‐time, degree‐seeking undergraduates who begin in the summer/fall of the enrollment year and graduate within four years from the same institution or six years from the same or another TX institution. The last two columns refer to four‐year graduation rates of community college transfer students. These four‐year transfer rates represent the percentage of first‐time transfer students entering a UT institution with 30 or more semester credit hours who received an undergraduate degree within four years of enrolling at the same UT institution.
STUDENTS STUDENTS

12
Post‐GraduationEarningsforBaccalaureateGraduatesFoundWorkinginTexasFor graduates from 2002‐2012, adjusted for inflation
1st‐Year
Median Wage 5th‐Year
Median Wage 10th‐Year
Median Wage
Average Student Loan
Debt % FTICs with Loan Debt
UTA $46,783 $54,781 $63,419 $19,283 53.8 UT Austin 44,650 57,132 75,003 22,778 46.2 UTB 39,485 47,148 49,783 12,224 56.1 UTD 45,172 57,563 70,813 15,597 58.8 UTEP 43,175 50,306 52,707 17,341 61.8 UTPA 42,261 49,198 52,177 12,781 58.5 UTPB 40,860 47,930 52,386 14,968 53.1 UTSA 39,692 50,097 54,850 24,242 64.3 UTT 42,234 49,018 52,918 18,010 46.3 UTSWMC 49,941 62,219 76,851 UTMB 66,857 78,656 87,971 UTHSCH 65,317 75,871 85,900 UTHSCSA 57,278 66,719 75,543 UTMDA 55,521 68,845 71,096 UT System $44,054 $52,645 $60,357
NOTES: Earnings data reflect data for those employed full‐time, full‐year in the state of Texas. For baccalaureate graduates, the average debt is estimated for those that initially enrolled at the institution as first‐time‐in‐college students. 1st‐Year looks at 11 cohorts. 5th‐Year looks at 6 cohorts. 10th‐Year looks at 2 cohorts. Overall, match rates (or those found working full‐time, full‐year in TX) for UT System at the first, fifth, and tenth year after graduation are 49%, 56% and 55% respectively. Student loan debt not included at HRIs because of limited number of first time in college students.
STUDENTS

13
Post‐GraduationEarningsforMedicalSchoolGraduatesFoundWorkinginTexas
Avg Student Loan Debt (see note) % w/ Debt
1st‐Yr Median Wage
5th‐Yr Median Wage
10th‐Yr Median Wage
UTSWMC $103,581 85.7 $49,173 $138,096 $260,937 UTMB 126,211 86.4 47,852 140,123 242,565 UT HSC‐Houston 119,672 86.8 46,661 142,864 269,821 UT HSC‐San Antonio 126,031 86.9 47,017 141,987 260,523
NOTES: Average student loan is the average of the student loan debt that borrowers owed at the time they earned their degree. The figures here only include debt incurred at this medical school.
STUDENTS

14
Notes________________________________________________________________________________________________________________________________________________________________________________________________________________________________________________________________________________________________________________________________________________________________________________________________________________________________________________________________________________________________________________________________________________________________________________________________________________________________________________________________________________________________________________________________________________________________________________________________________________________________________________________________________________________________________________________________________________________________________________________________________________________________________________________________________________________________________________________
STUDENTS
15
FACULTY/EMPLOYEES
Content
Faculty Headcount by Status .............. 16
Employee Headcount ......................... 17
Faculty Awards and Honors ............... 18
Faculty Appointments ........................ 19
FACULTY / EMPLOYEES

16
FacultyHeadcountbyStatusFall 2013
Tenured/ Tenure‐Track
Other Professional Total
UTA 631 1,067 1,698 UT Austin 1,943 1,425 3,368 UTB 203 192 395 UTD 510 535 1,045 UTEP 509 667 1,176 UTPA 504 338 842 UTPB 89 144 233 UTSA 622 822 1,444 UTT 187 248 435 Academic 5,198 5,438 10,636 UTSWMC 400 1,819 2,219 UTMB 390 737 1,127 UTHSCH 475 1,317 1,792 UTHSCSA 470 1,206 1,676 UTMDA 616 1,579 2,195 UTHSCT 99 99 Health 2,351 6,757 9,108
Total 7,549 12,195 19,744
FACULTY / EMPLOYEES

17
EmployeeHeadcountFall 2013
This excludes 23,485 student employees such as teaching assistants.
Personnel Faculty (all ranks) UTA 2,243 1,698 UT Austin 11,274 3,368 UTB 685 395 UTD 2,471 1,045 UTEP 2,030 1,176 UTPA 1,479 842 UTPB 257 233 UTSA 3,322 1,444 UTT 886 435 Academic 24,647 10,636 UTSWMC 10,056 2,219 UTMB 9,674 1,127 UTHSCH 4,208 1,792 UTHSCSA 3,775 1,676 UTMDA 17,354 2,195 UTHSCT 816 99 Health 45,883 9,108 System Admin 602 ‐‐ Total 71,132 19,744
FACULTY / EMPLOYEES

18
FacultyAwardsandHonorsAs of December 2014
8 Nobel laureates 1 Shaw laureate 1 Abel Prize 2 Japan Prizes 2 Pulitzer Prize recipients
Members
47 —the Institute of Medicine
44 —the National Academy of Sciences
59 —the National Academy of Engineering
59 —the American Academy of Arts and Sciences
35 —the American Law Institute
FACULTY / EMPLOYEES

19
FacultyAppointments
AcademicInstitutions54% of faculty have a 100% Instructional Appointment
1% of faculty have a 100% Research Appointment
44% of faculty have a Mixed Appointment
HealthInstitutions13% of faculty have a 100% Instructional Appointment
15% of faculty have a 100% Research Appointment
15% of faculty have a 100% Patient Care Appointment
56% of faculty have a Mixed Appointment
Mixed appointment would include some mixture of instruction, research, patient care (HRIs), academic support, and public service.
FACULTY / EMPLOYEES

20
Notes________________________________________________________________________________________________________________________________________________________________________________________________________________________________________________________________________________________________________________________________________________________________________________________________________________________________________________________________________________________________________________________________________________________________________________________________________________________________________________________________________________________________________________________________________________________________________________________________________________________________________________________________________________________________________________________________________________________________________________________________________________________________________________________________________________________________________________________

21
RESEARCH/TECHTRANSFER
Content
Research Expenditures .......... 22
Tech Transfer ........................ 24
RESEARCH / TECH TRANSFER

22
ResearchExpendituresFY 2014
Total $2.5 billionAcademic $863 millionHealth $1.6 billion
Research expenditures have increased 12% over the past five years, driven by increases from state, private, and local sources. Expenditures from federal sources have declined 9% over the same period.
Federal sources were 45% of research expenditures in 2013‐14, down from 56% in 2009‐10, and down nearly 20 points from levels in 2003‐04.
RESEARCH / TECH TRANSFER
Federal45%
State19%
Private24%
Local12%
by source

23
ResearchExpendituresFY 2014
Federal State Private Local Total
vs FY 2009 Total
vs FY 2009 Federal
UTA $ 24,398,768 $ 16,009,006 $ 11,698,645 $ 18,962,115 $ 71,068,534 + 27.8% ‐ 3.0%
UT Austin 332,757,829 43,307,623 114,704,210 59,536,497 550,306,159 + 2.9 ‐ 0.8
UTB 6,462,518 1,464,807 152,734 31,516 8,111,575 + 35.1 + 39.2
UTD 32,699,156 17,158,140 20,331,294 29,538,945 99,727,535 + 51.6 + 24.6
UTEP 35,304,485 16,639,650 10,607,884 11,941,335 74,493,354 + 33.0 + 20.1
UTPA 7,204,763 1,345,030 959,060 1,307,368 10,816,221 + 20.6 + 30.8
UTPB 482,860 494,221 300,126 43,668 1,320,875 ‐ 8.4 + 51.0
UTSA 23,041,222 11,488,842 4,253,323 6,455,204 45,238,591 ‐ 2.8 ‐ 14.6
UTT 388,745 278,992 117,330 648,213 1,433,280 ‐ 56.5 ‐ 81.6
Academic $ 462,740,346 $108,186,311 $163,124,606 $128,464,861 $ 862,516,124 + 10.8% + 1.5%
UTSWMC 185,137,233 75,537,160 114,780,787 20,763,964 396,219,144 + 3.3 ‐ 10.7
UTMB 101,760,827 2,516,458 17,372,266 19,352,892 141,002,443 ‐ 8.3 ‐ 19.7
UTHSCH 136,144,701 32,731,624 42,680,997 9,813,006 221,370,328 + 1.7 + 0.8
UTHSCSA 89,303,518 9,618,698 29,101,822 15,785,787 143,809,825 ‐ 25.7 ‐ 30.4
UTMDA 158,986,303 241,306,782 222,324,050 113,576,296 736,193,431 + 44.3 ‐ 18.3
UTHSCT 3,448,301 1,571,148 1,408,308 4,567,039 10,994,796 ‐ 22.9 ‐ 50.3
Health $ 674,780,883 $363,281,870 $427,668,230 $183,858,984 $1,649,589,967 + 12.0% ‐ 15.5%
Total $1,137,521,229 $471,468,181 $590,792,836 $312,323,845 $2,512,106,091 + 11.6% ‐ 9.3%
RESEARCH / TECH TRANSFER

24
TechnologyTransferFY 2013
New Invention
Disclosures
U.S. Patents Issued
Licenses & Options Executed
Startup Companies
Formed
Gross Revenue from IP
UTA 40 12 2 1 $ 72,284 UT Austin 162 52 22 5 19,367,922 UTB 1 0 0 0 0 UTD 72 11 2 0 2,115,340 UTEP 34 5 2 2 9,910 UTPA 10 2 1 0 197,348 UTPB 0 0 0 0 0 UTSA 62 4 10 1 116,264 UTT 5 0 0 0 0 Academic 386 86 39 9 $21,879,068 UTSWMC 96 26 30 0 13,600,565 UTMB 52 24 18 2 1,223,000 UTHSCH 64 9 29 3 6,537,984 UTHSCSA 51 3 10 3 1,375,853 UTMDA 171 28 17 1 17,309,264 UTHSCT 3 0 0 1 0 Health 437 90 104 10 $40,046,666
RESEARCH / TECH TRANSFER
823 new invention disclosures
176 U.S. patents issued
143 licenses and options executed
19 startup companies formed
$62 million in gross revenue from intellectual
property (IP)

25
BUDGET/FINANCE
Content
Budget: Revenues .................................................................... 26
Budget: Expenses ..................................................................... 27
Institutional Budgets ................................................................ 28
Funding Trends ‐ Revenues per FTE Student ............................ 29
Endowment Value & Annual Giving ......................................... 30
Patient Care ............................................................................. 31
BUDGET / FINANCE

26
Budget:Revenues=$15.9billionFY 2015 (in millions)
BUDGET / FINANCE
Hospital, Clinics, Professional Fees
$6,554 || 41%
State Appropriations$2,074 || 13%
Sponsored Programs$3,072 || 19%
Auxiliary Enterprises $534 || 4% Tuition and Fees
$1,511 || 10%
Investment Income $1,106 || 7%
Educational Activities $352 || 2%
Gifts and Other $668 || 4%

27
Budget:ExpensesandDebtService=$15.6billionFY 2015 (in millions)
Instruction$3,348 || 21%
Academic Support $751 || 5%
Research$2,112 || 14%
Public Service $255 || 2%
Hospitals and Clinics$4,598 || 29%
Institutional Support $986 || 6%
Student Services $230 || 1%Operations and
Maintenance of Plant $807 || 5%
Scholarships and Fellowships $412 || 3%
Auxiliary Enterprises $570 || 4%
Depreciation and Amortization $1,265 || 8%Interest
$301 || 2%
BUDGET / FINANCE

28
InstitutionalBudgetsFY 2015 (in millions)
Total Budget Expenditures
From General Revenue (GR) GR as % of Total
UTA $ 534.5 $ 119.6 22.4% UT Austin 2,693.2 316.9 11.8 UTB 126.1 37.3 29.6 UTD 545.6 113.5 20.8 UTEP 402.1 97.3 24.2 UTPA 271.3 78.7 29.0 UTPB 66.9 29.7 44.4 UTSA 489.0 123.7 25.3 UTT 118.6 37.2 31.3 Academic $ 5,247.3 $ 953.9 18.2% UTSWMC 2,239.2 169.4 7.6 UTMB 1,733.3 343.9 19.8 UTHSCH 1,213.7 199.2 16.4 UTHSCSA 781.9 176.2 22.5 UTMDA 4,073.6 185.4 4.6 UTHSCT 164.6 44.1 26.8 Health $10,206.3 $1,118.2 11.0% System Admin $ 180.7 $ 1.5 0.9% Total $15,634.3 $2,073.6 13.3%
BUDGET / FINANCE

29
FundingTrends–RevenueperFTEStudent(AcademicInstitutions)FY 2013, Inflation‐Adjusted to 2013
Notes: UT System totals do not include UT Brownsville. Tuition and fee revenue is net of scholarship and fellowship discounts and waivers. State Appropriations include general revenue support from the State of Texas for instruction and operations, infrastructure support, special items, tuition revenue bond debt service, and group health insurance and employee benefits. All revenue and expense data were adjusted to the FY 2013 base year for inflation using the Consumer Price Index ‐ Urban (CPI ‐ U) for September of each year.
$6,458
$5,055
$5,085
$7,026
$0
$2,000
$4,000
$6,000
$8,000
2004 2005 2006 2007 2008 2009 2010 2011 2012 2013
State appropriations
Tuition and Fees
BUDGET / FINANCE
State Appropriations per full‐time equivalent (FTE) student
have declined from 56% in
2004 to 42% in 2013.
Tuition and Fees have
increased from 44% to 58% of revenues per FTE student.

30
EndowmentValue&AnnualGivingFY 2014 (in millions)
Endowment Value 5‐Year Change Annual Giving
UTA $ 119.9 75.8% $ 15.0 UT Austin 11,340.8 76.2 529.4 UTB 10.3 40.3 1.5 UTD 387.4 69.0 55.6 UTEP 221.0 44.3 18.5 UTPA 72.0 38.1 3.9 UTPB 43.1 156.2 6.6 UTSA 113.9 88.9 15.5 UTT 78.9 25.7 5.9 Academic $12,387.3 74.8% $ 651.9 UTSWMC 1,661.5 26.8 127.9 UTMB 549.3 28.6 41.0 UTHSCH 256.1 49.7 37.2 UTHSCSA 485.5 30.4 44.6 UTMDA 1,236.7 28.5 163.2 UTHSCT 47.0 25.2 0.9 Health $ 4,236.1 29.1% $ 414.8 System Admin $ 9,969.0 100.7% $ 2.4 Total $26,592.3 73.4% $1,069.1
BUDGET / FINANCE
The Permanent University Fund
2.1 million acres
Market value as of 08/31/13
$14.9 billion
Market value as of 08/31/14
$17.4 billion About Endowment Value:
These totals include endowment funds managed by UTIMCO as well as those held in trust by other entities, as reported to the Council for Aid to Education each year. (Information offered on endowment funds not managed by UTIMCO is reported by each institution). Endowments for UT Austin include 30% of the Permanent University Fund (PUF) market value and endowments for the UT System include 37% of the PUF market value. The remaining 33%, or one‐third, belongs to TAMU per the Texas Constitution. Endowment values for UT System Administration exclude the Permanent Health Fund, which is reported by the institutions.

31
PatientCareFY 2013
Outpatient Visits Hospital Days
UTSWMC 2,210,748 509,846 UTMB 693,930 121,012 UTHSCH 1,279,023 270,776 UTHSCSA 911,114 262,194 UTMDA 1,338,706 207,555 UTHSCT 217,906 7,610 Total 6,651,427 1,378,993
41% of revenues for the UT System budget come from hospital, clinics, and professional fees related to patient care. Hospitals and clinics are 29% of total expenses.
BUDGET / FINANCE

32
Notes________________________________________________________________________________________________________________________________________________________________________________________________________________________________________________________________________________________________________________________________________________________________________________________________________________________________________________________________________________________________________________________________________________________________________________________________________________________________________________________________________________________________________________________________________________________________________________________________________________________________________________________________________________________________________________________________________________________________________________________________________________________________________________________________________________________________________________________