USMF AR2016 Layout 1 · USM institution to meet with senior leadership, faculty, staff, and...
36
“....it is our ‘systemness’ — working together, leveraging our resources, and using economies of scale — that strengthens our ability to have a broad-based, positive impact.” 2016 ANNUAL REPORT CHANCELLOR ROBERT L. CARET
Transcript of USMF AR2016 Layout 1 · USM institution to meet with senior leadership, faculty, staff, and...

“....it is our ‘systemness’—working together, leveraging our
resources, and using economies
of scale — that strengthens our
ability to have a broad-based,
positive impact.”
2016 ANNUAL REPORT
CHANCELLOR ROBERT L . CARET

CONTENTS
LETTER FROM THE CHAIR AND PRESIDENT
LETTER FROM THE CHANCELLOR
FY 16 BY THE NUMBERS
INVESTMENT REPORT
FINANCIAL HIGHLIGHTS
FINANCIAL STATEMENTS
LEADERSHIP
1
2
4
6
10
1 1
30

This past fiscal year, the University System of Maryland (USM) celebrated the inaugurationof Chancellor Robert L. Caret and welcomed several new faces to the USM (see below). We are excited to welcome these leaders to the community as we aim to uphold ChancellorCaret’s vision of “systemness.” Working with our partners to build endowment and a cultureof philanthropy, we keep this collaborative endeavor in mind.
As Dennis Wraase completes his term as chair, the Foundation is stronger than ever. Workingwith Governance Committee Chair Bonnie Stein, our board is becoming more diverse and morerepresentative of the USM institutions we serve. We have also become more actively involvedin sustained efforts to build endowment on our campuses. Now in its third year, a $50 millionquasi-endowment, invested with the Foundation and established with reserve funds from ourinstitutions and the USM office, is adding resources to campus endowment-raising efforts.Early indicators show that the quasi-endowment fund is beginning to gain traction.
There were several developments on the financial front in FY 16. The Foundation continuedits relationship with BDO USA, now in its second year as our external auditor, and onceagain we received a clean audit. We hired Northern Trust as our new bank custodian, thusenhancing the Foundation’s operational efficiency. The endowment portfolio ended FY 16with a –1.8% return, outperforming its benchmark by approximately 360 basis points. The operating portfolio ended FY 16 with a –0.5% return, tracking closely to its policy benchmark.We are pleased with the defensive nature of our portfolios, as performance exceeded our expectations, protecting capital in a challenging market environment. In the interest of sustainability, the Foundation committed to becoming a signatory to the United Nations Principles of Responsible Investing. Becoming a signatory demonstrates our commitment toresponsible investing that incorporates environmental, social, and governance factors intoinvestment decisions. The Foundation also joined the Intentional Endowments Network,which supports organizations in aligning endowment investment practices with their missions,values, and sustainability goals without sacrificing financial returns.
As we move forward into FY 17, we continue to concentrate on growing endowments and private donations. In the spirit of systemness, we are also considering how we may supportand collaborate with one another in ways that benefit the System as a whole. As always, welook forward to the future of the Foundation and are tremendously thankful to our dedicatedboard members.
Dennis R. WraaseChair
Leonard R. RaleyPresident and CEO
Letter from the Chair and President
Maria Thompson ■ President, Coppin State University Maria Thompson was appointed as president of Coppin State University in May2015 after a national presidential search. She leads the urban historically blackuniversity into its next generation with her experience in building a researchenterprise and raising the quality of academic programs across an institution.
Kim Schatzel ■ President, Towson University Kim Schatzel was appointed the 14th president of Towson University in December 2015. Before working in higher education, Schatzel was an entrepreneurand a businessperson and served as a founding president, a chief operating officer,and a CEO of a firm that employed more than 1,500 people on four continents.
Ronald Nowaczyk ■ President, Frostburg State University In February 2016, Ronald Nowaczyk was appointed president of Frostburg StateUniversity. Nowaczyk has experience in advancing public universities in rural areas and in creating partnerships to improve the quality of life in surroundingcommunities.
Patrick N. Hogan ■ Vice Chancellor for Government Relations, USM
Former member of the Maryland House of Delegates and an alumnus of
the University of Maryland, College Park, Patrick N. Hogan joined the USM
in November 2015. He brought with him a deep knowledge of the legislative
process, which he now uses to serve the USM.
J. Thomas Sadowski ■ Vice Chancellor for Economic Development, USM
University of Maryland, Baltimore County alumnus J. Thomas Sadowski
was appointed vice chancellor in March 2016. This new position was
created to expand on the USM’s success as a major driver of the state’s
economic development.
LEADERSHIP TRANSITIONS
www.usmf.org 1

My inaugural year as chancellor of the USM was marked by significant progress in our efforts toenhance quality, advance college completion, grow the workforce and the economy, and improveefficiency. I thank the professionals from the USM and the USM Foundation for their efforts insupport of these strategic priorities and the students we serve.
I spent much of my first year as chancellor listening, learning, and telling USM stories of successand challenges. Last fall, I crisscrossed the state from the Eastern Shore to western Maryland,traveling more than 900 miles by bus in four days. I also completed a series of visits to eachUSM institution to meet with senior leadership, faculty, staff, and students. In addition, I gavepresentations to dozens of economic development and business groups across the state, under-scoring the USM’s critical role in advancing the state’s economy. As a result, my understandingof the state's needs and of how the USM can enhance its role in meeting those needs has grown,as well as my appreciation of the importance of working as a system.
Perhaps the most tangible example of our work together is seen in our partnership with GovernorLarry Hogan and legislators in Annapolis, with USM securing a budget increase of $78 million —about 6.3% — over the previous year. We were able to keep the tuition increase for in-state undergraduates to a modest 2% and direct nearly $7 million in funding to support efforts to increase college completion rates. In addition, the General Assembly allocated nearly $308 million for the FY 17 capital budget for critical projects throughout the USM.
Also during the legislative session, we worked diligently to help ensure that Senate Bill (SB) 1052,The University of Maryland Strategic Partnership Act of 2016, would work in the best interests of our students and state. This legislation codifies the strategic collaboration between the University of Maryland, College Park and the University of Maryland, Baltimore that was launchedin 2012. As passed, SB 1052 will help ensure a stronger and more impactful relationship betweenour flagship institution in College Park and our professional schools’ campus in Baltimore, evenas the two institutions maintain their separate identities and independent standings.
Looking ahead, I am enthusiastic about the formal launch of USM’s B-Power (Baltimore Power)initiative which uses USM resources to better serve the city of Baltimore. Initially led by two ofUSM’s urban institutions, Coppin State University and the University of Baltimore, B-Power willultimately forge a much wider alliance with the USM community and others banking on the future of Baltimore. It will stand as yet another example of the value of “systemness” — workingtogether, leveraging our resources, and using economies of scale — to strengthen our ability tohave a broad-based, positive impact.
Throughout my first year, the dedication and hard work of the USM Foundation have stood out. Your accomplishments — managing our institutions’ assets, building a vibrant culture of philanthropy across the USM, advocating for the System, and partnering with member institutions to support and enhance fundraising efforts and celebrate fundraising success—make a profound difference.
On behalf of the Board of Regents, the presidents, and the entire USM community, I extend myheartfelt appreciation and congratulations to the many men and women who make the USMFoundation so effective. I look forward to our continuing partnership in years to come.
Robert L. CaretChancellor
Letter from the Chancellor
2 www.usmf.org

L-R: USM Presidents Kurt Schmoke, Javier Miyares, Mickey Burnim, Wallace Loh, Thomas Bowling (interim), Jay Perman, Maria Thompson,Timothy Chandler (interim), Juliette Bell, Freeman Hrabowski
Inauguration of the USM’s Fourth Chancellor Robert L. CaretNovember 19, 2015
Columbus Center
Baltimore, Maryland
Robert Caret and his wife,Elizabeth Zoltan
www.usmf.org 3

The USM Foundation managed
5,355accounts
people attended Chancellor Caret’s inauguration on
November 19, 2015 at the
Columbus Centerin Baltimore.
The USM and the USM Foundation held 11
professional development events for advancement staff across the System.
7were seminars for major gifts staff,
including a four-part series on integrating planned giving
to maximize major gifts.
2 were webinars for advancement
service professionals.
2were roundtables for affiliated
foundation staff.
22
FY 16 by the Numbers
The Foundation invested on behalf of
higher educationpartners
741 The USM received a System-wide
budget increase of
$78M(a 6.3% increase over the previous fiscal year)
$$
0direct investments were
made in the Carbon Underground 200
companies.
The Carbon Underground 200 is an annuallyupdated listing of the top 100 public coal
companies globally and the top 100 public oiland gas companies globally, ranked by the potential carbon emissions content of their reported reserves. The list is produced and
maintained by Fossil Free Indexes, LLC.
The USM Foundation joined the Intentional EndowmentsNetwork and became a signatory of the United Nations Principles for Responsible Investment.
4 www.usmf.org

900 miles were logged
on Chancellor Caret’s Bus Tour
in 4 days.Chancellor Caret visited 20 sites around
Maryland to listen to views on how the USM is serving distinct
geographic regions in the state.
www.usmf.org 5

Investment Report
USMF Funds: [in thousands]
University of Maryland, College Park $ 90,606
University of Maryland, Baltimore County 78,101
University of Maryland Eastern Shore 19,510
University of Maryland, Baltimore 15,180
University of Maryland University College 15,170
University System of Maryland Foundation 13,929
University of Maryland Center for Environmental Science 2,233
USMF Trusts and Annuities 6,596
Sub-Total $ 241,325
Affiliated Organizations: [in thousands]
University of Maryland College Park Foundation $ 282,131
University System of Maryland Common Trust 193,775
University of Maryland Baltimore Foundation 154,630
Frostburg State University Foundation 20,042
Frederick Community College Foundation 11,728
Allegany College of Maryland Foundation 9,858
Hagerstown Community College Foundation 8,614
Coppin State University Development Foundation 8,454
Community College of Baltimore County Foundation 7,816
Howard Community College Educational Foundation 7,486
Towson University Foundation 7,375
Bowie State University Foundation 5,915
Alumni Association International 4,256
University of Baltimore Foundation 3,332
M-Club 2,124
Sub-Total $ 727,536
Total Endowment Fund $ 968,861
ENDOWMENT ASSETS UNDER MANAGEMENTAs of June 30, 2016
USM FOUNDATION ENDOWMENT POOL
June 2012 June 2013 June 2014 June 2015 June 2016
$1,000
$750
$500
$250
$0
(IN
MIL
LIO
NS
)
$874
$963$986 $969
$820
ENDOWMENT FUNDS
The USM Foundation manages endowment funds for the benefit of institutions and foundations affiliated with the USM,as well as five Maryland community college foundations. Ourinvestment objective is to generate returns sufficient to meetspending requirements while preserving the purchasingpower of the endowment over time. The endowment pool ismade up of several thousand individual endowment fundswhich support scholarships, research, faculty, academic programs, and various special initiatives.
OPERATING FUNDS
In addition to the endowment portfolio, the Foundation manages operating funds for the benefit of institutions andfoundations affiliated with the USM. These are funds that are fully expendable and can be called at any time. Our investment objective for these funds is to maintain a highlevel of liquidity with a very low risk profile. Operating fundssupport scholarships, research, faculty, academic programs,and various special initiatives, just like endowment funds. Thekey difference is that endowment funds are meant to exist inperpetuity, while operating funds can be fully expended.
6 www.usmf.org

INVESTMENT COMMITTEE
The Investment Committee, made up of volunteers from awide range of business and investment backgrounds, is responsible for the oversight of both the endowment and operating portfolios. The committee members meet on aquarterly basis, but are in frequent communication with thestaff and with each other between meetings. The primaryrole of the Investment Committee is to establish investmentobjectives and set asset allocations.
David C. Saunders, ChairCo-Founder and CEO K2 Advisors, LLC
Joseph R. Hardiman, Vice ChairPrivate Investor
Larry D. BoggsManaging Director– Investment Officer Wells Fargo Advisors, LLC
Charles W. Cole, Jr.Retired Chairman and CEOLegg Mason Trust
V. Raymond FerraraPresident and CEO ProVise Management Group, LLC
Eric S. FrancisChairman and CEO The CBMC Group
Joseph B. GildenhornFounding PartnerThe JBG Companies
Viju JosephChief Risk OfficerWeiss Multi-Strategy Advisers
Kyle Prechtl LeggRetired CEO Legg Mason Capital Management
Robert MilkovichCEOFirst Potomac Realty Trust
Paul H. MullanRetired Vice Chairman and Strategic Partner Charterhouse Group International, Inc.
Bruce RichardsCEO and Co-Managing Partner Marathon Asset Management, LP
Thomas (Tim) Schweizer, Jr.PresidentBrown Advisory Securities
Dennis R. WraaseRetired Chairman and CEOPepco Holdings, Inc.
INVESTMENT STAFF
Samuel N. GalloChief Investment Officer
Kevin T. DalmutDirector of Private Market Investments
Chris IngramSenior Sustainability and Investment Analyst
Abby CoutantOperations Manager
Carrie BrowneBoard Relations Associate
GOVERNANCE STRUCTURE
The USM Foundation has instituted a streamlined invest-ment process that allows its staff, Investment Committeeand two Strategic Investment Managers (SIMs) to workcollaboratively to make investments between officialmeetings of the committee. This model, which has beendubbed the “Maryland Model,” allows the investment staffto leverage the expertise of the committee as well as theextensive resources of the SIMs, while also increasing theflexibility for staff to react quickly to market conditions.
ENDOWMENT FUND PERFORMANCE
In the fiscal year ending June 30, 2016, the endowmentportfolio decreased 1.8%. Despite this absolute perform-ance, we are pleased by the endowment’s relative performance to its portfolio benchmark, which declined5.4%. We consider the fiscal year results a success, as we preserved capital during a challenging period, out-performing our benchmark by roughly +360 basis points.Funds under management totaled $969 million as of June 30, 2016.
www.usmf.org 7
“UMCES depends on the USM for several
critical services including prospect research,
generation of reports, professional develop-
ment and occasionally advice on fundraising
strategies and key relationships.”Vice President of Institutional Advancement at the University of Maryland
Center for Environmental Science, David Balcom

INVESTMENT STRATEGY
Our portfolio positioning is premised on risk tolerances and return objectives of a traditional university endowment.Central to this concept is the idea that capital is not immediately needed; therefore, a moderate portion of our portfoliois invested in opportunities that materialize over longer timeframes. By locking up our capital, we aim to capture anextra risk premium, known as the liquidity premium. This premium enhances the portfolio’s return, while also reducingits longer-term risk profile.
However, to balance the portfolio’s need for current income, we invest a material amount of capital in shorter duration,liquid investments. In fact, approximately 67% of our investments can be converted to cash within less than one year,with a portion of these assets being exchange-listed and traded. Thus, staff is able to invest in attractive opportunities,when presented.
Endowment funds are invested with a long-term perspective, and performance of the portfolio is assessed over variedmarket cycles. These cycles can persist over several years, irrespective of the conclusion of a calendar or fiscal year. Wepurposely design our portfolio for long-term diversification among factors such as geographic, strategy, sector, liquidity,and instrument or investment vehicle type. While equity risk is a large component of our asset allocation, the portfolio is not designed to match U.S. equity market performance. Rather, the portfolio is constructed to provide less volatileyear-over-year returns, capturing upside market potential while protecting funds from downside losses.
The portfolio can be divided into four broad asset classes: (1) safe assets, (2) public risk assets, (3) private risk assets,and (4) portfolio overlay. In the pie graph below, we have further detailed the composition of these allocations by policytarget; where the green and purple slices represent liquid asset classes, and the yellow slice represents the illiquid portion or private risk assets. We have outlined each of these strategies in the paragraphs that follow.
POLICY TARGETS
Public Risk
Assets
60%
SafeAssets
5%
PrivateRisk
Assets
35%
POLICY RANGES
Min Max Target
Safe Assets 0% 25% 5%
Public Risk Assets 45% 75% 60%
Private Risk Assets 20% 40% 35%
Portfolio Overlay 0% 5% 0%
“The Meyerhoff Scholars Program blessed
my family so that we didn’t have to take out
loans, and my parents and I didn’t have to
take on additional jobs for my education.”Associate Professor of Mechanical Engineering at Clemson
University and member of the first class of Meyerhoff
Scholars Program students at UMBC, Oliver Myers
8 www.usmf.org

SAFE ASSETS
Safe assets are defined as investments with little-to-no principal risk. The current environment aside, we consider these to be U.S. Government securities, cash-enhanced investment products, and cash. This portion ofthe portfolio is in place to provide capital preservation and stability to our returns during volatile periods as well as facilitate our spending andcapital call requirements. Maintaining safe assets minimizes the risk of becoming forced sellers of assets during moments of market stress. Whilethis allocation will be somewhat small, it is a very important portion of our overall asset mix.
OPERATING FUND PERFORMANCE
Funds under management in the operating portfolio totaled $188 million as of June 30,2016. Operating funds are designed for currentuse, as our account holders expect to be able towithdraw their full amounts at any given time.As a result, the risk tolerance on an individualaccount level is very low.
In the fiscal year ending June 30, 2016, the operating fund decreased 0.5%. Its policybenchmark declined 0.3%. Despite its absoluteperformance, the operating fund responded asanticipated to market conditions and a generallylow-yield environment. We consider the fiscalyear results a success, as we preserved capitalduring a challenging period.
Similar to the endowment fund, operating fundinvestments are categorized as safe assets, public risk assets, and portfolio overlay. Since investments are more liquid in nature, there is noprivate risk asset category within the operatingportfolio.
PUBLIC RISK ASSETS
Public risk assets define our liquid investments. These investments have one common theme — they are generally traded in liquid markets/exchanges. Within this section of the portfolio, we seek a number of uncorrelated objectives across equity and credit managers and instruments.
Orientations vary as they seek growth, value, momentum, inflation protection, and/or catalyst-driven events. Some of these investments will track closely to market indices, with a goal to earn or exceed the benchmark return, but with less risk than the benchmark. Other invest-ments will not closely follow a market benchmark, as they seek to offerbroad diversification for the aggregate portfolio, while still earning high risk adjusted returns — all the while muting general equity market volatility when possible.
PRIVATE RISK ASSETS
Private risk assets are the illiquid portion of our portfolio, serving as the primary return enhancement over broad public equity markets. Because of the long-term nature of the endowment's capital, we havethe ability to enter into illiquid investments that may take years forprofit realization. While we sacrifice the use of our capital during thistimeframe, we hold these investments to higher performance hurdles, as we expect to earn a significant return premium over public marketequivalent investments.
Thus, similar to public risk assets, private risk asset investments will also have orientations towards growth, value, momentum, inflation protection, and/or catalyst-driven events. Investments will vary in structure as well as duration, all adding up to a broadly diversified portfolio.
PORTFOLIO OVERLAY
The portfolio overlay is another line of defense for our capital. Allocation towards this asset class will be infrequent and in line with protecting the entire portfolio from unwanted risks and market shocks.While in most cases this is achieved by our investment managers, there are times when staff needs to protect the aggregate portfolio. Allocatingcapital to this asset class will be on an as-needed, opportunistic basis. That is why its target allocation is set to zero percent.
www.usmf.org 9

Financial Highlights
AUDIT COMMITTEE REPORT
The Audit Committee of the UniversitySystem of Maryland Foundation, Inc. (theFoundation) has reviewed and discussedwith the Foundation’s management andBDO USA, LLP the audited financial state-ments of the Foundation as of and for theyear ended June 30, 2016, to be includedin the Foundation’s annual report.
The Audit Committee has also discussedwith BDO USA, LLP the matters requiredto be discussed pursuant to applicableStatements on Auditing Standards adoptedby the American Institute of Certified Public Accountants, which matters include,among other things, matters related to theconduct of the audit of the Foundation’s financial statements.
The Audit Committee has received and reviewed the letter from BDO USA, LLP required by Independence StandardsBoard Standard No. 1 (“Independence Discussions with Audit Committees”), and has discussed with BDO USA, LLP itsindependence from the Foundation.
Based on the review and discussions referred to above, the Audit Committeerecommended to the Board of Directors of the USM Foundation that the audited financial statements be included in theFoundation’s annual report.
SUBMITTED BY THE AUDIT COMMITTEE
J. Mitchell Neitzey, Chair
Michael E. Meegan, Vice Chair
Kenneth L. Bedingfield
Robert A. Bedingfield
Walter R. Fatzinger
Joseph B. Gildenhorn
Albert E. Girod
Arthur S. Mehlman
Neil Moskowitz
Paul H. Mullan
Clolita M. Vitale
John C. Weiss
Dennis R. Wraase
Sam A. Zappas
$ 1,085.6
$ 1,170.5
$ 1,207.7
$ 1,187.8
18.3%Scholarship Support $ 5.8
FINANCIAL HIGHLIGHTS
June June % of 2016 2015 Change
Total Assets $ 1,187.8 $ 1,207.7 (1.6)%
Net Assets $ 315.2 $ 324.4 (2.8)%
Total Revenues $ 22.4 $ 47.8 (53.1)%
Program & Scholarship Support $ 23.2 $ 25.1 (7.6)%
Operating Expenses $ 8.3 $ 10.2 (18.6)%
(in millions)
EXPENSES
(in millions)
ASSETS(in millions)
55.4%
18.3%
8.0%
Program Support $ 17.5
General & Administrative $ 5.8
Fundraising $ 2.5
TOTAL $ 31.6
FY16
FY15
FY14
FY13
REVENUES
(in millions)
FY16
FY15
FY14
FY13
$ 53.9
$ 47.8
$ 22.4
$ 41.9
INVESTMENTS HELD FOR OTHER FOUNDATIONS
(in millions)
FY16
FY15
FY14
FY13
$ 849.1
$ 873.1
$ 862.3
$ 719.5
10 www.usmf.org
Financial Statements
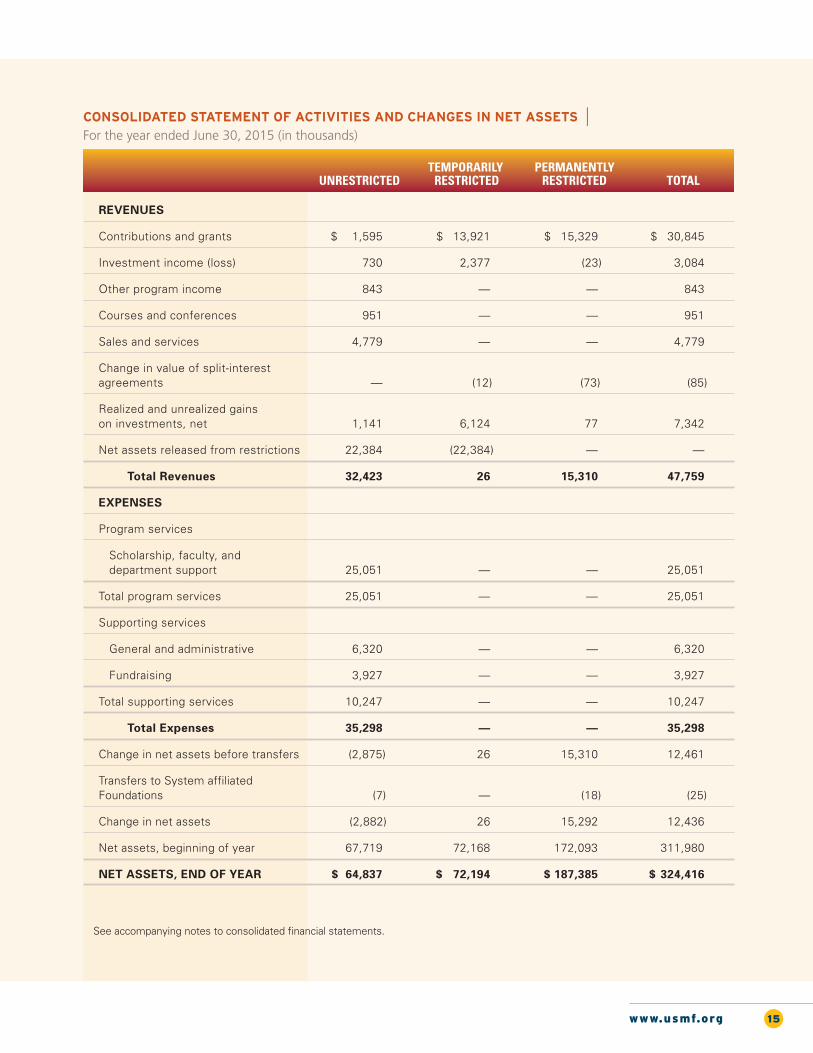
To the Board of Directors of the University System of Maryland Foundation, Inc. and SubsidiaryAdelphi, Maryland
We have audited the accompanying consolidated financial statements of the University System of Maryland Foundation, Inc. andSubsidiary (the Foundation), which comprise the consolidated statements of financial position as of June 30, 2016 and 2015, andthe related consolidated statements of activities and changes in net assets and cash flows for the years then ended, and the related notes to the consolidated financial statements.
Management’s Responsibility for the Consolidated Financial Statements – Management is responsible for the preparation andfair presentation of these consolidated financial statements in accordance with accounting principles generally accepted in theUnited States of America; this includes the design, implementation, and maintenance of internal control relevant to the preparationand fair presentation of consolidated financial statements that are free from material misstatement, whether due to fraud or error.
Auditor’s Responsibility – Our responsibility is to express an opinion on these consolidated financial statements based on our audits. We conducted our audits in accordance with auditing standards generally accepted in the United States of America. Thosestandards require that we plan and perform the audit to obtain reasonable assurance about whether the consolidated financialstatements are free from material misstatement.
An audit involves performing procedures to obtain audit evidence about the amounts and disclosures in the consolidated financialstatements. The procedures selected depend on the auditor’s judgment, including the assessment of the risks of material misstate-ment of the consolidated financial statements, whether due to fraud or error. In making those risk assessments, the auditor considersinternal control relevant to the entity’s preparation and fair presentation of the consolidated financial statements in order to designaudit procedures that are appropriate in the circumstances, but not for the purpose of expressing an opinion on the effectivenessof the entity’s internal control. Accordingly, we express no such opinion. An audit also includes evaluating the appropriateness ofaccounting policies used and the reasonableness of significant accounting estimates made by management, as well as evaluatingthe overall presentation of the consolidated financial statements.
We believe that the audit evidence we have obtained is sufficient and appropriate to provide a basis for our audit opinion.
Opinion– In our opinion, the consolidated financial statements referred to above present fairly, in all material respects, the financialposition of the University System of Maryland Foundation, Inc. and Subsidiary as of June 30, 2016 and 2015, and the changes intheir net assets and their cash flows for the years then ended in accordance with accounting principles generally accepted in theUnited States of America.
September 15, 2016
INDEPENDENT AUDITOR’S REPORT
MANAGEMENT’S FINANCIAL RESPONSIBILITY
The Foundation’s management assumes responsibility for the fair presentation of the consolidated financial statements, prepared in accordance with generally accepted accounting principles (GAAP), and has full responsibility for their integrity and accuracy.
Management, in concert with the Board of Directors, established and maintains a strong ethical climate as we are committed toensuring that we properly account for those funds we hold on behalf of donors and the institutions we serve. In addition, we believe the system of internal control in place provides reasonable assurance as to the integrity and the accuracy of those financialstatements and the other activities performed.
Management recognizes its fiduciary responsibility for the oversight of funds, contributed by donors for the benefit of the institutions of the University System of Maryland, under its control and investment management.
Our internal audit firm, Johnson and Lambert, maintains oversight over key areas and reports on a regular basis to managementand the Audit Committee. BDO USA, LLP, our independent auditor, reports directly to the Audit Committee.
Leonard R. Raley, President and CEO
www.usmf.org 11

CONSOLIDATED STATEMENTS OF FINANCIAL POSITION | June 30, 2016 and 2015 (in thousands)
ASSETS 2016 2015
CURRENT ASSETS
Cash and cash equivalents $ — $ —
Accounts receivable 150 118
Receivable from investments sales — 30
Accrued interest receivable 136 1,153
Contributions receivable — current portion 5,576 4,696
Other current assets 264 680
Total Current Assets 6,126 6,677
INVESTMENTS
Endowment 241,363 246,894
Operating 53,350 55,794
Held for other foundations 862,291 873,103
Total Investments 1,157,004 1,175,791
OTHER ASSETS
Contributions receivable — long term portion 9,918 10,533
Contributions receivable from remainder trusts 975 1,007
Angus breeding herd, trademark, logo, records, and data bank 2,102 2,187
Real and personal property, net 11,201 11,117
Other assets 445 432
Total Other Assets 24,641 25,276
TOTAL ASSETS $ 1,187,771 $ 1,207,744
See accompanying notes to consolidated financial statements.
12 www.usmf.org

CONSOLIDATED STATEMENTS OF FINANCIAL POSITION | June 30, 2016 and 2015 (in thousands)
See accompanying notes to consolidated financial statements.
LIABILITIES AND NET ASSETS 2016 2015
CURRENT LIABILITIES
Accounts payable and accrued expenses $ 3,475 $ 3,055
Deferred income 2,995 3,320
Total Current Liabilities 6,470 6,375
OTHER LIABILITIES
Payables under split-interest agreements 3,358 3,372
Due to other foundations and affiliates 862,734 873,581
Total Other Liabilities 866,092 876,953
Total Liabilities 872,562 883,328
COMMITMENTS AND CONTINGENCIES
NET ASSETS
Unrestricted 60,765 64,837
Temporarily restricted 74,133 72,194
Permanently restricted 180,311 187,385
Total Net Assets 315,209 324,416
TOTAL LIABILITIES AND NET ASSETS $ 1,187,771 $ 1,207,744
www.usmf.org 13

CONSOLIDATED STATEMENT OF ACTIVITIES AND CHANGES IN NET ASSETS | For the year ended June 30, 2016 (in thousands)
See accompanying notes to consolidated financial statements.
TEMPORARILY PERMANENTLY UNRESTRICTED RESTRICTED RESTRICTED TOTAL
REVENUES
Contributions and grants $ 2,227 $ 14,726 $ 3,487 $ 20,440
Investment income (loss) 949 2,905 — 3,854
Other program income 231 — 1 232
Courses and conferences 1,083 — — 1,083
Sales and services 5,420 — — 5,420
Change in value of split-interest agreements — 58 (55) 3
Realized and unrealized gains on investments, net (1,761) 3,596 (10,486) (8,651)
Net assets released from restrictions 19,346 (19,346) — —
Total Revenues 27,495 1,939 (7,053) 22,381
EXPENSES
Program services
Scholarship, faculty, and department support 23,243 — — 23,243
Total program services 23,243 — — 23,243
Supporting services
General and administrative 5,794 — — 5,794
Fundraising 2,528 — — 2,528
Total supporting services 8,322 — — 8,322
Total Expenses 31,565 — — 31,565
Change in net assets before transfers (4,070) 1,939 (7,053) (9,184)
Transfers to System affiliated Foundations (2) — (21) (23)
Change in net assets (4,072) 1,939 (7,074) (9,207)
Net assets, beginning of year 64,837 72,194 187,385 324,416
NET ASSETS, END OF YEAR $ 60,765 $ 74,133 $ 180,311 $ 315,209
14 www.usmf.org
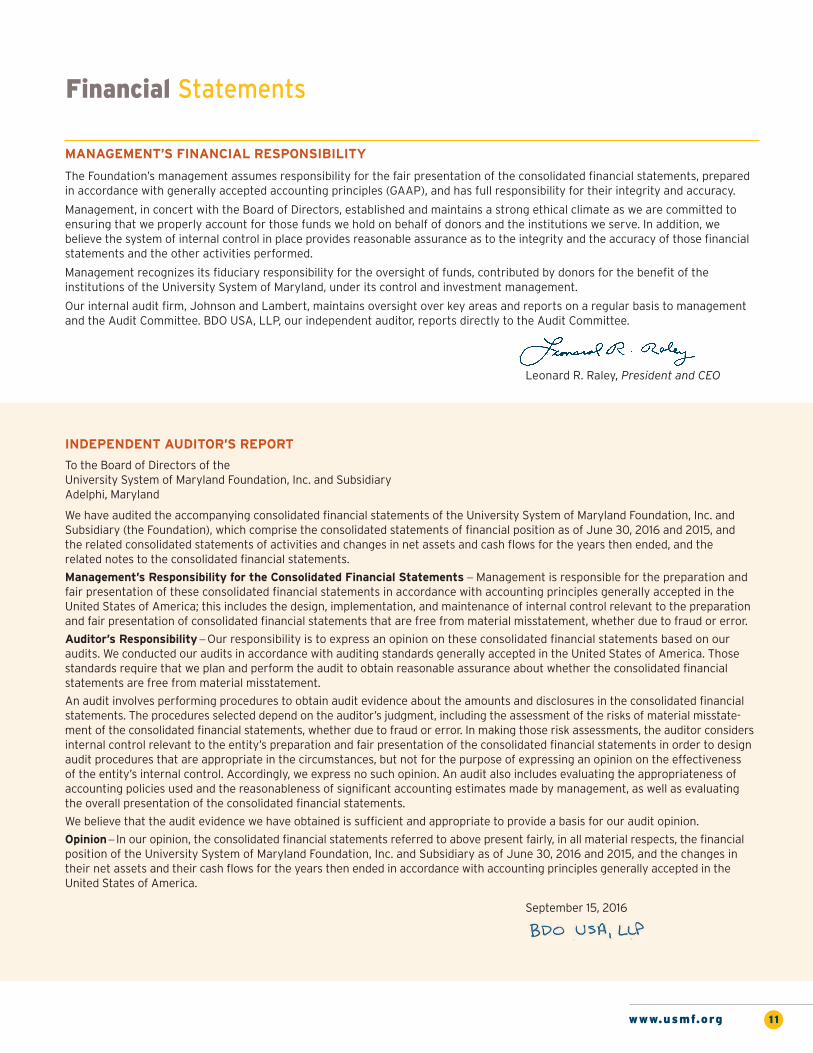
CONSOLIDATED STATEMENT OF ACTIVITIES AND CHANGES IN NET ASSETS | For the year ended June 30, 2015 (in thousands)
See accompanying notes to consolidated financial statements.
REVENUES
Contributions and grants $ 1,595 $ 13,921 $ 15,329 $ 30,845
Investment income (loss) 730 2,377 (23) 3,084
Other program income 843 — — 843
Courses and conferences 951 — — 951
Sales and services 4,779 — — 4,779
Change in value of split-interest agreements — (12) (73) (85)
Realized and unrealized gains on investments, net 1,141 6,124 77 7,342
Net assets released from restrictions 22,384 (22,384) — —
Total Revenues 32,423 26 15,310 47,759
EXPENSES
Program services
Scholarship, faculty, and department support 25,051 — — 25,051
Total program services 25,051 — — 25,051
Supporting services
General and administrative 6,320 — — 6,320
Fundraising 3,927 — — 3,927
Total supporting services 10,247 — — 10,247
Total Expenses 35,298 — — 35,298
Change in net assets before transfers (2,875) 26 15,310 12,461
Transfers to System affiliated Foundations (7) — (18) (25)
Change in net assets (2,882) 26 15,292 12,436
Net assets, beginning of year 67,719 72,168 172,093 311,980
NET ASSETS, END OF YEAR $ 64,837 $ 72,194 $ 187,385 $ 324,416
TEMPORARILY PERMANENTLY UNRESTRICTED RESTRICTED RESTRICTED TOTAL
www.usmf.org 15

See accompanying notes to consolidated financial statements.
16 www.usmf.org
CONSOLIDATED STATEMENTS OF CASH FLOWS |For the year ended June 30, 2016 and 2015 (in thousands)
CASH FLOWS FROM OPERATING ACTIVITIES 2016 2015
Change in net assets $ (9,207) $ 12,436
Adjustments to reconcile change in net assets to net cash provided by operating activities:
Net realized and unrealized gains on investments 8,666 (7,321)
Realized gains on investments for split interest agreements (15) (21)
Depreciation and amortization 135 208
Bad debt expense 174 672
Contributions restricted for long-term investment (6,708) (6,889)
(Increase) decrease in assets:
Accounts receivable (32) (18)
Receivables from investments sales 30 1,668
Prepaid investment purchase — 20,000
Accrued interest receivable 1,017 214
Contributions receivable (439) (8,633)
Other assets 501 (388)
Contributions receivable from remainder trusts 32 55
Increase (decrease) in liabilities:
Accounts payable and accrued expenses 420 492
Deferred income (325) 642
Payables under split-interest agreements (14) (275)
Due to other foundations and affiliates (10,847) 23,957
Net cash provided by operating activities (16,612) 36,799

See accompanying notes to consolidated financial statements.
www.usmf.org 17
CONSOLIDATED STATEMENTS OF CASH FLOWS |For the year ended June 30, 2016 and 2015 (in thousands)
CASH FLOWS FROM INVESTING ACTIVITIES 2016 2015
Purchases of investments (105,539) (301,349)
Sales or distribution of investments 115,675 257,586
Change in cash surrender value of life insurance (13) (5)
Purchases of real and personal property (219) (135)
Net cash used in investing activities 9,904 (43,903)
Proceeds from contributions restricted for long-term investment 6,708 6,889
Net cash provided by financing activities 6,708 6,889
(Decrease) increase in cash and cash equivalents — (215)
Beginning of year — 215
End of year $ — $ —
CASH FLOWS FROM FINANCING ACTIVITIES
CASH AND CASH EQUIVALENTS

NOTES TO CONSOLIDATED FINANCIAL STATEMENTS | June 30, 2016 and 2015
1. Nature of Operations
The University System of Maryland Foundation, Inc. (the “Foundation”or “USMF,” also known as The University of Maryland Foundation, Inc.),a separately incorporated independent Foundation, manages fundsreceived for the benefit of the institutions of the University System ofMaryland (“USM”). The Foundation also offers the affiliated founda-tions associated with the institutions of the USM and the communitycolleges in the State of Maryland the opportunity to invest their assetsin the Foundation’s endowment pool. The Foundation is organized to receive, hold, invest, manage, use, dispose of, and administer propertyof all kinds, whether given absolutely or in trust, or by way of agency orotherwise, for the benefit of the USM or for all of the education andsupport activities that may be conducted by the USM or the Universityof Maryland Medical System (“UMMS”).
The Foundation is comprised of two separately accounted-for divisions:the University System of Maryland Foundation Funds and the Wye Herd,as well as a wholly owned subsidiary for-profit corporation, the USMFCorporation (refer to Note 13 for a discussion on the USMF Corporation).
2. Basis of Presentation and Summary of Significant
Accounting Policies
Basis of Consolidation and Presentation
The consolidated financial statements of the Foundation have beenprepared on the accrual basis of accounting. As described in Note 1,the Foundation is comprised of two divisions as well as a whollyowned subsidiary. The consolidated financial statements include theaccounts of these entities. All significant intercompany transactionsand accounts are eliminated in consolidation.
The consolidated financial statement presentation follows the recommendations of the Financial Accounting Standards Board (FASB)Accounting Standards Codification (ASC) 958, “Not-for-Profit Entities.”Under ASC 958, the Foundation is required to report information regarding its financial position and activities according to three classesof net assets: unrestricted net assets, temporarily restricted net assets, and permanently restricted net assets.
Cash and Cash Equivalents
Cash and short-term investments with maturities at dates of purchaseof three months or less are classified as cash equivalents, except thatany such investments purchased with funds held in trusts or by external endowment investment managers are classified with the deposits and investments, respectively. Cash equivalents includeshort-term U.S. Treasury securities and other short-term, highly liquidinvestments and are carried at cost, which approximates market value.
Accounts Receivable
Accounts receivable consists primarily of estate gifts. Accounts receivable are recorded net of any allowances. There are no allowancesas of June 30, 2016 and 2015. The Foundation’s policy is to write-off allreceivables that are deemed to be uncollectible.
Contributions Receivable
The contributions receivable balance is based on management’s bestestimate of the amounts expected to be collected. The amounts theFoundation will ultimately realize could differ from the amounts assumed in arriving at the present value. Amounts due are recorded atthe net realizable value discounted using a rate of return that a marketparticipant would expect to receive over the payment period at thedate the pledge is received. There are no allowances as of June 30,2016 and 2015. The Foundation’s policy is to write-off all contributionsreceivable that are deemed to be uncollectible.
Investments
Investments are stated at fair value. Unrealized and realized gains andlosses are included in the consolidated statements of activities andchanges in net assets.
Investments in publicly traded equity and debt securities are stated atquoted market values. For all of these investments, the Foundationhas concluded that the net asset values reported by the individual fund
managers approximates the fair value of the investments. Changes infair values are reported as unrealized gains or losses in the accompany-ing consolidated statements of activities and changes in net assets.
Alternative investments may include absolute return funds, long/shortequity hedge funds and private capital funds for which there may beno ready market to determine fair value. For these investments, theFoundation has concluded that either the net asset values reported bythe individual fund managers or the ownership percentage of thefund’s net assets approximate the fair value of the investments. Theseestimated values do not necessarily represent the amounts that will ultimately be realized upon the disposition of those assets, which maybe materially higher or lower than values determined if a ready marketfor the securities existed.
Valuation of Investments
The Foundation carries its investments at market value to the extentthat market quotations are readily available and reliable. To the extentthat market quotations are not available or are considered to be unreliable, fair value is estimated by the investment manager underthe general oversight of the Board of Directors of the Foundation afterconsideration of factors considered to be relevant, including but notlimited to, the type of investment, position size, marketability (or absence thereof), cost, restrictions on transfer, and available quotationsof similar instruments. Due to the uncertainty inherent in the valuationprocess, such estimates of fair value may differ significantly from thevalues that would have been obtained had a ready market for the investments existed, and the differences could be material. Additionally,changes in the market environment and other events that may occurover the life of the investments may cause the gains or losses ultimatelyrealized on these investments to be different than the valuations currently assigned. There is no single standard for determining fairvalue in good faith, as fair value depends upon circumstances of eachindividual case. In general, fair value is the amount that the Foundationmight reasonably expect to receive upon the current sale of the investment in an arms-length transaction in the investment’s principalmarket.
The change in net unrealized gains or losses on investment securitiesis reflected in the consolidated statements of activities and changes in net assets. All gains and losses arising from the sale, collection, orother disposition of investments are accounted for on a specific identification basis calculated as of the transaction date. For endowmentassets, which are all held in a pool, investment gains or losses are distributed monthly among the individual endowment accounts on thebasis of the number of units of the pool held by each individual endowment account. If the donor document requires that unspentearnings be added back to the corpus, then losses below the costbasis of endowment assets shall first reduce permanently restrictednet assets to the extent of accumulated unexpended earnings, thentemporarily restricted net assets to the extent that donor imposedtemporary restrictions on net appreciation of the assets have not been met before the loss occurs with any remaining loss reducing unrestricted net assets.
See Note 3 for further details on valuation of investments.
Angus Breeding Herd, Trademark, Logo, Records, and Data Bank
Management’s policy for accounting for the Angus breeding herd,trademark, logo, records, and data bank is to combine these assetgroups and value them as a single group rather than individually, due tothe relationship of each one to the others. These assets are related tothe Wye Herd, a cattle and research facility noted in Note 1.
Real and Personal Property
Real and personal property is carried at cost. The Foundation’s policy isto charge all additions over $1,000 (in dollars) to the asset account, butto charge the cost of repairs, maintenance and minor betterments tooperations in the year in which the cost is incurred. Depreciation is calculated using the straight-line method over the estimated usefullives of the assets which are five years. Depreciation expense totaled$0.1 million and $0.2 million for the years ended June 30, 2016 and2015, respectively. Asset and accumulated depreciation accounts are
18 www.usmf.org

NOTES TO CONSOLIDATED FINANCIAL STATEMENTS | June 30, 2016 and 2015
relieved when an asset is sold or otherwise disposed. Accumulateddepreciation totaled $2.3 million and $2.2 million for the years endedJune 30, 2016 and 2015, respectively. All artwork and land given to the Foundation are annually reviewed to determine if there is any impairment and to determine that the asset’s book value is still reasonable given these assets are not depreciated.
Contributions of Real and Personal Property
The Foundation receives various contributions of non-cash items. It isthe Foundation’s policy to record those assets not intended for sale atfair market value at the date of the gift. These assets are held for investment purposes and are not depreciated.
Due to Other Foundations and Affiliates
Due to other foundations and affiliates consists of funds invested bythe Foundation on behalf of other foundations and the annuities andtrusts administered for other foundations. These funds are recorded on a per unit basis and managed with funds of the Foundation. TheFoundation assesses the affiliated foundations an annual managementfee which is comprised of a separate investment services fee and anadministrative fee. The fees are assessed in relation to the individualmanagement contracts each affiliated foundation has with the Foundation and are based on the fair value of endowment and operating funds administered. The Foundation also assesses an annualmanagement fee of 1% on the annuities and trusts. Such managementfees totaled $2.9 million and $2.6 million for the years ended June 30,2016 and 2015, respectively, and are included in sales and services inthe consolidated statements of activities and changes in net assets.
Foundation management, based on other foundations and affiliates requests, designates investments from all net asset classes into operating and endowment categories. Administrative fees are chargedby the Foundation to cover operating expenses, depending on the typeof investment portfolio into which the asset is placed. The fees assessed by the Foundation are for expenses related to the operationof the Foundation such as management of the endowment, audit, andaccounting functions and development as needed to assist USM institutions. Professional investment fees are paid to the investmentmanagers prior to the distribution of income.
The amounts due to other foundations and affiliates at June 30, 2016and 2015, were as follows (in thousands):
www.usmf.org 19
(in thousands) 2016 2015
Allegany College of Maryland Foundation $ 9,858 $ 10,276
Alumni Association International 4,256 4,487
Bowie State University Foundation 6,317 6,158
Community College of Baltimore County Foundation 7,816 7,614
Coppin State University Development Foundation 8,454 8,862
Frederick Community College Foundation 11,729 12,089
Frostburg State University Foundation 20,042 18,519
Hagerstown Community College Foundation 8,614 8,489
Howard Community College Educational Foundation 7,485 7,213
M Club 2,125 2,230
Towson University Foundation 7,375 7,547
UMB Foundation 211,448 206,698
UMCP Foundation 309,236 310,661
University of Baltimore Foundation 3,332 3,754
University System of Maryland Common Trust 244,647 258,984
TOTAL $ 862,734 $ 873,581
Classification of Net Assets
The Foundation’s net assets have been grouped into the followingthree classes:
Unrestricted Net Assets — Unrestricted net assets generally resultfrom revenues derived from providing services and receiving unrestricted contributions, less expenses incurred in providing services,raising contributions, and performing administrative functions.
Temporarily Restricted Net Assets — Temporarily restricted net assetsgenerally result from contributions and other inflows of assets, the useof which is limited by donor-imposed stipulations that either expire bypassage of time or can be fulfilled and removed by actions of the Foundation pursuant to those stipulations.
Permanently Restricted Net Assets — Permanently restricted net assets generally result from contributions and other inflows of assets,which cannot be used by the Foundation. Income from these assetscan be unrestricted or restricted based on donor stipulation.
Unrealized and realized gains and losses, dividends, and interest frominvesting in income producing assets may be included in any of thesenet asset classifications depending on donor restrictions.
Contributions and Grants
The Foundation reports gifts of cash and other assets as restrictedsupport held in separate accounts if they are received with donor stipulations that limit the use of the donated assets. When a donor restriction expires, that is, when a stipulated time restriction ends orpurpose restriction is accomplished in subsequent reporting periods,temporarily restricted net assets are reclassified to unrestricted net assets and reported in the consolidated statements of activities andchanges in net assets as net assets released from restrictions. Contributions for which donors have stipulated restrictions, but whichare met within the same reporting period, are reported as unrestrictedsupport.
The Foundation reports gifts of land, buildings, and equipment as unrestricted support unless explicit donor stipulations specify how thedonated assets must be used. Gifts of long-lived assets with explicitrestrictions that specify how the assets are to be used are reported asrestricted support.
Unconditional promises to give with payments due in future periodsare reported as temporarily or permanently restricted support. Amountsoutstanding are recorded at the net realizable value discounted basedon the period of future payment, using a rate of return that a marketparticipant would expect to receive at the date the pledge is received.
Split-Interest Agreements
The Foundation also receives contributions in the form of charitable giftannuities and charitable remainder unitrusts, for which the Foundationacts as trustee and holds the assets. When the trust’s obligations to allbeneficiaries expire, the remaining assets will revert to the Foundationto be used according to the donor’s wishes.
The Foundation recognizes the estimated fair value of these agreementsas contributions receivable and revenue from those trusts where theFoundation is not trustee. Where the Foundation is the trustee, the estimated fair value is recognized as an asset and as contribution revenue.The fair value is based on the present value of estimated future distributions to be paid over the expected term of the trust agreements.
Amortization of the related discount and revaluation of expected cashflows are recognized as changes in the value of split-interest agreementsin the year in which they occur.
The Foundation recognizes a liability for the portion of the proceedsunder the split-interest agreements to be paid to the beneficiary underthe terms of the agreements. The estimated annuity liabilities expectedterms are based on the Internal Revenue Service (IRS) actuarial tables.The discount rates used to compute the present value of these receivables are the original discount rates used at the time of the giftunder the Internal Revenue Code (IRC) Section 7520 and range from0.3% to 10.6%.
NOTES TO CONSOLIDATED FINANCIAL STATEMENTS | June 30, 2016 and 2015
20 www.usmf.org
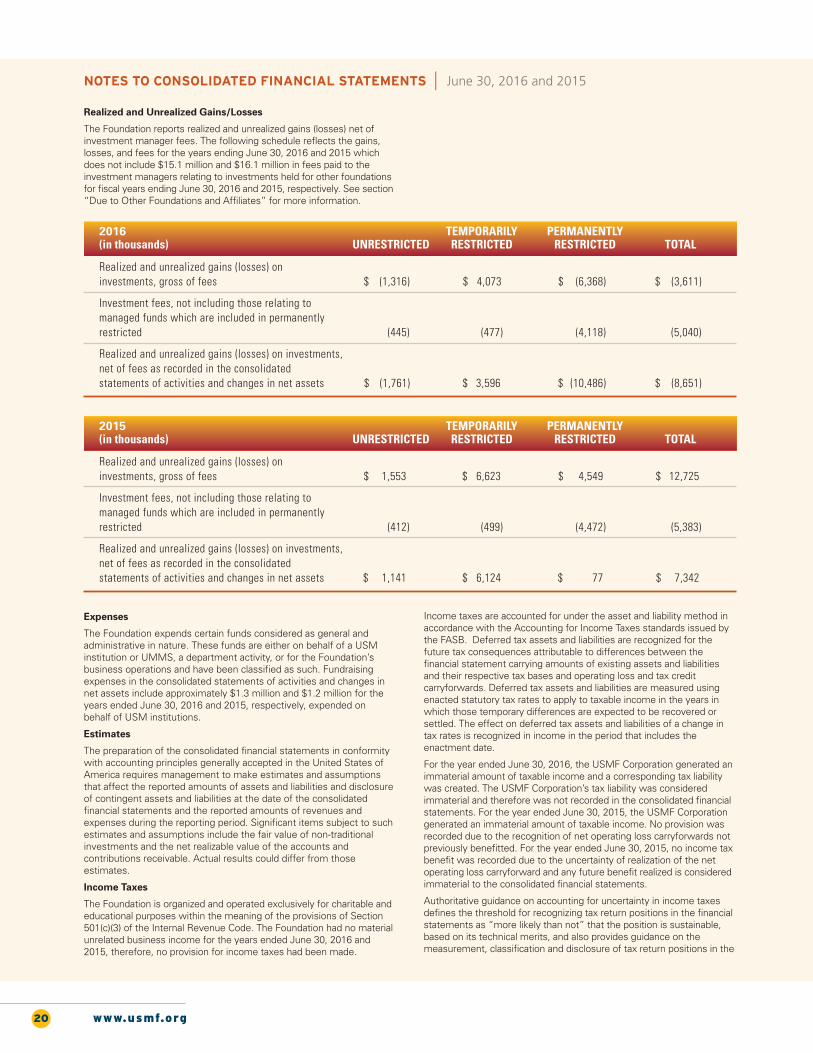
Realized and Unrealized Gains/Losses
The Foundation reports realized and unrealized gains (losses) net of investment manager fees. The following schedule reflects the gains,losses, and fees for the years ending June 30, 2016 and 2015 whichdoes not include $15.1 million and $16.1 million in fees paid to the investment managers relating to investments held for other foundationsfor fiscal years ending June 30, 2016 and 2015, respectively. See section“Due to Other Foundations and Affiliates” for more information.
Realized and unrealized gains (losses) on investments, gross of fees $ (1,316) $ 4,073 $ (6,368) $ (3,611)
Investment fees, not including those relating to managed funds which are included in permanently restricted (445) (477) (4,118) (5,040)
Realized and unrealized gains (losses) on investments, net of fees as recorded in the consolidated statements of activities and changes in net assets $ (1,761) $ 3,596 $ (10,486) $ (8,651)
2016 TEMPORARILY PERMANENTLY (in thousands) UNRESTRICTED RESTRICTED RESTRICTED TOTAL
Realized and unrealized gains (losses) on investments, gross of fees $ 1,553 $ 6,623 $ 4,549 $ 12,725
Investment fees, not including those relating to managed funds which are included in permanently restricted (412) (499) (4,472) (5,383)
Realized and unrealized gains (losses) on investments, net of fees as recorded in the consolidated statements of activities and changes in net assets $ 1,141 $ 6,124 $ 77 $ 7,342
2015 TEMPORARILY PERMANENTLY (in thousands) UNRESTRICTED RESTRICTED RESTRICTED TOTAL
Expenses
The Foundation expends certain funds considered as general and administrative in nature. These funds are either on behalf of a USM institution or UMMS, a department activity, or for the Foundation’sbusiness operations and have been classified as such. Fundraising expenses in the consolidated statements of activities and changes innet assets include approximately $1.3 million and $1.2 million for theyears ended June 30, 2016 and 2015, respectively, expended on behalf of USM institutions.
Estimates
The preparation of the consolidated financial statements in conformitywith accounting principles generally accepted in the United States ofAmerica requires management to make estimates and assumptionsthat affect the reported amounts of assets and liabilities and disclosureof contingent assets and liabilities at the date of the consolidated financial statements and the reported amounts of revenues and expenses during the reporting period. Significant items subject to suchestimates and assumptions include the fair value of non-traditional investments and the net realizable value of the accounts and contributions receivable. Actual results could differ from those estimates.
Income Taxes
The Foundation is organized and operated exclusively for charitable andeducational purposes within the meaning of the provisions of Section501(c)(3) of the Internal Revenue Code. The Foundation had no materialunrelated business income for the years ended June 30, 2016 and2015, therefore, no provision for income taxes had been made.
Income taxes are accounted for under the asset and liability method inaccordance with the Accounting for Income Taxes standards issued bythe FASB. Deferred tax assets and liabilities are recognized for the future tax consequences attributable to differences between the financial statement carrying amounts of existing assets and liabilitiesand their respective tax bases and operating loss and tax credit carryforwards. Deferred tax assets and liabilities are measured usingenacted statutory tax rates to apply to taxable income in the years inwhich those temporary differences are expected to be recovered orsettled. The effect on deferred tax assets and liabilities of a change intax rates is recognized in income in the period that includes the enactment date.
For the year ended June 30, 2016, the USMF Corporation generated animmaterial amount of taxable income and a corresponding tax liabilitywas created. The USMF Corporation’s tax liability was considered immaterial and therefore was not recorded in the consolidated financialstatements. For the year ended June 30, 2015, the USMF Corporationgenerated an immaterial amount of taxable income. No provision wasrecorded due to the recognition of net operating loss carryforwards notpreviously benefitted. For the year ended June 30, 2015, no income taxbenefit was recorded due to the uncertainty of realization of the net operating loss carryforward and any future benefit realized is consideredimmaterial to the consolidated financial statements.
Authoritative guidance on accounting for uncertainty in income taxesdefines the threshold for recognizing tax return positions in the financialstatements as “more likely than not” that the position is sustainable,based on its technical merits, and also provides guidance on the measurement, classification and disclosure of tax return positions in the

NOTES TO CONSOLIDATED FINANCIAL STATEMENTS | June 30, 2016 and 2015
www.usmf.org 21
financial statements. No asset or liability has been recorded as of June30, 2016 and 2015 for uncertain tax positions. The Foundation is nolonger subject to U.S. federal or state examinations by tax authoritiesfor years before fiscal year ended June 30, 2013.
Reclassifications
Certain amounts presented in the 2015 consolidated financial statements have been reclassified to conform to the 2016 presentation,with no effect on the change in net assets, as previously reported.
Recently Adopted Authoritative Guidance
In May 2015, the FASB issued Accounting Standards Update (ASU)2015-07, Fair Value Measurement (Topic 820), Disclosures for Investments in Certain Entities That Calculate Net Asset Value perShare (or Its Equivalent) (ASU 2015-07). ASU 2015-07 removes the requirement to include investments in the fair value hierarchy forwhich fair value is measured using the net asset value (NAV) per sharepractical expedient under ASC 820. ASU 2015-07 is effective for fiscalyear-ends beginning after December 15, 2016 with early adoption permitted. The Foundation elected to early adopt this new guidanceand the updated disclosures are included in the accompanying consolidated financial statement disclosures (See Note 3). The adoption of this guidance had no impact on the Foundation’s consolidated financial statements, other than as described in Note 3.
Recent Accounting Pronouncements Not Yet Adopted
In May 2014, the FASB issued ASU 2014-09, Revenue from Contractswith Customers (Topic 606), which is a comprehensive new revenuerecognition standard that will supersede existing revenue recognitionguidance. The core principle of the guidance is that an entity should recognize revenue to depict the transfer of promised goods or servicesto customers in an amount that reflects the consideration to which theentity expects to be entitled in exchange for those goods or services.FASB issued ASU 2015-14 that deferred the effective date for theFoundation until annual periods beginning after December 15, 2018.Earlier adoption is permitted subject to certain limitations. The amendments in this update are required to be applied retrospectively to each prior reporting period presented or with the cumulative effectbeing recognized at the date of initial application. Management is currently evaluating the impact of this ASU on its consolidated financialstatements.
In August 2014, the FASB issued ASU 2014-15, Presentation of Financial Statements – Going Concern (Subtopic 205-40): Disclosures ofUncertainties about an Entity’s Ability to Continue as a Going Concern.The update provides guidance about management’s responsibility toevaluate whether there is substantial doubt about an entity’s ability tocontinue as a going concern. The update also provides related disclosures. The guidance is effective for annual periods ending afterDecember 15, 2016. Presently the Foundation does not anticipate that the adoption of this update will have a material effect on the Foundation’s consolidated financial statements.
In February 2016, the FASB issued ASU 2016-02, Leases (Topic 842) toincrease transparency and comparability among organizations by recognizing lease assets and lease liabilities on the statement of financial positon and disclosing key information about leasing arrange-ments for lessees and lessors. The new standard applies a right-of-use(ROU) model that requires, for all leases with a lease term of more than12 months, an asset representing its right to use the underlying assetfor the lease term and a liability to make lease payments to be recorded.The ASU is effective for the Foundation’s fiscal years beginning afterDecember 15, 2019 with early adoption permitted. Management is currently evaluating the impact of this ASU on its consolidated financialstatements.
In August 2016, the FASB issued ASU 2016-14, Not-for-Profit Entities(Topic 958) and Health Care Entities (Topic 954) – Presentation of Financial Statements of Not-for-Profit Entities. The ASU amends thecurrent reporting model for nonprofit organizations and enhances theirrequired disclosures. The major changes include: (a) requiring the presentation of only two classes of net assets now entitled “net assetswithout donor restrictions” and “net assets with donor restrictions,”
(b) modifying the presentation of underwater endowment funds and related disclosures, (c) requiring the use of the placed in service approach to recognize the expirations of restrictions on gifts used to acquire or construct long-lived assets absent explicit donor stipulationsotherwise, (d) requiring that all nonprofits present an analysis of expenses by function and nature in either the statement of activities, aseparate statement, or in the notes and disclose a summary of the allocation methods used to allocate costs, (e) requiring the disclosure ofquantitative and qualitative information regarding liquidity and availabilityof resources, (f) presenting investment return net of external and directexpenses, and (g) modifying other financial statement reporting require-ments and disclosures intended to increase the usefulness of nonprofitfinancial statements. The ASU is effective for the Foundation’s consolidated financial statements for fiscal years beginning after December 15, 2017. Early adoption is permitted. The provisions of theASU must be applied on a retrospective basis for all years presented although certain optional practical expedients are available for periodsprior to adoption. Management is currently evaluating the impact of thisASU on their consolidated financial statements.
3. Fair Value Measurements
FASB ASC 820, Fair Value Measurement (ASC 820) defines fair value,requires disclosures about fair value measurements, and establishes athree-level hierarchy for fair value measurements based on the inputs tothe valuations of an asset or liability at the measurement date. Fair valueis defined as the price that would be received to sell an asset or paid totransfer a liability in an orderly transaction between market participantsat the measurement date. The following three-level hierarchy classifiesthe inputs used to determine fair value:
Level 1 — Quoted prices are available in active markets for identical investments as of the reporting date. The type of investments includedin this category include listed equities and listed mutual funds.
Level 2 — Pricing inputs include market data which is readily available,regularly distributed or updated, reliable and verifiable, not proprietary,provided by multiple, independent sources that are actively involved inthe relevant market. Investments which are generally included in thiscategory include less liquid and restricted equity securities and fixed income securities.
Level 3 — Pricing inputs are unobservable for the investment and include situations where there is little, if any, market activity for the investment. The inputs into the determination of fair value require significant judgment or estimation. Investments that are included in thiscategory generally include investments in private equity and investmentfunds as well as off-shore hedge funds.
An investment’s level within the fair value hierarchy is based on thelowest level of any input that is significant to the fair value measure-ment. However, the determination of what constitutes “observable” requires significant judgment on the part of the Foundation. Thecategorization of an investment within the hierarchy is based upon the pricing transparency of the investment and does not necessarilycorrespond to the perceived risk of that investment.
Some of the Foundation’s investments may be illiquid and the Foundation may not be able to vary the portfolio in response to changesin economic and other conditions. Some of the investments that arepurchased and sold are traded in private, unregistered transactions andare therefore subject to restrictions on resale or otherwise have no established trading market. In addition, if the Foundation is required toliquidate all or a portion of its portfolio quickly, the Foundation may realize significantly less than the value at which it previously recordedthose investments.
The Foundation reports certain investments using the net asset valueper share as determined by investment managers under the so called“practical expedient.” The practical expedient allows net asset value pershare to represent fair value for reporting purposes when the criteria forusing this method are met. These investment funds are held as units orinterest in institutional funds or a limited partnerships, which are statedat net asset value (NAV) or its equivalent. The Foundation uses the NAV

NOTES TO CONSOLIDATED FINANCIAL STATEMENTS | June 30, 2016 and 2015
22 www.usmf.org
as a practical expedient to estimate the fair value, unless it is probablethat all or a portion of the investment will be sold for an amount different than NAV. Due to the early adoption of FASB ASU 2015-07during the year ended June 30, 2016 (see Note 2), the Foundation has not categorized these investments in levels within the fair value hierarchy table.
June 30, 2015 Quoted Prices in Significant Other Significant Investments Total (in thousands) Active Markets for Observable Unobservable Reported Fair
Identical Assets Inputs Inputs at NAV* Value (Level 1) (Level 2) (Level 3)
Money-market funds and short-term $ 42,650 $ — $ — $ — $ 42,650 investments (1)
Corporate and municipal bonds ( 2) — 13,023 — — 13,023
Equities and mutual funds( 3) 219,553 — — — 219,553
U.S. Treasury notes and bonds ( 2) — 5,320 — — 5,320
U.S. Agency Securities( 2) — 867 — — 867
Collateralized mortgage obligations/assets and mortgage backed securities ( 2) — — — — —
Absolute return (4) — — 109,530 178,819 288,349
Long/short equity hedge funds(5) — — 151,380 168,563 319,943
Private capital (6) — — 251,398 34,688 286,086
Total $ 262,203 $ 19,210 $ 512,308 $ 382,070 $ 1,175,791
The following tables present the financial investments held by funds inwhich USMF invests. The following investments are carried at fair valueas of June 30, 2016 and 2015, by the fair value hierarchy defined above(in thousands):
*Certain investments that are measured at fair value using net asset value per share (or its equivalent) practical expedient have not been categorized in the fair value hierarchy. The fair value amounts presented in this table are intended to permit reconciliation of the fair value hierarchy to the amounts presented in the accompanyingconsolidated statement of financial position.
June 30, 2016 Quoted Prices in Significant Other Significant Investments Total (in thousands) Active Markets for Observable Unobservable Reported Fair
Identical Assets Inputs Inputs at NAV* Value (Level 1) (Level 2) (Level 3)
Money-market funds and short-term $ 37,702 $ — $ — $ — $ 37,702 investments (1)
Corporate and municipal bonds ( 2) — 11,376 — — 11,376
Equities and mutual funds( 3) 199,599 — — — 199,599
U.S. Treasury notes and bonds ( 2) — 5,851 — — 5,851
U.S. Agency Securities( 2) — 474 — — 474
Collateralized mortgage obligations/assets and mortgage backed securities ( 2) — 8 — — 8
Absolute return (4) — — 115,462 173,404 288,866
Long/short equity hedge funds(5) — — 126,864 152,540 279,404
Private capital (6) — — 278,480 55,244 333,724
Total $ 237,301 $ 17,709 $ 520,806 $ 381,188 $ 1,157,004
*Certain investments that are measured at fair value using net asset value per share (or its equivalent) practical expedient have not been categorized in the fair value hierarchy. The fair value amounts presented in this table are intended to permit reconciliation of the fair value hierarchy to the amounts presented in the accompanyingconsolidated statement of financial position.
There were no transfers of assets between Level 1, 2 or 3 classificationfor the years ended June 30, 2016 and 2015.

NOTES TO CONSOLIDATED FINANCIAL STATEMENTS | June 30, 2016 and 2015
www.usmf.org 23
(1) USMF invests in money-market funds and short-term investments, includingamounts invested in accounts with depository institutions and managed accountswhich are readily convertible to known amounts of cash. The Foundation investsin money-market and short-term investments to maintain liquidity for spendingneeds and unfunded commitment liabilities. Total deposits maintained at these institutions at times exceed the amount insured by federal agencies and therefore,bear a risk of loss. The Foundation has not experienced such losses on these funds.USMF has classified these investments as Level 1. Valuation is based on quotedmarket prices.
(2) USMF invests in corporate and municipal bonds, U.S Treasury notes and bonds,U.S Agency securities, and collateralized mortgage obligations/assets and mortgagebacked securities through managed accounts. Fair value, liquidity, and related income of these securities are sensitive to changes in economic conditions, includ-ing real estate value, delinquencies and/or defaults, and may be adversely affectedby shifts in the market’s perception of the issuers and changes in interest rates andcredit downgrades. The Foundation invests in these assets to protect investmentreturn in the event of sudden interest rate changes as well as to maintain liquidityfor spending needs and unfunded commitment liabilities. USMF has classified theseinvestments as Level 2. Valuation is based on similar asset values in active markets.
(3) USMF invests directly in common stock, preferred stock and mutual funds. In general, equity securities and mutual funds traded on national securities exchangesare valued at the last quoted sales price, except securities traded on the NasdaqStock Market, Inc. (“NASDAQ”), which are valued in accordance with the NASDAQ Official Closing Price. The Foundation invests in equity securities togain exposure to the overall direction of global equity markets. The underlyingsecurities within the account have quoted prices available in active markets andhave no redemption restrictions and therefore, USMF has classified these investments as Level 1.
(4) Absolute return investments track the purchase and sale of shares in companiesthat are the subject of publicly announced transactions, including corporate com-binations (for cash or exchange of shares), tender offers, restructurings, liquidations,bankruptcies, capitalizations and deals in distressed securities, which are dis-counted securities of a company in financial distress or bankruptcy. The fair valueof these investments has been estimated either by using the net asset value (NAV)per share of the investments or the ownership percentage of the fund’s net assets.The majority of these investments can be redeemed within one year. The remain-der of these investments have liquidity provisions that extend past one year. Thenotice period for redemption of investments ranges from one month to six months.There are no outstanding unfunded commitments to this asset category. USMFhas classified the investments fair valued by ownership percentage of the fund’snet assets as Level 3.
(5) Long/short strategies take long and short positions in publicly traded equity secu-rities in an effort to achieve attractive returns with moderate risk. Also included inthese categories are off-shore investment vehicles. Also, early withdrawal carriesa penalty. Therefore, even though the underlying assets in some of the vehiclesare readily saleable in the open market, the Foundation does not have the abilityand, therefore, has classified investments in those vehicles, excluding invest-ments valued by NAV, as Level 3. The fair value of these investments has beenestimated either by using the net asset value per share of the investments or theownership percentage of the fund’s net assets. The majority of these investmentscan be redeemed within one year. The remainder of these investments have liquidity provisions that extend past one year. Notice period for redemption rangesfrom one month to six months. There are no outstanding unfunded commitmentsto this asset category.
(6) Private capital consists of private equity and venture capital investments. Privateequity investments represent purchases of all or a portion of the equity interestin a company and the arrangement allows the purchasing group to take control.Venture capital investments are made in non-marketable securities of new com-panies or companies considered to be in the early stages of growth. Investmentsin private capital presented at fair value as approved by the Foundation’s manage-ment based, in part, on information and valuations provided by the general partnerof the partnerships or investment manager. The general partner or investmentmanager generally values their investments at fair value. Securities with no readilyavailable market are initially valued at cost, with subsequent adjustment to valueswhich reflect either the basis of meaningful third party transactions in the privatemarket or the fair value deemed appropriate by the Foundation’s management.In such instances, consideration is also given to the financial condition and oper-ating results of the issuer, the amount that the investment company/fund can rea-sonably expect to realize upon the sale of the securities, and any other factorsdeemed relevant. Such value represents the Foundation’s proportionate share ofthe capital in the investment company/fund. Accordingly, the value of the invest-ment is generally increased by additional contributions and the share of net earn-ings from the investments and decreased by distributions from the partnershipsand the partner’s share of net losses. These investments have been labeled asLevel 3 based on their lock up periods and the transparency of their assets. Re-demption of these investments is left to the discretion of the general partner/man-ager of the funds. Distributions from each fund will be received as the underlyinginvestments are liquidated. As of June 30, 2016, unfunded commitments withinthe private capital category equal approximately $304.0 million.
The fair values of Level 3 investments have been estimated by man-agement based on all available data, including information provided bythird-party pricing vendors, fund managers, custodians and generalpartners. The valuations of alternative investments are classified asLevel 3 due to the use of unobservable inputs in their year-end fair valuemeasurement. Unobservable inputs include 1) use of NAV or the owner-ship percentage of the fund’s net assets for alternative investment vehicles that are private, 2) capital account activity during the gap periodof the most recent investor statement and the Foundation’s year-end,and 3) known performance adjustments for alternative investments thathold securities with observable fair valuations. There were no changesin valuation methodologies as of June 30, 2016 and 2015.
Alternative investments are recorded at fair value based on NAV as apractical expedient provided by the respective general partner or fundadministrator of the individual alternative investment funds or the ownership percentage of the fund’s net assets. Due to the limitedavailability of valuation data as of the Foundation’s year-end, manage-ment utilizes the most recent NAV or ownership percentage whichmay be on a month to quarter lag. Management adjusts the net assetvalue or ownership percentage to be more representative of the year-end fair value by including capital contributions, and redemptionsor returns of capital during the gap period. Net capital activity duringthe gap periods increased management's estimates $1.5 million and $11.0 million for years ended June 30, 2016 and 2015, respectively.Management will also adjust for known performance adjustments for alternative investments that hold publicly traded securities. Performanceadjustments ranged from -4.3% to 3.01% for those investments on aone month lag. No performance adjustments are made to investmentson a quarter lag given the unobservability of investment performanceat the time of report issuance.
The Foundation believes the carrying value of alternative investmentsin the consolidated statements of financial position is a reasonable estimate of its ownership interest in the alternative investment funds.As part of the Foundation’s overall valuation process, management
evaluates these third-party methodologies to ensure that they are repre-sentative of exit prices in the security’s principal markets. Managementperforms a retroactive review of its fair value estimates by comparing toactual year-end statements received subsequent to year-end.
These valuation methods may produce a fair value estimate that maynot be reflective of future fair values. Furthermore, while the Foundationbelieves that its valuation methods are appropriate and consistent withother market participants, the use of different methodologies or assumptions to determine fair value could result in a materially differentestimate of fair value at the reporting date. The Foundation’s alternativeinvestments are held with sophisticated investment managers who received audited financial statements during the year that aid in management's ability to approximate fair value.
The following table is a roll forward of the consolidated statements offinancial position amounts for financial instruments classified by theFoundation within Level 3 of the fair value hierarchy as defined above(in thousands):
Significant Unobservable Inputs (Level 3)
Fair value recorded at June 30, 2014 $ 500,784
Realized and unrealized losses, net (7,915)
Purchase of portfolio investments 77,212
Proceeds from sale or distribution of investments (57,773)
Fair value recorded at June 30, 2015 $ 512,308
Realized and unrealized losses, net (11,702)
Purchase of portfolio investments 64,766
Proceeds from sale or distribution of investments (44,566)
Fair value recorded at June 30, 2016 $ 520,806

NOTES TO CONSOLIDATED FINANCIAL STATEMENTS | June 30, 2016 and 2015
24 www.usmf.org
Realized and unrealized losses recorded for Level 3 investments are included in "realized and unrealized gains (losses) on investments, net"on the consolidated statements of activities and changes in net assets.Total change in unrealized gains for Level 3 investments was $9.4 millionfor the year ended June 30, 2016 and the total change in unrealizedlosses for Level 3 investments was $3.2 million for the year endedJune 30, 2015.
Fair Value and Cost of Investments
The fair value and cost of investments held by funds in which USMFinvests at June 30 were as follows (in thousands):
Of the fair value of $1.2 billion at both June 30, 2016 and 2015, $968.9million and $985.1 million, respectively, is invested in the endowmentpool and $187.8 million and $189.9 million, respectively, is invested inthe operating portfolio. There are $0.3 million and $1.0 million in investments not invested with the pools at June 30, 2016 and 2015,respectively.
The Foundation committed $891.0 million and $816.0 million to privatecapital as of June 30, 2016 and 2015, respectively, of which $586.0million and $519.0 million has been called as of June 30, 2016 and 2015,respectively. These commitments are to be funded through transfersfrom other level 3 investments and new cash.
4. Concentration of Credit Risk
The Foundation maintains cash in bank accounts in amounts that mayexceed Federally insured limits at times. The Foundation has not experienced any losses in these accounts in the past and believes thatit is not exposed to significant credit risks because the accounts are deposited with major financial institutions.
5. Contributions Receivable
As of June 30, 2016 and 2015, the Foundation’s contributors had unconditionally promised to give approximately $16.6 million and $16.4million, respectively.
Promised contributions are due as follows at June 30 (in thousands):
Contributions receivable from remainder trusts are trusts where theFoundation is not the trustee, but an irrevocable beneficiary. Thesetrusts are valued at approximately $1.0 million at both June 30, 2016and 2015. The difference between the fair value of contributions receivable and the carrying value is deemed to be immaterial for financial statement purposes.
Fair Value Cost Fair Value Cost
Money-market funds and short-term investments $ 37,702 $ 37,702 $ 42,650 $ 42,650
Corporate and municipal bonds 11,376 11,454 13,023 13,023
Equities and mutual funds 199,599 192,852 219,553 202,170
U.S. Treasury notes and bonds 5,851 5,783 5,320 5,364
U.S. Agency Securities 474 477 867 865
Collateralized mortgage obligations/asset and mortgage backed securities 8 8 — —
Absolute return 288,866 203,138 288,349 202,256
Long/short equity hedge funds 279,404 198,570 319,943 226,300
Private capital 333,724 402,367 286,086 333,612
Total $ 1,157,004 $ 1,052,351 $ 1,175,791 $ 1,026,240
2016 2015
Contribution receivable $ 16,593 $ 16,394 Less: unamortized discount (1,099) (1,165)
Net contributions receivable $ 15,494 $ 15,229
Amounts due in: 2016 2015
Within one year $ 5,727 $ 4,696
One to five years 10,866 10,080
More than five years — 1,618
Total $ 16,593 $ 16,394
The discount rates used to calculate the present value component are
as follows: 1-5 Years 5 Plus Years
2016 3.25% 3.25%
2015 3.25% 3.25%
2016 2015

NOTES TO CONSOLIDATED FINANCIAL STATEMENTS | June 30, 2016 and 2015
www.usmf.org 25
6. Conditional Promises to Give and Intentions
To the extent the following items are conditional promises to give, theyare not recorded in the Foundation’s financial statements.
Life Insurance Policies
The Foundation has been named as the beneficiary of various life insurance policies. These policies had face amounts of approximately$2.0 million at both June 30, 2016 and 2015. In addition, the Foundationis owner and beneficiary of policies with face amounts of $771,000 (in dollars) and $755,000 (in dollars) and cash surrender values of approximately $262,000 (in dollars) and $249,000 (in dollars) at June 30,2016 and 2015, respectively, and are included in other assets in theconsolidated statements of financial position.
Bequests and Intentions (Unaudited)
Contributors have informed the Foundation of intentions to give approximately $15.8 million at June 30, 2016 and 2015. These intentions relate primarily to bequests and revocable trusts, which atthe contributor’s discretion may be changed and/or amended.
7. Endowments
The Foundation’s endowment consists of approximately 1,562 individualaccounts established for a variety of purposes. The endowment includesboth donor-restricted endowment funds and funds designated by theBoard of Directors to function as endowment funds. The net assets associated with endowment funds, including funds designated by theBoard to function as endowments, are classified and reported based onthe existence or absence of donor imposed restrictions.
The Board of Directors has interpreted the Maryland Uniform PrudentManagement of Institutional Funds Act (MUPMIFA) as requiring thepreservation of the fair value of the original gift as of the gift date of thedonor-restricted endowment funds absent explicit donor stipulations tothe contrary. As a result of this interpretation, the Foundation classifiesas permanently restricted net assets (a) the original value of the gifts donated to the permanent endowment, (b) the original value of subsequent gifts to the permanent endowment, and (c) accumulationsto the permanent endowment made in accordance with the direction ofthe applicable donor gift instrument at the time the accumulation isadded to the fund. The remaining portion of the donor-restricted endow-ment fund that is not classified in permanently restricted net assets isclassified as temporarily restricted net assets until those amounts areappropriated for expenditure by the Foundation in a manner consistentwith MUPMIFA. The Foundation considers the following factors in making a determination to appropriate or accumulate donor-restrictedendowments funds:
(1) The duration and preservation of the endowment fund(2) The purposes of the Foundation and the endowment fund(3) The general economic conditions(4) The possible effect of inflation or deflation(5) The expected total return from income and the appreciation
of investments(6) Other resources of the Foundation(7) The investment policies of the Foundation
Endowment net asset composition by type of fund as of June 30 isnoted below (in thousands):
TEMPORARILY PERMANENTLY UNRESTRICTED RESTRICTED RESTRICTED TOTAL
Donor-Restricted Endowment Funds $ 12,706 $ 19,137 $ 180,311 $ 212,154
Board-Designated Endowment Funds 5,943 2,514 — 8,457
Total $ 18,649 $ 21,651 $ 180,311 $ 220,611
TEMPORARILY PERMANENTLY UNRESTRICTED RESTRICTED RESTRICTED TOTAL
Donor-Restricted Endowment Funds $ 13,257 $ 19,431 $ 187,385 $ 220,073
Board-Designated Endowment Funds 6,264 2,008 — 8,272
Total $ 19,521 $ 21,439 $ 187,385 $ 228,345
2016
2015

NOTES TO CONSOLIDATED FINANCIAL STATEMENTS | June 30, 2016 and 2015
26 www.usmf.org
Changes in endowment net assets for the years ended June 30 (in thousands):
TEMPORARILY PERMANENTLY UNRESTRICTED RESTRICTED RESTRICTED TOTAL
Endowment net assets, beginning of the year $ 19,521 $ 21,439 $ 187,385 $ 228,345
Investment return
Investment income (loss) 433 281 (55) 659
Net depreciation (realized and unrealized) (697) (654) (10,486) (11,837)
Total investment return (264) (373) (10,541) (11,178)
Contributions 143 980 3,487 4,610
Other program income — — 1 1
Appropriation of endowment assets for expenditure (749) (395) — (1,144)
Transfers to System affiliated Foundations (2) — (21) (23)
Endowment net assets, end of year $ 18,649 $ 21,651 $ 180,311 $ 220,611
2016
TEMPORARILY PERMANENTLY UNRESTRICTED RESTRICTED RESTRICTED TOTAL
Endowment net assets, beginning of the year $ 19,527 $ 20,573 $ 172,093 $ 212,193
Investment return
Investment income (loss) 252 223 (96) 379
Net appreciation (realized and unrealized) 579 584 77 1,240
Total investment return 831 807 (19) 1,619
Contributions 96 1,326 15,329 16,751
Appropriation of endowment assets for expenditure (926) (1,267) — (2,193)
Transfers to System affiliated Foundations (7) — (18) (25)
Endowment net assets, end of year $ 19,521 $ 21,439 $ 187,385 $ 228,345
2015

NOTES TO CONSOLIDATED FINANCIAL STATEMENTS | June 30, 2016 and 2015
www.usmf.org 27
Permanently Restricted Net Assets – Endowment Funds
The portion of perpetual endowment funds that is required to be retained permanently either by explicit donor stipulation or by MUPMIFA as of June 30 (in thousands):
Temporarily Restricted Net Assets – Endowment Funds
The portion of temporarily restricted net assets related to the endow-ment funds as of June 30 (in thousands):
Academic programs $ 31,350 $ 35,223
Student support 103,113 104,593
University advancement 650 629
Research 2,282 2,414
Faculty support 42,916 44,526
Total $ 180,311 $ 187,385
20152016
Academic programs $ 7,379 $ 6,844
Student support 12,266 12,541
Research 519 516
Faculty support 1,487 1,538
Total $ 21,651 $ 21,439
20152016
Endowment Funds with Deficits
From time to time, the fair value of assets associated with individualdonor-restricted endowment funds may fall below the level that thedonor or MUPMIFA requires the Foundation to retain as a fund of perpetual duration. When donor endowment deficits exist, they areclassified as a reduction of unrestricted net assets. In accordance withgenerally accepted accounting principles, deficits of this nature that arereported in unrestricted net assets were approximately $0.3 million and$0.1 million as of June 30, 2016 and 2015. These deficits resulted fromunfavorable market fluctuations that occurred after the investment ofnew permanently restricted contributions and continued appropriationfor certain programs that were deemed prudent by the Board. Futuremarket gains will be used to restore this deficiency in unrestricted netassets before any net appreciation above the historical cost value ofsuch funds increases temporarily restricted net assets.
Return and Risk Return Objectives
USMF has adopted investment and spending policies for the endow-ment that seek to provide a steady and sustainable distribution of funds to support operations at its various institutions. The Investment Committee governs according to fundamental investment principles,approved by the Investment Committee and USMF Board of Directors,with the objective of achieving superior risk-adjusted returns in order to grow the corpus of the capital base and provide capital for spendingdistributions for constituents. Specifically, the goal of the endowment is to achieve returns in excess of inflation plus spending plus fees.Within the context of risk-taking, specific risk metrics are outlined forstaff and the Investment Committee to reassess the portfolio’s positioning if these levels are breached.
Strategies Employed for Achieving Objectives
To satisfy its objectives, USMF employs a diversified asset allocationthat allows for investment in public risk assets (liquid investments), private risk assets (illiquid portion of the portfolio), and safe assets(cash and US Government securities). In addition, on an as neededbasis to further protect capital, assets may be allocated to the portfoliooverlay class (liquid, exchange traded instruments that aim to hedgeagainst undesired risks). The asset allocation target ranges inclusive ofthese securities as of June 30, 2016 is as follows:
Safe Assets 5% 0% 25%
Portfolio Overlay 0% 0% 5%
Public Risk Assets 60% 45% 75%
Private Risk Assets 35% 20% 40%
Asset Class Policy Target Minimum Maximum
The endowment portfolio is constructed based on the following principles:
(1) Allocation: The overall goal of the Investment Committee in establishing the asset class ranges is to create balance across the portfolio between sources of return, liquidity timeliness, and types ofrisk. The purpose and definition of each asset class and sub-class is asfollows:
a) Safe Assets are defined as investments with little‐to‐no principalrisk. These assets are U.S. Government securities and cash. Thisportion of the portfolio is in place to provide capital preservation andstability during volatile periods as well as facilitate spending andcapital call requirements. Maintaining safe assets minimizes the riskof becoming forced sellers of assets during moments of marketstress.
b) Portfolio Overlay is another line of defense for capital preser-vation. Allocation towards this asset class will be infrequent and inline with protecting the entire portfolio from unwanted risks andmarket shocks. This is achieved through a number of liquid, exchangetraded instruments that aim to hedge against undesired risks. Thetarget allocation is set to zero percent because allocating capital tothis asset class will only be on an as needed, opportunistic basis.
c) Public Risk Assets define the liquid investments. These investments are traded in liquid markets/exchanges. This allocationhas been parsed into four sub‐asset classes which further definethe portfolio’s risk.
i. The Public Equity allocation is the primary growth driver of theportfolio. In it are investments in either liquid index securities and/orinvestment managers who invest with companies or in marketswith great prospects, while taking positions against (a.k.a., shortshorting) those that have deteriorating fundamentals and/or are indeclining industries.
ii. Public Credit investments provide a differentiated source ofreturn from the overall equity markets and diversify our public mar-ket risk. These are investments with managers that invest in corpo-rate, sovereign, and structured credit.
iii. Real Return represents a hedge against inflation, so as to preserve the endowment’s corpus. This allocation includes investments in commodities (either through derivatives and/or theirphysical assets), REITs, and occasionally equities that are tied tonatural resource companies. Historically, these investments havemaintained high correlations to levels of inflation.
iv. The Pure Alpha portion of the portfolio invests with niche investment managers that provide idiosyncratic sources of invest-ment return. These investment strategies cannot be replicated in anindex, nor does their performance track to an index. Examples ofthese strategies are global macro managers who make calls on the

NOTES TO CONSOLIDATED FINANCIAL STATEMENTS | June 30, 2016 and 2015
28 www.usmf.org
direction of economic events through fundamental analysis, eventdriven managers that analyze corporate events and take positionsbased on probable outcomes, and insurance‐linked securities thathave zero correlation to equity markets (and are dependent on outside factors such as weather and/or natural disasters).
d) Private Risk Assets are the illiquid portion of the portfolio, servingas the primary return enhancement over broad public equity markets.Because of the long‐term nature of the endowment's capital, the portfolio can hold illiquid investments that may take years for profit realization. While the use of capital is sacrificed during this timeframe,these investments are held to higher hurdles of performance, as theyare expected to earn a significant return premium over public marketequivalent investments. These investments seek to invest in thedebt and/or equity of businesses as well as physical assets. A widevariety of strategies are utilized across varied geographies, sectors,and liquidity profiles, so as to achieve market and vintage year diversification.
(2) Diversification: By allocating funds to asset classes whose returnsare not highly correlated over time, the Investment Committee aims tomitigate some of the volatility inherent in equities and thereby providegreater stability in spending distributions than might be possible with amore concentrated portfolio. Although such diversification means theendowment may not reap all of the benefits of equity bull markets, itwill also avoid the full brunt of bear markets. No more than 5% of theendowment fund’s assets may be invested in one fund and no morethan 10% of the endowment fund’s assets may be invested in onemanager. The Investment Committee, however, may make an excep-tion in special circumstances.
(3) Rebalancing: In order to reap the benefits of diversification, portfolio holdings will be rebalanced as necessary to ensure that theactual portfolio asset allocation does not deviate materially from policytarget allocation ranges.
Spending Policy and Relationship of Spending Policy to
Investment Objectives
The Foundation has a spending rate policy for endowment funds inorder to preserve the purchasing power of the assets, to protectagainst erosion of nominal principal and to promote stability and predictability of annual budgeting. The spending rate determines theamount to be distributed for current spending. If the agreement withthe donor so provides, any amounts remaining after annual distributionsare reinvested and become part of the corpus. If the agreement issilent as to earnings in excess of distributions, then under Foundationpolicy any amounts remaining after the distributions are reinvested and available for future spending. Some agreements provide that thecorpus can be invaded to provide for spending stability.
The Foundation’s policy of appropriating as of July 1 of the fiscal yearwas based on the following:
The Board of Directors has authorized a formulaic approach as an advisory tool to determine the annual spending rate. The approach is a combination of the following two factors by weighting (a) 30% and(b) 70% to calculate a per unit rate. Once calculated, the rate should be between 4.1% and 3.9% of the moving average market value forthe years ended June 30, 2016 and 2015, respectively. Spending ratesmay not violate any donor restrictions.
a) Compute the average market value for the most recent period ending December 31 using the previous twenty (20) quarters. Calculate5% of this average market value. This is the equivalent of using a moving average as each year the first four quarters drop off and themost recent four quarters are added.
b) Calculate an adjusted spending rate using the prior year’s percentageincreased by the Higher Education Price Index (HEPI).
After considering the formulaic approach and other relevant inputs, anannual spending rate is established. The spending rates for 2016 and2015 were 4.0% and 3.9%, respectively. The approved spending ratefor 2017 is 4.0%.
Newly created individual endowment funds, in order to have annualspendable income, must be invested for at least one year prior to thecalculation date and have a minimum value.
In establishing this policy, the Spending Policy Committee consideredthe long-term expected return on the endowment and its goal of preserving principle. Accordingly, over the long term, USMF expectsthe current spending policy to allow its endowment to grow at a ratethat protects capital on an inflation-adjusted basis.
The Board approved a blanket carryover for two years of unspent appropriated funds as of June 30. A special request must be made tocarry over unspent appropriated funds from more than two prior yearsinto subsequent fiscal years.
8. Restricted Net Asset Activity
Temporarily Restricted Net Assets
Temporarily restricted net assets were available for the followingpurposes at June 30 (in thousands):
Net Assets Released from Restrictions
Net assets were released from donor restrictions when expenses wereincurred to satisfy the restricted purposes or by occurrence of otherevents as specified by donors. Expenditures on permanently restrictedfunds are released out of the appreciation related to those funds to theextent allowed by the donors. Such net assets were released as followsduring the years ended June 30 (in thousands):
9. Pension Plan
The Foundation maintains a defined contribution plan for certain personnel provided by the Teachers Insurance and Annuity Association(“TIAA”) and the College Retirement Equities Fund (“CREF”). TheFoundation contributes 7.25% of the employee’s compensation to a401(a) plan. Effective July 1, 2005 the Foundation revised its pensionplan so that employees are fully and immediately vested. In addition, eligible employees are entitled to make voluntary contributions to a403(b) plan. The Foundation established a 457(b) plan for top executivesin 2002. Total pension expense for the years ended June 30, 2016 and2015 was approximately $151,000 (in dollars) and $201,000 (in dollars),respectively.
2016 2015
Academic programs $ 35,323 $ 32,882
Student support 17,327 17,837
University advancement 2,681 1,954
Research 16,917 17,331
Faculty support 1,885 2,190
Total $ 74,133 $ 72,194
2016 2015
Academic programs $ 6,942 $ 6,253
Student support 6,900 6,808
University advancement 169 285
Research 3,455 6,640
Faculty support 1,880 2,398
Total $ 19,346 $ 22,384

NOTES TO CONSOLIDATED FINANCIAL STATEMENTS | June 30, 2016 and 2015
www.usmf.org 29
10. Contributed Services and Office Space
A number of unpaid volunteers contribute their time to the Foundation.In addition, the Foundation’s offices are located in the USM Administra-tion building under a quid pro quo arrangement. The Foundation’s President is also the USM Vice Chancellor for Advancement and USMprovides space and computer equipment in exchange. The value ofthese services has not been included in the financial statements as theseservices are overall immaterial to the consolidated financial statements.
11. Charitable Gift Annuity Requirements
As required by the State of Maryland, the Foundation internally reservescash and investments associated with annuity liabilities of approximately$3.4 million as of June 30, 2016 and 2015.
12. Related Party Transactions
Various members of the Board of Directors of the Foundation are asso-ciated with organizations which manage a portion of the Foundation’sassets, or in which the Foundation has invested. These associations include investment by the Directors in entities in which the Foundationhas also invested, business relationships between the Directors andentities in which the Foundation has invested, employment of the Directors by an investment manager or one of its affiliates, and partici-pation by the Directors on the Board of Directors of an investmentmanager.
Members of the Board of Directors do not participate in investment,operational or other decisions by the Foundation with respect to entitieswith which those Directors are associated. Approximately $30.2 millionor 2.5% and $32.6 million or 2.7% of the Foundation’s total assets of$1.2 billion at June 30, 2016 and 2015, are invested in entities that haveassociations with members of the Foundation’s Board of Directors.
13. USMF Corporation
In November 2004, the Foundation established the USMF Corporation, a for-profit subsidiary, for the purpose of holding investment assets that potentially generate unrelated business income subject to federal andstate income tax. At June 30, 2016 and 2015, this corporation held $13.8 and $11.8 million in net assets, respectively, and has a net operating income (loss) of $0.6 million and $(1.3) million for the yearsended June 30, 2016 and 2015, respectively, which are reflected in theconsolidated financial statements.
14. Subsequent Events
Subsequent events have been evaluated by management through September 15, 2016, the date the consolidated financial statementswere available to be issued. There were no events noted that requiredadjustment to or disclosure in these consolidated financial statements.
“This scholarship has alleviated my burdens
financially, academically, and personally,
giving me the opportunity to focus on my
studies, and as a mother of four, being able
to assist with my children’s needs.”
Student and recipient of the Richard A. Henson Scholarship
at the University of Maryland Eastern Shore, Shelly Ann Henry

30 www.usmf.org
William CouperRetired President, Mid-AtlanticRegion, Bank of America
V. Raymond FerraraPresident and CEOProVise Management Group, LLC
Eric S. FrancisChairman and CEOThe CBMC Group
Joseph B. GildenhornFounding PartnerThe JBG Companies
Albert E. GirodFounder and Managing PartnerSSL Services
Linda R. GoodenRetired Executive Vice PresidentLockheed Martin Information Systems and Global Services
H. Christopher GoodrichChief Operating Officer and Executive Vice PresidentManTech
Joseph R. HardimanPrivate Investor
Cary HatchCEO, Brand AdvocateMDB Communications, Inc.
Kempton IngersolManaging Director, Senior Portfolio ManagerBrown Capital Management
Harry S. JohnsonPartnerWhiteford, Taylor & Preston
Linda E. JonesExecutive Vice PresidentRiggs, Counselman, Michaels & Downes, Inc.
Viju JosephChief Risk OfficerWeiss Multi-Strategy Advisers
Clifford M. KendallChairmanVSE Corporation
Ralph L. Lary, IIIManaging PartnerArena Technical Resources, LLC
Kyle Prechtl LeggRetired CEOLegg Mason Capital Management
Larry LetowCEO/PresidentConvergence Technology Consulting
Pamela Love ManningPresident PM Love Enterprises
Eric E. McLauchlinPartnerShaffer, McLauchlin & Stover, LLC
Robert MilkovichCEOFirst Potomac Realty Trust
William H. (Hassan) MurphyManaging PartnerMurphy, Falcon & Murphy
Jonathan MurraySenior Vice PresidentUBS
J. William MurrayPresidentThe Murray Group
J. Mitchell NeitzeyPresident and Chief Investment OfficerEFO Capital Management, Inc.
Creig NorthrupPresident and CEOThe Creig Northrop Team of Long& Foster Real Estate
Bruce RichardsCEO and Co-Managing PartnerMarathon Asset Management, LP
David C. SaundersCo-Founder and CEOK2 Advisors, LLC
Donald C. ScheelerSenior PartnerResource Solutions, Inc.
Natalie B. ShermanPartnerGallagher, Evelius and Jones, LLP
Molly ShockPresident, Board of Directors Towson University Foundation, Inc.
C. Emmerson Small, IISenior Vice President, InvestmentsWells Fargo Advisors
William R. SnyderRetired Senior Vice President for AdministrationCrown Central Petroleum Corporation
Francis S. Soistman, Jr.Executive Vice President of Government ServicesAetna
Bonnie B. SteinRetired Executive Vice Presidentand Managing DirectorPNC Wealth Management
Clolita VitaleRetired Assistant General CounselExelon Corporation
Thomas L. WilsonVice PresidentOrbital ATK Space Systems Group
Paul G. WoodGovernment Relations Advisor/LobbyistHarris Jones & Malone, LLC
William T. WoodWood Law Offices, LLC
OFFICERS
Dennis R. WraaseChairRetired Chairman and CEOPepco Holdings, Inc.
Leonard R. RaleyPresident and CEOUniversity System of Maryland Foundation, Inc.
Larry D. BoggsVice Chair (Investment)Managing Director – Investment OfficerWells Fargo Advisors, LLC
Joseph V. Bowen, Jr. SecretaryRetired Senior Vice Presidentfor Operations McKissack & McKissack
Charles W. Cole, Jr.Vice Chair (Investment)Retired Chairman and CEOLegg Mason Trust
B. Gary DandoTreasurerRetired PartnerErnst & Young
Paul H. MullanVice Chair (Investment)Retired Vice Chairman andStrategic PartnerCharterhouse Group International, Inc.
Thomas (Tim) Schweizer, Jr.Vice Chair (Investment)PresidentBrown Advisory Securities
DIRECTORS
John J. Allen, Jr.Vice PresidentDelmarva Power
Anirban BasuChairman and CEO Sage Policy Group, Inc.
Kenneth L. BedingfieldVice President FinanceNorthrop Grumman CorporationAerospace Systems
Alan C. CasonPartnerMcGuire Woods, LLP
Francis A. ContinoManaging DirectorFAC&B
Alfonso N. CornishSystem Vice President, Learningand Organizational Developmentand Chief Learning OfficerNorton Healthcare
Salvatore CorrentiFormer CEOConning Asset ManagementCompany
HONORARY DIRECTORS
Timothy J. AdamsPresident and CEOSA-TECH
Gary R. AlexanderSenior Partner and FounderAlexander & Cleaver, P.A.
Alison L. AstiAssociate Judge, Anne ArundelCounty Circuit Court
Robert A. BedingfieldRetired PartnerErnst & Young LLP
Roger R. Blunt, Sr.President and CEOBlunt Enterprises, LLC
George P. (Pat) ClancyRetired Executive Vice PresidentChevy Chase Bank
Hugh F. Cole, Jr.ChairmanBrantly Development Group
Harriet E. CoopermanPartnerSaul Ewing
Quincy M. CrawfordRetired President and CEOFirst Financial Group
Philip B. DownPresidentDoctors Community Hospital
John A. DriggsPresidentThe Driggs Corporation
Walter R. Fatzinger, Jr.DirectorChevy Chase Trust Company
Robert E. FischellChairman and CEOFischell Biomedical, LLC
Michael A. Gaines, Sr.Senior AssociateTrout Daniel & Associates
Dena Hudgins GallagherVice President of AdministrationThe Edgar Lomax Company
Jaye S. GambleCo-FounderBlu Venture Investors
Petch GibbonsPresident and Managing PrincipalSummit Commercial Real Estate
Barry P. GossettRetired Chairman and CEOActon Mobile Industries
William B. GrantRetired Chairman and CEOFirst United Bank & Trust
E. Bulkeley (Buck) GriswoldManaging PartnerL & L Capital Partners, LLC
Marian C. HwangPrincipalMiles & Stockbridge P.C.
USM FOUNDATION BOARD OF DIRECTORS
Leadership 2015-2016

www.usmf.org 31
UNIVERSITY SYSTEM OF MARYLAND
Board of Regents 2016-2017
Mickey L. BurnimPresidentBowie State University
Robert L. CaretChancellorUniversity System of Maryland
Michael CatherInterim Vice President for University AdvancementTowson University
Jason CurtinInterim Vice President for AdvancementSalisbury University
Douglas DalzellVice President for Institutional AdvancementCoppin State University
Janet Dudley-EshbachPresidentSalisbury University
Freeman A. HrabowskiPresidentUniversity of Maryland,Baltimore County
Wallace D. LohPresidentUniversity of Maryland, College Park
Richard Lucas, Jr.Vice President for Institutional AdvancementBowie State University
Stephen L. McDanielVice President for Institutional AdvancementUniversity of Maryland EasternShore
Javier MiyaresPresidentUniversity of Maryland UniversityCollege
Ronald H. NowaczykPresidentFrostburg State University
Jay A. PermanPresidentUniversity of Maryland, Baltimore
T. Greg PrinceVice President for Advancementand External AffairsSalisbury University
Leonard R. RaleyPresident and CEOUniversity System of MarylandFoundation, Inc.
Kim E. SchatzelPresident Towson University
Kurt L. SchmokePresidentUniversity of Baltimore
John T. ShortVice President for Institutional AdvancementFrostburg State University
Theresa SilanskisVice President for Institutional AdvancementUniversity of Baltimore
Gregory E. SimmonsVice President for Institutional AdvancementUniversity of Maryland, Baltimore County
Thomas J. SullivanChief Development Officer and Vice PresidentUniversity of Maryland, Baltimore
Cathy SweetVice President forInstitutional AdvancementUniversity of Maryland University College
Maria ThompsonPresidentCoppin State University
Peter WeilerVice President for University RelationsUniversity of Maryland, College Park
STAFF OFFICERS
Carrie BrowneAssistant SecretaryBoard Relations AssociateUniversity System of MarylandFoundation, Inc.
Marianne HorriganVice President for Board RelationsAssociate Vice Chancellor for Advancement and Chief of StaffUniversity System of Maryland
Pamela PurcellVice President for Finance andGeneral CounselVice President for Finance and CFOUniversity System of MarylandFoundation, Inc.
Bill WojcikAssistant TreasurerChief Operating OfficerUniversity System of MarylandFoundation, Inc.
Walter I. JonesPresident and CEOExecuTech – Strategic Consulting
Roger W. KentSenior Vice PresidentTD Bank
Raymond G. LaPlacaPartnerKnight, Manzi, Nussbaum & LaPlaca, P.A.
Stephen A. LazinskyPresidentComeq, Inc.
William E. MayerSenior PartnerPark Avenue Equity Partners
Sander MednickCEOMilestone Hotel Partners, LLC
Michael E. MeeganDirectorCohnReznick
Arthur S. MehlmanRetired PartnerKPMG, LLP
David F. MisterSenior PartnerMister, Winter & Bartlett, LLC
Neil MoskowitzRetired Chief Financial OfficerCredit Suisse First Boston
Emmett Paige, Jr.Retired Vice PresidentDoD/ Intel OperationsLockheed Martin Information Technology
Martin R. ResnickChairmanMartin’s Caterers
Robert B. SchaftelInsurance BrokerRiggs, Counselman, Michaels & Downes, Inc.
John C. Weiss, IIIAssistant ProfessorUniversity of Baltimore MerrickSchool of Business
Sam A. ZappasBusiness Consultant
EX OFFICIO DIRECTORS
David BalcomVice President for InstitutionalAdvancementUniversity of Maryland Centerfor Environmental Science
Juliette BellPresidentUniversity of Maryland EasternShore
Donald F. BoeschPresidentUniversity of Maryland Centerfor Environmental Science
James T. Brady, ChairBoard of DirectorsDunbar Armored, Inc.
Gary L. Attman, TreasurerPresident and CEOFutureCare Health and Management Corporation
Norman R. AugustineFormer Chairman and CEOLockheed Martin Corporation
Joseph Bartenfelder, ex officioSecretary of Agriculture, MarylandDepartment of Agriculture
Brandon Enriquez, Student RegentUniversity of Maryland, BaltimoreCounty
Ellen R. FishExecutive Vice President andChief Lending OfficerHamilton Bank
Linda R. Gooden, AssistantTreasurerRetired Executive Vice PresidentLockheed Martin Information Systems and Global Services
Barry P. Gossett, Vice ChairRetired Chairman and CEOActon Mobile Industries
Michelle A. Gourdine, SecretaryCEOMichelle Gourdine & Associates
James HolzapfelManaging Director - InvestmentAdvisorThe Holzapfel Investment Groupof Wells Fargo Advisors, LLC
D’Ana E. JohnsonPartner Bonner Kiernan Trebach & Crociata LLP
Robert R. NeallSenior Advisor to Maryland Governor Larry HoganDirector, Governor’s Office ofTransformation and Renewal
Robert L. PevensteinPresidentPrinceville Partners, LLC
Louis M. PopePresident and OwnerCentury 21 Trademark Realty, Inc.
Robert D. RauchPrincipalRAUCH, Inc.
Frank M. Reid, IIISenior Pastor and CEOBethel AME Church
Thomas G. Slater, AssistantSecretaryFounder and Principal PartnerSlater & Slater, P.C.

32 www.usmf.org
Regents Staff AwardsSeptember 18, 2015, Coppin State University
Regents Faculty AwardsApril 15, 2016, University of Maryland University College
1: Wallace Loh and James Brady 2: L-R: Michele Kimery, Freeman Hrabowski,
Marsha Velli, Valerie Thomas3: Mickey Burnim and Francis X. Kelly4: L-R: James Shea, Uche Enwesi, Julia Heng,
M. Robert Maddux, Sherrye Larkins, Marsha Velli,Michele Kimery, Colleen Wright-Riva, BeatriceWright, Robert Caret
L-R: Rommel Miranda, Kim Schatzel, Matthew Hemm,Jane Wolfson
Front row, L-R: Karen Hopkins, Heather Gable, Hoda El-Sayed, Anne Spence, Ivan Sascha Sheehan, Paulinus Chigbu, Ramani Duraiswami, Debra Stanley, Hany Sobhi,Back row, L-R: Jungho Kim, Matthew Hemm, Russell T. Hill, Rommel Miranda, UpalGhosh, Jane Wolfson, Robert Caret, Valli Meeks, James Brady
1
23
4

The USM Foundation recognizes its obligation to respect and protect the privacy of our donors. Information about donations is handled with respect and confidentiality to the extent provided bylaw. Some donors prefer anonymity. We will respect the wishes of contributors who prefer theirgifts to remain confidential. For more information, please contact the USM Foundation office.
Leonard R. Raley
President and CEO/Vice Chancellor for Advancement301-445-1941, [email protected]
Samuel N. Gallo
Chief Investment Officer202-296-1209, [email protected]
Marianne Horrigan
Associate Vice Chancellor for Advancement and Chief of StaffVice President for Board Relations301-445-2708, [email protected]
Pamela Purcell
Vice President for Finance and CFO301-445-2720, [email protected]
Bill Wojcik
Chief Operating Officer301-445-1922, [email protected]
3300 Metzerott Road
Adelphi, MD 20783
www.usmf.org