Using the FLCS script for spectral crosstalk removal via · PDF file ·...
12
Tutorial Using the FLCS script for spectral crosstalk removal via FLCCS Summary This tutorial shows step-by-step, how to calculate a spectral fluorescence lifetime cross-correlation (FLCCS) curve from a measurement of a mixture of two labeled oligunucleotides moving independently from each other. As the green dye has been excited with pulsed 485 nm excitation, while the red dye has been excited with a 560 nm cw laser, the different excitation scheme is used to eliminate the unwanted spectral crosstalk. Background Information © PicoQuant 2013 Tutorial: Using the FLCS script for spectral crosstalk removal via FLCCS 1
Transcript of Using the FLCS script for spectral crosstalk removal via · PDF file ·...

Tutorial
Using the FLCS script for spectral crosstalk removal via FLCCS
Summary
This tutorial shows step-by-step, how to calculate a spectral fluorescence lifetime cross-correlation (FLCCS) curve from a measurement of a mixture of two labeled oligunucleotides moving independently from each other. As the green dye has been excited with pulsed 485 nm excitation, while the red dye has been excited with a 560 nm cw laser, the different excitation scheme is used to eliminate the unwanted spectral crosstalk.
Background Information
© PicoQuant 2013 Tutorial: Using the FLCS script for spectral crosstalk removal via FLCCS 1

Preparations
• To demonstrate the effect of the FLCCS procedure described in this script, first proceed the steps according to the tutorial "Calculate FCCS Trace with the Grouped FCS Script".
© PicoQuant 2013 Tutorial: Using the FLCS script for spectral crosstalk removal via FLCCS 2
Note:Fluorescence Cross-Correlation Spectroscopy (FCCS) is a method to determine molecular interactions between two molecules labeled with different dyes. Usually, the dyes attached to the two molecules differ in their absorption and emission properties but they can also vary in their fluorescence lifetime.
To quantify the cross-correlation signal and connect it to a binding fraction, a calibration of the effective confocal volumes for each dye and the overlapping confocal volume must be performed.
The calibration can be done using a macromolecule labeled with both fluorophores.
FCCS calibration dyes are available e.g. from IBA (http://www.iba-lifesciences.com/details/product/5-0000-604.html).
Usually, a positive control is needed, in which both dyes are moving in a coordinated fashion.
Additionally, a negative control is need, if the spectral crosstalk is not negligible.
If one dye is excited with a pulsed and the other with a cw laser, fluorescence lifetime cross-correlation (FLCCS) is an ideal tool to remove the unwanted spectral crosstalk as demonstrated in this tutorial. As a consequence, only the positive calibration probe is necessary. For details please refer to: Padila-Parra et al., Microsc. Res. Tech. 2011, 74, 788-93.
The main idea of the method stems from the fact that if the fluorescence signal from the dye excited with a pulsed laser leaks into the second spectral channel, it will also show a decay behaviour corresponding to its fluorescence lifetime. If the second dye is excited with a continuous wave laser, the fluorescence response in the TCSPC window will be a homogenous background similar to roomlight.
Therefore, it is possible to generate two patterns: one for the fluorescence response after pulsed excitation (e.g. for the green fluorescent dye) and one for the fluorescence response after cw excitation.
After these TCSPC patterns have been generated, the green spectral channel using the pulsed response pattern is cross-correlation with the red spectral channel using the cw-response pattern.
Note:This way you can compare the data from the results originating from a standardspectral crosscorrelation and a correlation that involves the fluorescence lifetime information. As the fluorescence lifetime information is used to remove afalse positive contribution due to spectral crosstalk, cross correlation calculated in a purely spectral fashion is always higher, if a significant amount of spectral bleedthrough is present.

Step-by-Step Tutorial
Select a file and start the script
• Start SymPhoTime 64 software.
• Open the "Samples" workspace via "File\open Workspace" from the main menu.
• Response: The files of the sample workspace are displayed in the workspace panel on the left side of the main window.
• Highlight the file "IBA488+IBA547_unlinked_mix.ptu" by a single mouse click.
© PicoQuant 2013 Tutorial: Using the FLCS script for spectral crosstalk removal via FLCCS 3
Note:The "Samples" workspace is delivered with the SymPhoTime 64 and on the DVD-ROM and contains example data to show the function of the SymPhoTime64 data analysis. If you haven't installed it on your computer, copy it from the DVD onto a local drive before going through this tutorial.
Note:This file contains a FCS measurement of a FCCS negative control (two DNA oligonucleotides labeled with a green and a red fluorophore, respectively). The sample was excited with a pulsed 485 nm laser and a cw 560 nm laser.

• Select the "Analysis" tab and in there, open the drop down menu "FCS".
• Start the Grouped FCS script by clicking on "Start".
© PicoQuant 2013 Tutorial: Using the FLCS script for spectral crosstalk removal via FLCCS 4
Note:The drop down menu can be opened and closed by clicking on the grey button on the left side of the header of the drop down menu:

• Response: The FLCS script is applied to the file "IBA488+IBA547_unlinked_mix.ptu". Thereby, a new Window opens:
Select the patterns for the pulsed and the cw-contribution
© PicoQuant 2013 Tutorial: Using the FLCS script for spectral crosstalk removal via FLCCS 5
Note:The window contains three different regions:
Left: Analysis and display options. For explanation of the different parameters, place the mouse cursor over this part of the window and press <F1> to open the corresponding help page.
Upper center/right: Intensity time trace. The display can be changed using the "trace display settings of the analysis options. The large window shows the inset of the complete trace above highlighted in green. The photon counting histogram on the right displays the frequencies of the different intensity values. Usually, this trace is used to check, whether the signal is stable during the measurement. Also, large intensity spikes stemming from aggregation of the fluorescent sample can be identified in this graph.
Lower center/right: FCS trace. As first the FCS correlation criteria have to be defined and the curve needs to be calculated, this graph does not contain any trace at this stage.

• In the "FLCS" drop down menu, click on "Create Filters\Pattern Matching".
• Response: The FLCS pattern matching windows pops up.
© PicoQuant 2013 Tutorial: Using the FLCS script for spectral crosstalk removal via FLCCS 6
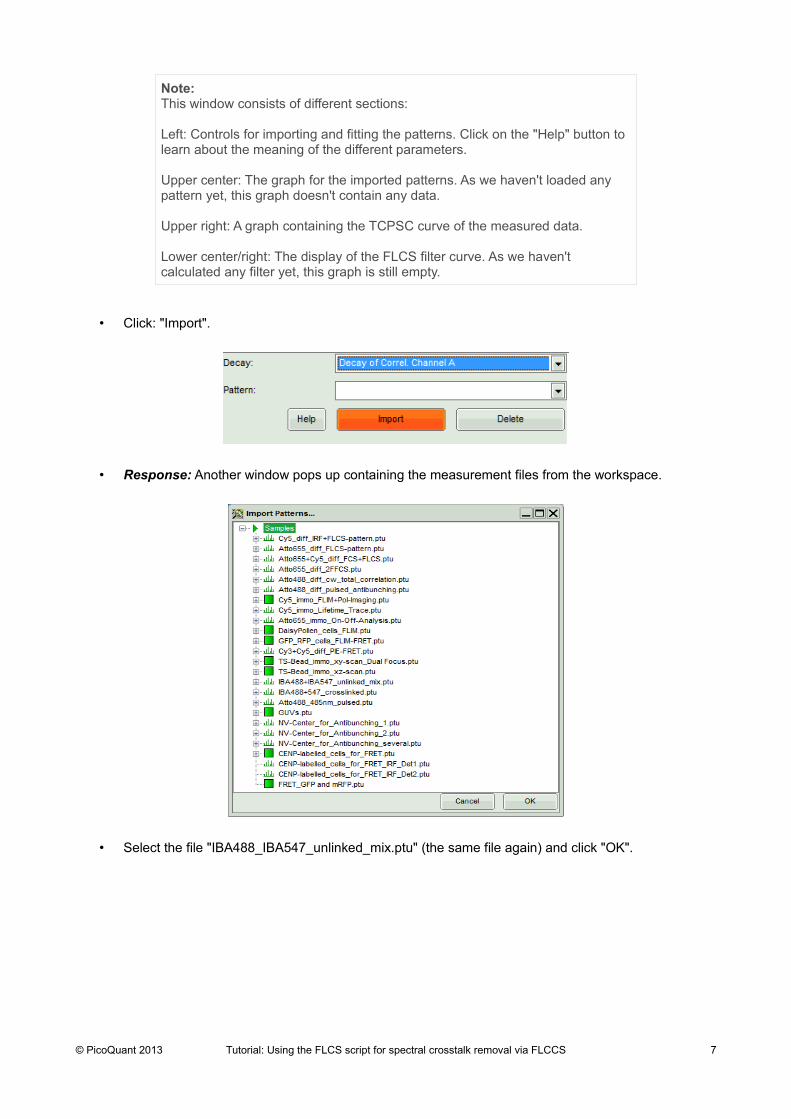
• Click: "Import".
• Response: Another window pops up containing the measurement files from the workspace.
• Select the file "IBA488_IBA547_unlinked_mix.ptu" (the same file again) and click "OK".
© PicoQuant 2013 Tutorial: Using the FLCS script for spectral crosstalk removal via FLCCS 7
Note:This window consists of different sections:
Left: Controls for importing and fitting the patterns. Click on the "Help" button to learn about the meaning of the different parameters.
Upper center: The graph for the imported patterns. As we haven't loaded any pattern yet, this graph doesn't contain any data.
Upper right: A graph containing the TCPSC curve of the measured data.
Lower center/right: The display of the FLCS filter curve. As we haven't calculated any filter yet, this graph is still empty.
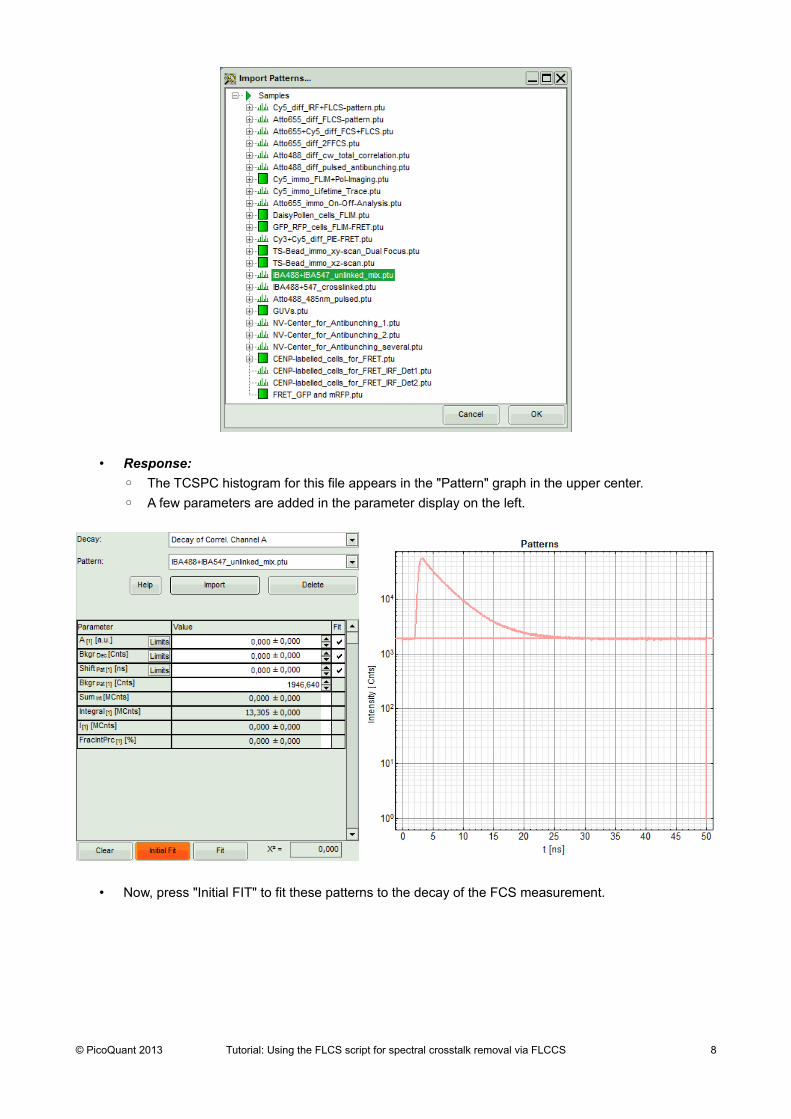
• Response:
◦ The TCSPC histogram for this file appears in the "Pattern" graph in the upper center.
◦ A few parameters are added in the parameter display on the left.
• Now, press "Initial FIT" to fit these patterns to the decay of the FCS measurement.
© PicoQuant 2013 Tutorial: Using the FLCS script for spectral crosstalk removal via FLCCS 8
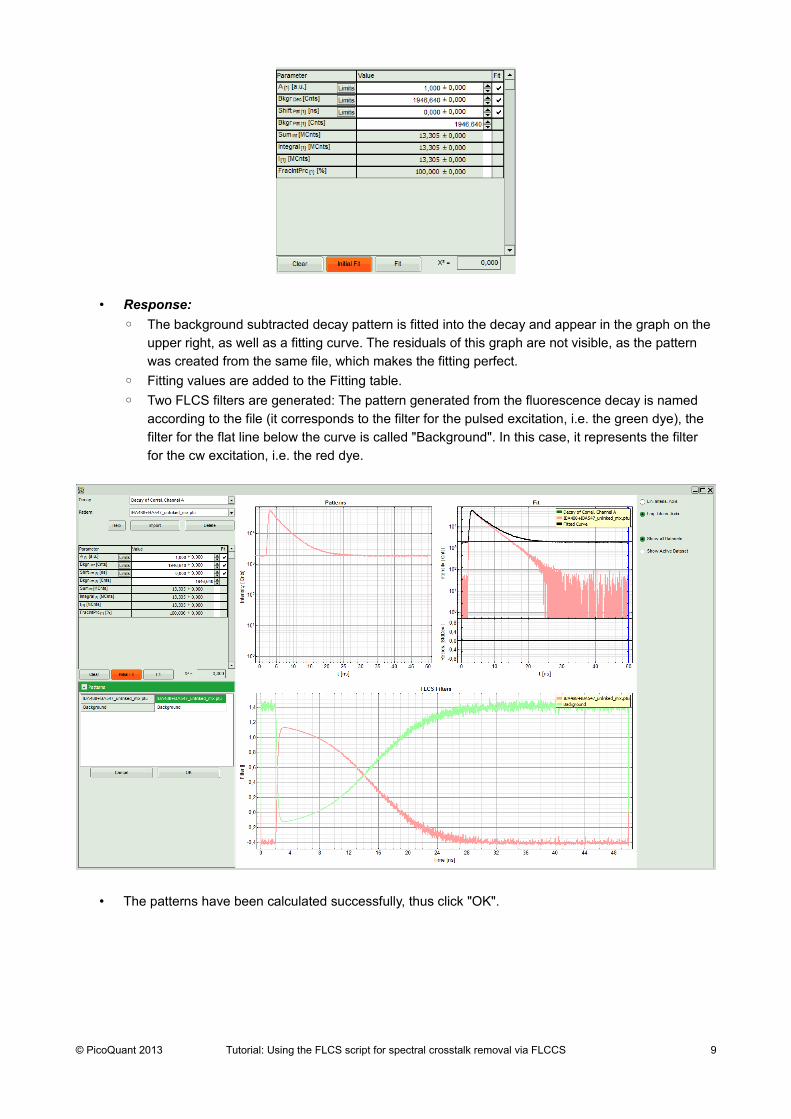
• Response:
◦ The background subtracted decay pattern is fitted into the decay and appear in the graph on the upper right, as well as a fitting curve. The residuals of this graph are not visible, as the pattern was created from the same file, which makes the fitting perfect.
◦ Fitting values are added to the Fitting table.
◦ Two FLCS filters are generated: The pattern generated from the fluorescence decay is named according to the file (it corresponds to the filter for the pulsed excitation, i.e. the green dye), the filter for the flat line below the curve is called "Background". In this case, it represents the filter for the cw excitation, i.e. the red dye.
• The patterns have been calculated successfully, thus click "OK".
© PicoQuant 2013 Tutorial: Using the FLCS script for spectral crosstalk removal via FLCCS 9
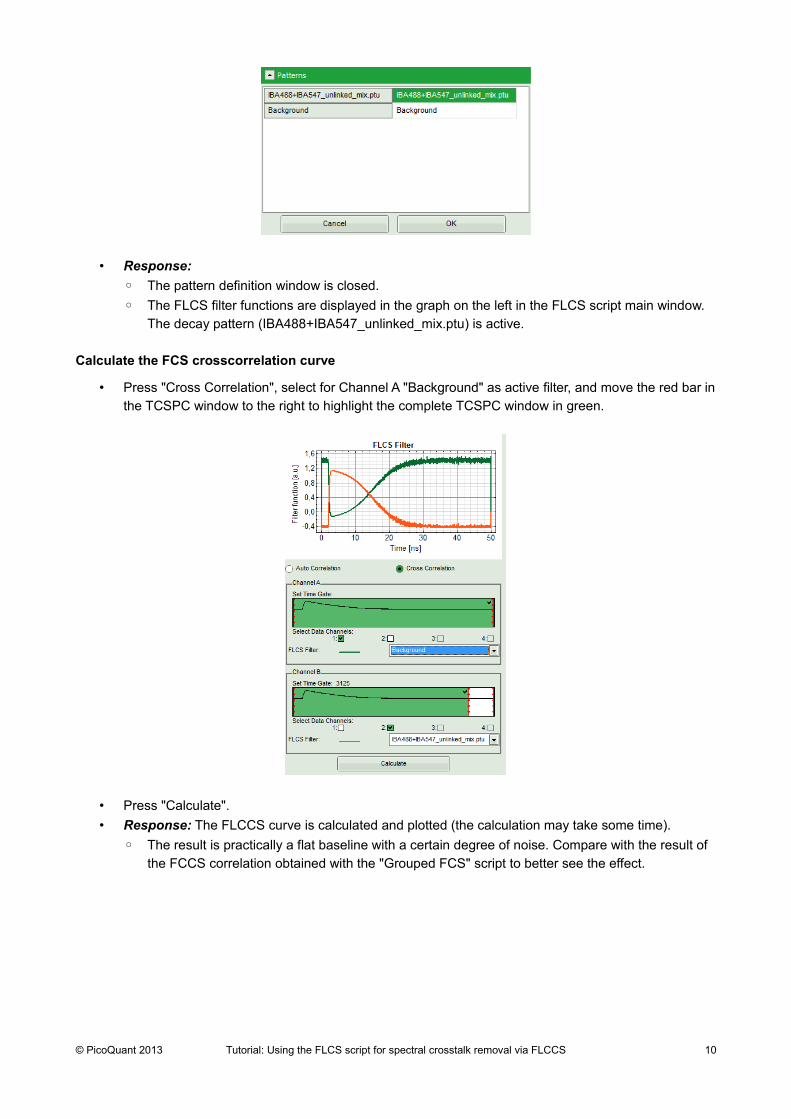
• Response:
◦ The pattern definition window is closed.
◦ The FLCS filter functions are displayed in the graph on the left in the FLCS script main window. The decay pattern (IBA488+IBA547_unlinked_mix.ptu) is active.
Calculate the FCS crosscorrelation curve
• Press "Cross Correlation", select for Channel A "Background" as active filter, and move the red bar inthe TCSPC window to the right to highlight the complete TCSPC window in green.
• Press "Calculate".
• Response: The FLCCS curve is calculated and plotted (the calculation may take some time).
◦ The result is practically a flat baseline with a certain degree of noise. Compare with the result of the FCCS correlation obtained with the "Grouped FCS" script to better see the effect.
© PicoQuant 2013 Tutorial: Using the FLCS script for spectral crosstalk removal via FLCCS 10

• Save the result by clicking "Save Results".
• Response: A result file is created.
Behavior in case of a positive calibration
• Run the same procedure as shown before with the file "IBA488+547_crosslinked.ptu".
© PicoQuant 2013 Tutorial: Using the FLCS script for spectral crosstalk removal via FLCCS 11
Note:It has been demonstrated, that false positive cross-correlation due to spectral crosstalk can be completely removed using FLCCS. This effect is also visible in a positive control, but as here the main part of the correlation is due to coordinated movement, the amplitude is only slightly decreased compared to a standard spectral cross-correlation analysis.

• Response: The correlation curves of this file are calculated. The cross-correlation amplitude is significantly higher than for the negative calibration dye as processed before, but lower than the corresponding FCCS file obtained with the "Grouped FCS" script.
PicoQuant GmbH Phone: +49-(0)30-6392-6929Rudower Chaussee 29 (IGZ) Fax: +49-(0)30-6392-656112489 Berlin Email: [email protected] WWW: http://www.picoquant.com
Copyright of this document belongs to PicoQuant GmbH. No parts of it may be reproduced, translated or transferred to third parties without written permission of PicoQuant GmbH. All Information given here is reliable to our best knowledge. However, no responsibility is assumed for possible inaccuracies or ommisions. Specifications and external appearences are subject to change without notice.
© PicoQuant GmbH, 2013
fff