Using Taking Part data to measure Badminton participation ... · Using Taking Part data to measure...
14
Using Taking Part data to measure Badminton participation David Barrett Sport Industry Research Centre
Transcript of Using Taking Part data to measure Badminton participation ... · Using Taking Part data to measure...

Using Taking Part data to measure Badminton participation David Barrett Sport Industry Research Centre

Sport Industry Research Centre Who we are
• An internationally recognised sport research centre • One of 3 at SHU • A team of 17 full-time staff • Not only observers, but also participants

Sport Industry Research Centre What we do
• Elite Sport • Participation
• Major Events • Volunteering
• Performance Management • Programme Evaluations • Sport Economics • GIS (Spatial) Analysis

Sport Industry Research Centre Our Clients

The Brief: A Comprehensive Analysis of Participation
•BADMINTON England – Bring range of data sources together – Test BE's Participation model – Sport England Funding Cycle
• London, Rio and beyond •SIRC
– Road test new methods of analysis
Support NGB Decision Making Review The State of the Badminton Nation
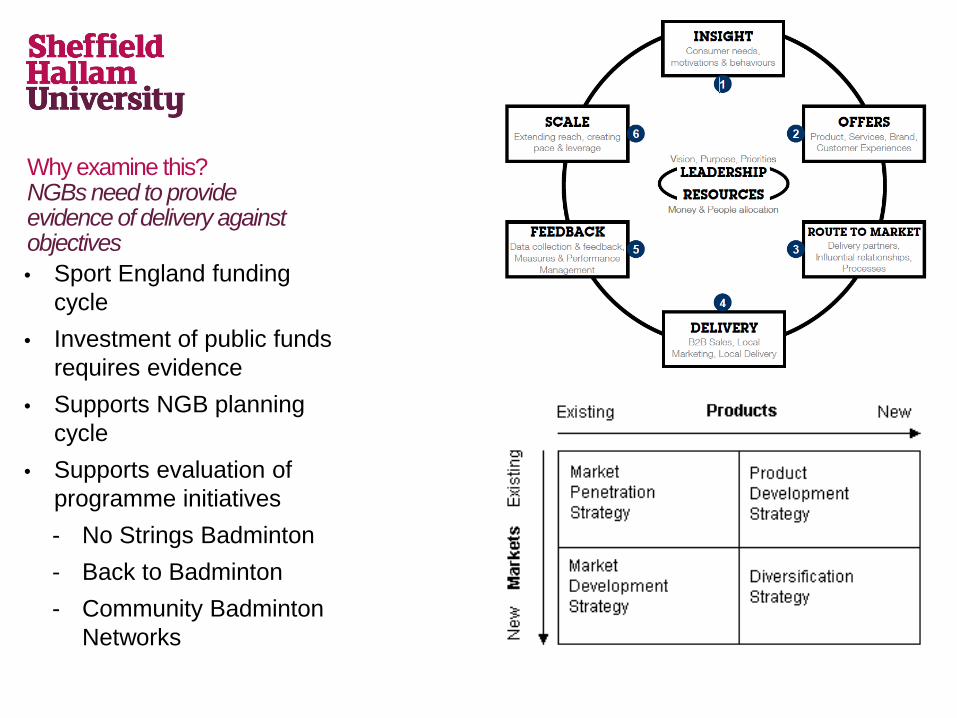
• Sport England funding cycle
• Investment of public funds requires evidence
• Supports NGB planning cycle
• Supports evaluation of programme initiatives - No Strings Badminton - Back to Badminton - Community Badminton
Networks
Why examine this? NGBs need to provide evidence of delivery against objectives

What we did: Mixed Methods Approach
•Primary Research – Online surveys of participants and stakeholders – Telephone interviews with volunteers
•Secondary Data Analysis – Badminton England Data – Active People v Taking Part
Primary Research and Secondary Data Analysis
1.28
5
1.25
9
1.03
3
0.92
5
0.71
6
0.89
7
0.94
0 0.99
2
0.89
7
0.88
8
0.4
0.5
0.6
0.7
0.8
0.9
1.0
1.1
1.2
1.3
1.4
1987 GHS 1990 GHS 1993 GHS 1996 GHS 2002 GHS 2005/06 AP 2007/08 AP 2008/09 AP 2009/10 AP 2010/11 AP
Num
ber o
f Reg
ular
Adu
lt Ba
dmin
ton
Play
ers
Mill
ions
1.28
5
1.25
9
1.03
3
0.92
5
0.71
6
0.89
7 0.94
0 0.99
2
0.89
7
0.88
8
1.18
2
1.04
9
1.13
1
1.09
1
1.26
7
0.4
0.5
0.6
0.7
0.8
0.9
1.0
1.1
1.2
1.3
1.4
1987 GHS 1990 GHS 1993 GHS 1996 GHS 2002 GHS 2005/06 AP 2007/08 AP 2008/09 AP 2009/10 AP 2010/11 AP
Num
ber o
f Reg
ular
Adu
lt Ba
dmin
ton
Play
ers
Mill
ions
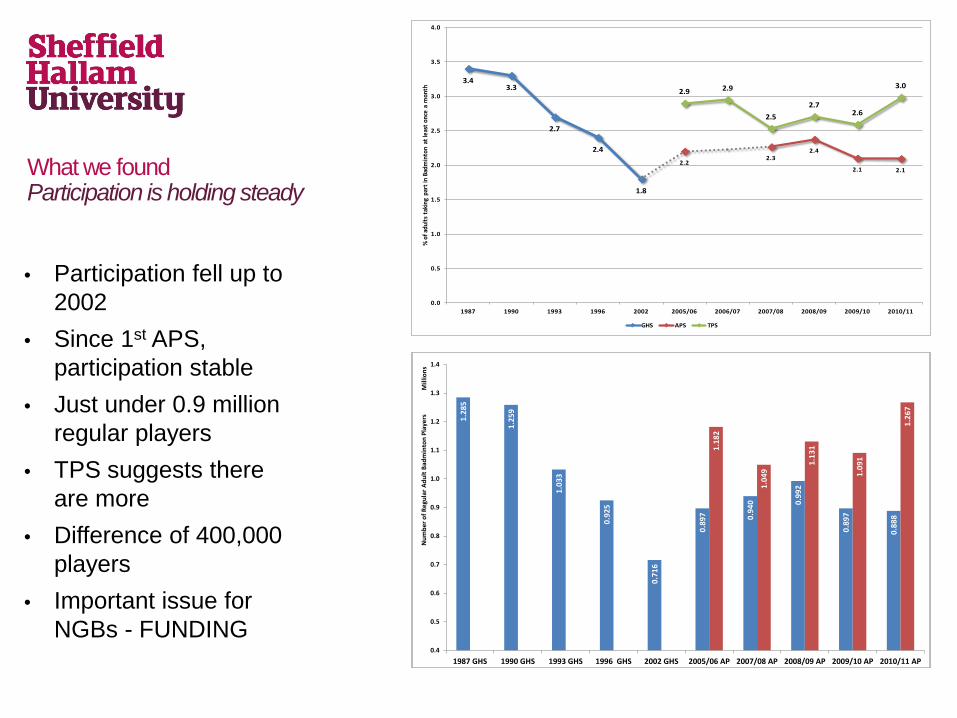
What we found Participation is holding steady
3.43.3
2.7
2.4
1.8
2.22.3
2.4
2.1 2.1
2.9 2.9
2.52.7
2.6
3.0
0.0
0.5
1.0
1.5
2.0
2.5
3.0
3.5
4.0
1987 1990 1993 1996 2002 2005/06 2006/07 2007/08 2008/09 2009/10 2010/11
% o
f adu
lts t
akin
g pa
rt in
Bad
min
ton
at le
ast o
nce
a m
onth
GHS APS TPS
• Participation fell up to 2002
• Since 1st APS, participation stable
• Just under 0.9 million regular players
• TPS suggests there are more
• Difference of 400,000 players
• Important issue for NGBs - FUNDING
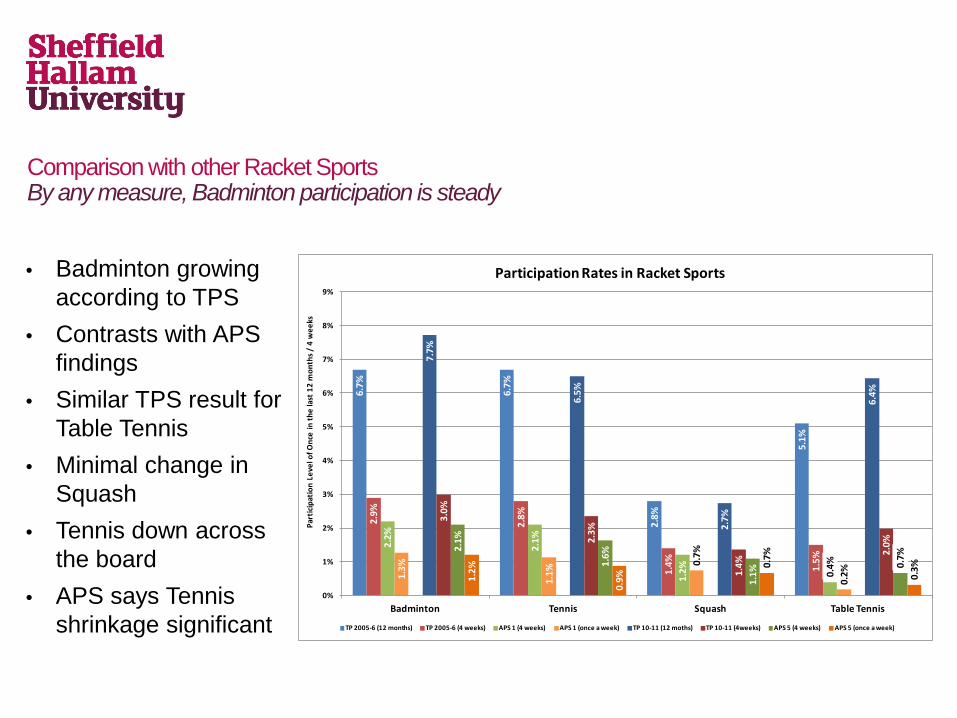
Comparison with other Racket Sports By any measure, Badminton participation is steady
• Badminton growing according to TPS
• Contrasts with APS findings
• Similar TPS result for Table Tennis
• Minimal change in Squash
• Tennis down across the board
• APS says Tennis shrinkage significant
6.7%
6.7%
2.8%
5.1%
2.9%
2.8%
1.4% 1.5%
2.2%
2.1%
1.2% 0.4%
1.3%
1.1%
0.7%
0.2%
7.7%
6.5%
2.7%
6.4%
3.0%
2.3%
1.4%
2.0%2.1%
1.6%
1.1%
0.7%
1.2%
0.9%
0.7%
0.3%
0%
1%
2%
3%
4%
5%
6%
7%
8%
9%
Badminton Tennis Squash Table Tennis
Part
icipa
tion
Leve
l of O
nce
in th
e la
st 1
2 m
onth
s / 4
wee
ks
Participation Rates in Racket Sports
TP 2005-6 (12 months) TP 2005-6 (4 weeks) APS 1 (4 weeks) APS 1 (once a week) TP 10-11 (12 moths) TP 10-11 (4weeks) APS 5 (4 weeks) APS 5 (once a week)

Further Comparison between APS and TP Variations by CSP not possible with TP data
•Sample size restricts spatial analysis
•APS better suited to GIS mapping
• Importance of measuring change to NGBs:
- Spatial variations in participation
- Casual / irregular participation
- Young people's participation
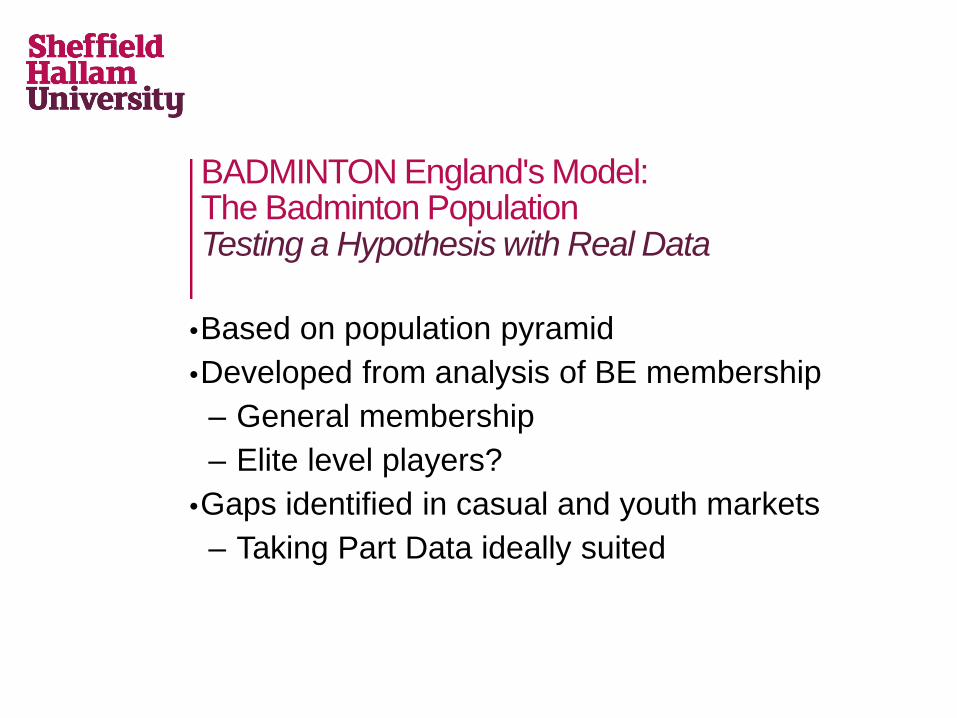
BADMINTON England's Model: The Badminton Population
•Based on population pyramid •Developed from analysis of BE membership
– General membership – Elite level players?
•Gaps identified in casual and youth markets – Taking Part Data ideally suited
Testing a Hypothesis with Real Data

400,000 300,000 200,000 100,000 0 100,000 200,000 300,000 400,000
5-10
11-15
16-19
20-24
25-29
30-34
35-39
40-44
45-49
50-54
55-59
60-64
65-69
70-74
75-79
80-84
85-89
90+
Number of Participants
Part
icip
ant A
ge
Male Annual Female Annual
400,000 300,000 200,000 100,000 0 100,000 200,000 300,000 400,000
5-10
11-15
16-19
20-24
25-29
30-34
35-39
40-44
45-49
50-54
55-59
60-64
65-69
70-74
75-79
80-84
85-89
90+
Number of Participants
Part
icip
ant A
ge
Male Monthly Male Annual Female Monthly Female Annual
400,000 300,000 200,000 100,000 0 100,000 200,000 300,000 400,000
5-10
11-15
16-19
20-24
25-29
30-34
35-39
40-44
45-49
50-54
55-59
60-64
65-69
70-74
75-79
80-84
85-89
90+
Number of Participants
Part
icip
ant A
ge
Male Weekly Male Monthly Male Annual Female Weekly Female Monthly Female Annual
400,000 300,000 200,000 100,000 0 100,000 200,000 300,000 400,000
5-10
11-15
16-19
20-24
25-29
30-34
35-39
40-44
45-49
50-54
55-59
60-64
65-69
70-74
75-79
80-84
85-89
90+
Number of Participants
Part
icip
ant A
ge
Male Organised Male Weekly Male Monthly Male Annual Female Organised Female Weekly Female Monthly Female Annual
400,000 300,000 200,000 100,000 0 100,000 200,000 300,000 400,000
5-10
11-15
16-19
20-24
25-29
30-34
35-39
40-44
45-49
50-54
55-59
60-64
65-69
70-74
75-79
80-84
85-89
90+
Number of Participants
Part
icip
ant A
ge
Male Club Member Male Organised Male Weekly Male Monthly Male Annual Female Club Member Female Organised Female Weekly Female Monthly Female Annual

BADMINTON England's Model: The Badminton Population
•Data supports BADMINTON England hypothesis •Process demonstrates value of TPS data
– Time series data – Comparison with other (survey) datasets
•NGB has developed model further •Potential application to other sports...
Testing a Hypothesis with Real Data

Thank you for your attention. Questions?
Picture courtesy of www.teamgb.com