Using Social Network Analysis Techniques to ... - nlp.uned.es
16
Using Social Network Analysis Techniques to Study Collaboration between a FLOSS Community and a Company Juan Martinez-Romo 1 , Gregorio Robles 2 , Jesus M. Gonzalez-Barahona 2 , 2 1 Dpto. Lenguajes y Sistemas Informaticos, E.T.S.I. Informatica (UNED) [email protected] 2 Grupo de Sistemas y Comunicaciones, Universidad Rey Juan Carlos {grex,jgb,mortuno}@gsyc.escet.urjc.es Abstract. Because of the sheer volume of information available in FLOSS repositories, simple analysis have to face the problems of fil- tering the relevant information. Hence, it is essential to apply method- ologies that highlight that information for a given aspect of the project. In this paper, some techniques from the social sciences have been used on data from version control systems to extract information about the development process of FLOSS projects with the aim of highlighting sev- eral processes that occur in FLOSS projects and that are difficult to ob- tain by other means. In particular, the collaboration between the FLOSS community and a company has been studied by selecting two projects as case studies. The results highlight aspects such as efficiency in the development process, release management and leadership turnover. 1 Introduction Software projects are usually the collective work of many developers. In most cases, and especially in the case of large projects, those developers are formally organised in a well defined (usually hierarchical) structure, with clear guidelines about how to interact with each other, and the procedures and channels to use. Each team of developers is assigned to certain modules of the system, and only in rare cases they work outside their territory. However, this is usually not the case in FLOSS projects, where only loose (if any) formal structures can be recognised. On the contrary, FLOSS developers usually have access to any part of the software, and even in the case of large projects they can move more or less freely from one module to another with only some restrictions imposed by the common uses in the project, and the rules on which developers themselves have agreed. A large mount of spontaneous interaction structures arise, evolve and disappear without the intervention of a central control, yielding complex networks. Among complex networks, social network analysis (SNA) appear as a method for analysing the structure and interactions of people and groups of Please use the following format when citing this chapter: for Information Processing, Volume 275; Open Source Development, Communities and Quality; Barbara Russo, Ernesto Damiani, Scott Hissam, Björn Lundell, Giancarlo Succi; (Boston: Springer), pp. 171–186. and Miguel Ortun ˜o-Perez Martinez-Romo, J., Robles, G., Gonzalez-Barahona, M. and Ortun ˜ o-Perez, M., 2008, in IFIP International Federation
Transcript of Using Social Network Analysis Techniques to ... - nlp.uned.es

Using Social Network Analysis Techniques to
Study Collaboration between a FLOSS
Community and a Company
Juan Martinez-Romo1, Gregorio Robles2, Jesus M. Gonzalez-Barahona2,2
1 Dpto. Lenguajes y Sistemas Informaticos, E.T.S.I. Informatica (UNED)[email protected]
2 Grupo de Sistemas y Comunicaciones, Universidad Rey Juan Carlos{grex,jgb,mortuno}@gsyc.escet.urjc.es
Abstract. Because of the sheer volume of information available inFLOSS repositories, simple analysis have to face the problems of fil-tering the relevant information. Hence, it is essential to apply method-ologies that highlight that information for a given aspect of the project.In this paper, some techniques from the social sciences have been usedon data from version control systems to extract information about thedevelopment process of FLOSS projects with the aim of highlighting sev-eral processes that occur in FLOSS projects and that are difficult to ob-tain by other means. In particular, the collaboration between the FLOSScommunity and a company has been studied by selecting two projectsas case studies. The results highlight aspects such as efficiency in thedevelopment process, release management and leadership turnover.
1 Introduction
Software projects are usually the collective work of many developers. In mostcases, and especially in the case of large projects, those developers are formallyorganised in a well defined (usually hierarchical) structure, with clear guidelinesabout how to interact with each other, and the procedures and channels to use.Each team of developers is assigned to certain modules of the system, and onlyin rare cases they work outside their territory. However, this is usually notthe case in FLOSS projects, where only loose (if any) formal structures can berecognised. On the contrary, FLOSS developers usually have access to any partof the software, and even in the case of large projects they can move more orless freely from one module to another with only some restrictions imposed bythe common uses in the project, and the rules on which developers themselveshave agreed. A large mount of spontaneous interaction structures arise, evolveand disappear without the intervention of a central control, yielding complexnetworks.
Among complex networks, social network analysis (SNA) appear as amethod for analysing the structure and interactions of people and groups of
Please use the following format when citing this chapter:
for Information Processing, Volume 275; Open Source Development, Communities and Quality; Barbara Russo, Ernesto Damiani, Scott Hissam, Björn Lundell, Giancarlo Succi; (Boston: Springer), pp. 171–186.
and Miguel Ortuno-Perez
Martinez-Romo, J., Robles, G., Gonzalez-Barahona, M. and Ortuno-Perez, M., 2008, in IFIP International Federation

172 Juan Martinez-Romo et al.
people within extensive organisations. A vast amount of scientific works showapplications of these techniques in fields that go from the social sciences tophysics and computer networks [20, 10].
The goal of this paper is to apply classical social network concepts to dataextracted from FLOSS projects, in particular to FLOSS projects that show atight collaboration between a company and the FLOSS community. As, even inthe presence of a company, FLOSS projects have a loose management style andare based heavily on third-party contributions, social network analyses mayprovide with some insight into the underlying processes that are responsiblefor the development. In this way, we have an ad-hoc network of interpersonaldependencies that come from the interactions between the nodes that integrateit. Therefore, this work is mainly descriptive and has the purpose of showinghow the application of techniques of social networks can be useful in scopesbeyond the original ones.
The rest of this paper is organised as follows. The next section describesrelated research on this topic. Next, the methodology designed to extract datafrom source code management systems and a series of technical aspects on whichwe have based our study is presented. Afterwards, a brief historical review ofthe main events within the projects will be given and then the results are shownand discussed. A final section with some conclusions and hints about furtherresearch closes the paper.
2 Related Research
Much attention in the area of research on FLOSS projects has been focusedon the organisational structure of the projects [9, 17, 15], but little attentionto the dynamics of the group of developers. A noteworthy contribution in thissense, although not directly addressing the evolution of developer communities,is the onion model [5], which shows how developers and users are positionedin communities. This model differentiates among core developers (those whohave a high involvement in the project), codevelopers (with specific but fre-quent contributions), active users (contributing only occasionally) and passiveusers [18, 7, 13].
The onion model provides only a static picture of a project, lacking thetime dimension that is required for studying processes, among these the ones ofjoining and leaving a project. A more theoretical identification and descriptionof the roles, including also some dynamics [26], has helped to fill the gap. Ac-cording to this refinement, a core developer is supposed to go through all theoutlying roles, starting as a user, until she eventually reaches the core team.Some research has tried to measure how long this process takes for a volun-teer participant (i.e. somebody who is not hired by a company to work onthe project), obtaining that the time that passes from the first e-mails to themailing lists (considered as the first participation) to the first commit (con-sidered as the developer becoming part of the core group) is in the mean of
Using SNA Techniques to Study a FLOSS Collaboration 173
around 30 months [11]. An alternative approach has been proposed [12] afterstudying and modelling the processes of role migration for some FLOSS com-munities, focusing on end-users who become developers. This has lead to theidentification of various paths for the joining process, concluding that the or-ganisational structure of the studied projects is highly dynamic in comparisonto traditional software development organisations. The attraction of human re-sources to FLOSS projects has also been analysed [6, 24], with different modelsproposed about how developers enter new projects.
With respect to abandonment, the number of Debian developers leaving theproject has been studied [22], and how this affects its evolution (i.e. what hap-pens to software packages that become unmaintained because of the abandon-ment). The authors propose a half-life parameter, defined as the time requiredfor a certain group of contributors to fall to half of its initial population, whichis of 7.5 years for the Debian project.
3 Methodology
The methodology used in this study is based on retrieving data about theactivity of developers from the source code management repository of theproject [19, 27]. In the case of FLOSS projects, this usually means either aCVS or a Subversion repository, which is mined using CVSAnalY [23]. Thistool retrieves the information about every commit to the repository, and in-serts it into a database where it can be conveniently analysed. This informationincludes, for each commit (modification in a file in the repository): the date,the username of the developer (commiter), and the number of lines involved.
Once the information has been stored in the database, we proceed to con-struct the developer network. Each vertex represents a particular developer andtwo vertices will be linked by an edge when both they have contributed, at least,one common software artifact1. Edges may be weighted by means of a weight ofthe relationship, defined for instance, as the total number of commits performedby both developers on artifacts to which both have contributed. Therefore, arelation between two developers (vertices) exist when both have worked in thesame artifact, and a link will exist between them (edge) whether both havemade, at least, a commit in the same artifact.
3.2 Indexes
When the networks are constructed based on the previous definitions, and thedegrees and costs of relationship have been calculated for linked nodes, we
1 We will consider in this paper software artifacts at the file level, although otherscould be chosen, such as directories.
3.1 Construction of the Developers etworkN

174 Juan Martinez-Romo et al.
can apply standard SNA concepts to define a wide range of parameters of thenetwork that can help characterising the network and its nodes [21]. Beyondclassical parameters, others more sophisticated can be used to extract morespecific information. This paper makes use of these parameters, calculated bymeans of Conan [14], which are introduced next:
– Distance centrality [25]: The distance centrality of a vertex, Dc, is a mea-surement of its proximity to the rest. It is sometimes called closeness cen-trality as the higher its value the closer that vertex is (on average) to theothers. The distance centrality can be interpreted as a measurement of theinfluence of a vertex in a graph because the higher its value, the easier forthat vertex to spread information through that network. Observe that whena given vertex is far from the others, it has a low degree of relationship (i.e.a high cost of relationship) with the rest.Research has shown that employees who are central in networks learn faster,perform better and are more committed to the organisation. These employeesare also less likely to turn over. Besides, from the point of view of informationpropagation, vertices with high centrality are like hills on the plain, in thesense that any knowledge is put on them is rapidly seen by the rest andspreads easily to the rest of the organisation.
– Betweenness centrality [8, 2]: The betweenness centrality of a vertex, Bc,is a measurement of the number of shortest paths traversing that particularvertex.The betweenness centrality of a vertex can be interpreted as a measurementof the information control that it can perform on a graph, in the sense thatvertices with a high value are intermediate nodes for the communication of therest. In our context, given that we have weighted networks, multiple shortestpaths between any pair of vertices are highly improbable. The betweennesscentrality is just a measurement of the number of shortest paths traversing agiven vertex.In the SNA literature vertices with high betweenness centrality are knownto cover structural holes. That is, those vertices glue together parts of theorganisation that would be otherwise far away from each other. They receivea diverse combination of information available to no one else in the networkand have therefore a higher probability of being involved in the knowledgegeneration processes.
– Coordination degree [1, 16]: The coordination degree of a vertex, measuresthe ability of this vertex in a graph to interchange information. The coordi-nation degree of a vertex, has a great importance inside our study, since itshows the ability of a certain node to receive information of the network andcapture the activity in a project precisely.There are several manners to model this magnitude, but one of the easiestways is to consider the coordination degree to be exponentially related to thedistance between the vertices [16]. In this way, we define the coordinationdegree γij between two vertices i and j as γij = e
−ξdij , where dij is the

Using SNA Techniques to Study a FLOSS Collaboration 175
distance between the two vertices and ξ is a real positive constant, measuringthe strength of the relationship which we call the coordination strength.Thus, we can define the total coordination degree of a vertex i in a graph asthe sum of all the coordination degrees between that particular vertex andthe rest. Namely, Γi =
∑N
j=1γij , where N is the order of the graph (the total
number of vertices in that particular graph). The total coordination degreeof a vertex is a measure of the amount of information that the vertex is ableto receive belonging to that particular network.
– Centrality Eigenvector [4, 3]: Eigenvector centrality is a measure of theimportance of a node in a network. It assigns relative scores to all nodes inthe network based on the principle that connections to high-scoring nodescontribute more to the score of the node in question than equal connectionsto low-scoring nodes.Eigenvector centrality is defined as the principal eigenvector of the adja-cency matrix defining the network. The defining equation of an eigenvector isλv = Av where A is the adjacency matrix of the graph, lambda is a constant(the eigenvalue) and V is the eigenvector. The equation lends itself to theinterpretation that a node that has a high eigenvector score is one that isadjacent to nodes that are themselves high scorers.The idea is that even if a node influences just one other node, who sub-sequently influences many other nodes, then the first node in that chain ishighly influential. Hence, the eigenvector centrality may give good adviceabout leadership in the project under study.
4 Case studies: Evolution and Mono
We have selected two FLOSS projects in order to apply the social network anal-ysis techniques on them and to show what kind of information we can extractwith such a type of analysis. In both projects, there is a high involvement of acompany (Ximian) that has assigned several employees to the development ofthe project and there is a surrounding FLOSS community whose contributionsare always welcome.
4.1 Evolution
Evolution is the official personal information manager and work group informa-tion management tool for GNOME. It combines e-mail, calendar, address book,and task list management functions.
The origin of the project goes back to 1998, when it was started by someGNOME volunteers. But it is not until a company called Helix Code identifiedit as a strategic project that it did not win in importance. In October 1999,Helix Code became Ximian Inc. due to trademark problems. Evolution, then,was mainly developed by Ximian employees although in strong collaborationwith the GNOME community for several years. Finally, Ximian was acquired

176 Juan Martinez-Romo et al.
by Novell in September 2004 and the maintenance of the then-mature Evolutiontool was “outsourced” to Novell employees in India. Since then, contributionsby the GNOME community are much lower, also in part because of the maturestate of the tool.
There are other noteworthy events in the history of Evolution summarisedin table 1.
Event Date
First commits early 1998Ximian takeover October 1999Version 0.0 July 2000Version 1.0 February 2001Takeover by Novell October 2003Death of main developer January 2004Version 2.0 October 2004Version 2.2 April 2005Version 2.4 October 2005Version 2.6 April 2006Version 2.8 October 2006
Table 1. Most important events in the history of Evolution.
4.2 Mono
Mono is a project led by Novell (formerly by Ximian) to create an ECMAstandard compliant .NET compatible set of tools, including among others aC# compiler and a Common Language Runtime. Mono can be run on Linux,FreeBSD, UNIX, Mac OS X, Solaris and Windows operating systems.
The dates of some of the most important events for Mono appear sum-marised in table 2.
5 Results
We have applied the SNA indexes to the two projects; results will be shownin this section. The samples have been taken from the first activity in eachversioning system of the projects up to January 2007. Time slots of three monthshave been taken and two developers who have made at least one commit to anyfile within the same directory will be linked. This link will be weighted by thenumber of commits that both have in that time slot in the given directory. Theinterpretation of the following figures (each figure corresponds to a differentmeasurement) is the following one: the horizontal axis is time, whereas thevertical z axis represents the result for a given measure. Therefore, each line in

Using SNA Techniques to Study a FLOSS Collaboration 177
Event Date
First commits mid-2001First version of Gtk# checked into CVS September 2001Version 0.7 September 2001Version 0.9 February 2002GTK+ 2.2 December 2002.NET Framework 1.1 April 2003Version 1.0 June 2004GNOME 2.10 March 2005GTK+ 2.8 August 2005.NET Framework 2.0 November 2005Version 1.2 November 2006
Table 2. Most important events in the history of Mono.
the figure corresponds to the evolution over time of the values of a developer.We had to filter out less active developers as graphs that include all of themare hard to read. Hence, only the top 40 developers will be displayed.
5.1 Analysis of Evolution
If we analyse figure 1(a) representing the coordination degree, four phases canbe clearly identified. An initial stage, until the takeover by Ximian, with aweak activity typical of a project in its early days. A second stage, until the1.0 release, where the work shows the highest gain in the history of the project,typical of the effort for developing a first stable version. Since then and untilthe takeover by Novell, a significant stagnation is originated due to a mainte-nance and debugging period. Finally, and because of the fact that a periodicrelease policy is introduced, peaks of work of two different dimensions can beobserved alternating in time. The highest peaks correspond to new releases,with a high number of commits corresponding to new developments, transla-tions and documentation. Meanwhile, the lows are due to stages of developmentand maintenance in which the kind of activity is different, being reflected in asmaller number of commits. It is therefore significant that time-based releasemanagement (i.e. a new version will be released every 6 months) seems to boostthe development in general terms in comparison to feature-based release man-agement (a new version will be made public when all features to be includedare finished).
In addition to the own activity of a project, the average coordination degreeof a network provides a measurement of the efficiency if we compare it withother values, such as the number of commits or the number of active developers.Figure 1(b) provides this comparison.
If we pay attention to the curves of the average coordination degree (cdmean) and the number of active developers (nodes), we can notice differentmoments at which one is over the other. The interpretation of these relative

178 Juan Martinez-Romo et al.
positions is the following: when the average coordination degree of the network isover the number of developers, the network structure is efficient. However, whenthe curve of the number of developers is over the average coordination degree,the social structure of the network is not efficient. In this way we can observe twostages with low efficiency in the network, one of them from the beginning of theproject until the takeover by Ximian, the other one from the time when periodicreleases where introduced (2004) until today. In between, since the takeover byXimian in 1999 and up to the release of version 2.0 (in 2004), the networkhas an efficient structure. This evidences that a corporate involvement in thedevelopment of a FLOSS project may result in a more efficient development,but that both the involved company and the community have to find waysto allow the other party to participate properly. The first phase, where therewas no involvement of the company, or the last one, where it seems that thecompany has chosen to move away from community have lead to an inefficientstructure.
Figure 2(a) gives the evolution over time of the betweenness centrality foreach developer. This figure is useful to identify who is the leader of the projectat any given time, but also allows to predict who could be the following leader.If we attend the leadership curve in a particular moment, we can look for thecurve just underneath. Usually, as the leader succession takes place gradually,we could figure out who is going to be the next leader of the project if thecurrent one reduces his activity substantially.
Figure 2(b) is a bar chart with the main leaders of the project for every timeperiod. The measure that has been used is the weighted betweenness (the sameas in Figure 2(a)). For the computation of this measure, we have to count theshortest paths that cross a vertex, so this measure is dependant on the numberof developers in the network. For this reason, although the maximum valuesevolve at the same pace as the number of developers grows, it is an efficientmeasurement. From these results, three different stages can be observed. Thetwo first stages in which ”unammx” and ”ettore” lead the project during severalyears, and one third stage since mid-2003 in which different leaders succeedthemselves in short periods of time (all of them less than one year).
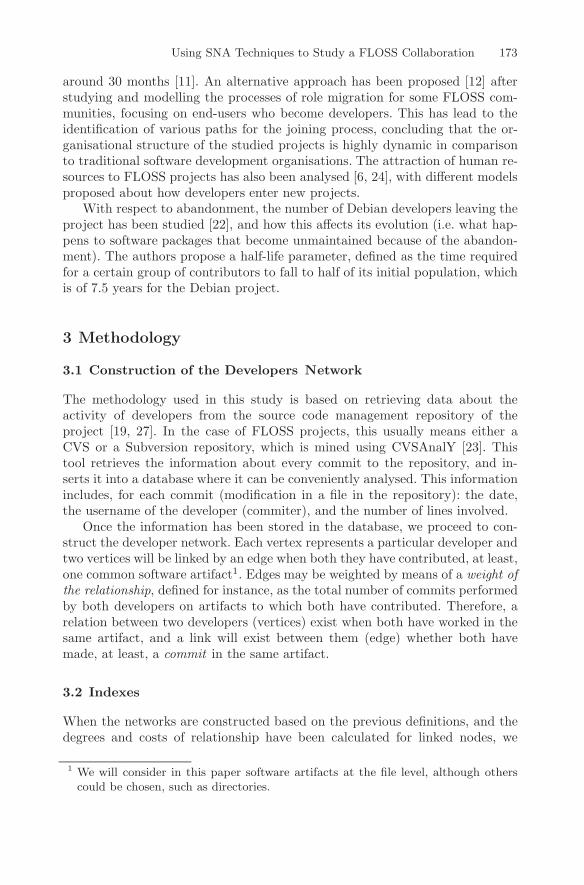
As noted before, the eigenvalue can be interpreted like a numerical assign-ment of the relevance of a node in the network. According to this interpretation,the higher the value of a given node, the higher its relevance. In figure 3(a) wecan observe the evolution over time of this measure for each developer. At ev-ery moment, we can identify the main leader(s) of the project. If we comparethe outline of the curve with the coordination degree or with the values of be-tweenness, it is possible to notice that the values of this measure do not dependon the number of developers, and therefore, the activity of the project is notreflected in the outline of the curves.
If we attend to the figure 3(b), we can find again the main leaders in everytime slot, this time using the eigenvalue. If we compare these results with theones obtained for the betweenness, we will see high similarities as expected.However, we must emphasise the differences in some time slots in which the

Using SNA Techniques to Study a FLOSS Collaboration 179
(a) Evolution of the Coordination Degree for Evolution
(b) Coordination Degree comparative for Evolution
Fig. 1. Coordination Degree values and a comparative for top 40 commiters in Evo-lution.
identified leader differs. This is because the betweenness focuses on the con-trol of the information flows whereas the eigenvalue provides a node valuationfrom the point of view of centrality. Thus, the periods where leaders remainthe main contributors to a project are smaller for the second value, because agreater effort has to be carried out to keep this privileged position. In the sameway, the number of different persons who achieve the leadership is higher usingeigenvalues. So, we can see that gaining control over information flows in theproject is an easier task than obtaining a high influence on the network.
5.2 Analysis of Mono
The activity of Mono is marked clearly by five events that can be appreciatedin Figure 4(a). The first one is the Mono 0.7 release (first unstable version)that additionally happens at the same time as the initial check-in of the GTK#

180 Juan Martinez-Romo et al.
(a) Evolution of the Weighted Betweenness for Evolution
(b) Weighted Betweenness comparative for Evolution
Fig. 2. Weighted Betweenness values and a comparative for top 40 commiters inEvolution.
module in the repository. Then a progressive increase of the activity took place,reaching its highest peak in the middle of 2003. An external fact caused anextraordinary activity: the .NET1.1 release, which Mono had to react to be ableto support this specification in its next version. This adaptation was completedin Mono 1.0 in 2004. In 2005 another noteworthy moment took place, whenthe Mono team started to adapt the .NET 2.0 specifications.
The development of Mono does not have a continuous growth, but it showsmomentary efforts to achieve the .NET functionality. This kind of developmentis reflected in its social structure as it is not efficient most of the time. As it canbe observed from Figure 4(b) while the number of developers grows smoothly,their activity has several peaks. In any case, compared to the previous casestudy, we can conclude that in this case Ximian has not achieved such a highcommunity involvement in Mono as in Evolution.
Using SNA Techniques to Study a FLOSS Collaboration 181
(a) Evolution of the Eigenvalue for Evolution
(b) Eigenvalue comparative for Evolution
Fig. 3. Eigenvalue values and a comparative for top 40 commiters in Evolution.
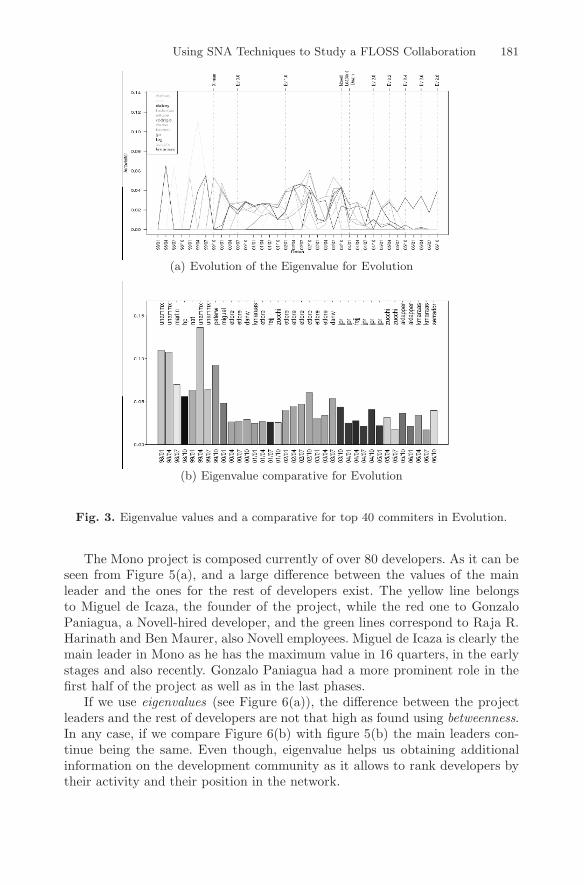
The Mono project is composed currently of over 80 developers. As it can beseen from Figure 5(a), and a large difference between the values of the mainleader and the ones for the rest of developers exist. The yellow line belongsto Miguel de Icaza, the founder of the project, while the red one to GonzaloPaniagua, a Novell-hired developer, and the green lines correspond to Raja R.Harinath and Ben Maurer, also Novell employees. Miguel de Icaza is clearly themain leader in Mono as he has the maximum value in 16 quarters, in the earlystages and also recently. Gonzalo Paniagua had a more prominent role in thefirst half of the project as well as in the last phases.
If we use eigenvalues (see Figure 6(a)), the difference between the projectleaders and the rest of developers are not that high as found using betweenness.In any case, if we compare Figure 6(b) with figure 5(b) the main leaders con-tinue being the same. Even though, eigenvalue helps us obtaining additionalinformation on the development community as it allows to rank developers bytheir activity and their position in the network.

182 Juan Martinez-Romo et al.
(a) Evolution of the Coordination Degree for Mono
(b) Coordination Degree comparative for Mono
Fig. 4. Coordination Degree values and a comparative for top 40 commiters in Mono.
In this paper a descriptive study of several social networks of FLOSS projectswhere a company and the community collaborate has been presented. We haveseen that although there is access to the interactions that developers have in thesource code management system, the amount of information is that high thatwe require additional methods to properly analyse the community and extractfacts and information from it.
Thanks to the use of social networks analysis techniques we have been ableto obtain some information on these projects, in particular, that time-basedrelease management seems to animate the development of projects or that thecollaboration between the company and the community can, if properly han-dled, drive a more efficient development. Future research should be devotedto analyse the differences between the studied projects to try to find out theaspects that drive one of the case studies (Evolution) to have at least for some
6 Conclusions and Further work

Using SNA Techniques to Study a FLOSS Collaboration 183
(a) Evolution of the Weighted Betweenness for Mono
(b) Weighted Betweenness comparative for Mono
Fig. 5. Weighted Betweenness values and a comparative for top 40 commiters inMono.
time an efficient development, while this is an exception for the other project(Mono) under study.
In addition, we have identified the most important nodes (developers) inthe project and have observed them from from several points of view (leader-ship, information control flows, etc.) and how they evolve over time. In bothcase studies, the most prominent positions where held by company employees,showing a low turnover over the years. Future work could be devoted to findout if this behaviour is similar in community-led projects.
All in all, this paper demonstrates that the techniques from the social net-works analysis field can be of great interest for the study and characterisation ofany kind of network and with particular interest in the study of how the softwareindustry can interact with the FLOSS community entering the development ofprojects.
184 Juan Martinez-Romo et al.
(a) Evolution of the Eigenvalue for Mono
(b) Eigenvalue comparative for Mono
Fig. 6. Eigenvalue values and a comparative for top 40 commiters in Mono.
7 Acknowledgements
This work has been funded in part by the European Commission, underthe QUALIPSO (FP6-IST-034763), FLOSSMETRICS (FP6-IST-5-033547) andQUALOSS (FP6-IST-5-033547) projects, and by the Spanish CICyT, projectSobreSalto (TIN2007-66172).
We would like to thank the QualiPSo Activity 6 partners for comments andsuggestions on this research.
References
1. J. A. Almendral, L. Lopez, and M. A. F. Sanjuan. Information flow in general-ized hierarchical networks. Physica A Statistical Mechanics and its Applications,324:424–429, June 2003.

Using SNA Techniques to Study a FLOSS Collaboration 185
2. Jac M. Anthonisse. The rush in a directed graph. Technical report, StichtingMathemastisch Centrum, Amsterdam, The Netherlands, 1971.
3. Phillip Bonacich. Factoring and weighting approaches to status scores and cliqueidentification. Journal of Mathematical Sociology, 2:113–120, 1972.
4. Stephen P. Borgatti. Centrality and network flow. Social Networks, 27(1):55–71,January 2005.
5. Kevin Crowston and James Howison. The social structure of free and open sourcesoftware development. First Monday, 10(2), February 2005.
6. Jean-Michel Dalle and Paul A. David. The allocation of software developmentresources in open source production mode. Technical Report SIEPR DiscussionPaper No. 02-27, Stanford Institute for Economic Policy Research, February 2003.
7. Trung T. Dinh-Trong and James M. Bieman. The FreeBSD project: A replica-tion case study of Open Source development. IEEE Transactions on SoftwareEngineering, 31(6):481–494, June 2005.
8. Linton C. Freeman. A set of measures of centrality based on betweenness. So-ciometry 40, 35-41, 1977.
9. Daniel M. German. The GNOME project: a case study of open source, globalsoftware development. Journal of Software Process: Improvement and Practice,8(4):201–215, 2004.
10. Roger Guimera, Albert Diaz-Guilera, F. Vega-Redondo, A. Cabrales, and AlexArenas. Optimal network topologies for local search with congestion. PhysicalReview Let. 89, 248701, 2002.
11. Israel Herraiz, Gregorio Robles, Juan JosE Amor, Teofilo Romera, and JesusM. Gonzalez Barahona. The processes of joining in global distributed softwareprojects. In GSD ’06: Proceedings of the 2006 international workshop on Globalsoftware development for the practitioner, pages 27–33, New York, NY, USA, 2006.ACM Press.
12. Chris Jensen and Walter Scacchi. Modeling recruitment and role migration pro-cesses in OSSD projects. In Proceedings of 6th International Workshop on Soft-ware Process Simulation and Modeling, St. Louis, May 2005.
13. Stefan Koch and Georg Schneider. Effort, cooperation and coordination in anopen source software project: GNOME. Information Systems Journal, 12(1):27–42, 2002.
14. Luis Lopez and Juan Martinez-Romo. Conan: Generating social network analysis.http://tools.libresoft.es/conan.
15. Luis Lopez, Gregorio Robles, Jesus M. Gonzalez Barahona, and Israel Herraiz.Applying social network analysis techniques to community-driven libre softwareprojects. International Journal of Information Technology and Web Engineering,1(3):27–48, July-September 2006.
16. Luis Lopez and Miguel A. F. Sanjuan. Relation between structure and size insocial networks. Phys. Rev. E, 65(3):036107, Feb 2002.
17. Gregory Madey, Vincent Freeh, and Renee Tynan. Modeling the Free/OpenSource software community: A quantitative investigation. In Stefan Koch andStefan Koch, editors, Free/Open Source Software Development, pages 203–221.Idea Group Publishing, Hershey, Pennsylvania, USA, 2004.
18. Audris Mockus, Roy T. Fielding, and James D. Herbsleb. Two case studies ofOpen Source software development: Apache and Mozilla. ACM Transactions onSoftware Engineering and Methodology, 11(3):309–346, 2002.

186 Juan Martinez-Romo et al.
19. Audris Mockus and Lawrence G. Votta. Identifying reasons for software changesusing historic databases. In Proceedings of the International Conference on Soft-ware Maintenance, pages 120–130, October 2000.
20. Mark E. J. Newman. Scientific collaboration networks: I. network constructionand fundamental results. Phys. Rev. E 64, 016131, 2001.
21. Gregorio Robles. Empirical Software Engineering Research on Libre Software:Data Sources, Methodologies and Results. PhD thesis, Escuela Superior de Cien-cias Experimentales y Tecnologia, Universidad Rey Juan Carlos, 2006.
22. Gregorio Robles, Jesus M. Gonzalez-Barahona, and Martin Michlmayr. Evolutionof volunteer participation in libre software projects: evidence from Debian. InProceedings of the 1st International Conference on Open Source Systems, pages100–107, Genoa, Italy, July 2005.
23. Gregorio Robles, Stefan Koch, and Jesus M. Gonzalez-Barahona. Remote analysisand measurement of libre software systems by means of the CVSAnalY tool. InProceedings of the 2nd ICSE Workshop on Remote Analysis and Measurement ofSoftware Systems (RAMSS), pages 51–56, Edinburgh, Scotland, UK, 2004.
24. Gregorio Robles, Juan Julian Merelo, and Jesus M. Gonzalez-Barahona. Self-organized development in libre software: a model based on the stigmergy concept.In Proceedings of the 6th International Workshop on Software Process Simulationand Modeling (ProSim 2005), St.Louis, Missouri, USA, May 2005.
25. Gert Sabidussi. The centrality index of a graph. Psychometirka 31, 581-606, 1996.26. Yuwan Ye, Kumiyo Nakakoji, Yasuhiro Yamamoto, and Kouichi Kishida. The
co-evolution of systems and communities in Free and Open Source software de-velopment. In Stefan Koch and Stefan Koch, editors, Free/Open Source SoftwareDevelopment, pages 59–82. Idea Group Publishing, Hershey, Pennsylvania, USA,2004.
27. Thomas Zimmermann, Peter Weissgerber, Stephan Diehl, and Andreas Zeller.Mining version histories to guide software changes. IEEE Transactions on Soft-ware Engineering, 31(6):429–445, June 2005.