
12— Network Scheduling Techniques - Department of...
55
Page 671 12— Network Scheduling Techniques 12.0— Introduction Management is continually seeking new and better control techniques to cope with the complexities, masses of data, and tight deadlines that are characteristic of many industries and their highly competitive environments today, as well as seeking better methods for presenting technical and cost data to customers. Scheduling techniques have taken on paramount importance since World War II. The most common techniques are shown below: • Gantt or bar charts • Milestone charts • Line of balance 1 • Networks • Program Evaluation and Review Technique (PERT) • Arrow Diagram Method (ADM) [Sometimes called the Critical Path Method (CPM)] 2 • Precedence Diagram Method (PDM) • Graphical Evaluation and Review Technique (GERT) 1 Line of balance is more applicable to manufacturing operations for production line activities. However, it can be used for project management activities where a finite number of deliverables must be produced in a given time period. The reader need only refer to the multitude of texts on production management for more information on this technique. 2 The text uses the term CPM instead of ADM. The reader should understand that they are interchangeable.
Transcript of 12— Network Scheduling Techniques - Department of...

Page 671
12— Network Scheduling Techniques
12.0— Introduction
Management is continually seeking new and better control techniques to cope with the complexities, masses of data, and tight deadlines that are characteristic of many industries and their highly competitive environments today, as well as seeking better methods for presenting technical and cost data to customers.
Scheduling techniques have taken on paramount importance since World War II. The most common techniques are shown below:
• Gantt or bar charts
• Milestone charts
• Line of balance1
• Networks
• Program Evaluation and Review Technique (PERT)
• Arrow Diagram Method (ADM) [Sometimes called the Critical Path Method (CPM)]2
• Precedence Diagram Method (PDM)
• Graphical Evaluation and Review Technique (GERT)
1 Line of balance is more applicable to manufacturing operations for production line activities. However, it can be used for project management activities where a finite number of deliverables must be produced in a given time period. The reader need only refer to the multitude of texts on production management for more information on this technique.
2 The text uses the term CPM instead of ADM. The reader should understand that they are interchangeable.

Page 672
Perhaps the best known of all the relatively new techniques is the program evaluation and review technique. PERT has several distinguishing characteristics:
• It forms the basis for all planning and predicting and provides management with the ability to plan for best possible use of resources to achieve a given goal within time and cost limitations.
• It provides visibility and enables management to control ''one-of-a-kind" programs as opposed to repetitive situations.
• It helps management handle the uncertainties involved in programs by answering such questions as how time delays in certain elements influence project completion, where slack exists between elements, and what elements are crucial to meet the completion date. This provides management with a means for evaluating alternatives.
• It provides a basis for obtaining the necessary facts for decision making.
• It utilizes a so-called time network analysis as the basic method to determine manpower, material, and capital requirements as well as providing a means for checking progress.
• It provides the basic structure for reporting information.
• It reveals interdependencies of activities.
• It facilitates "what if" exercises.
• It identifies the longest path or critical paths.
• It allows us to perform scheduling risk analysis.
These advantages apply to all network scheduling techniques, not just PERT.
PERT was originally developed in 1958 and 1959 to meet the needs of the "age of massive engineering" where the techniques of Taylor and Gantt were inapplicable. The Special Projects Office of the U.S. Navy, concerned with performance trends on large military development programs, introduced PERT on its Polaris Weapon System in 1958, after the technique had been developed with the aid of the management consulting firm of Booz, Allen, and Hamilton. Since that time, PERT has spread rapidly throughout almost all industries. At about the same time the Navy was developing PERT, the DuPont Company initiated a similar technique known as the critical path method (CPM), which also has spread widely, and is particularly concentrated in the construction and process industries.
In the early 1960s, the basic requirements of PERT/time as established by the Navy were as follows:
• All of the individual tasks to complete a given program must be visualized in a manner clear enough to be put down in a network, which comprises events and activities; i.e., follow the work breakdown structure.
• Events and activities must be sequenced on the network under a highly logical set of ground rules that allow the determination of important critical and subcritical paths. Networks can have up to one hundred or more events, but not less than ten or twenty.
• Time estimates must be made for each activity of the network on a three-way basis. Optimistic, most likely, and pessimistic elapsed-time figures are estimated by the person(s) most familiar with the activity involved.

• Critical path and slack times are computed. The critical path is that sequence of activities and events whose accomplishment will require the greatest expected time.
A big advantage of PERT is the kind of planning required to create a major network. Network development and critical path analysis reveal interdependencies and problem areas that are neither obvious nor
Page 673
well defined by other planning methods. The technique therefore determines where the greatest effort should be made for a project to stay on schedule.
The second advantage of PERT is that one can determine the probability of meeting specified deadlines by development of alternative plans. If the decision maker is statistically sophisticated, he can examine the standard deviations and the probability of accomplishment data. If there exists a minimum of uncertainty, one may use the single-time approach, of course, while retaining the advantage of network analysis.
A third advantage is the ability to evaluate the effect of changes in the program. For example, PERT can evaluate the effect of a contemplated shift of resources from the less critical activities to the activities identified as probable bottlenecks. Other resources and performance trade-offs may also be evaluated. PERT can also evaluate the effect of a deviation in the actual time required for an activity from what had been predicted.
Finally, PERT allows a large amount of sophisticated data to be presented in a well-organized diagram from which both contractor and customer can make joint decisions.
PERT, unfortunately, is not without its disadvantages. The complexity of PERT adds to the implementation problems. There exist more data requirements for a PERT-organized MCCS reporting system than for most others. PERT, therefore, becomes an item that is expensive to maintain and is utilized most often on large, complex programs.
In recent years, many companies have taken a hard look at the usefulness of PERT on small projects. The literature contains many diversified approaches toward applying PERT to other than large and complex programs. The result has been the PERT/LOB procedures, which, when applied properly, can do the following job:
• Cut project costs and reduce time scale
• Coordinate and expedite planning
• Eliminate idle time
• Provide better scheduling and control of subcontractor activities
• Develop better troubleshooting procedures
• Cut the time required for routine decisions, but allow more time for decision making
Even with these advantages, many companies should ask themselves whether they actually need PERT. Incorporation of PERT may not be easy, even if canned software packages are available. One of the biggest problems with incorporating PERT occurred in the 1960s when the Department of Defense requested that DoD customers adopt PERT/cost for relating cost and schedules. This resulted in the expenditure of considerable cost and effort on behalf of the contractor to overcome the numerous cost-accounting problems. Many contractors eventually went to two sets of books; one set was for program control (which was in compliance with standard company cost control procedures), and a second set was created for customer reporting. Therefore, before accepting a PERT system, management must perform a trade-off study to determine if the results are worth the cost.
The criticism that most people discover when using PERT includes:
• Time and labor intensive effort is required.
TEAMFLY
Team-Fly®

• Upper-level management decision-making ability is reduced.
• There exists a lack of functional ownership in estimates.
• There exists a lack of historical data for time–cost estimates.
• The assumption of unlimited resources may be inappropriate.
• There may exist the need for too much detail.

Page 674
An in-depth study of PERT would require a course or two by itself. The intent of this chapter is to familiarize the reader with the terminology, capability, and applications of networks.
12.1— Network Fundamentals
The major discrepancy with Gantt, milestone, or bubble charts is the inability to show the interdependencies between events and activities. These interdependencies must be identified so that a master plan can be developed that provides an up-to-date picture of operations at all times and is easily understood by all.
Interdependencies are shown through the construction of networks. Network analysis can provide valuable information for planning, integration of plans, time studies, scheduling, and resource management. The primary purpose of network planning is to eliminate the need for crisis management by providing a pictorial representation of the total program. The following management information can be obtained from such a representation:
• Interdependencies of activities
• Project completion time
• Impact of late starts
• Impact of early starts
• Trade-offs between resources and time
• "What if" exercises
• Cost of a crash program
• Slippages in planning/performance
• Evaluation of performance
Networks are composed of events and activities. An event is defined as the starting or ending point for a group of activities, and an activity is the work required

Figure 12–1. Standard PERT nomenclature.
Page 675
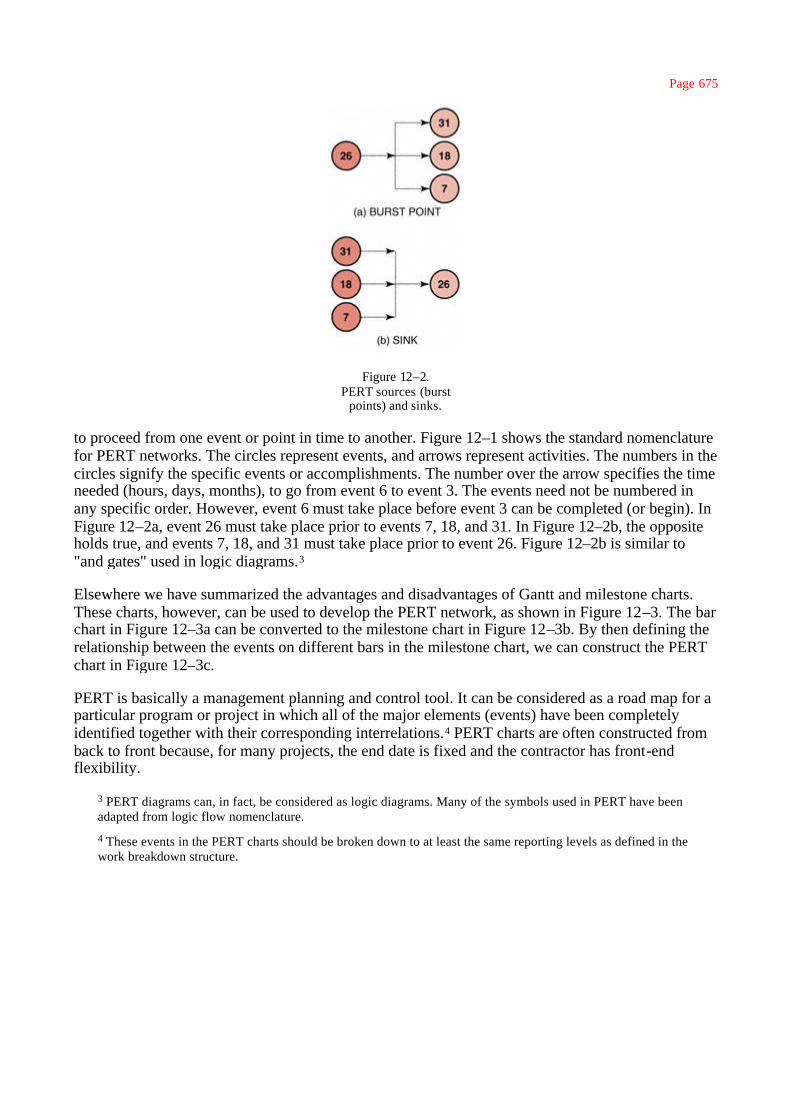
Figure 12–2. PERT sources (burst
points) and sinks.
to proceed from one event or point in time to another. Figure 12–1 shows the standard nomenclature for PERT networks. The circles represent events, and arrows represent activities. The numbers in the circles signify the specific events or accomplishments. The number over the arrow specifies the time needed (hours, days, months), to go from event 6 to event 3. The events need not be numbered in any specific order. However, event 6 must take place before event 3 can be completed (or begin). In Figure 12–2a, event 26 must take place prior to events 7, 18, and 31. In Figure 12–2b, the opposite holds true, and events 7, 18, and 31 must take place prior to event 26. Figure 12–2b is similar to "and gates" used in logic diagrams.3
Elsewhere we have summarized the advantages and disadvantages of Gantt and milestone charts. These charts, however, can be used to develop the PERT network, as shown in Figure 12–3. The bar chart in Figure 12–3a can be converted to the milestone chart in Figure 12–3b. By then defining the relationship between the events on different bars in the milestone chart, we can construct the PERT chart in Figure 12–3c.
PERT is basically a management planning and control tool. It can be considered as a road map for a particular program or project in which all of the major elements (events) have been completely identified together with their corresponding interrelations.4 PERT charts are often constructed from back to front because, for many projects, the end date is fixed and the contractor has front-end flexibility.
3 PERT diagrams can, in fact, be considered as logic diagrams. Many of the symbols used in PERT have been adapted from logic flow nomenclature.
4 These events in the PERT charts should be broken down to at least the same reporting levels as defined in the work breakdown structure.

Page 676
Figure 12–3. Conversion from bar chart to PERT chart.
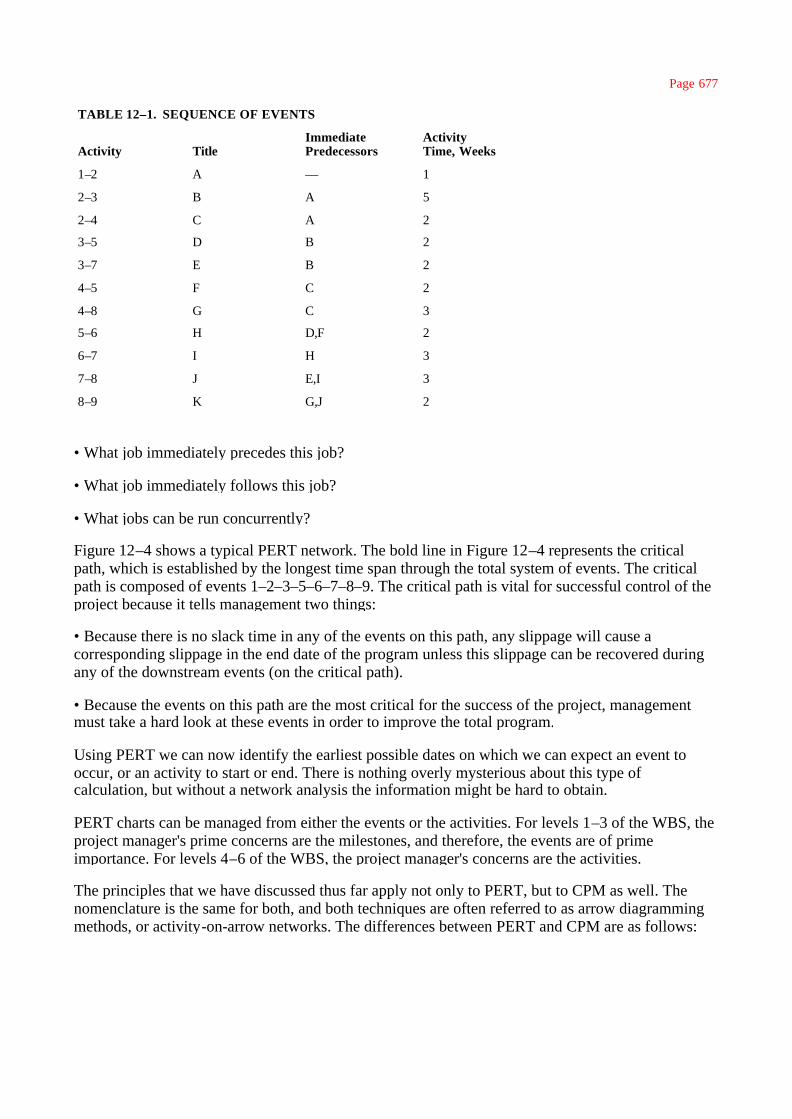
One of the purposes of constructing the PERT chart is to determine how much time is needed to complete the project. PERT, therefore, uses time as a common denominator to analyze those elements that directly influence the success of the project, namely, time, cost, and performance. The construction of the network requires two inputs. First, a selection must be made as to whether the events represent the start or the completion of an activity. Event completions are generally preferred. The next step is to define the sequence of events, as shown in Table 12–1, which relates each event to its immediate predecessor. Large projects can easily be converted into PERT networks once the

following questions are answered:
Page 677
TABLE 12–1. SEQUENCE OF EVENTS
Activity TitleImmediate Predecessors
Activity Time, Weeks
1–2 A — 1
2–3 B A 5
2–4 C A 2
3–5 D B 2
3–7 E B 2
4–5 F C 2
4–8 G C 3
5–6 H D,F 2
6–7 I H 3
7–8 J E,I 3
8–9 K G,J 2
• What job immediately precedes this job?
• What job immediately follows this job?
• What jobs can be run concurrently?
Figure 12–4 shows a typical PERT network. The bold line in Figure 12–4 represents the critical path, which is established by the longest time span through the total system of events. The critical path is composed of events 1–2–3–5–6–7–8–9. The critical path is vital for successful control of the project because it tells management two things:
• Because there is no slack time in any of the events on this path, any slippage will cause a corresponding slippage in the end date of the program unless this slippage can be recovered during any of the downstream events (on the critical path).
• Because the events on this path are the most critical for the success of the project, management must take a hard look at these events in order to improve the total program.
Using PERT we can now identify the earliest possible dates on which we can expect an event to occur, or an activity to start or end. There is nothing overly mysterious about this type of calculation, but without a network analysis the information might be hard to obtain.
PERT charts can be managed from either the events or the activities. For levels 1–3 of the WBS, the project manager's prime concerns are the milestones, and therefore, the events are of prime importance. For levels 4–6 of the WBS, the project manager's concerns are the activities.
The principles that we have discussed thus far apply not only to PERT, but to CPM as well. The nomenclature is the same for both, and both techniques are often referred to as arrow diagramming methods, or activity-on-arrow networks. The differences between PERT and CPM are as follows:

Page 678
• PERT uses three time estimates (optimistic, most likely, and pessimistic as shown in Section 12.7). From these estimates, an expected time can be derived. CPM uses one time estimate that represents the normal time (i.e., better estimate accuracy with CPM).
• PERT is probabilistic in nature, based on a beta distribution for each activity time and a normal distribution for expected time duration (see Section 12.7). This allows us to calculate the "risk" in completing a project. CPM is based on a single time estimate and is deterministic in nature.
• Both PERT and CPM permit the use of dummy activities in order to develop the logic.
• PERT is used for R&D projects where the risks in calculating time durations have a high variability. CPM is used for construction projects that are resource dependent and based on accurate time estimates.
• PERT is used on those projects, such as R&D, where percent complete is almost impossible to determine except at completed milestones. CPM is used for those projects, such as construction, where percent complete can be determined with reasonable accuracy and customer billing can be accomplished based on percent complete.
Figure 12–4. Simplified PERT network.

Page 679
12.2— Graphical Evaluation and Review Technique (GERT)
Graphical evaluation and review techniques are similar to PERT but have the distinct advantages of allowing for looping, branching, and multiple project end results. With PERT one cannot easily show that if a test fails, we may have to repeat the test several more times. With PERT, we cannot show that, based upon the results of a test, we can select one of several different branches to continue the project. These problems are easily overcome using GERT.
12.3— Dependencies
There are three basic types of interrelationships or dependencies:
• Mandatory dependencies (i.e., hard logic): These are dependencies that cannot change, such as erecting the walls of a house before putting up the roof.
• Discretionary dependencies (i.e., soft logic): These are dependencies that may be at the discretion of the project manager or may simply change from project to project. As an example, one does not need to complete the entire bill of materials prior to beginning procurement.
• External dependencies: These are dependencies that may be beyond the control of the project manager such as having contractors sit on your critical path.
Sometimes, it is impossible to draw network dependencies without including dummy activities. Dummy activities are artificial activities, represented by a dotted line, and do not consume resources or require time. They are added into the network simply to complete the logic.
In Figure 12–5, the dummy activity is required to show that D is preceded by A and B.
Figure 12–5. Dummy activity.

Page 680
12.4— Slack Time
Since there exists only one path through the network that is the longest, the other paths must be either equal in length to or shorter than that path. Therefore, there must exist events and activities that can be completed before the time when they are actually needed. The time differential between the scheduled completion date and the required date to meet critical path is referred to as the slack time. In Figure 12–4, event 4 is not on the crucial path. To go from event 2 to event 5 on the critical path requires seven weeks taking the route 2–3–5. If route 2–4–5 is taken, only four weeks are required. Therefore, event 4, which requires two weeks for completion, should begin anywhere from zero to three weeks after event 2 is complete. During these three weeks, management might find another use for the resources of people, money, equipment, and facilities required to complete event 4.
The critical path is vital for resource scheduling and allocation because the project manager, with coordination from the functional manager, can reschedule those events not on the critical path for accomplishment during other time periods when maximum utilization of resources can be achieved, provided that the critical path time is not extended. This type of rescheduling through the use of slack times provides for a better balance of resources throughout the company, and may possibly reduce project costs by eliminating idle or waiting time.
Slack can be defined as the difference between the latest allowable date and the earliest expected data based on the nomenclature below:
TE = the earliest time (date) on which an event can be expected to take place
TL = the latest date on which an event can take place without extending the completion date of the project
Slack time = TL – TE
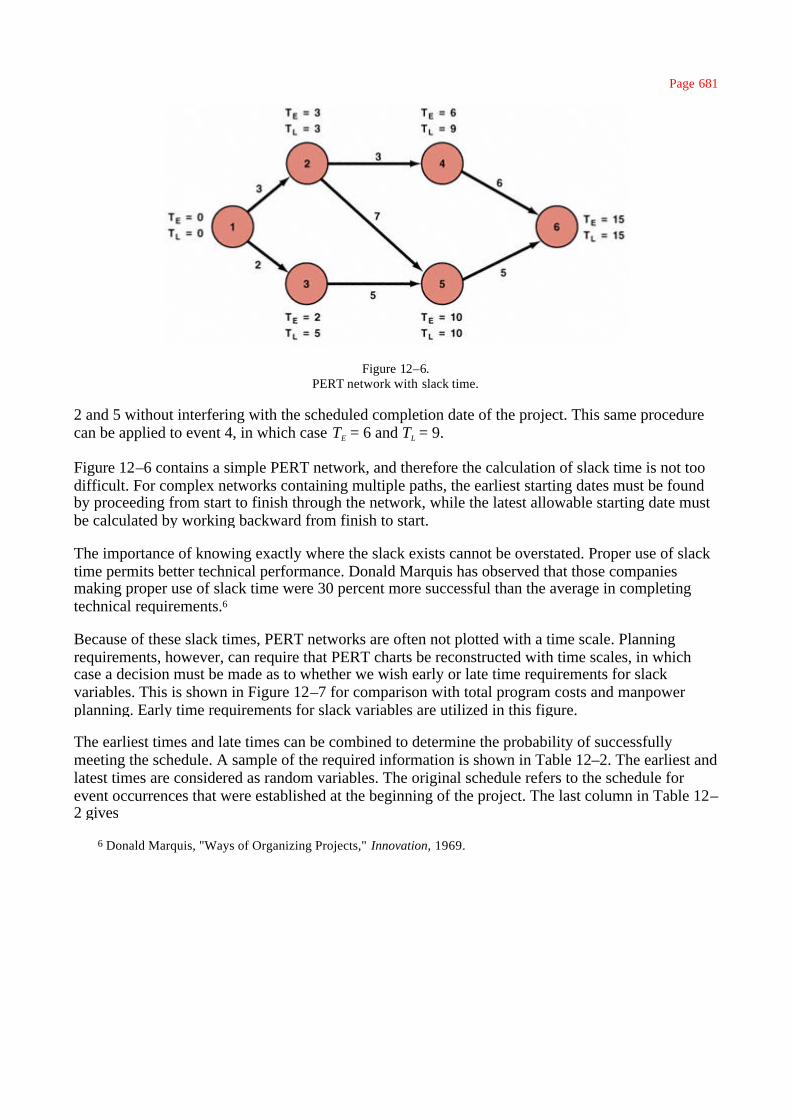
The calculation for slack time is performed for each event in the network, as shown in Figure 12–6, by identifying the earliest expected date and the latest starting date. For event 1, TL – TE = 0. Event 1 serves as the reference point for the network and could just as easily have been defined as a calendar date. As before, the critical path is represented as a bold line. The events on the critical path have no slack (i.e., TL = TE) and provide the boundaries for the noncritical path events.5 Since event 2 is critical, TL = TE × 3 + 7 = 10 for event 5. Event 6 terminates the critical path with a completion time of fifteen weeks.
The earliest time for event 3, which is not on the critical path, would be two weeks (TE = 0 + 2 = 2), assuming that it started as early as possible. The latest allowable date is obtained by subtracting the time required to complete the activity from events 3 to 5 from the latest starting date of event 5. Therefore, TL (for event 3) = 10 – 5 = 5 weeks. Event 3 can now occur anywhere between weeks
5 There are special situations where the critical path may include some slacks. These cases are not considered here.
TEAMFLY
Team-Fly®
Page 681
Figure 12–6. PERT network with slack time.
2 and 5 without interfering with the scheduled completion date of the project. This same procedure can be applied to event 4, in which case TE = 6 and TL = 9.
Figure 12–6 contains a simple PERT network, and therefore the calculation of slack time is not too difficult. For complex networks containing multiple paths, the earliest starting dates must be found by proceeding from start to finish through the network, while the latest allowable starting date must be calculated by working backward from finish to start.
The importance of knowing exactly where the slack exists cannot be overstated. Proper use of slack time permits better technical performance. Donald Marquis has observed that those companies making proper use of slack time were 30 percent more successful than the average in completing technical requirements.6
Because of these slack times, PERT networks are often not plotted with a time scale. Planning requirements, however, can require that PERT charts be reconstructed with time scales, in which case a decision must be made as to whether we wish early or late time requirements for slack variables. This is shown in Figure 12–7 for comparison with total program costs and manpower planning. Early time requirements for slack variables are utilized in this figure.
The earliest times and late times can be combined to determine the probability of successfully meeting the schedule. A sample of the required information is shown in Table 12–2. The earliest and latest times are considered as random variables. The original schedule refers to the schedule for event occurrences that were established at the beginning of the project. The last column in Table 12–2 gives
6 Donald Marquis, "Ways of Organizing Projects," Innovation, 1969.

Page 682
Figure 12–7. Comparison models for a time-phase PERT chart.
the probability that the earliest time will not be greater than the original schedule time for this event. The exact method for determining this probability, as well as the variances, is described in Section 12.5.
In the example shown in Figure 12–6, the earliest and latest times were calculated for each event. Some people prefer to calculate the earliest and latest times for each activity instead. Also, the earliest and latest times were identified simply as the time or date when an event can be expected to take place. To make full use of the capabilities of PERT/CPM, we could identify four values:
• The earliest time when an activity can start (ES)

• The earliest time when an activity can finish (EF)
• The latest time when an activity can start (LS)
• The latest time when an activity can finish (LF)

TABLE 12–2. PERT CONTROL OUTPUT INFORMATION
Event Number
Earliest Time Latest Time Original ScheduleExpected Variance Expected Variance Slack

Page 684
Figure 12–8 shows the earliest and latest times identified on the activity.
To calculate the earliest starting times, we must make a forward pass through the network (i.e., left to right). The earliest starting time of a successor activity is the latest of the earliest finish dates of the predecessors. The latest starting time is the total of the earliest starting time and the activity duration.
To calculate the finishing times, we must make a backward pass through the network by calculating the latest finish time. Since the activity time is known, the latest starting time can be calculated by subtracting the activity time from the latest finishing time. The latest finishing time for an activity entering a node is the earliest finishing time of the activities exiting the node. Figure 12–9 shows the earliest and latest starting and finishing times for a typical network.
The identification of slack time can function as an early warning system for the project manager. As an example, if the total slack time available begins to decrease from one reporting period to the next, that could indicate that work is taking longer than anticipated or that more highly skilled labor is needed. A new critical path could be forming.
Looking at the earliest and latest start and finish times can identify slack. As an example, look at the two situations below:
In Situation a, the slack is easily identified as four work units, where the work units can be expressed in hours, days, weeks, or even months. In Situation b, the slack is negative five units of work. This is referred to as negative slack or negative float.
What can cause the slack to be negative? Look at Figure 12–10. When performing a forward pass through a network, we work from left to right beginning at the customer's starting milestone (position 1). The backward pass, however, begins at the customer's end date milestone (position 2), not (as is often taught in the classroom) where the forward pass ends. If the forward pass ends at position 3, which is before the customer's end date, it is possible to have slack on the crit-
Figure 12–8. Slack identification.

Page 685
Figure 12–9. A typical PERT chart with slack times.
ical path. This slack is often called reserve time and may be added to other activities or filled with activities such as report writing so that the forward pass will extend to the customer's completion date.
Negative slack usually occurs when the forward pass extends beyond the customer's end date, as shown by position 4 in the figure. However, the backward pass is still measured from the customer's completion date, thus creating negative slack. This is most likely to result when:
Figure 12–10. Slack time.

Page 686
• The original plan was highly optimistic, but unrealistic
• The customer's end date was unrealistic
• One or more activities slipped during project execution
• The assigned resources did not possess the correct skill levels
• The required resources would not be available until a later date
In any event, negative slack is an early warning indicator that corrective action is needed to maintain the customer's end date.
12.5— Network Replanning
Once constructed, the PERT/CPM charts provide the framework from which detailed planning can be initiated and costs can be controlled and tracked. Many iterations, however, are normally made during the planning phase before the PERT/CPM chart is finished. Figure 12–11 shows this iteration process. The slack times form the basis from which additional iterations, or network replanning, can be performed. Network replanning is performed either at the conception of the program in order to reduce the length of the critical path, or during the program, should the unexpected occur. If all were to go according to schedule, then the original PERT/CPM chart would be unchanged for the duration of the project. But, how many programs or projects follow an exact schedule from start to finish?
Suppose that activities 1–2 and 1–3 in Figure 12–6 require manpower from the same functional unit. Upon inquiry by the project manager, the functional manager asserts that he can reduce activity 1–2 by one week if he shifts resources from activity 1–3 to activity 1–2. Should this happen, however, activity 1–3 will increase in length by one week. Reconstructing the PERT/CPM network as shown in Figure 12–12, the length of the critical path is reduced by one week, and the corresponding slack events are likewise changed.
There are two network replanning techniques based almost entirely upon resources: resource leveling and resource allocation.
• Resource leveling is an attempt to eliminate the manpower peaks and valleys by smoothing out the period-to-period resource requirements. The ideal situation is to do this without changing the end date. However, in reality, the end date moves out and additional costs are incurred.
• Resource allocation is an attempt to find the shortest possible critical path based upon the available or fixed resources. The problem with this approach is that the employees may not be qualified technically to perform on more than one activity in a network.
Unfortunately, not all PERT/CPM networks permit such easy rescheduling of resources. Project managers should make every attempt to reallocate resources so

Page 687
Figure 12–11. Iteration process for PERT schedule development.
as to reduce the critical path, provided that the slack was not intentionally planned as a safety valve.
Transferring resources from slack paths to more critical paths is only one method for reducing expected project time. Several other methods are available:
• Elimination of some parts of the project
• Addition of more resources

• Substitution of less time-consuming components or activities
• Parallelization of activities
• Shortening critical path activities
• Shortening early activities

Page 688
Figure 12–12. Network replanning of Figure 12–6.
• Shortening longest activities
• Shortening easiest activities
• Shortening activities that are least costly to speed up
• Shortening activities for which you have more resources
• Increasing the number of work hours per day
Under the ideal situation, the project start and end dates are fixed, and performance within this time scale must be completed within the guidelines described by the statement of work. Should the scope of effort have to be reduced in order to meet other requirements, the contractor incurs a serious risk in that the project may be canceled, or performance expectations may no longer be possible.
Adding resources is not always possible. If the activities requiring these added resources also call for certain expertise, then the contractor may not have qualified or experienced employees, and may avoid the risk. The contractor might still reject this idea, even if time and money were available for training new employees, because on project termination he might not have any other projects to which to assign these additional people. However, if the project is the construction of a new facility, then the labor-union pool may be large enough that additional experienced manpower can be hired.
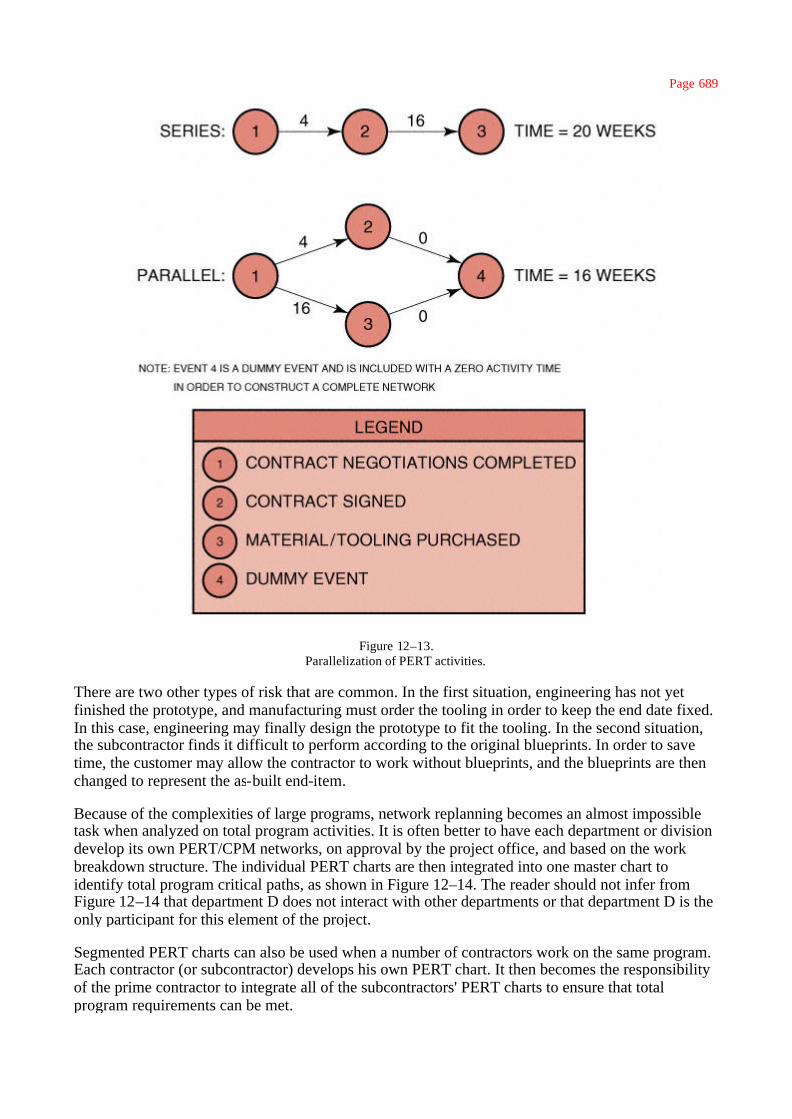
Parallelization of activities can be regarded as accepting a risk by assuming that a certain event can begin in parallel with a second event that would normally be in sequence with it. This is shown in Figure 12–13. One of the biggest headaches at the beginning of any project is the purchasing of tooling and raw materials. As shown in Figure 12–13, four weeks can be saved by sending out purchase orders after contract negotiations are completed, but before the one-month waiting period necessary to sign the contract. Here the contractor incurs a risk. Should the effort be canceled or the statement of work change prior to the signing of the contract, the customer incurs the cost of the termination liability expenses from the vendors. This risk is normally overcome by the issuance of a long-lead procurement letter immediately following contract negotiations.
TEAMFLY
Team-Fly®
Page 689
Figure 12–13. Parallelization of PERT activities.
There are two other types of risk that are common. In the first situation, engineering has not yet finished the prototype, and manufacturing must order the tooling in order to keep the end date fixed. In this case, engineering may finally design the prototype to fit the tooling. In the second situation, the subcontractor finds it difficult to perform according to the original blueprints. In order to save time, the customer may allow the contractor to work without blueprints, and the blueprints are then changed to represent the as-built end-item.
Because of the complexities of large programs, network replanning becomes an almost impossible task when analyzed on total program activities. It is often better to have each department or division develop its own PERT/CPM networks, on approval by the project office, and based on the work breakdown structure. The individual PERT charts are then integrated into one master chart to identify total program critical paths, as shown in Figure 12–14. The reader should not infer from Figure 12–14 that department D does not interact with other departments or that department D is the only participant for this element of the project.
Segmented PERT charts can also be used when a number of contractors work on the same program. Each contractor (or subcontractor) develops his own PERT chart. It then becomes the responsibility of the prime contractor to integrate all of the subcontractors' PERT charts to ensure that total program requirements can be met.

Page 690
Figure 12–14. Master PERT chart breakdown by department.
12.6— Estimating Activity Time
Determining the elapsed time between events requires that responsible functional managers evaluate the situation and submit their best estimates. The calculations for critical paths and slack times in the previous sections were based on these best estimates.
In this ideal situation, the functional manager would have at his disposal a large volume of historical data from which to make his estimates. Obviously, the more historical data available, the more reliable the estimate. Many programs, however, include events and activities that are nonrepetitive. In this case, the functional managers must submit their estimates using three possible completion assumptions:
• Most optimistic completion time. This time assumes that everything will go according to plan and with a minimal amount of difficulties. This should occur approximately 1 percent of the time.
• Most pessimistic completion time. This time assumes that everything will not go according to plan and that the maximum potential difficulties will develop. This should also occur approximately 1 percent of the time.

Page 691
• Most likely completion time. This is the time that, in the mind of the functional manager, would most often occur should this effort be reported over and over again.7
Before these three times can be combined into a single expression for expected time, two assumptions must be made. The first assumption is that the standard deviation, σ, is one-sixth of the time requirement range. This assumption stems from probability theory, where the end points of a curve are three standard deviations from the mean. The second assumption requires that the probability distribution of time required for an activity be expressible as a beta distribution.8
The expected time between events can be found from the expression:
where te = expected time, a = most optimistic time, b = most pessimistic time, and m = most likely time.
As an example, if a = 3, b = 7, and m = 5 weeks, then the expected time, te, would be 5 weeks. This value for te would then be used as the activity time between two events in the construction of a PERT chart. This method for obtaining best estimates contains a large degree of uncertainty. If we change the variable times to a = 2, b = 12, and m = 4 weeks, then te will still be 5 weeks. The latter case, however, has a much higher degree of uncertainty because of the wider spread between the optimistic and pessimistic times. Care must be taken in the evaluation of risks in the expected times.
12.7— Estimating Total Program Time
In order to calculate the probability of completing the project on time, the standard deviations of each activity must be known. This can be found from the expression:
where is the standard deviation of the expected time, te. Another useful expression is the variance, ν, which is the square of the standard deviation. The vari-
7 It is assumed that the functional manager performs all of the estimating. The reader should be aware that there are exceptions where the program or project office would do their own estimating.
8 See F. S. Hillier and G. J. Lieberman, Introduction to Operations Research (San Francisco: Holden-Day, 1967), p. 229.

Page 692
Figure 12–15. Expected time analysis for critical path events in Figure 12–5.
ance is primarily useful for comparison to the expected values. However, the standard deviation can be used just as easily, except that we must identify whether it is a one, two, or three sigma limit deviation. Figure 12–15 shows the critical path of Figure 12–6, together with the corresponding values from which the expected times were calculated, as well as the standard deviations. The total path standard deviation is calculated by the square root of the sum of the squares of the activity standard deviations using the following expression:
12.8— Total PERT/CPM Planning
Before we continue, it is necessary to discuss the methodology for preparing PERT schedules. PERT scheduling is a six-step process. Steps one and two begin with the project manager laying out a list of activities to be performed and then placing these activities in order of precedence, thus identifying the interrelationships. These charts drawn by the project manager are called either logic charts, arrow diagrams, work flow, or simply networks. The arrow diagrams will look like Figure 12–6 with two exceptions: The activity time is not identified, and neither is the critical path.
Step three is reviewing the arrow diagrams with the line managers (i.e., the true experts) in order to obtain their assurance that neither too many nor too few activities are identified, and that the interrelationships are correct.
In step four the functional manager converts the arrow diagram to a PERT chart by identifying the time duration for each activity. It should be noted here

Page 693
that the time estimates that the line managers provide are based on the assumption of unlimited resources because the calendar dates have not yet been defined.
Step five is the first iteration on the critical path. It is here that the project manager looks at the critical calendar dates in the definition of the project's requirements. If the critical path does not satisfy the calendar requirements, then the project manager must try to shorten the critical path using methods explained in Section 12.3 or by asking the line managers to take the ''fat" out of their estimates.
Step six is often the most overlooked step. Here the project manager places calendar dates on each event in the PERT chart, thus converting from planning under unlimited resources to planning with limited resources. Even though the line manager has given you a time estimate, there is no guarantee that the correct resources will be available when needed. That is why this step is crucial. If the line manager cannot commit to the calendar dates, then replanning will be necessary. Most companies that survive on competitive bidding lay out proposal schedules based on unlimited resources. After contract award, the schedules are analyzed again because the company now has limited resources. After all, how can a company bid on three contracts simultaneously and put a detailed schedule into each proposal if it is not sure how many contracts, if any, it will win? For this reason customers require that formal project plans and schedules be provided thirty to ninety days after contract award.
Finally, PERT replanning should be an ongoing function during project execution. The best project managers are those individuals who continually try to assess what can go wrong and perform perturbation analysis on the schedule. (This should be obvious because the constraints and objectives of the project can change during execution.) Primary objectives on a schedule are:
• Best time
• Least cost
• Least risk
Secondary objectives include:
• Studying alternatives
• Optimum schedules
• Effective use of resources
• Communications
• Refinement of the estimating process
• Ease of project control
• Ease of time or cost revisions
Obviously, these objectives are limited by such constraints as:
• Calendar completion
• Cash or cash flow restrictions
• Limited resources

• Management approvals

Page 694
12.9— Crash Times
In the preceding sections, no distinction was made between PERT and CPM. The basic difference between PERT and CPM lies in the ability to calculate percent complete. PERT is used in R&D or just development activities, where a percent-complete determination is almost impossible. Therefore, PERT is event oriented rather than activity oriented. In PERT, funding is normally provided for each milestone (i.e., event) achieved because incremental funding along the activity line has to be based on percent complete. CPM, on the other hand, is activity oriented because, in activities such as construction, percent complete along the activity line can be determined. CPM can be used as an arrow diagram network without PERT. The difference between the two methods lies in the environments in which each one evolved and how each one is applied. According to Archibald and Villoria:9
The environmental factors which had an important role in determining the elements of the CPM techniques were:
(a) Well-defined projects
(b) One dominant organization
(c) Relatively small uncertainties
(d) One geographical location for a project
The CPM (activity-type network) has been widely used in the process industries, in construction, and in single-project industrial activities. Common problems include no place to store early arrivals of raw materials and project delays for late arrivals.
Using strictly the CPM approach, project managers can consider the cost of speeding up, or crashing, certain phases of a project. In order to accomplish this, it is necessary to calculate a crashing cost per unit time as well as the normal expected time for each activity. CPM charts, which are closely related to PERT charts, allow visual representation of the effects of crashing. There are these requirements:
• For a CPM chart, the emphasis is on activities, not events. Therefore, the PERT chart should be redrawn with each circle representing an activity rather than an event.
• In CPM, both time and cost of each activity are considered.10
• Only those activities on the critical path are considered, starting with the activities for which the crashing cost per unit time is the lowest.
Figure 12–16 shows a CPM network with the corresponding crash time for all activities both on and off the critical path. The activities are represented by cir-
9 R. D. Archibald and R. L. Villoria, Network-Based Management Systems (PERT/CPM) (New York: John Wiley, 1967), p. 14.
10 Although PERT considers mainly time, modifications through PERT/cost analysis can be made to consider the cost factors.

Page 695
Figure 12–16. CPM network.
cles and include an activity identification number and the estimated time. The costs expressed in the figure are usually direct costs only.
To determine crashing costs we begin with the lowest weekly crashing cost, activity A, at $2,000 per week. Although activity C has a lower crashing cost, it is not on the critical path. Only critical path activities are considered for crashing. Activity A will be the first to be crashed for a maximum of two weeks at $2,000 per week. The next activity to be considered would be F at $3,000 per week for a maximum of three weeks. These crashing costs are additional expenses above the normal estimates.
A word of caution concerning the selection and order of the activities that are to crash: There is a good possibility that as each activity is crashed, a new critical path will be developed. This new path may or may not include those elements that were bypassed because they were not on the original critical path.
Returning to Figure 12–16 (and assuming that no new critical paths are developed), activities A, F, E, and B would be crashed in that order. The crashing cost would then be an increase of $37,500 from the base of $120,000 to $157,500. The corresponding time would then be reduced from twenty-three weeks to fif-

Page 696
teen weeks. This is shown in Figure 12–17 to illustrate how a trade-off between time and cost can be obtained. Also shown in Figure 12–17 is the increased cost of crashing elements not on the critical path. Crashing these elements would result in a cost increase of $7,500 without reducing the total project time. There is also the possibility that this figure will represent unrealistic conditions because sufficient resources are not or cannot be made available for the crashing period.
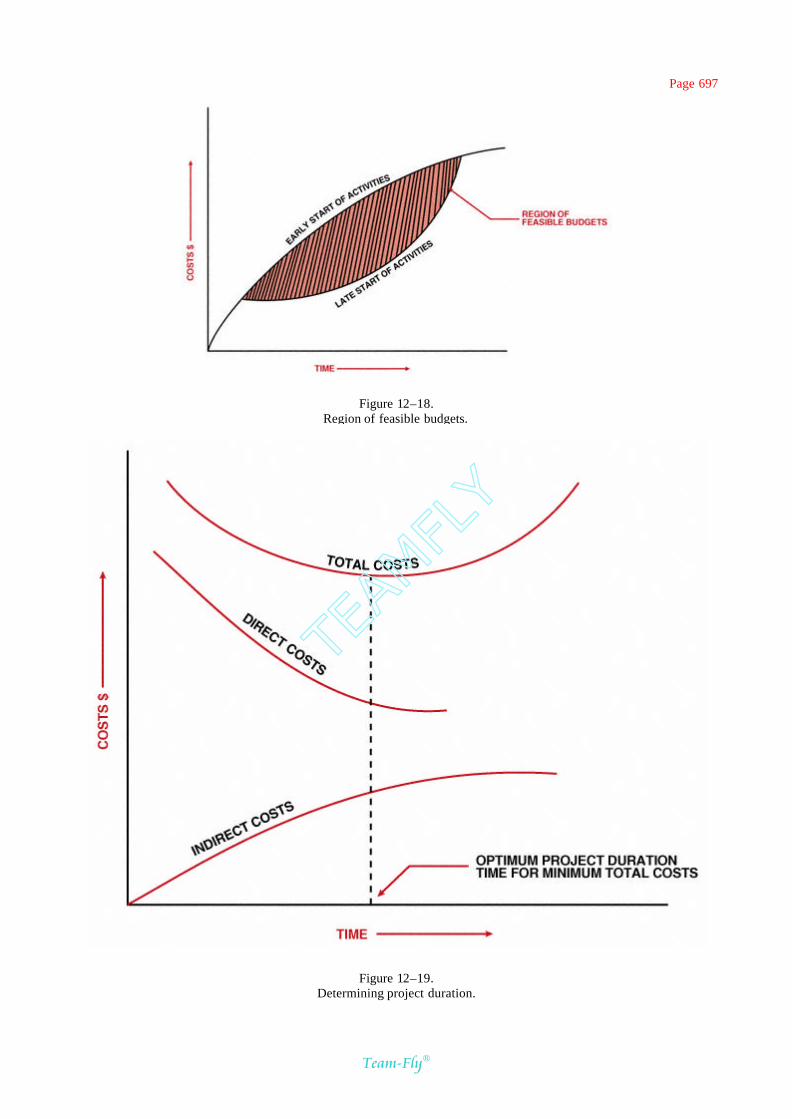
The purpose behind balancing time and cost is to avoid the useless waste of resources. If the direct and indirect costs can be accurately obtained, then a region of feasible budgets can be found, bounded by the early-start (crash) and late-start (or normal) activities. This is shown in Figure 12–18.
Since the direct and indirect costs are not necessarily expressible as linear functions, time–cost trade-off relationships are made by searching for the lowest possible total cost (i.e., direct and indirect) that likewise satisfies the region of feasible budgets. This method is shown in Figure 12–19.
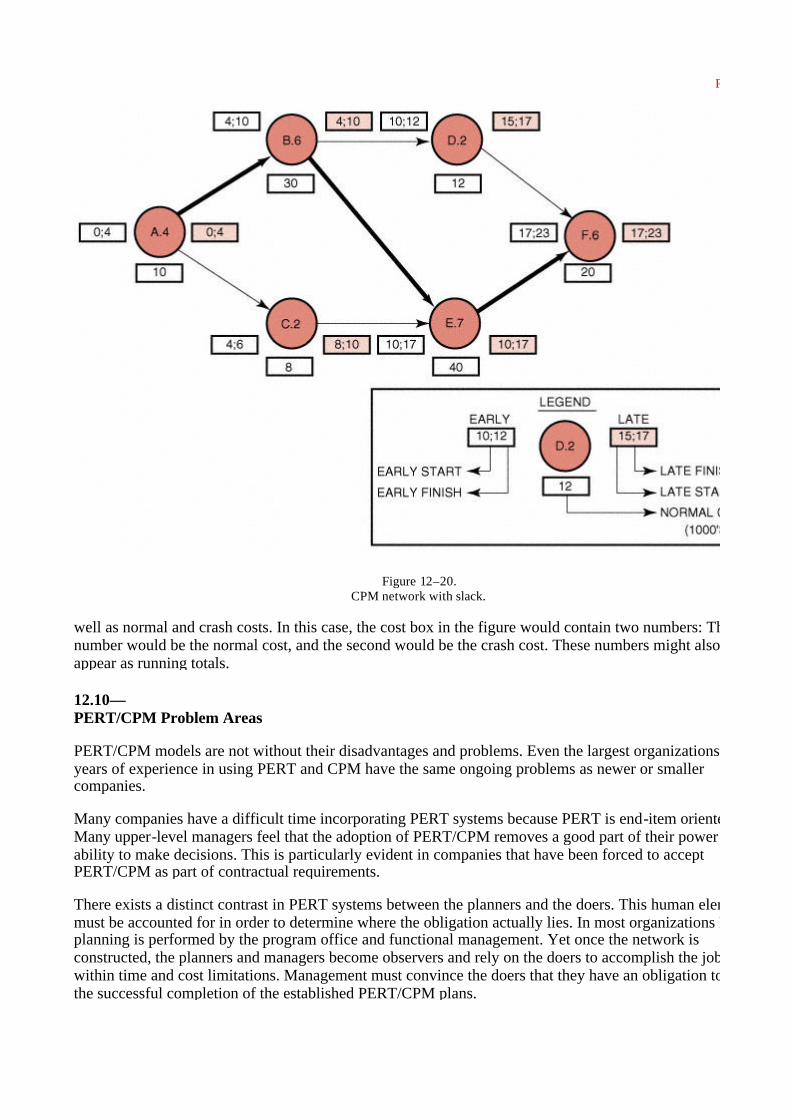
Like PERT, CPM also contains the concept of slack time, the maximum amount of time that a job may be delayed beyond its early start without delaying the project completion time. Figure 12–20 shows a typical representation of slack time using a CPM chart. In addition, the figure shows how target activity costs can be identified. Figure 12–20 can be modified to include normal and crash times as
Figure 12–17. CPM crashing costs.
Page 697
Figure 12–18. Region of feasible budgets.
Figure 12–19. Determining project duration.
TEAMFLY
Team-Fly®
Page 698
Figure 12–20. CPM network with slack.
well as normal and crash costs. In this case, the cost box in the figure would contain two numbers: The first number would be the normal cost, and the second would be the crash cost. These numbers might also appear as running totals.
12.10— PERT/CPM Problem Areas
PERT/CPM models are not without their disadvantages and problems. Even the largest organizations with years of experience in using PERT and CPM have the same ongoing problems as newer or smaller companies.
Many companies have a difficult time incorporating PERT systems because PERT is end-item oriented. Many upper-level managers feel that the adoption of PERT/CPM removes a good part of their power and ability to make decisions. This is particularly evident in companies that have been forced to accept PERT/CPM as part of contractual requirements.
There exists a distinct contrast in PERT systems between the planners and the doers. This human element must be accounted for in order to determine where the obligation actually lies. In most organizations PERT planning is performed by the program office and functional management. Yet once the network is constructed, the planners and managers become observers and rely on the doers to accomplish the job within time and cost limitations. Management must convince the doers that they have an obligation toward the successful completion of the established PERT/CPM plans.

Page 699
Unless the project is repetitive, there usually exists a lack of historical information on which to base the cost estimates of most optimistic, most pessimistic, and most likely times. Problems can also involve poor predictions for overhead costs, other indirect costs, material and labor escalation factors, and crash costs. It is also possible that each major functional division of the organization has its own method for estimating costs. Engineering, for example, may use historical data, whereas manufacturing operations may prefer learning curves. PERT works best if all organizations have the same method for predicting costs and performance.
PERT networks are based on the assumption that all activities start as soon as possible. This assumes that qualified personnel and equipment are available. Regardless of how well we plan, there almost always exist differences in performance times from what would normally be acceptable for the model selected. For the selected model, time and cost should be well-considered estimates, not a spur-of-the-moment decision.
Cost control presents a problem in that the project cost and control system may not be compatible with company fiscal planning policies. Project-oriented costs may be meshed with non-PERT-controlled jobs in order to develop the annual budget. This becomes a difficult chore for cost reporting, especially when each project may have its own method for analyzing and controlling costs.
Many people have come to expect too much of PERT-type networks. Figure 12–21 illustrates a PERT/CPM network broken down by work packages with identification of the charge numbers for each activity. Large projects may contain hundreds of charge numbers. Subdividing work packages (which are supposedly the lowest element) even further by identifying all subactivities has the advantage that direct charge numbers can be easily identified, but the time and cost for this
Figure 12–21. Using PERT for work package control.

Page 700
form of detail may be prohibitive. PERT/CPM networks are tools for program control, and managers must be careful that the original game plan of using networks to identify prime and supporting objectives is still met. Additional detail may mask this all-important purpose. Remember, networks are constructed as a means for understanding program reports. Management should not be required to read reports in order to understand PERT/CPM networks.
12.11— Alternative PERT/CPM Models
Because of the many advantages of PERT/time, numerous industries have found applications for this form of network. A partial list of these advantages includes capabilities for:
• Trade-off studies for resource control
• Providing contingency planning in the early stages of the project
• Visually tracking up-to-date performance
• Demonstrating integrated planning
• Providing visibility down through the lowest levels of the work breakdown structure
• Providing a regimented structure for control purposes to ensure compliance with the work breakdown structure and the statement of work
• Increasing functional members' ability to relate to the total program, thus providing participants with a sense of belonging
Even with these advantages, in many situations PERT/time has proved ineffective in controlling resources. In the beginning of this chapter we defined three parameters necessary for the control of resources: time, cost, and performance. With these factors in mind, companies began reconstructing PERT/time into PERT/cost and PERT/performance models.
PERT/cost is an extension of PERT/time and attempts to overcome the problems associated with the use of the most optimistic and most pessimistic time for estimating completion. PERT/cost can be regarded as a cost accounting network model based on the work breakdown structure and capable of being subdivided down to the lowest elements, or work packages. The advantages of PERT/cost are that it:
• Contains all the features of PERT/time
• Permits cost control at any WBS level
The primary reason for the development of PERT/cost was so that project managers could identify critical schedule slippages and cost overruns in time for corrective action to be taken.

Page 701
Many attempts have been made to develop effective PERT/schedule models. In almost all cases, the charts are constructed from left to right.11 An example of such current attempts is the accomplishment/cost procedure (ACP). As described by Block:12
ACP reports cost based on schedule accomplishment, rather than on the passage of time. To determine how an uncompleted task is progressing with respect to cost, ACP compares (a) cost/progress relationship budgeting with (b) the cost/progress relationship expended for the task. It utilizes data accumulated from periodic reports and from the same data base generates the following:
• The relationship between cost and scheduled performance
• The accounting relationships between cost and fiscal accounting requirements
• The prediction of corporate cash flow needs
Unfortunately, the development of PERT/schedule techniques is still in its infancy. Although their applications have been identified, many companies feel locked in with their present method of control, whether it be PERT, CPM, or some other technique.
12.12— Precedence Networks
Over the past ten years there has been an explosion in project management software packages. Small packages may sell for a few thousand dollars, whereas the price for larger packages may be $70,000. Computerized project management can provide answers to such questions as:
• How will the project be affected by limited resources?
• How will the project be affected by a change in the requirements?
• What is the cash flow for the project (and for each WBS element)?
• What is the impact of overtime?
• What additional resources are needed to meet the constraints of the project?
• How will a change in the priority of a certain WBS element affect the total project?
11 See Gary E. Whitehouse, "Project Management Techniques," Industrial Engineering, March 1973, pp. 24–29, for a description of the technique.
12 Ellery B. Block, "Accomplishment/Cost: Better Project Control," Harvard Business Review, May–June 1971, pp. 110–124. Copyright © 1971 by the President and Fellows of Harvard College; all rights reserved.

Page 702
The more sophisticated packages can provide answers to schedule and cost based on:
• Adverse weather conditions
• Weekend activities
• Unleveled manpower requirements
• Variable crew size
• Splitting of activities
• Assignment of unused resources
Regardless of the sophistication of computer systems, printers and plotters prefer to draw straight lines rather than circles. Most software systems today use precedence networks, as shown in Figure 12–22, which attempt to show interrelationships on bar charts. In Figure 12–22, task 1 and task 2 are related because of the solid line between them. Task 3 and task 4 can begin when task 2 is half finished. (This cannot be shown easily on PERT without splitting activities.) The dotted lines indicate slack. The critical path can be identified either by putting an asterisk (*) beside the critical elements, by making the critical connections in a different-colored ink, or by making the critical path a boldface type.
The more sophisticated software packages display precedence networks in the format shown in Figure 12–23. In each of these figures, work is accomplished during the activity. This is sometimes referred to as the activity-on-node method. The arrow represents the relationship or constraint between activities.
Figure 12–22. Precedence network.

Page 703
Figure 12–23. Typical precedence relationships.
Figure 12–24. Computerized information flow.

Page 704
Figure 12–25. Comparison of networks.
Figure 12–23A illustrates a finish-to-start constraint. In this figure, activity 2 can start no earlier than the completion of activity 1. Figure 12-23B illustrates a start-to-start constraint. Activity 2 cannot start prior to the start of activity 1. Figure 12-23C illustrates a finish-to-finish constraint. In this figure, activity 2 cannot finish until activity 1 finishes. Figure 12-23D illustrates a percent-complete constraint. In this figure, the last 20 percent of activity 2 cannot be started until 50 percent of activity 1 has been completed.
Figure 12–24 shows the typical information that appears in each of the activity boxes shown in Figure 12–23. The box identified as ''responsibility cost center" could also have been identified as the name, initials, or badge number of the person responsible for this activity.
Figure 12–25 shows the comparison of three of the different network techniques.
12.13—Lag
The time period between the early start or finish of one activity and the early start or finish of another activity in the sequential chain is called lag. Lag is most commonly used in conjunction with precedence networks. Figure 12–26 shows five different ways to identify lag on the constraints.
12.14— Understanding Project Management Software
Efficient project management requires more than good planning, it requires that relevant information be obtained, analyzed, and reviewed in a timely manner. This can provide early warning of pending problems and impact assessments on other activities, which can lead to alternate plans and management actions. Today, project managers have a large array of software available to help in the difficult task of

Page 705
Figure 12–26. Precedence charts with lag.
tracking and controlling projects. While it is clear that even the most sophisticated software package is not a substitute for competent project leadership— and by itself does not identify or correct any task-related problems— it can be a terrific aid to the project manager in tracking the many interrelated variables and tasks that come into play with a modern project. Specific examples of these capabilities are:

Page 706
• Project data summary: expenditure, timing, and activity data
• Project management and business graphics capabilities
• Data management and reporting capabilities
• Critical path analysis
• Customized, as well as standard, reporting formats
• Multiproject tracking
• Subnetworking
• Impact analysis (what if . . .)
• Early-warning systems
• On-line analysis of recovering alternatives
• Graphical presentation of cost, time, and activity data
• Resource planning and analysis
• Cost analysis, variance analysis
• Multiple calendars
• Resource leveling
Further, many of the more sophisticated software packages that, until the mid-1980s, needed mainframe computer support, are now available for personal computers. This offers many advantages ranging from true user interaction, to ready access and availability, to simpler and more user-friendly interfaces, to often considerably lower software cost. Yet the biggest impact might be to smaller businesses and projects that in the past could not afford the luxury of mainframe computers, but now have access to computer-aided project management systems.
12.15— Software Features Offered
Project management software capabilities and features vary a great deal among the many products available. However, the variation is more in the depth and sophistication of the feature, such as its storage, display, analysis, interoperability, and user friendliness, rather than in the type of features offered, which are very similar for most software programs. Specifically, the following features are being offered by most project management software packages:
1. Planning, tracking, and monitoring. These most common features provide for planning and tracking of the projects' tasks, resources, and costs. The data format for describing the project to the computer is usually based on standard network typologies such as the Critical Path Method (CPM), Program Evaluation and Review Technique (PERT), or Precedence Diagram Method (PDM). Task elements, with their estimated start and finish times, their assigned resources, and actual cost data, can be entered

Page 707
and updated as the project progresses. The software provides an analysis of the data and documents the technical and financial status of the project against its schedule and original plan. Usually, the software also provides impact assessments of plan deviations and resource and schedule projections. Many systems also provide resource leveling, a feature that averages out available resources to determine task duration and generates a leveled schedule for comparison. The specific analysis reports are described next.
2. Reports. Project reporting is usually achieved via a menu-driven report writer system that allows the user to request several standard reports in a standard format. The user can also modify these reports or create new ones. Depending on the sophistication of the system and its peripheral hardware, these reports are supported by a full range of Gantt charts, network diagrams, tabular summaries, and business graphics. A sample of reporting capabilities available today includes:
• Budgeted cost for work scheduled (BCWS) report
• Budgeted cost for work performed (BCWP) report
• Actual versus planned expenditure report
• Earned value analysis
• Cost and schedule performance indices
• Cash-flow reports
• Critical path analysis
• Change order reports
• Standard government reports (DoD, DoE, NASA), formatted for the performance monitoring system (PMS)
In addition, many software packages feature a user-oriented, free-format report writer for styled project reporting.
3. Project calendar. This feature allows the user to establish work weeks based on actual workdays. Hence, the user can specify nonwork periods such as weekends, holidays, and vacations. The project calendar can be printed out in detail or in a summary format and is automatically the basis for all computer-assisted resource scheduling.
4. What-if analysis. Some software is designed to make what -if analyses easy. A separate, duplicate project database is established and the desired changes are entered. Then the software performs a comparative analysis and displays the new against the old project plan in tabular or graphical form for fast and easy management review and analysis.
5. Multiproject analysis. Some of the more sophisticated software packages feature a single, comprehensive database that facilitates cross-project analysis and reporting. Cost and schedule modules share common files that allow integration among projects and minimize problems of data inconsistencies and redundancies.
TEAMFLY
Team-Fly®

Page 708
12.16— Software Classification
For purposes of easy classification, project management software products have been divided into three categories based on the type of functions and features they provide.13
Level I software. Designed for single-project planning, these software packages are simple, easy to use, and their outputs are easy to understand. They do provide, however, only a limited analysis of the data. They do not provide automatic rescheduling based on specific changes. Therefore, deviations from the original project plan require complete replanning of the project and a complete new data input to the computer.
Level II software. Designed for single project management, these software packages aid project leaders in the planning, tracking, and reporting of projects. They provide a comprehensive analysis of the project, progress reports, and plan revisions, based on actual performance. This type of software is designed for managing projects beyond the planning stage, and for providing semiautomatic project control.
Level III software. These packages feature multiproject planning, monitoring, and control by utilizing a common database and sophisticated cross-project monitoring and reporting software.
Most software packages at levels II and III have the following extensive capabilities for project monitoring and control:
1. System capacity. The number of activities and/or number of subnetworks that may be used.
2. Network schemes. The network schemes are activity diagram (AD) and/or precedence relationship (PRE).
3. Calendar dates. An internal calendar is available to schedule the project's activities. The variations and options of the different calendar algorithms are numerous.
4. Gantt or bar charts. A graphic display of the output on a time scale is available if desired.
5. Flexible report generator. The user can specify within defined guidelines the format of the output.
6. Updating. The program will accept revised time estimates and completion dates and recompute the revised schedule.
7. Cost control. The program accepts budgeted cost figures for each activity and then the actual cost incurred, and summarizes the budgeted and actual figures on each updating run. The primary objective is to help management produce a realistic cost plan before the project is started and to assist in the control of the project expenditures as the work progresses.
13 Some standards were initially set by PC Magazine, "Project Management with the PC," Vol. 3, No. 24, December 11, 1984.
Page 709
8. Scheduled dates. A date is specified for the completion of any of the activities for purposes of planning and control. The calculations are performed with these dates as constraints.
9. Sorting. The program lists the activities in a sequence specified by the user.
10. Resource allocation. The program attempts to allocate resources optimally using one of many heuristic algorithms.
11. Plotter availability. A plotter is available to plot the network diagram.
12. Machine requirements. This is the minimum hardware memory requirement for the program (in units of bytes).
13. Cost. Indicates whether the program is sold and/or leased and the purchase price and/or lease price (where available).
12.17— Project Software Evaluation
From the middle 1970s to the early 1980s, companies invested heavily in mainframe project management software with costs varying between $75,000 and $125,000. Acceptance of these packages was difficult because only an elite few truly understood the jargon and were capable of using the programs. Turnaround of information was measured in days. Comprehensive evaluation of these programs was difficult because of the complexity of the operating instructions, most of which were not very user-friendly.
Today there exist more than 200 software packages on program management ranging from the large $100,000+ mainframe packages to the small $10 diskette that simply calculates the critical path. The majority of these programs are now user-friendly and capable of running on PCs. Many of the software packages priced between $500–$1,000 have capabilities equivalent to earlier generation mainframe packages.
The ease of use of these packages has allowed organizations to develop very sophisticated evaluation mechanisms for comparing software programs. The National Software Testing Laboratories (NSTL) of Conshohoken, Pennsylvania, utilizes the following methodology for comparing software programs:14
• Performance • Quality
• Print GANTT to LaserJet • GANTT chart on LaserJet
• Print PERT to LaserJet • PERT chart on LaserJet
• Print GANTT to PaintJet • GANTT chart on PaintJet
• Print PERT to PaintJet • PERT chart on PaintJet
• Change views • Resource leveling
• Recalculate schedule • Versatility
• Level resources • Project calendar (see Figure 12–27)
14 Project Management Programs, Software Digest, Volume 7, November 16 © 1990 by NSTL, Plymouth Corporate Center, Plymouth Meeting, Pennsylvania, 19462. (880)-223-7093.
Page 710
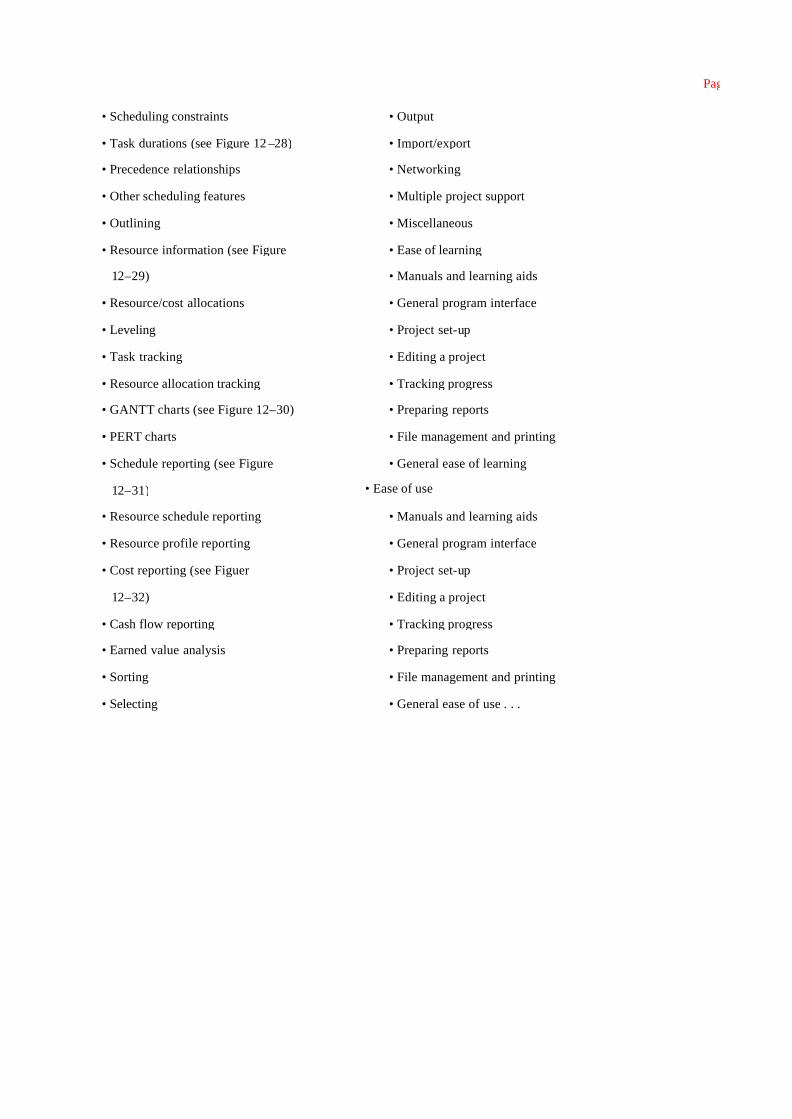
• Scheduling constraints • Output
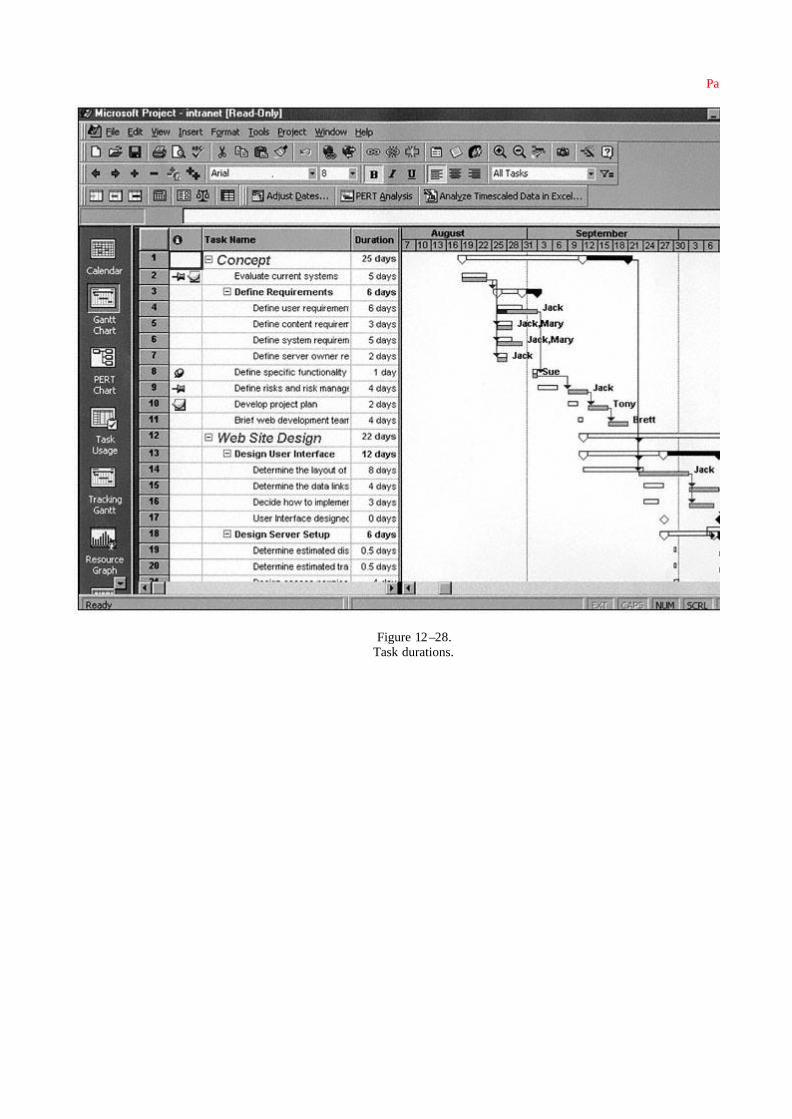
• Task durations (see Figure 12 –28) • Import/export
• Precedence relationships • Networking
• Other scheduling features • Multiple project support
• Outlining • Miscellaneous
• Resource information (see Figure • Ease of learning
12–29) • Manuals and learning aids
• Resource/cost allocations • General program interface
• Leveling • Project set-up
• Task tracking • Editing a project
• Resource allocation tracking • Tracking progress
• GANTT charts (see Figure 12–30) • Preparing reports
• PERT charts • File management and printing
• Schedule reporting (see Figure • General ease of learning
12–31) • Ease of use
• Resource schedule reporting • Manuals and learning aids
• Resource profile reporting • General program interface
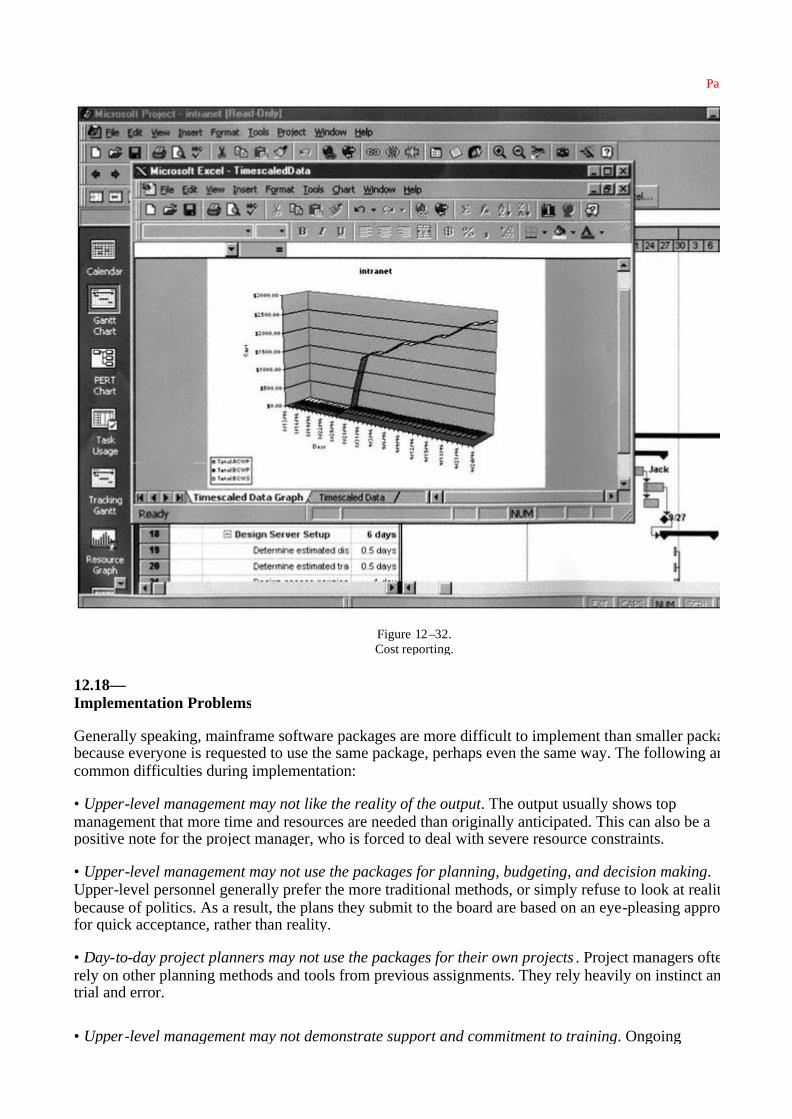
• Cost reporting (see Figuer • Project set-up
12–32) • Editing a project
• Cash flow reporting • Tracking progress
• Earned value analysis • Preparing reports
• Sorting • File management and printing
• Selecting • General ease of use . . .

Figure 12–27. Project calendar.
Page 711
Figure 12–28. Task durations.
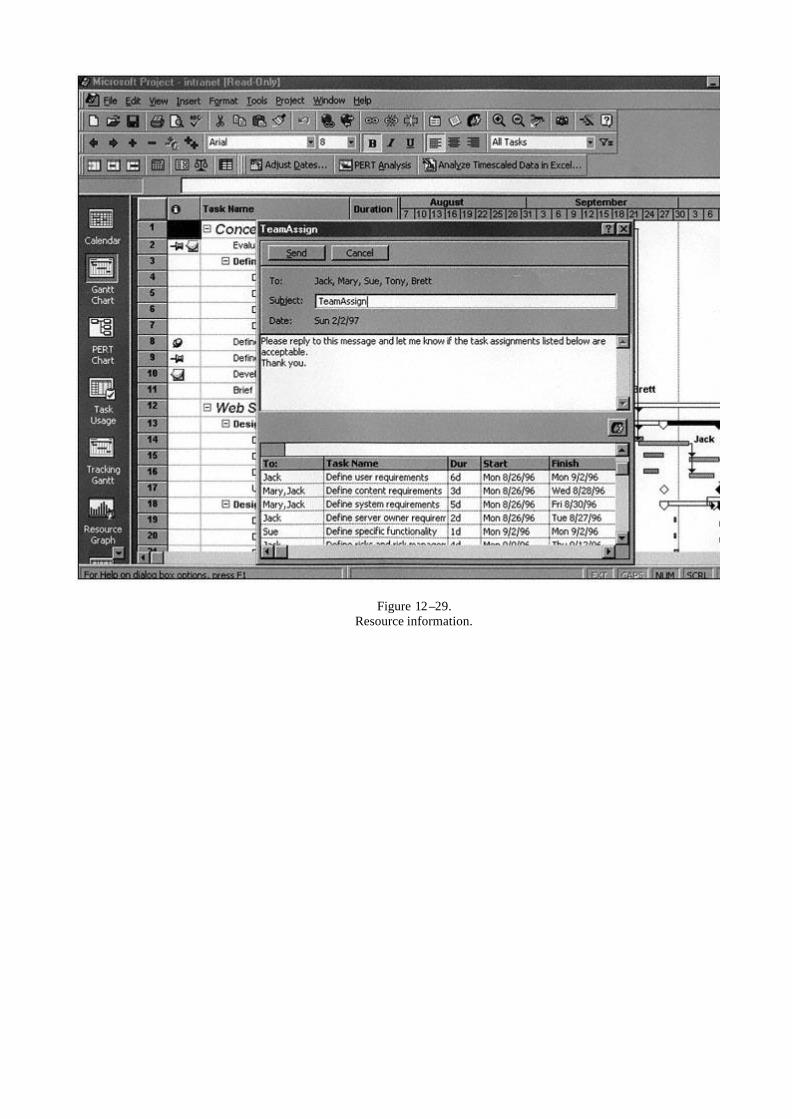
Figure 12–29. Resource information.

Page 712
Figure 12–30. GANTT charts.

Figure 12–31. Schedule reporting.
Page 713
Figure 12–32. Cost reporting.
12.18— Implementation Problems
Generally speaking, mainframe software packages are more difficult to implement than smaller packages, because everyone is requested to use the same package, perhaps even the same way. The following are common difficulties during implementation:
• Upper-level management may not like the reality of the output. The output usually shows top management that more time and resources are needed than originally anticipated. This can also be a positive note for the project manager, who is forced to deal with severe resource constraints.
• Upper-level management may not use the packages for planning, budgeting, and decision making. Upper-level personnel generally prefer the more traditional methods, or simply refuse to look at reality because of politics. As a result, the plans they submit to the board are based on an eye-pleasing approach for quick acceptance, rather than reality.
• Day-to-day project planners may not use the packages for their own projects . Project managers often rely on other planning methods and tools from previous assignments. They rely heavily on instinct and trial and error.
• Upper-level management may not demonstrate support and commitment to training. Ongoing

customized training is mandatory for successful implementation, even though each project may vary.
TEAMFLY
Team-Fly®
Page 714
• Use of mainframe software requires strong internal communications lines for support. Managers who share resources must talk to one another continually.
• Clear, concise reports are lacking. Large mainframe packages can generate volumes of data, even if the package has a report writer package.
• Mainframe packages do not always provide for immediate turnabout of information. This is often the result of not understanding how to utilize the new systems.
• The business entity may not have any project management standards in place prior to implementation. This relates to a lack of WBS numbering schemes, no life-cycle phases, and a poor understanding of task dependencies.
• Implementation may highlight middle management's inexperience in project planning and organizational skills. Fear of its use is a key factor in not obtaining proper support.
• The business environment and organizational structure may not be appropriate to meet project management/planning needs. If extensive sharing of resources exists, then the organizational structure should be a formal or informal matrix. If the organization is deeply entrenched in a traditional structure, then organizational mismatch exists and the software system may not be accepted.
• Sufficient/extensive resources (staff, equipment, etc.) are required. Large mainframe packages consume a significant amount of resources in the implementation phase.
• The business entity must determine the extent of, and appropriate use of, the systems within the organization. Should it be used by all organizations? Should it be used only on high-priority projects?
• The system may be viewed as a substitute for the extensive interpersonal skills required by the project manager. Software systems do not replace the need for project managers with strong communications and negotiation skills.
• Software implementation is less likely to succeed if the organization does not have sufficient training in project management principles. This barrier is perhaps the underlying problem for all of the other barriers.
Problems
12–1 Should a PERT/CPM network become a means of understanding reports and schedules, or should it be vice versa?
12–2 Before PERT diagrams are prepared, should the person performing the work have a clear definition of the requirements and objectives, both prime and supporting? Is it an absolute necessity?
12–3 Who prepares the PERT diagrams? Who is responsible for their integration?
12–4 Should PERT networks follow the work breakdown structure?
12–5 How can a PERT network be used to increase functional ability to relate to the total program?