
Using Semantic Data Models for enhancing Process Mining in ... · Using Semantic Data Models for...
94
Using Semantic Data Models for enhancing Process Mining in Issue Tracking Systems David Gon¸ calves Alves Rodrigues Mendes Thesis to obtain the Master of Science Degree in Information Systems and Computer Engineering Supervisor: Prof. Dr. Miguel Leit˜ ao Bignolas Mira da Silva Prof. Diogo Manuel Ribeiro Ferreira Examination Committee Chairperson: Prof. Dr. Paolo Romano Supervisor: Prof. Dr. Miguel Leit˜ ao Bignolas Mira da Silva Member of the Committee: Prof. Dr. Ant´ onio Manuel Ferreira Rito da Silva November 2016
Transcript of Using Semantic Data Models for enhancing Process Mining in ... · Using Semantic Data Models for...
Using Semantic Data Models for enhancing Process Miningin Issue Tracking Systems
David Goncalves Alves Rodrigues Mendes
Thesis to obtain the Master of Science Degree in
Information Systems and Computer Engineering
Supervisor: Prof. Dr. Miguel Leitao Bignolas Mira da SilvaProf. Diogo Manuel Ribeiro Ferreira
Examination Committee
Chairperson: Prof. Dr. Paolo RomanoSupervisor: Prof. Dr. Miguel Leitao Bignolas Mira da Silva
Member of the Committee: Prof. Dr. Antonio Manuel Ferreira Rito da Silva
November 2016

Agradecimentos
Agradeco...
Em primeiro lugar ao Prof. Miguel Mira da Silva por ter aceitado orientar a minha tese e por todo o
seu acompanhamento durante todo este processo.
Aos meus pais, Luıs e Dulce Mendes, por todo o investimento que fizeram na minha formacao profis-
sional e, juntamente com a minha irma Ines, por todo o vosso apoio nos bons e nos maus momentos. Se
hoje sou Mestre em Engenharia Informatica, e gracas a voces.
Aos amigos que conheci no Instituto Superior Tecnico (Bruno Ferreira, Marta Aparıcio, Paulo Figueiredo,
Susana Ferreira, Miguel Belo, Duarte Patrıcio, Iryna Shvydyuk e muitos outros) com quem partilhei di-
versos projectos, e pelos seus conselhos e momentos de descontracao e lazer proporcionados durante
estes anos.
E por ultimo, mas de forma igualmente importante, ao Instituto Superior Tecnico e aos seus profes-
sores que tive o privilegio de ter durante a Licenciatura e o Mestrado.
Gracas a eles, foi possıvel perceber o nıvel de excelencia que permeia esta instituicao, espelhado pelo
rigor e qualidade pedidos aos seus alunos. Esta faculdade, que foi a minha segunda casa ao longo destes
ultimos anos, contribuiu de forma ımpar para o meu crescimento enquanto pessoa e professional e tudo
o que aprendi aqui ao longo destes anos, fara sempre parte de mim enquanto Engenheiro Informatico.
Lisboa, 16 de Outubro de 2016David Mendes

Abstract
In any software project lifecycle, there are unexpected problems that occur during the development. To
monitor the different kinds of requests in a structured way, there is an information system, called Issue
Tracking System (ITS) that keeps track of the issues as they occur. Even though the information about
those tickets is stored, the respective internal processes are seen as black-boxes, making it difficult to
understand what is really happening.
To solve that, Process Mining (PM) uses existing information from the event logs recorded by ITS to
automatically create the processes that represent its behaviour.
However, there are several fields that identify a certain issue (like issue type, priority, resolution) and
to analyze the processes for all different issue variants, it is necessary to extract an event log for each
particular case and load them into a PM tool, making it a daunting task to manually customize a log for
each type of process available.
This thesis proposes an additional architecture layer in the PM approach by storing all the informa-
tion of the event logs in a semantic data model and allowing the creation of parameterized queries over
the existing data model to enable a customized business process creation.
This approach is demonstrated with an artifact that stores information from an ITS, loads that infor-
mation into the chosen data model and gives the user the chance of choosing the relevant fields for the
creation of personalized process models that are tailored for his needs.
The evaluation is done according to a defined set of metrics that allow us to compare the results
between the created processes.
Keywords
Process Mining, Issue Tracking Systems, Event logs, Ontology, Semantic Annotations
iii


Resumo
Durante o ciclo de vida de um projecto de software, existem problemas inesperados que ocorrem du-
rante o seu desenvolvimento. Como tal, e utilizado um Sistema de Gestao de Incidentes (SGI) que
monitoriza todo o tipo de incidentes a medida que estes vao ocorrendo. Apesar de toda a informacao
referente aos “tickets” durante o projecto ser armazenada, os processos internos sao vistos como “black-
boxes”, tornando dificil de perceber o que esta a realmente a acontecer do ponto de vista do processo.
Para resolver isso, a area de “Process Mining” (PM) utiliza informacao existente a partir dos logs
de eventos extraıdos do SGI para criar de forma automatica os processos que representam o compor-
tamento destes sistemas. Contudo, um incidente e caracterizado por diversos campos e para analisar
todas as variantes de processos, e necessario extrair um log de eventos para cada caso particular e car-
rega-lo numa ferramenta de PM, o que torna esse passo de definir manualmente o log para cada tipo de
processo existente, numa tarefa repetitiva e morosa.
Esta tese propoe uma camada adicional na abordagem tıpica de PM ao armazenar toda a informacao
relevante num modelo de dados pre-definido e permitir a criacao de “queries” sobre esse modelo para
a geracao customizada de processos de negocio, de acordo com os parametros definidos pelo utilizador.
A abordagem e exemplificada com um artefacto que extrai a informacao de um SGI, carrega essa
informacao no modelo de dados escolhido e da ao utilizador a oportunidade de escolher os campos
relevantes para a criacao de diferentes processos que sao adaptados as suas necessidades. A avaliacao
e feita de acordo com um conjunto pre-definido de metricas que nos permitem comparar os resultados
entre os diversos processos criados.
Palavras Chave
Process Mining, Sistemas de gestao de incidentes, Logs de eventos, Ontologias, Anotacoes semanticas
v

Contents
1 Introduction 1
1.1 Document Structure . . . . . . . . . . . . . . . . . . . . . . . . . . . . . . . . . . . . . . . . 3
2 Research Area 5
2.1 Issue Tracking Systems . . . . . . . . . . . . . . . . . . . . . . . . . . . . . . . . . . . . . . . 5
2.1.1 Jira . . . . . . . . . . . . . . . . . . . . . . . . . . . . . . . . . . . . . . . . . . . . . . 8
3 Related Work 9
3.1 Process Mining . . . . . . . . . . . . . . . . . . . . . . . . . . . . . . . . . . . . . . . . . . . 9
3.2 Event logs . . . . . . . . . . . . . . . . . . . . . . . . . . . . . . . . . . . . . . . . . . . . . . 11
3.3 Tools about process mining . . . . . . . . . . . . . . . . . . . . . . . . . . . . . . . . . . . . 12
3.3.1 ProM . . . . . . . . . . . . . . . . . . . . . . . . . . . . . . . . . . . . . . . . . . . . . 12
3.3.2 Disco . . . . . . . . . . . . . . . . . . . . . . . . . . . . . . . . . . . . . . . . . . . . . 12
3.4 Semantic Process Mining . . . . . . . . . . . . . . . . . . . . . . . . . . . . . . . . . . . . . . 13
3.5 Ontologies . . . . . . . . . . . . . . . . . . . . . . . . . . . . . . . . . . . . . . . . . . . . . . 14
3.6 Ontology languages . . . . . . . . . . . . . . . . . . . . . . . . . . . . . . . . . . . . . . . . . 15
3.6.1 RDF . . . . . . . . . . . . . . . . . . . . . . . . . . . . . . . . . . . . . . . . . . . . . . 15
3.6.2 RDFS . . . . . . . . . . . . . . . . . . . . . . . . . . . . . . . . . . . . . . . . . . . . . 15
3.6.3 OWL . . . . . . . . . . . . . . . . . . . . . . . . . . . . . . . . . . . . . . . . . . . . . 16
3.7 Semantic annotations . . . . . . . . . . . . . . . . . . . . . . . . . . . . . . . . . . . . . . . . 16
3.7.1 MXML . . . . . . . . . . . . . . . . . . . . . . . . . . . . . . . . . . . . . . . . . . . . 16
3.7.2 SA-MXML . . . . . . . . . . . . . . . . . . . . . . . . . . . . . . . . . . . . . . . . . . 17
3.7.3 XES . . . . . . . . . . . . . . . . . . . . . . . . . . . . . . . . . . . . . . . . . . . . . . 17
3.8 SPARQL . . . . . . . . . . . . . . . . . . . . . . . . . . . . . . . . . . . . . . . . . . . . . . . 18
3.9 Jena . . . . . . . . . . . . . . . . . . . . . . . . . . . . . . . . . . . . . . . . . . . . . . . . . . 18
4 Design Science Research 19
5 Problem Identification 21
5.1 Goals . . . . . . . . . . . . . . . . . . . . . . . . . . . . . . . . . . . . . . . . . . . . . . . . . 23
vii
6 Proposal 25
6.1 Defining the objectives for a solution . . . . . . . . . . . . . . . . . . . . . . . . . . . . . . . 25
6.2 Design and development . . . . . . . . . . . . . . . . . . . . . . . . . . . . . . . . . . . . . . 27
6.3 Activity sequence . . . . . . . . . . . . . . . . . . . . . . . . . . . . . . . . . . . . . . . . . . 31
6.3.1 Extract the data from an issue tracking system . . . . . . . . . . . . . . . . . . . . . 31
6.3.2 Create and build an ontology model for issue tracking systems . . . . . . . . . . . 33
6.3.3 Load the issue data into the model . . . . . . . . . . . . . . . . . . . . . . . . . . . . 34
6.3.4 Annotate semantically the different fields . . . . . . . . . . . . . . . . . . . . . . . . 35
6.3.5 Parametrize the SPARQL queries . . . . . . . . . . . . . . . . . . . . . . . . . . . . . 37
6.3.6 Process mining algorithm . . . . . . . . . . . . . . . . . . . . . . . . . . . . . . . . . 39
7 Demonstration of the artifact 45
7.1 Demonstration . . . . . . . . . . . . . . . . . . . . . . . . . . . . . . . . . . . . . . . . . . . . 45
7.1.1 Analyzing by priority . . . . . . . . . . . . . . . . . . . . . . . . . . . . . . . . . . . 46
7.1.2 Analyzing by resolution . . . . . . . . . . . . . . . . . . . . . . . . . . . . . . . . . . 51
7.1.3 Analyzing by type . . . . . . . . . . . . . . . . . . . . . . . . . . . . . . . . . . . . . 55
7.1.4 Analyzing by assignee . . . . . . . . . . . . . . . . . . . . . . . . . . . . . . . . . . . 58
7.1.5 Combining different analysis . . . . . . . . . . . . . . . . . . . . . . . . . . . . . . . 60
7.1.6 Analyzing different fields . . . . . . . . . . . . . . . . . . . . . . . . . . . . . . . . . 61
8 Evaluation 65
8.1 Process metrics . . . . . . . . . . . . . . . . . . . . . . . . . . . . . . . . . . . . . . . . . . . 65
8.2 Semantic annotations . . . . . . . . . . . . . . . . . . . . . . . . . . . . . . . . . . . . . . . . 70
9 Conclusion 73
9.1 Future Work . . . . . . . . . . . . . . . . . . . . . . . . . . . . . . . . . . . . . . . . . . . . . 74
viii

List of Figures
2.1 Some examples of priorities present in ITS . . . . . . . . . . . . . . . . . . . . . . . . . . . . 6
2.2 Default workflow present in an Jira project . . . . . . . . . . . . . . . . . . . . . . . . . . . 7
2.3 Example of an issue in Jira . . . . . . . . . . . . . . . . . . . . . . . . . . . . . . . . . . . . . 8
3.1 Process Mining Techniques [1] . . . . . . . . . . . . . . . . . . . . . . . . . . . . . . . . . . . 10
3.2 Event data log . . . . . . . . . . . . . . . . . . . . . . . . . . . . . . . . . . . . . . . . . . . . 11
3.3 Core building blocks for semantic process mining [2] . . . . . . . . . . . . . . . . . . . . . 13
3.4 Representation of an RDF triple . . . . . . . . . . . . . . . . . . . . . . . . . . . . . . . . . . 15
3.5 Schema for the Mining XML (MXML) format [2] . . . . . . . . . . . . . . . . . . . . . . . . 17
4.1 DSRM Process Model . . . . . . . . . . . . . . . . . . . . . . . . . . . . . . . . . . . . . . . . 20
5.1 Business process that represents the progression of the status during an issue - frequency
and average time between activities . . . . . . . . . . . . . . . . . . . . . . . . . . . . . . . 22
6.1 Integrated process mining model [1] . . . . . . . . . . . . . . . . . . . . . . . . . . . . . . . 27
6.2 Representation of the proposed method . . . . . . . . . . . . . . . . . . . . . . . . . . . . . 32
6.3 Data extraction page from the created artifact . . . . . . . . . . . . . . . . . . . . . . . . . 33
6.4 Model representation of a issue tracking system . . . . . . . . . . . . . . . . . . . . . . . . 34
6.5 Example of a CSV log that is loaded into the ontology . . . . . . . . . . . . . . . . . . . . . 35
6.6 Event log and respective list of visited activities and visited paths . . . . . . . . . . . . . . 40
6.7 List of visited activities and corresponding edges matrix . . . . . . . . . . . . . . . . . . . 41
6.8 Filtering algorithm that selects 80% of activities and 80% of paths . . . . . . . . . . . . . . 43
7.1 Business process that reflects the Status exchange of PLAT over the issue execution . . . . 46
7.2 Business process with priority CAT-1 (Extremly disruptive, cannot release until resolved ) 47
7.3 Business process with priority CAT-2 (Very high priority. Needs to be resolved in short
time range ) . . . . . . . . . . . . . . . . . . . . . . . . . . . . . . . . . . . . . . . . . . . . . 48
7.4 Business process with priority CAT-3 (Infrequent, serious bugs. Should fix in near term) . 49
ix
7.5 Business process with priority CAT-4 (Unsure when we are going to fix this) . . . . . . . . 49
7.6 Business process with priority Unset (Does not have a priority defined) . . . . . . . . . . . 50
7.7 List of all semantic annotations for the resolutions in the PLAT project . . . . . . . . . . . 52
7.8 Business process with resolution Done (Work has been completed on this issue) . . . . . . 53
7.9 Business process with resolution Fixed (A fix for this issue is checked into the tree and
tested) . . . . . . . . . . . . . . . . . . . . . . . . . . . . . . . . . . . . . . . . . . . . . . . . 53
7.10 Business process with resolution Unresolved (The issue is being worked on) . . . . . . . . 54
7.11 List of all semantic annotations for the types in the PLAT project . . . . . . . . . . . . . . . 55
7.12 Business process with Type Bug (A problem which impairs or prevents the functions of
the product) . . . . . . . . . . . . . . . . . . . . . . . . . . . . . . . . . . . . . . . . . . . . . 56
7.13 Business process with Type Epic (A big user story that needs to be broken down) . . . . . 56
7.14 Business process with Type Sub-task (useful for splitting a task into a number of smaller
tasks) . . . . . . . . . . . . . . . . . . . . . . . . . . . . . . . . . . . . . . . . . . . . . . . . . 57
7.15 Business process with Assignee Calen . . . . . . . . . . . . . . . . . . . . . . . . . . . . . . 59
7.16 Business process with the Assignee Adam . . . . . . . . . . . . . . . . . . . . . . . . . . . . 60
7.17 Business process that combines the four different perspectives . . . . . . . . . . . . . . . . 61
7.18 Business process that reflects the Assignee exchange of PLAT over the issue execution . . 62
7.19 Business process - assignee - with resolution Done (Work has been completed on this issue 62
8.1 Issue PLAT-331 - Individual process . . . . . . . . . . . . . . . . . . . . . . . . . . . . . . . 67
8.2 Status count ocurrences from PLAT project . . . . . . . . . . . . . . . . . . . . . . . . . . . 68
8.3 PLAT-452 - Individual issue . . . . . . . . . . . . . . . . . . . . . . . . . . . . . . . . . . . . 69
x
List of Tables
7.1 Table that compares the most common paths generated with different priorities) . . . . . 51
7.2 Table that compares the most common paths generated with different resolutions) . . . . 55
7.3 Table that compares the most common paths generated with different issue types) . . . . 58
8.1 Table with the process times according with different priorities . . . . . . . . . . . . . . . . 66
8.2 Table with the process times according with different resolutions . . . . . . . . . . . . . . 68
xi

xii
Acronyms
GUI Graphical User Interface
ITS Issue Tracking System
PM Process Mining
RDF Resource Description Framework
SPARQL Simple Protocol and RDF Query Language
MOOCs Massive Open Online Courses
DSRM Design Science Research Methodology
xiii

xiv

Chapter 1
Introduction
”Anything that can go wrong, will go wrong.”
Software engineers are familiarized with this saying and probably heard some variation of the Mur-
phy’s Law, at least once during their careers.
Any software project has unforseen issues during its implementation. This can be due to poor project
planning, objectives changing during the project, bugs and errors found in the software, incorrect re-
quirements gathering, and a myriad of other reasons [3].
To deal with these kind of problems that occur during the project, some companies use mailing lists
or shared spreadsheets to track the different kinds of issues that occur during the development of the
project. However, for projects of bigger size, this approach is unfeasible, since the existing issues can
quickly get out of control and consequently, cost more time and money to the company.
To solve this, there is a software package called ITS that provides a way of solving all kinds of issues
that occur during the project in a collaborative manner, and tracks the progression of those issues until
they are solved [4].
The ITS is not exclusive to software development; it also extends to issues from another fields, like
network teams, database teams and so on. There is a common factor to all those teams: all of them need
some help to track their work.
There is an area that uses the information recorded in information systems (like ITS), to generate the
corresponding processes in a automated way, making them transparent, and creates them based on that
objective information. This process management technique is called Process Mining (PM) [5].
PM allows us to analyze the collected information in a process-centric point of view, in order to un-
derstand the processes that really happen during the lifetime of a project and extract a business process
from the existing data available in the information systems. [5].
By using this technique we can understand the organizational processes of a company, find bottle-
necks, understand past errors and predict future behaviors. With that, we can transform the current
1
data in actual value for the company. PM can be used to measure and identify the different existing
processes, to test if the guidelines are being followed, detect possible deviations and observe potential
delays [1].
To create a process automatically, we need a event log that contains the main activity that we want
to analyze.
However, in some information systems, there are other fields that are relevant for the creation of
an automated process, and the process mining tools only take the chosen activity (the field that changes
over time) into account and ignore any other fields that happen during the lifetime of the process. This is
specifically relevant for ITS that have several fields that change over time. Different persons, priorities,
and issue types may lead to issues being solved in a different way.
For example, if we want to use process mining to understand the status progression of the bugs with
the ”Critical” priority that are assigned to ”John”, we need to select the relevant subset of the event log
data, that contains:
1. The issues of Type Bug;
2. Of that group, select the issues with Critical priority;
3. From those, select those who are assigned to John;
4. From those, select ”Status” as the activity to analyse and put the event data in a process mining
tool, in order to create automatically a business process.
Since the process mining tools only deal with only one activity (column) at a time, it would be
necessary to obtain manually an event log that has those characteristics (type ”Bug”, assignee ”John”,
priority ”Critical”) and convert them into the log that would be loaded into the tools. However, there
are dozens upon dozens of different fields, and it wouldn’t make sense to select manually the respective
log for a specific model analysis each time.
In order to optimize the creation of the automated business process, our proposal consists in using a
data model to collect and relate the existing data in a logical way, allowing the user to query that data,
in order to obtain a parametrized process according to the fields chosen by him.
The main objective of this proposal is the creation of a knowledge base for an ITS that gathers infor-
mation from the event logs, and allows the execution of queries in order to personalize the creation of
process models, at a finer level of granularity.
By allowing a more detailed creation of automated process models, this approach supports the cre-
ation of dozens of process models with a single event log, instead of obtaining manually each log for
each process variant.
2

We also choose several metrics for comparing the different generated processes. The chosen ap-
proach will be based upon the Design Science Research Methodology (DSRM) and applied in practice
with projects from ITS.
1.1 Document Structure
This document is structured in several sections: in Section 2, we will talk about the research area:
what are ITS and give a concrete example of one ITS: Jira.
In Section 3, the related work that is relevant for this thesis is presented. The area of PM will be
explained in detail: what is PM, the importance of event logs in this area and two process mining tools
will be presented: ProM and Disco. We will also talk about the concept of Semantic Process Mining.
The main components of this semantic approach (like ontologies and semantic annotations) will be pre-
sented, alongside several tools used in this area. Several semantic annotation languages and ontology
languages will also be shown.
In Section 4, the research methodology used in this thesis is presented: the DSRM, alongside the
main activities necessary to execute such a process.
The next sections present the steps defined in Design Science Research in the context of this project:
in Section 5 the main problem identified in this thesis will be presented, and in section 6, we will present
the chosen approach to solve that problem. The Section 7 explains how this proposal can be applied
with real-life projects from Issue Tracking Systems.
To conclude, we will evaluate this artifact using the metrics presented in Section 8, and follow it with
a conclusion.
3

4

Chapter 2
Research Area
In this section, we will talk about ITS systems, and the benefits of those systems in software projects.
Afterwards, we will present an concrete example of a ITS: Jira.
2.1 Issue Tracking Systems
Nowadays, software development is very complex in nature.
In a large-sized project, responding efficiently to the bug reports per part of the users involved in
the project (the testers, the clients that use the software, etc.) and develop feature requests per order of
importance, is considerably more complex than it seems.
It is not efficient to manage bugs with shared spreadsheets or emails, due to the sheer size of a
complex software project and considering that the five dimensions of software projects (features, staff,
quality, schedule and cost) and its always-changing requirements, should be taken into account.
At its core, an issue is anything that happens within the context of software development and is
caracterized by a set of fields. The main fields that represent an issue are [4]:
1. Key - A unique identifier for the issue reported by the customer.
2. Type - The category of the issue in question. There are several types of issues which are addressed
in different ways. For example an issue can be of the type ”Bug” which prevents some part of the
software from working, an ”Enhancement” is an request for improvement existing feature or task,
a ”story” to be implemented in SCRUM, etc.
3. Resolution - A record of the issue’s resolution, if the issue has been resolved or closed. Indicates
the possible ways in which an issue can be closed. Some examples of resolutions are ”Done”,
which indicates an issue was resolved; ”Cannot Reproduce” where all attempts to solve the issue
5
failed and therefore, the issue could not be reproduced, ”Unresolved” where the issue was not
solved for some reason, and so on.
4. Status - The status indicates a stage of resolution of a certain issue within its lifecycle. Usually,
a resolution of an certain issue has a pre-determined number of steps, since its creation until the
issue is solved. Therefore, the issues usually follow a certain workflow during its resolution. Some
of those status usually present in issue tracking are: ”Open” - which indicates that the issue was
not addressed; ”In progress” - that means the issue is being worked on; ”Closed” - The issue is
considered finished ) and so forth.
5. Assignee - the developer that the ticket is assigned to, and who is responsible to address the issue
in question. During the lifecycle of the issue, the person responsible for solving the ticket may be
changed to another member of the team.
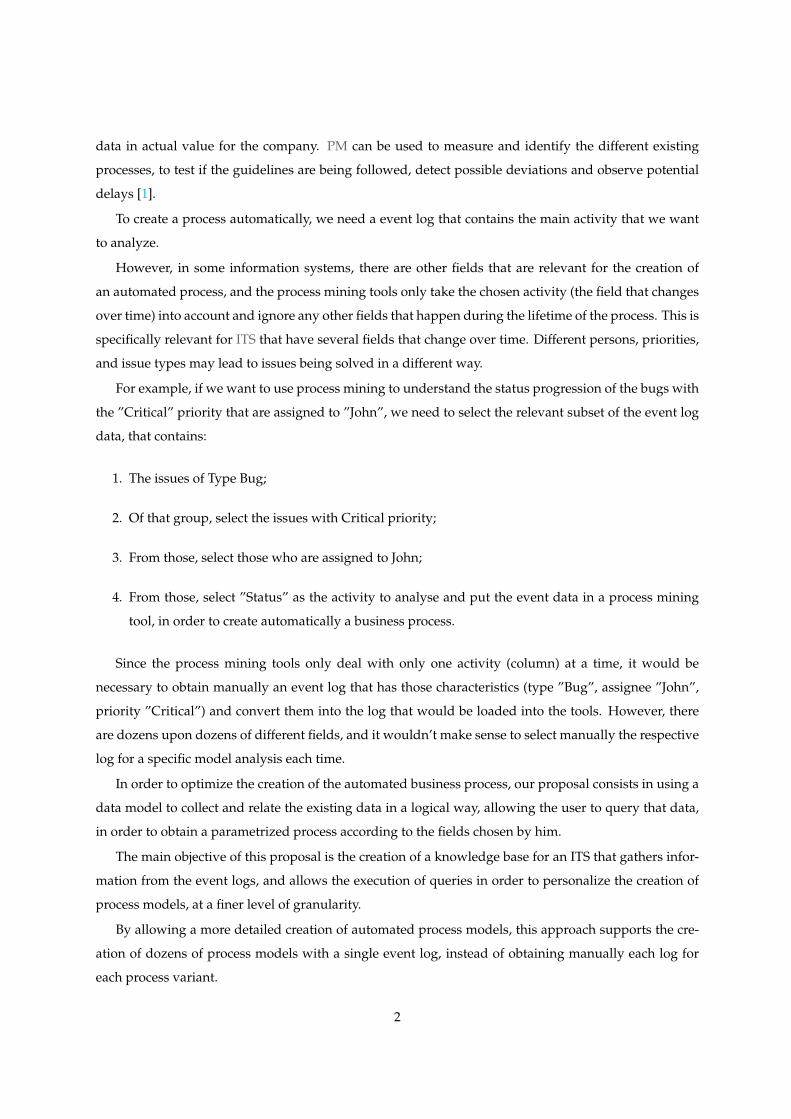
6. Priority - This field indicates the relative importance of the issue in question. Considering the
priority level, a critical issue might have a significant impact in the performance of the system and
therefore, it needs to be solved first than a lowest priority issue. In Figure 2.1, we can see some
examples of priorities that exist in ITS.
Figure 2.1: Some examples of priorities present in ITS
To handle the inablity of tracking the different kinds of issues that occur during the development of
a software project, usually it is necessary to have a central repository that collects and handles all kinds
of requests within the context of a project development.
This kind of system, called ITS, manages issues, categorizes them, and keeps track of the changes in
a structured way.
An ITS provides a way to store issue related information, and track properly any kind of issues that
might occur before, during, and after the development of a project. By categorizing an issue, the system
provides the user with a way to track progression of the issue from the beginning until its resolution [4].
In essence, issue tracking is nothing more that a ”todo” list. By tracking the issue, we can catego-
rize them properly, attribute a person responsible to solve the issue and categorize the entire lifecycle
consequently, in order to deal with the different types of requests in a efficient manner.
6
The main benefits of using an ITS are [4]:
1. Capturing the issues - As mentioned before, to keep track of the requests made by the customer in
a structured way, a issue tracking system works as a database for storing the existing issues. This
is done to have a central, shared location to make it easier to find those issues.
2. See who is accountable for those issues - More than having all details of an issue explicit for the
whole team to see, we can see who asked for the issue, and who is responsible for solving the issue
to streamline its solution and avoid miscommunication between people [4].
3. See the most prioritary issues - By atributing a certain priority to the recorded issues, we can define
an order to see which ones need to be solved first and whose will need less attention.
4. Transparency - By having each update permanently logged, we can see all the steps of each issue,
how long the issue was worked for and its natural progression during the issue execution. This
makes all the steps of issue resolution transparent by keeping a log of all the information.
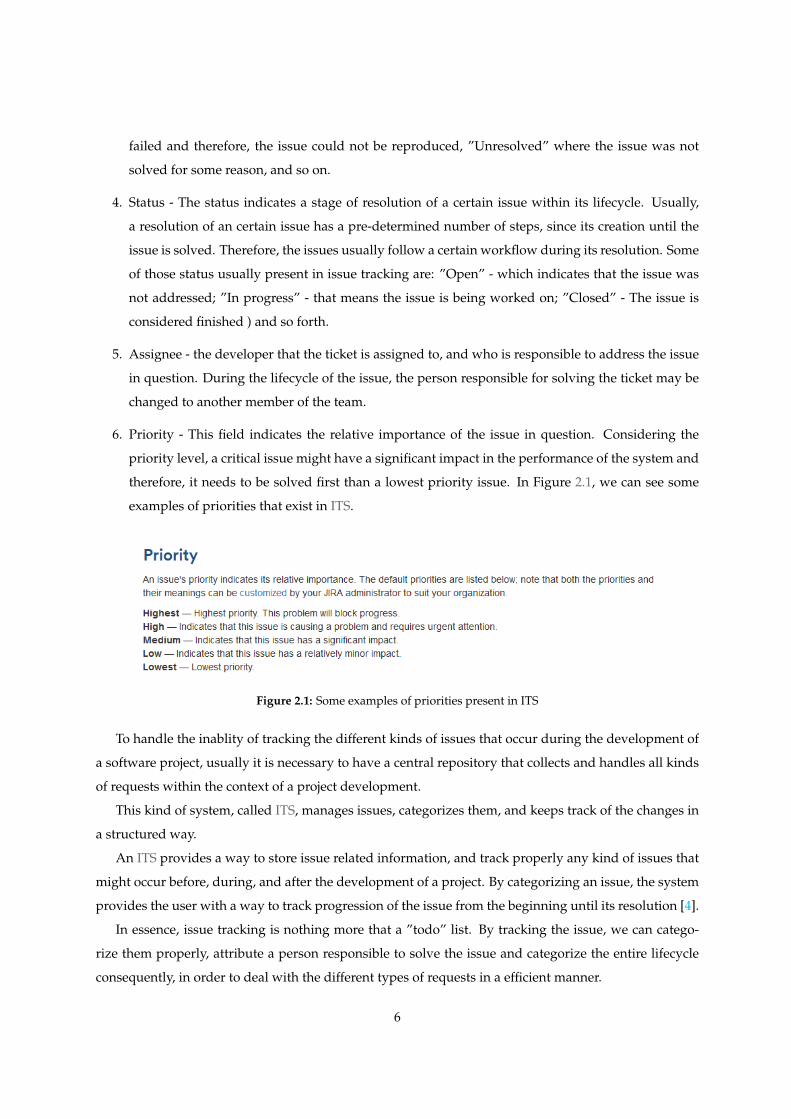
Usually, the main fields present in a ITS allow multiple states and are supported by an workflow
which shows the order of the existing steps. An workflow is a defined sequence of operations used to
represent a business process [6].
Figure 2.2: Default workflow present in an Jira project
In a ITS, an workflow is a set of statuses and transitions travelled by an issue during its lifecycle. In
the Figure 2.2, we can see an workflow example, supported by an ITS.
7
Nowadays, there are several available issue tracking systems. In the next subsection, we will give an
overview of one of those tools: Jira 1.
2.1.1 Jira
Jira is an issue tracking product, developed by Atlassian since 2002. Jira is used for software bug
tracking and issue tracking and it is used by agile teams to help them in project management by storing
and tracking issues in a ordered way [7].
Thanks to its customized features, this tool is suitable for any kind of ticketing systems (like help
desk or service desk).
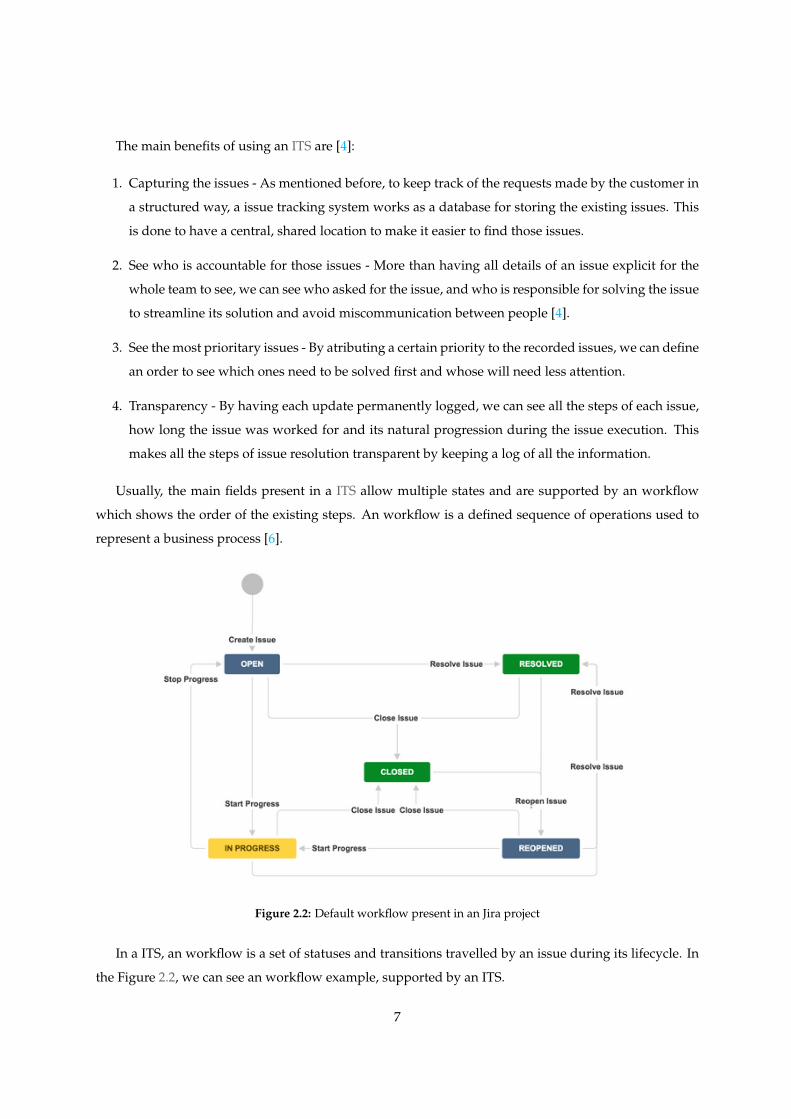
In Figure 2.3, we can see the main fields that are usually present in a ITS in Jira.
Figure 2.3: Example of an issue in Jira
Regarding the workflows for the different fields, Jira allows customizable workflows: some fields
that were mentioned before (Status, Priority) can be customized in order to build an workflow that is
specific for the project in question. This way, custom workflows of any size can be created to match the
exact way the project teams build, test, and release software.
In the next section, we will talk about the related work and what is done in the Process Mining area,
regarding the creation of process models based on information by event logs.
1https://www.atlassian.com/software/jira
8

Chapter 3
Related Work
The following sections present the inclusion of previous work done in the Process Mining area, that
is relevant for the topic in question. It will also be mentioned how the existing work contributes to the
area, and how it will relate to our proposal.
3.1 Process Mining
With the constant progress due to the technological advances made in the last years, the amount
of existing data has been growing exponentially. This increase of available data is partially caused by
a bigger acquisition of information sensing mobile devices, e.g, smart phones and tablets, that have
several sensors that are constantly storing information [1].
This data explosion is a big factor for the application of process mining, since we can use that huge
amount of data to see how the company’s business processes are executed and make them visible to the
organization.
Process mining is a process management technique that consists in the analysis of event logs, in order
to extract valuable information related with business processes of an enterprise [1]. The process mining
techniques allow the automatic discovery of process models that belong to a organization or business
entity. Those process models are based on event logs.
The goal of process mining is to discover, monitor and improve the internal business processes of
the company, allowing the organization to have a deeper insight to their end-to-end processes [1]. How-
ever, by focusing on the organizational processes but using the actual recorded business data, process
mining extracts real, practical value from existing data events, showing what is actually happening in
an organization [8].
Therefore, process mining aims to gain knowledge from the existing business processes by exploring
the data available from the organization’s information systems in order to understand and consequen-
9

Figure 3.1: Process Mining Techniques [1]
tially improve the behavior the performance of those processes.
Regarding the relation of process models and event data, there are three types of process mining
techniques as we can see in Figure 3.1: process discovery, conformance checking and enhancement [5].
1. Process discovery: A process discovery approach uses an existing event log to infer a business pro-
cess model directly from that event log; i.e. from the behavior registered in the data, a representa-
tion of a process model is built automatically.
2. Conformance Checking: The conformance checking technique takes an existing process model and a
event log, and compares them in order to find differences between both. The main objective of this
technique is to confirm if “reality, as recorded in the log, conforms to the model and vice versa” [1].
By “replaying” reality based on event data on top of the existing process model, we can confirm if
the process works as expected or not, locate eventual deviations and detect potential inconsisten-
cies.
3. Enhancement: This approach tries to improve the existing process model, modifying or extending it
with another perspectives like a organizational perspective (based on roles inside a organization)
or another perspectives, like resources, cost, or risks.
Considering that one of the problems is the lack of visibility about business processes in issue track-
ing systems, the main process mining approach used in this thesis will be the process discovery. In order
to use this approach, we will use event logs, which are explained in the next section.
10
3.2 Event logs
As mentioned before, the information systems used by organizations (like ERP or CRM systems)
store events correspondent to the business activities of a certain process.
Event logs are events that take place during the execution of a process, from a particular user, given a
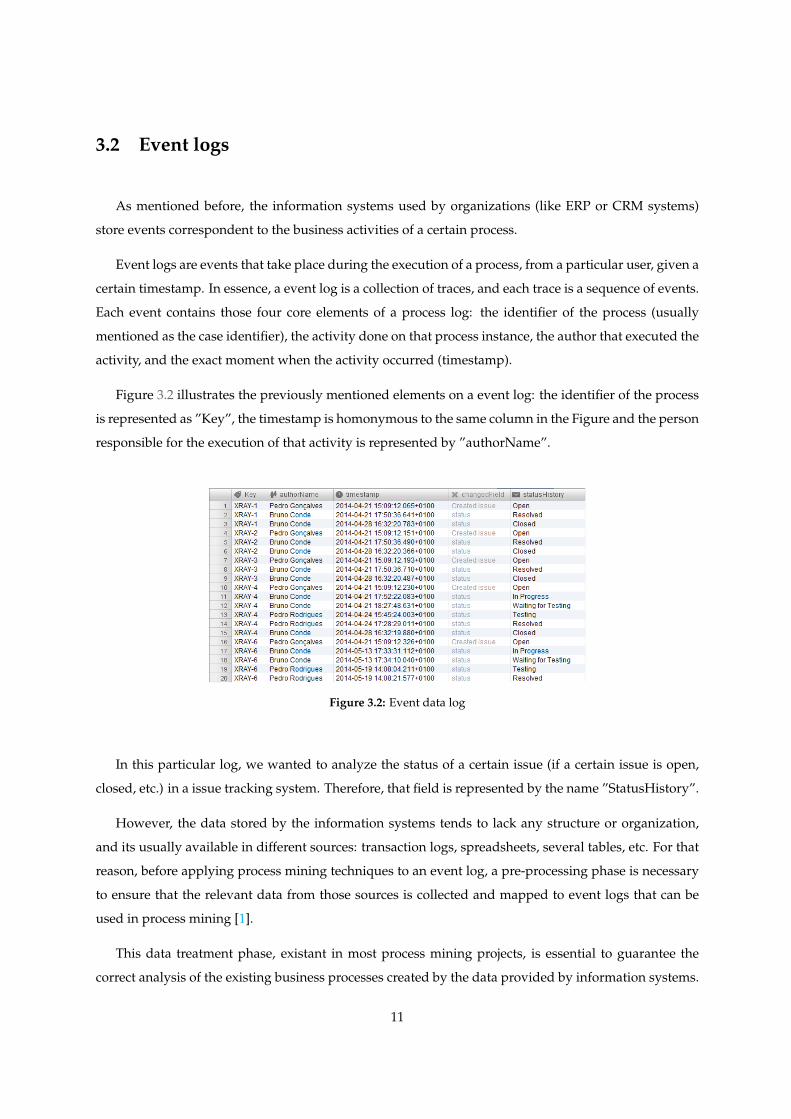
certain timestamp. In essence, a event log is a collection of traces, and each trace is a sequence of events.
Each event contains those four core elements of a process log: the identifier of the process (usually
mentioned as the case identifier), the activity done on that process instance, the author that executed the
activity, and the exact moment when the activity occurred (timestamp).
Figure 3.2 illustrates the previously mentioned elements on a event log: the identifier of the process
is represented as ”Key”, the timestamp is homonymous to the same column in the Figure and the person
responsible for the execution of that activity is represented by ”authorName”.
Figure 3.2: Event data log
In this particular log, we wanted to analyze the status of a certain issue (if a certain issue is open,
closed, etc.) in a issue tracking system. Therefore, that field is represented by the name ”StatusHistory”.
However, the data stored by the information systems tends to lack any structure or organization,
and its usually available in different sources: transaction logs, spreadsheets, several tables, etc. For that
reason, before applying process mining techniques to an event log, a pre-processing phase is necessary
to ensure that the relevant data from those sources is collected and mapped to event logs that can be
used in process mining [1].
This data treatment phase, existant in most process mining projects, is essential to guarantee the
correct analysis of the existing business processes created by the data provided by information systems.
11
3.3 Tools about process mining
To apply the process mining techniques mentioned above, there are two main tools available: ProM1 and Disco 2.
3.3.1 ProM
ProM is an Open Source framework that supports many types of process mining analysis and pro-
cess models, provides hundreds of process mining plug-ins (around 600), and it was developed at the
Eindhoven University of Techonology [9]. Those plug-ins are not only related with the three types of
process mining mentioned in the section 3.1 (discovery, conformance and enhancement) but also include
conversion plug-ins, which convert models between different formats or semantic-related plug-ins like
”Semantic LTL Checker” [10].
According to [9], ProM has been used in several organizations including banks (ING Bank), high-
tech system manufacturers (Philips Healthcare), multinationals (DSM, Deloitte), hospitals (AMC hospi-
tal, Catharina hospital), municipalities (Alkmaar, Heusden) and government agencies (Rijkswaterstaat,
Centraal Justitieel Incasso Bureau, Justice department).
3.3.2 Disco
Disco is a process mining tool created by Anne Rozinat and Christian W. Gunther. This tool has a
simplistic design and intuitive ”look-and-feel”, and it is very fast, performance-wise.
Alongside with a general perspective, Disco also offers different views that allow the user to have
a more detailed outlook about the event logs. Those views include: the ”Statistics” view that offers
several performance metrics about the discovered process, their activities and resources; the ”Cases”
view that allow the user to analyze in detail each individual process instance; and the ”Filters” view,
which filters a certain path or activity of the process model, in order to make it easier to drill down the
data, according to the specified parameters. [11]. Those characteristics make Disco a tool to be taken
into consideration when performing process mining analysis.
The process mining algorithm used for the process discovery is based on the Fuzzy Miner algorithm
[12]. Disco is fully compatible with the ProM toolset, being capable of importing and exporting event
logs in the standard formats (like MXML and XES, that will be mentioned later).
The main disadvantage compared with ProM is the limited variety of analysis, since it cannot pro-
vide conformance checking and enhancement techniques, unlike ProM that has hundreds of plug-ins
that cover all the areas of Process Mining.
1http://www.processmining.org/prom/start2http://fluxicon.com/disco/
12
3.4 Semantic Process Mining
As mentioned in section 3.1, process mining allows the extraction of knowledge about business pro-
cesses with the creation of automatic process models, based on event logs.
However, the analysis of those logs is performed at a syntactic level; the fields of the event logs have
strings, which do not provide any information about the actual meaning within the business context,
being the business analyst responsible to interpret those fields [13].
Also, in those cases where the names of process actions are manually added, there is a probability of
human error where the same activity tends to be written in different ways, making the data ambiguous
[2].
Furthermore, the lack of semantics hampers the chances of automated processing of those models
and makes it very difficult to query them, in order to answer questions about the business [14].
However, the process mining can be expanded with a semantic approach. By attributing meanings
to the fields in the event logs and linking them to ontologies, semantic process mining allows us to
define an automatic process structure that can be reasoned upon with proper queries, increasing the
business value of the process as a whole and potentially identify patterns about the business, reusing
and adapting the process more easily for other solutions [2, 14].
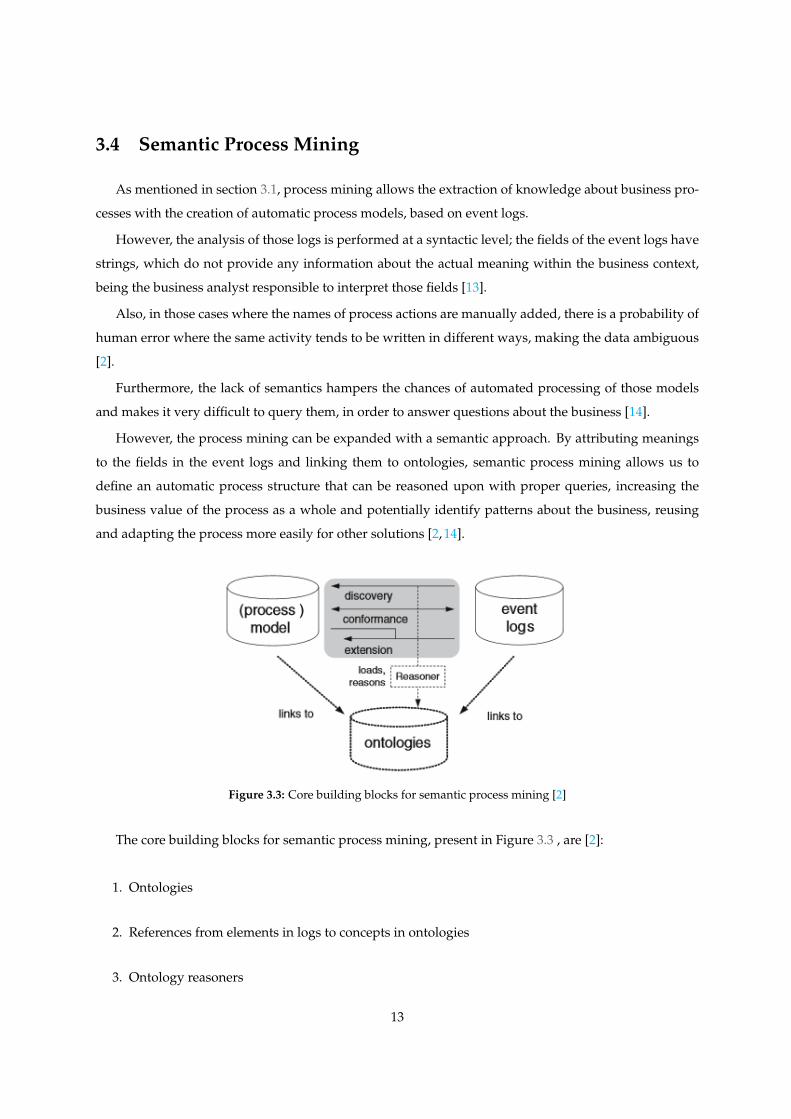
Figure 3.3: Core building blocks for semantic process mining [2]
The core building blocks for semantic process mining, present in Figure 3.3 , are [2]:
1. Ontologies
2. References from elements in logs to concepts in ontologies
3. Ontology reasoners
13
3.5 Ontologies
According to Thomas Gruber, in information science, an ontology is a ”a specification of a conceptu-
alization” [15] .
An ontology is responsible for the formalization of concepts and their relationships regarding a cer-
tain domain knowledge. An ontology “allows a programmer to specify, in an open, meaningful, way,
the concepts and relationships that collectively characterise some domain of interest” 3. In essence, an
ontology tries to build a domain model about a certain area of expertise.
To define an ontology, there are a number of steps recommended, that can help us to build an ontol-
ogy [16]:
1) Determining the domain and the scope of the ontology: In this first step, we try to answer some basic
questions: What is going to be the use of this particular ontology, what type of questions we want to
know the answer using this ontology, what is the domain of this ontology, etc.
We can define a set of questions that our knowledge base should be able to answer.
1a) Consider reusing existing ontologies: Instead of defining an ontology from scratch, and considering
the vast amount of ontology libraries in the Web, we do not necessarily need to “reinvent the wheel” ;
we can use or re-use them for the purpose of our task.
2) Enumerate important terms in the ontology: according with the chosen domain, we should establish
a list of terms, which we want to define and are the core of our ontology.
3) Define the classes and the class hierarchy: For this step there are several different approaches: [16, 17]
• a top-down development process that starts with the definition of the broader concepts and breaks
down those concepts to more specialized ones (for example, the concept ”Dog” is specified as a
class and afterwards, we can classify the relevant dog breeds like ”Chihuahua” or ”Rottwailler”).
• a bottom-up development process, starts with the definition of the more specific concepts of the
system and groups them into more general concepts.
• A combination of both processes mentioned before: bottom-up and top-down.
4) Defining the properties and the types of those classes: each one of those classes has some properties
that are used to characterize the class in question and define its internal structure (for example a Dog
has race, color, origin, etc.). Also, each property has to have a proper type (a string, number, Boolean,
etc.) and correspondent cardinality.
5) Creating instances of classes in the hierarchy: after the structure of the ontology is done, we create
individual instances of certain classes, in order to test the created ontology.
3https://jena.apache.org/documentation/ontology/
14
3.6 Ontology languages
To implement a representation of an ontology, there are several languages available. Some of those
languages are Web standards adopted by the World Wide Web Consortium (W3C) such as RDF and
OWL [18].
3.6.1 RDF
The Resource Description Framework (RDF) is a standard framework used for representing informa-
tion in the Web. The RDF is characterized by a graph data model composed by a set of triples (subject,
predicate, object) in which the subject and the object are entities and the predicate is a relation between
those entities. [19].
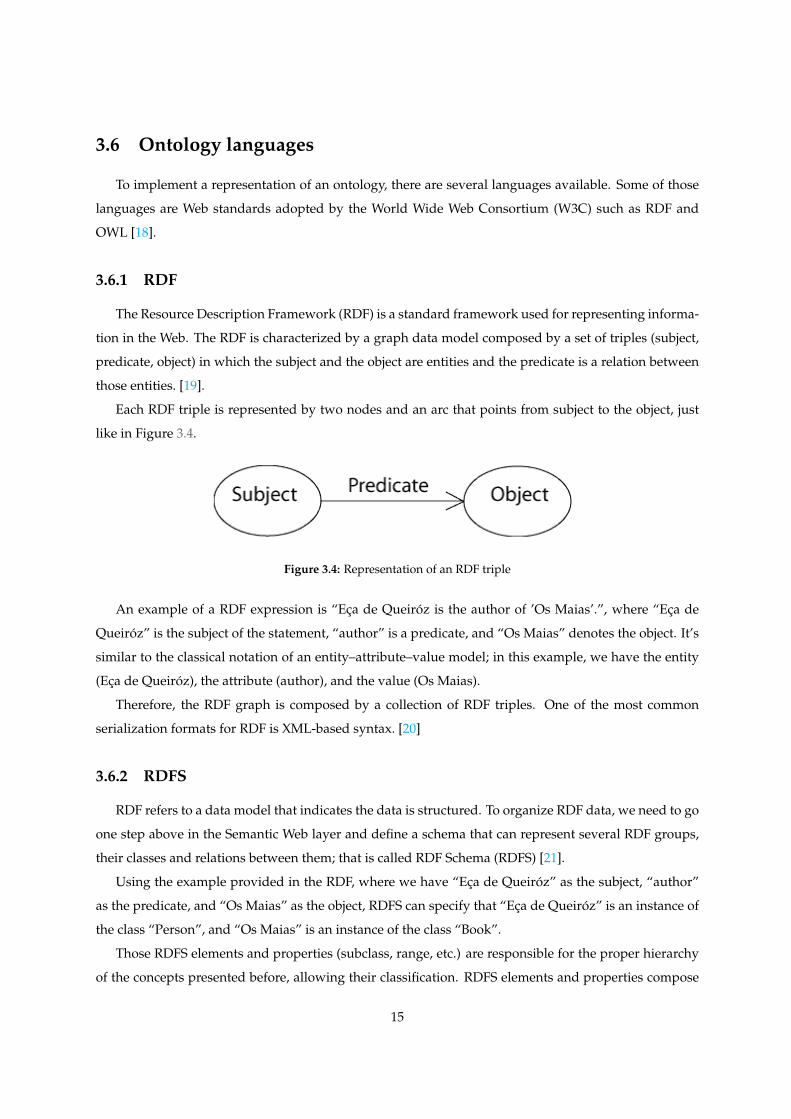
Each RDF triple is represented by two nodes and an arc that points from subject to the object, just
like in Figure 3.4.
Figure 3.4: Representation of an RDF triple
An example of a RDF expression is “Eca de Queiroz is the author of ’Os Maias’.”, where “Eca de
Queiroz” is the subject of the statement, “author” is a predicate, and “Os Maias” denotes the object. It’s
similar to the classical notation of an entity–attribute–value model; in this example, we have the entity
(Eca de Queiroz), the attribute (author), and the value (Os Maias).
Therefore, the RDF graph is composed by a collection of RDF triples. One of the most common
serialization formats for RDF is XML-based syntax. [20]
3.6.2 RDFS
RDF refers to a data model that indicates the data is structured. To organize RDF data, we need to go
one step above in the Semantic Web layer and define a schema that can represent several RDF groups,
their classes and relations between them; that is called RDF Schema (RDFS) [21].
Using the example provided in the RDF, where we have “Eca de Queiroz” as the subject, “author”
as the predicate, and “Os Maias” as the object, RDFS can specify that “Eca de Queiroz” is an instance of
the class “Person”, and “Os Maias” is an instance of the class “Book”.
Those RDFS elements and properties (subclass, range, etc.) are responsible for the proper hierarchy
of the concepts presented before, allowing their classification. RDFS elements and properties compose
15
the basic vocabulary that can be used to construct an ontology.
3.6.3 OWL
The Web Ontology Language (OWL) is an ontology language for the Semantic Web, used for the
creation of ontologies. [18]
OWL can be used to describe in a flexible and formal manner, the meaning of terms used in the
ontology. OWL is more expressive than RDFS because it has a vaster vocabulary than RDFS, including
combinations of expressions (union, intersection), equalities between elements, (sameAs), restriction of
values (cardinality), just to name a few [22].
Also, unlike RDFS, OWL has a more rigid structure, restricting what you can actually do with the
provided vocabulary. By extending the semantics of the RDF Schema, and increasing the degree of
complexity of we can write with RDF, OWL can be used for automatic reasoning and to infer more
information about the existent data models.
3.7 Semantic annotations
To make the event logs capable of supporting semantic process mining, it is necessary to extend those
logs with semantic annotations [8].
A semantic annotation is responsible for identifying a specific concept in a model, with the objective
of enriching the data and give it a proper meaning in a certain context. To validate the semantically
annotated data and to reduce the ambiguity of the given concept, the data should be mapped to a
proper ontology, in order to support the formal representation that is given to the elements present in a
log [13].
Hence, the semantic annotations can serve as a ”bridge” between the models and the ontologies that
give meaning to those models.
There are several formats that can be used for this annotation process: MXML, SA-MXML and XES.
3.7.1 MXML
The MXML (Mining XML format) is a XML-based language used to store event logs from information
systems. This data format was created in order to design a standard for event logs that could be shared
between different process mining tools [2].
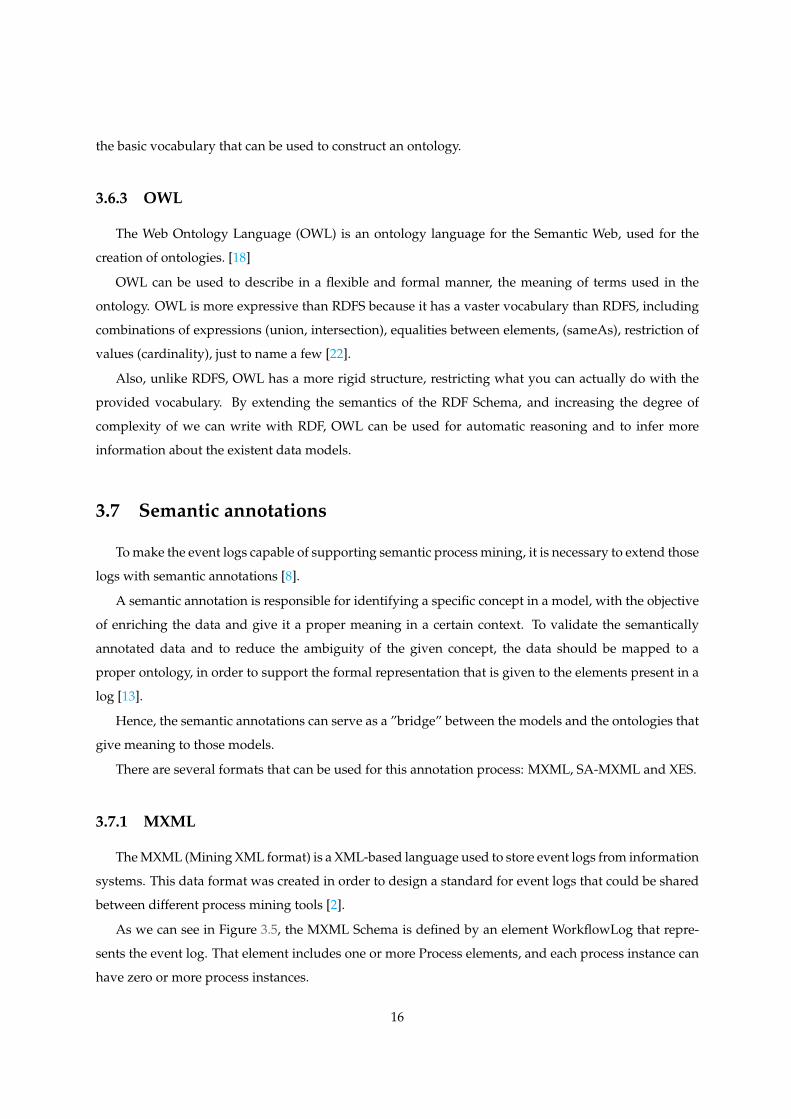
As we can see in Figure 3.5, the MXML Schema is defined by an element WorkflowLog that repre-
sents the event log. That element includes one or more Process elements, and each process instance can
have zero or more process instances.
16
Figure 3.5: Schema for the Mining XML (MXML) format [2]
Each process instance has zero or more tasks (element AuditTrailEntry) and each task corresponds
to an event that has the four main elements related to a trace log: the activity itself, defined by its
name (WorkflowModelElement) and state (EventType), the author of the activity (Originator), the time
where the activity ocurred (Timestamp), and the process identifier, defined by AuditTrailEntry that
corresponds to each event of the process instance.
3.7.2 SA-MXML
The SA-MXML (Semantically Annotated MXML) format is an extension of MXML format that allows
semantic annotations. In addition to the elements mentioned in MXML, those elements have an extra
attribute (modelReference) that links the references mentioned in the logs, to concepts represented in
ontologies [2].
XES is an XML-based standard for event logs
3.7.3 XES
XES is the XML-based standard that is used for capturing event logs from different sources, simpli-
fying to way information is represented. XES ended up the successor of MXML and is adopted by the
IEEE Task Force on Process Mining, becoming the new standard for event logs [23].
Making the parallelism with MXML, the XES log element is equivalent to the MXML WorkflowLog
element, the XES trace element is equivalent to MXML’s Process Instance and the XES event element
replaces the AuditTrailEntry element [24].
Those three elements (log, trace and event) define only the structure of the document and do not
contain any kind of information; all the information stored in XES is stored in attributes. Those attributes
can be standard extensions (like the concept extension that includes the name and the instance of the
17

event or the time extension which includes the timestamp) or can be extensions defined by the users [23].
This increases the flexibility and the expressivity of this standard compared with the SA-MXML and
therefore, make XES the most viable alternative for semantic annotations.
3.8 SPARQL
The Simple Protocol and RDF Query Language (SPARQL) is a W3C recommended semantic query
language, used for querying RDF data models [25]. SPARQL is somewhat analogous to SQL; while SQL
is designed to query relational data, SPARQL is used to query any data source that can be mapped to
RDF. Therefore, SPARQL is used to query ontologies and obtains the result in the form of a RDF graph.
3.9 Jena
Jena 4 is a open source Java Resource Description Framework (RDF) framework that offers several
application programming interfaces (API) for the creation of data models (like RDF) and Ontologies
(like OWL). Jena is fundamentally an RDF platform that can navigate, manipulate and search upon
RDF models and uses those RDF data models to build an ontology formalisms on top of RDF.
4https://jena.apache.org/documentation/ontology/
18
Chapter 4
Design Science Research
In the field of Information Systems, there is a research paradigm based on the creation of arti-
facts with the objective of solving real-life problems. That paradigm is called Design Science Research
(DSRM) [26].
In contrast with other research paradigms, DSR has a more pratical, problem-oriented approach:
“Whereas natural sciences and social sciences try to understand reality, design science attempts to create
things that serve human purposes” [27].
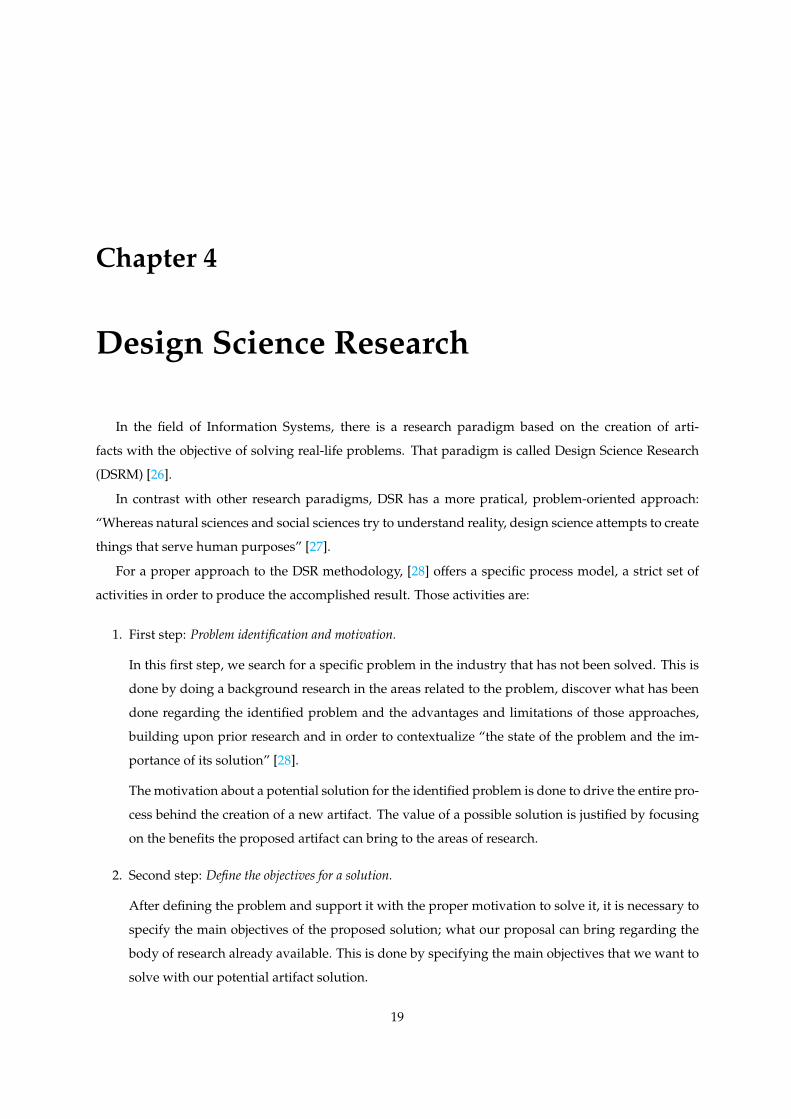
For a proper approach to the DSR methodology, [28] offers a specific process model, a strict set of
activities in order to produce the accomplished result. Those activities are:
1. First step: Problem identification and motivation.
In this first step, we search for a specific problem in the industry that has not been solved. This is
done by doing a background research in the areas related to the problem, discover what has been
done regarding the identified problem and the advantages and limitations of those approaches,
building upon prior research and in order to contextualize “the state of the problem and the im-
portance of its solution” [28].
The motivation about a potential solution for the identified problem is done to drive the entire pro-
cess behind the creation of a new artifact. The value of a possible solution is justified by focusing
on the benefits the proposed artifact can bring to the areas of research.
2. Second step: Define the objectives for a solution.
After defining the problem and support it with the proper motivation to solve it, it is necessary to
specify the main objectives of the proposed solution; what our proposal can bring regarding the
body of research already available. This is done by specifying the main objectives that we want to
solve with our potential artifact solution.
19
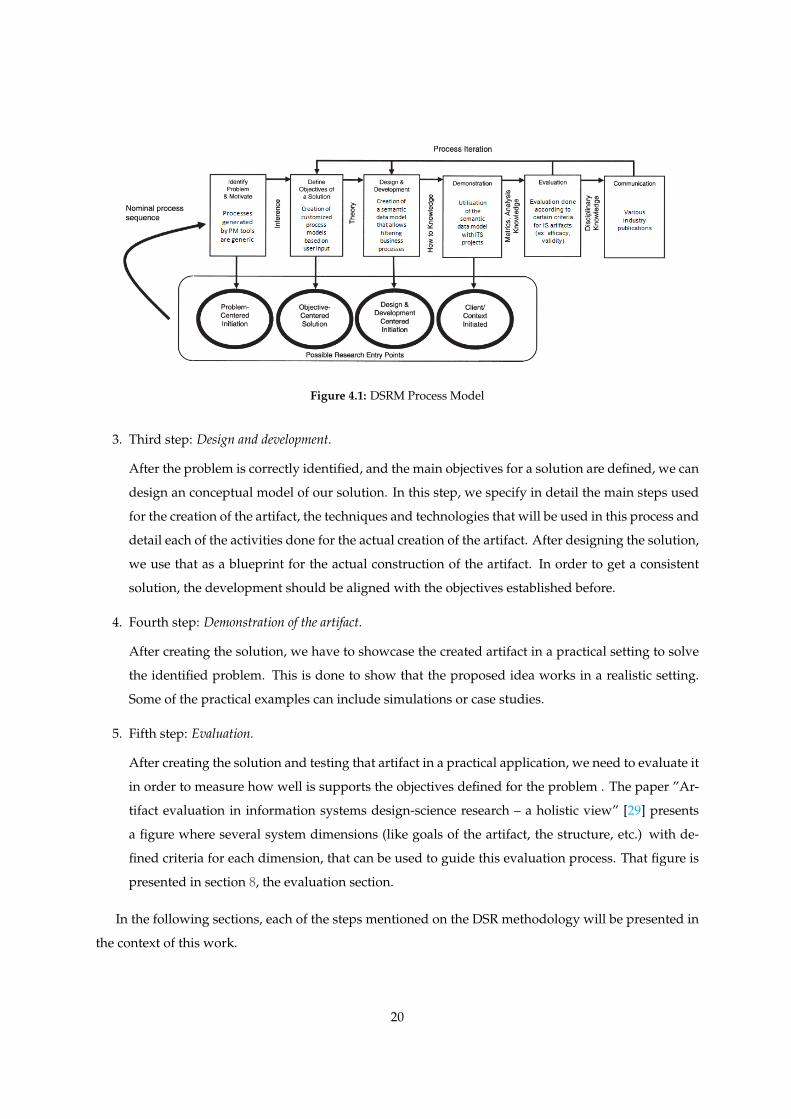
Figure 4.1: DSRM Process Model
3. Third step: Design and development.
After the problem is correctly identified, and the main objectives for a solution are defined, we can
design an conceptual model of our solution. In this step, we specify in detail the main steps used
for the creation of the artifact, the techniques and technologies that will be used in this process and
detail each of the activities done for the actual creation of the artifact. After designing the solution,
we use that as a blueprint for the actual construction of the artifact. In order to get a consistent
solution, the development should be aligned with the objectives established before.
4. Fourth step: Demonstration of the artifact.
After creating the solution, we have to showcase the created artifact in a practical setting to solve
the identified problem. This is done to show that the proposed idea works in a realistic setting.
Some of the practical examples can include simulations or case studies.
5. Fifth step: Evaluation.
After creating the solution and testing that artifact in a practical application, we need to evaluate it
in order to measure how well is supports the objectives defined for the problem . The paper ”Ar-
tifact evaluation in information systems design-science research – a holistic view” [29] presents
a figure where several system dimensions (like goals of the artifact, the structure, etc.) with de-
fined criteria for each dimension, that can be used to guide this evaluation process. That figure is
presented in section 8, the evaluation section.
In the following sections, each of the steps mentioned on the DSR methodology will be presented in
the context of this work.
20
Chapter 5
Problem Identification
As mentioned in Chapter 2, managing issues of a software project is a complicated task. The bug
reports and feature requests as well as all the other kinds of issues are difficult to coordinate in a effi-
cient way. For that reason, there are information systems (called ITS systems) that are responsible for
gathering all types of issues regarding a software project, and provide a way to handle the issues in a
structured and centralized way.
Usually, a ITS stores and manages all the information about issues in a software project. We can use
those systems to track information regarding the lists of issues, but we cannot obtain tangible informa-
tion regarding the efficiency and the effectiveness about the internal business processes of those issues,
and the processes of the team(s) responsible to solve the issues.
However, we can use the stored information by hundreds / thousands of issues and analyse them
in bulk in a process-centric point-of-view, to have a more in-depth view of how the ITS is being used by
the users that are responsible to deal with the issues of a project.
The PM research area, allows to discover the real business process and to understand how are people
really solving those issues, since the creation of the process is based on the real data stored in the system.
To do PM, we need an event log with four elements: the case identifier, the timestamp, the resource and
the activity that is executed. This activity is a certain field that changes over time.
The two existing process mining tools (ProM and Disco) already generate process models automati-
cally using a event log with these characteristics, but only take one chosen activity into account. How-
ever, for certain information systems (like ITS), this approach is limited since a single activity does not
provide a full scope of the business process.
For a practical example, let’s use the status of an issue as an example. A status represents the present
situation of the issue during its lifecycle. If we use ProM or Disco and analyse the status progession of a
list of issues, we create an automated business process that represents the real status progression during
the execution of an issue, as seen in Figure 5.1.
21
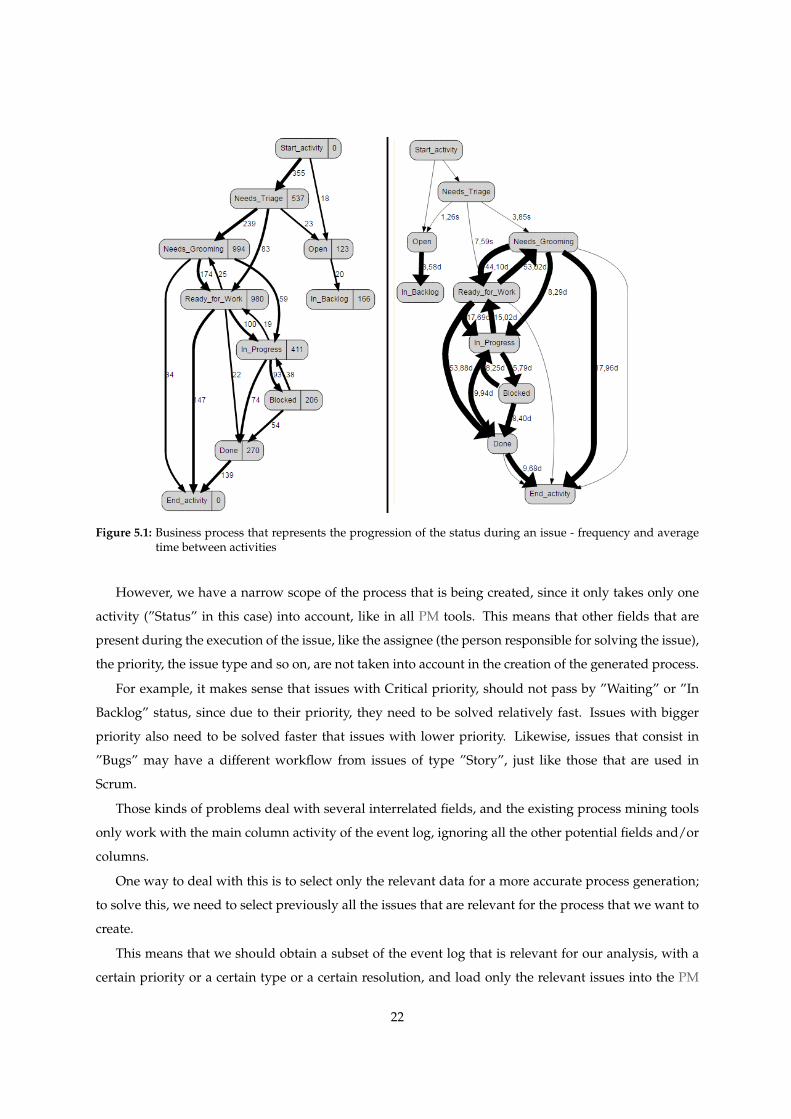
Figure 5.1: Business process that represents the progression of the status during an issue - frequency and averagetime between activities
However, we have a narrow scope of the process that is being created, since it only takes only one
activity (”Status” in this case) into account, like in all PM tools. This means that other fields that are
present during the execution of the issue, like the assignee (the person responsible for solving the issue),
the priority, the issue type and so on, are not taken into account in the creation of the generated process.
For example, it makes sense that issues with Critical priority, should not pass by ”Waiting” or ”In
Backlog” status, since due to their priority, they need to be solved relatively fast. Issues with bigger
priority also need to be solved faster that issues with lower priority. Likewise, issues that consist in
”Bugs” may have a different workflow from issues of type ”Story”, just like those that are used in
Scrum.
Those kinds of problems deal with several interrelated fields, and the existing process mining tools
only work with the main column activity of the event log, ignoring all the other potential fields and/or
columns.
One way to deal with this is to select only the relevant data for a more accurate process generation;
to solve this, we need to select previously all the issues that are relevant for the process that we want to
create.
This means that we should obtain a subset of the event log that is relevant for our analysis, with a
certain priority or a certain type or a certain resolution, and load only the relevant issues into the PM
22
tools.
Since there are several categories for several of those types, it may be a daunting task to select man-
ually each log in detail and potentially having dozens or hundreds of logs for all the process mining
iterations.
In order to deal with the diversity of processes (since they are created directly from the data stored
in the information systems), and to avoid creating manually hundreds of logs, an additional layer in the
usual process mining architecture is proposed: a data model that contains all the event log information
and establishes the relation between the different fields.
With a model that stores all the information related about issue tracking and its progression since
the inception of a certain issue until its resolution, we can create parametrized queries to obtain only the
relevant information in a form of an event log.
The main motivation of this approach consists in creating a metamodel that represents a ITS and the
relations between the different fields, convert that metamodel in a database that is responsible for all
the event log information, and creating parametrized queries responsible for filtering automatically the
relevant part of the event log that is responsible for the process creation.
By simplyfying the creation of automated process models, and taking into account all the require-
ments when creating a process model, with our proposal we can obtain a more detailed and accurate
perspective of the process in question, since we consider the entire scope of an ITS system and all its
fields into account, instead of getting only the activity field that creates the business process.
With that, we can delve into the relation of different fields during the execution of the process and
interrelate the different kinds of activities, in order to obtain more value of the existing data and opti-
mize the existing resources (persons, processes, etc.) by taking into account the results of the internal
processes.
5.1 Goals
The main objective of this thesis is to create a more sophisticated approach in the creation of process
models, by allowing the end user to choose the input for the process model creation.
To do this, instead of using directly an event log for the creation of business processes, this thesis
proposes an added architecture change in the process mining approach.
This new architecture layer is based on the existance of a semantic data model that stores all the
information from the event log, adds the respective annotations from the logs, and specifies different
process models according to the different fields that occur during the issue execution.
For a practical approach of the proposed solution, it is presented an artifact that delves into more
detail regarding the creation of process models, allowing the user to select the relevant fields in a knowl-
23
edge base in order to obtain a more concise and accurate process model.
To reach that goal, there are a set of objectives that need to be fulfilled. Those objectives are:
1. Creation a metamodel that represents the different fields in a issue tracking system;
2. Converting that metamodel in a knowledge base that is capable of storing all the issue tracking
information including the respective semantic annotations;
3. Create SPARQL queries that allow the user to select certain subsets of the event log to obtain a
tailored process;
4. Define a set of metrics that support a process-centric point of view and are used to evaluate the
efficiency of the processes.
In the next section, we will explain in detail our proposal that allows us to achieve the proposed
objectives.
24

Chapter 6
Proposal
As a proposal to the problem identified above, this section presents the main elements of the sug-
gested solution, and specifies all the design and development steps of our proposal.
Afterwards, the activity sequence with all the development steps is explained in practice, in the
context of the created artifact.
6.1 Defining the objectives for a solution
As mentioned in chapter 5, instead of having the usual process mining approach that consists in ob-
taining an event log and converting that log automatically in a business process, our proposal consists
in storing the data in a model that may be queried, in order to obtain more customizable and more accu-
rate business processes and that take into account the several variables that occur during the execution
of a process.
In order to implement our proposal, we need three building blocks that are the crux of the proposed
solution. The elements that represent our proposal are:
1. Creation of a metamodel that represents the data of a issue tracking system: we analysed the
existing data in issue tracking systems in order to design a model that will store all the relevant
issue data. This metamodel is an explicit representation of the main fields that exist in this kind of
information systems and establishes the relations and structure between them.
2. Implementation of an ontology based upon the created issue tracking meta-model: After creating
the metamodel, we need a storage unit to store the data that represents the issues.
There are two main data models: databases and ontologies. Several papers compare the main
differences between them, and the advantages over one another [30]. Although, databases are
25
the main data model to manage information, ontologies provide ”a restriction-free framework to
represent a machine readable reality”. [30].
Even though there are several elements that are analogous to each other, between databases and
ontologies, we opted for using an ontology for two main reasons:
• First, we want to give a semantic context to the data. By giving a description of the fields that
are being analysed, the process mining analysis will be richer, since the main words/labels
have an associated description that allow the end-user to understand the meaning behing
those words.
This will be done by adding a repository of annotations to the knowledge base model that
helps the users in the process analysis by giving a definition of the existing terms, and conse-
quently, a meaning to the ”labels” that they represent.
Furthermore, since an ontology is defined in ”an open world in which information can be
explicitly defined, shared, reused or distributed” [30], the different fields (status, priority, etc)
that are used in different projects and have a meaning behind them, using an ontology as a
data model is benefic because it becomes a way to centralize all those different fields and all
the different meanings in one knowledge base.
• Second, the model schema and data are integrated in a logical way and are relatively easy to
maintain and update. This means that, once someone has the log data in the correct format
and loads the file to the base ontology (an OWL file), the data-filled ontology serves as a
”portable” data model that can be easily transferred or loaded into the proposed artifact for
the creation of more accurate process models. Also the open nature of ontologies allow it
to add more concepts, without altering the existing queries that already filter a subset of the
existing data.
So, we use the model to create an ontology in order to store the actual data and give context and
structure to the model of a ITS .
3. Creation of SPARQL queries in order to obtain the relevant subset of data from the model, for a
more accurate process model creation. As mentioned before, those event logs only consider the
main four columns and disregard other variables in the context of the creation of the automated
business process.
By allowing parameters chosen by the user in the creation of those models, the proposed artifact
will create more detailed processes based on the different data registered by the event logs, allowing for
business processes tailored for each specific case.
26
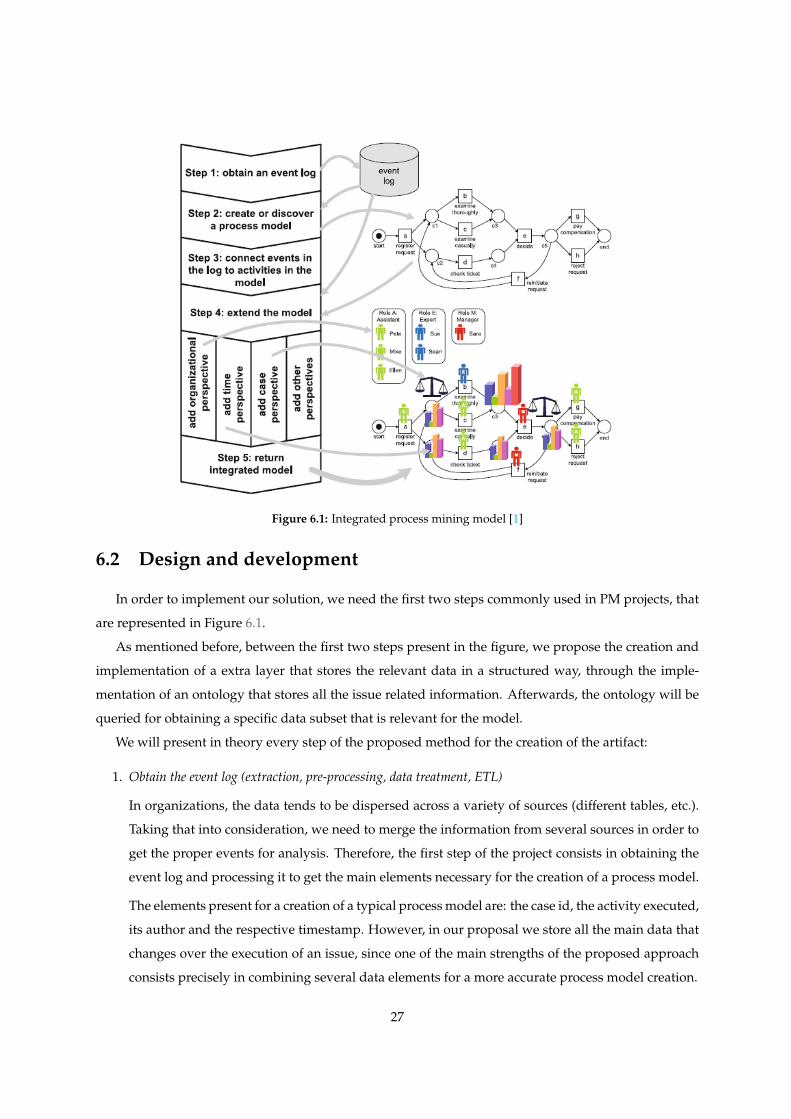
Figure 6.1: Integrated process mining model [1]
6.2 Design and development
In order to implement our solution, we need the first two steps commonly used in PM projects, that
are represented in Figure 6.1.
As mentioned before, between the first two steps present in the figure, we propose the creation and
implementation of a extra layer that stores the relevant data in a structured way, through the imple-
mentation of an ontology that stores all the issue related information. Afterwards, the ontology will be
queried for obtaining a specific data subset that is relevant for the model.
We will present in theory every step of the proposed method for the creation of the artifact:
1. Obtain the event log (extraction, pre-processing, data treatment, ETL)
In organizations, the data tends to be dispersed across a variety of sources (different tables, etc.).
Taking that into consideration, we need to merge the information from several sources in order to
get the proper events for analysis. Therefore, the first step of the project consists in obtaining the
event log and processing it to get the main elements necessary for the creation of a process model.
The elements present for a creation of a typical process model are: the case id, the activity executed,
its author and the respective timestamp. However, in our proposal we store all the main data that
changes over the execution of an issue, since one of the main strengths of the proposed approach
consists precisely in combining several data elements for a more accurate process model creation.
27

2. Create the base model that represents for issue tracking systems
To store all the information that is related to the issues, we need a model that is capable of rep-
resenting all the data related to an issue execution. After obtaining the event log and analyzing
thoroughly the elements that are present in the history of an issue, we select the relevant fields to
create a model that represents a issue tracking system.
The fields that are present in most of the issues and were mentioned before in section 2) are: issue
type, resolution, priority, assignee, timestamp (which logs every single change that occurs) and
the changed field (that indicates every field that was changed during the execution of an issue).
Therefore, a model with those fields will be constructed.
3. Build the core ontology for issue tracking systems
After creating the metamodel and having a extended knowledge of them, the next step consists
in a creation of an ontology based on the logs and the processes created by the existing data. The
created ontology contextualizes the logs and relates the different fields, giving them meaning in
the overall scope of the existing processes in ITS and providing different perspectives (including
organizational or task-based) for the same data.
In order to create the ontology, a top-down development process was used, defining the broader
concepts present in an ITS and establishing the relations between them [16].
To create an ontology, we use Protege (section 3.9) that contains a Graphical User Interface (GUI)
for a simple ontology creation and follow the tips mentioned in section 3.5. After defining the
issue tracking model, we set up the created ontology in a OWL file and load the ontology file to
Jena to instanciate the ontology.
4. Annotate the different fields with an semantic meaning
The idea behind the utilization of an ontology is to share an explicit model that represents a struc-
ture of a domain.
Considering that all the fields (either Priority, Status, Issue Type, etc.) are customizable by the
software teams, the single label that characterizes that kind of field, does not offer a meaningful
way for the user to understand and interpret the inherent meaning of the words used.
Since one of the main objectives of using an ontology is to get a common understanding of the
designated field, it makes sense to collect and describe every single possible field and add a proper
description about them.
Taking into account that several of those fields (issue types, resolution, priority) are common to
different projects, that makes it easier to determine the meaning behind the label and help in the
28
reuse and the maintenance of those fields by different ITS. To do this, several ITS projects from
different sources were extracted and the meaning related to the respective fields was gathered.
Although this is a manual task, this approach can be beneficial for two reasons:
(a) The first one is inherent to the benefit of using ontologies; since models like these are sup-
posed to be shared as an consensual representation of a domain in the web, everyone that
works with ITS, can share the concepts they are working with and consequently, have a sin-
gle representation of those fields;
(b) The second one, is that we need to get the description of a field only once. All the future uses
of the artifact already have that term stored with a proper description that represents that
label.
This means that the next time the event log data is loaded into the base ontology, if the term
already exists there, will bring a proper description to the artifact, if not, will be used a single
term without any desciption just like a regular database without any meaning associated.
For example, the term ”Bug” used by different issue tracking systems has, more or less, the same
meaning. This means that we only need to add that term once to the base model with a description
of what the term means.
For each issue tracking project analysed in the demonstration of the artifact, the general terms in
the base model were stored with the respective description. Since a lot of those terms are univer-
sal between ITS, the more projects that are analysed, the richer will be the representation of the
domain knowledge that represents an ITS. The process of adding fields and a proper description
to them is also done manually using Protege.
Furthermore, if different projects use labels that might have similar definitions, there is no need
to ”reinvent the wheel”; a list of all fields in a publicly available model might already have an
associated definition.
5. Load the issue data into the existing model ontology
After creating the ontology that represents the model of a ITS, we need to fill the base model with
data.
However, instead of containing information related to only one activity (just like its done in the
regular PM tools), all the existing information relevant for an ITS is loaded into the model.
6. Structure the queries in order to obtain an parametrized event log
As mentioned before, one of the main characteristics compared with the existing tools is that those
tools simply get an existing event log and create directly the process model.
29

Considering that we used an ontology as the model that contains all the data related to a ITS
project, SPARQL queries are used to extract the data we are interested in to create the process
model.
7. Implementation of a process mining algorithm from the produced event log
Since the main tools already use a proper algorithm that converts the data into the business pro-
cess, its necessary a implementation of a PM algorithm that receives a subset of the event log and
converts them into the tailored process we want to create.
The alternative consists in obtaining the event log and loading that log into a tool like ProM or
Disco, but that would negate the benefit of this artifact, since loading the logs one by one would
be counterproducent to the fact of having a system that parametrizes the fields of a data model
based on a bigger event log, and from there, generate the process automatically.
This algorithm includes a filtering process (just like those implemented in ProM and Disco) that
allow the user to choose the most frequent activities and paths of a certain process model, in order
to understand in more detail the created process.
Furthermore, the artifact also allows the exploration of the log in a case-by-case basis by allowing
to see the progression of a single issue.
8. Select a set of metrics to analyze the systems in a process-centric point of view
One of main problems of the issue tracking systems is that they have all the detailed information
about the evolution of an issue over time, but do not have a process perspective that would be
beneficial to understand how the issues are really being solved in practice.
As mentioned before, process mining tools can provide the process-centric point of view but are
limited to a single activity each time. Therefore, we chose a set of metrics that helped the software
team to analyze with detail the efficiency of the issue tracking processes and permit the compari-
son between different process models.
The chosen process based metrics are:
(a) See if the more urgent tickets are those who are solved first
(b) Compare minimum, average and maximum times for a certain issue regarding other different
kinds of fields (status, issue types, resolution)
(c) See the median, average and maximum number of times that a certain field is changed in a
issue (ex: if an issue has its status chosen 30 times over its execution, this probably means
that there are several bottlenecks during the execution of that process)
30
6.3 Activity sequence
The major components that support our solution were implemented in a prototype that contains
three main features:
1. First, is the data extraction that covers the part of extracting the issue data, and converting it into
an event log.
2. After that, the data loading part uses the base ontology with all the relations between terms found
in the log, and loads the content of the full event log into the ontology to obtain a complete model
representation of one issue tracking project.
3. Finally, the process mining creation, that is responsible for parametrizing the input of the user
via field selection and selecting the relevant data that will create a personalized business process
model.
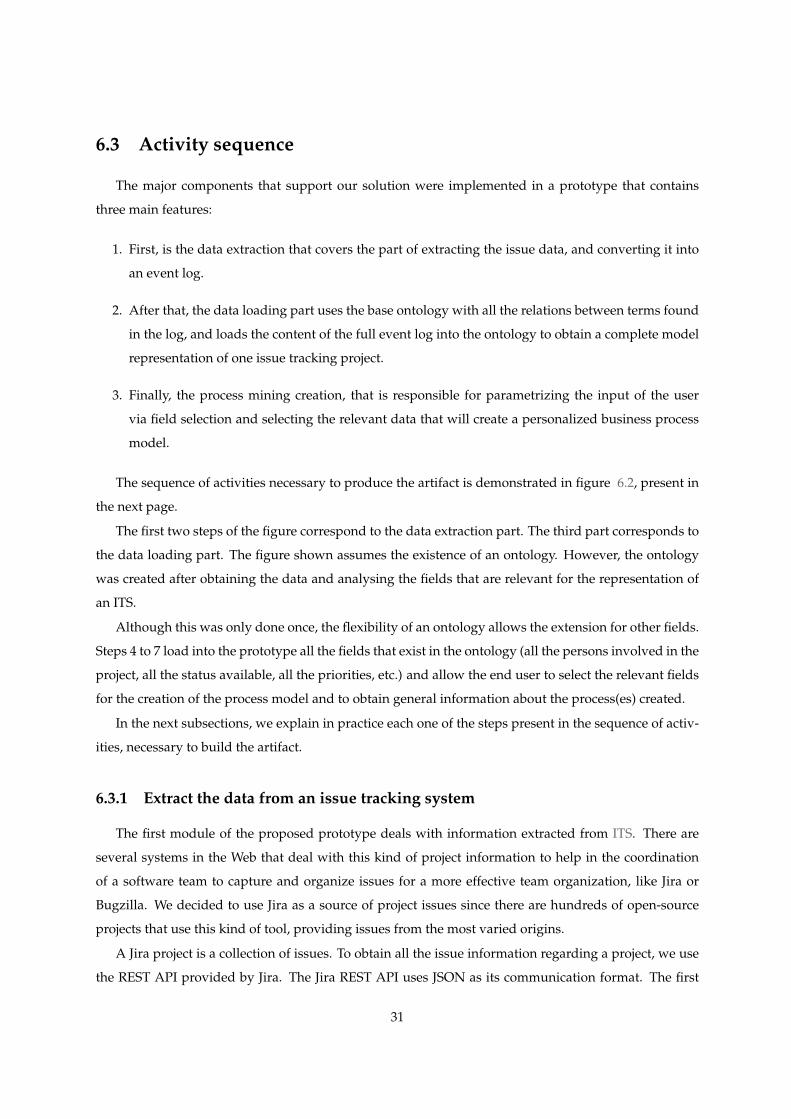
The sequence of activities necessary to produce the artifact is demonstrated in figure 6.2, present in
the next page.
The first two steps of the figure correspond to the data extraction part. The third part corresponds to
the data loading part. The figure shown assumes the existence of an ontology. However, the ontology
was created after obtaining the data and analysing the fields that are relevant for the representation of
an ITS.
Although this was only done once, the flexibility of an ontology allows the extension for other fields.
Steps 4 to 7 load into the prototype all the fields that exist in the ontology (all the persons involved in the
project, all the status available, all the priorities, etc.) and allow the end user to select the relevant fields
for the creation of the process model and to obtain general information about the process(es) created.
In the next subsections, we explain in practice each one of the steps present in the sequence of activ-
ities, necessary to build the artifact.
6.3.1 Extract the data from an issue tracking system
The first module of the proposed prototype deals with information extracted from ITS. There are
several systems in the Web that deal with this kind of project information to help in the coordination
of a software team to capture and organize issues for a more effective team organization, like Jira or
Bugzilla. We decided to use Jira as a source of project issues since there are hundreds of open-source
projects that use this kind of tool, providing issues from the most varied origins.
A Jira project is a collection of issues. To obtain all the issue information regarding a project, we use
the REST API provided by Jira. The Jira REST API uses JSON as its communication format. The first
31
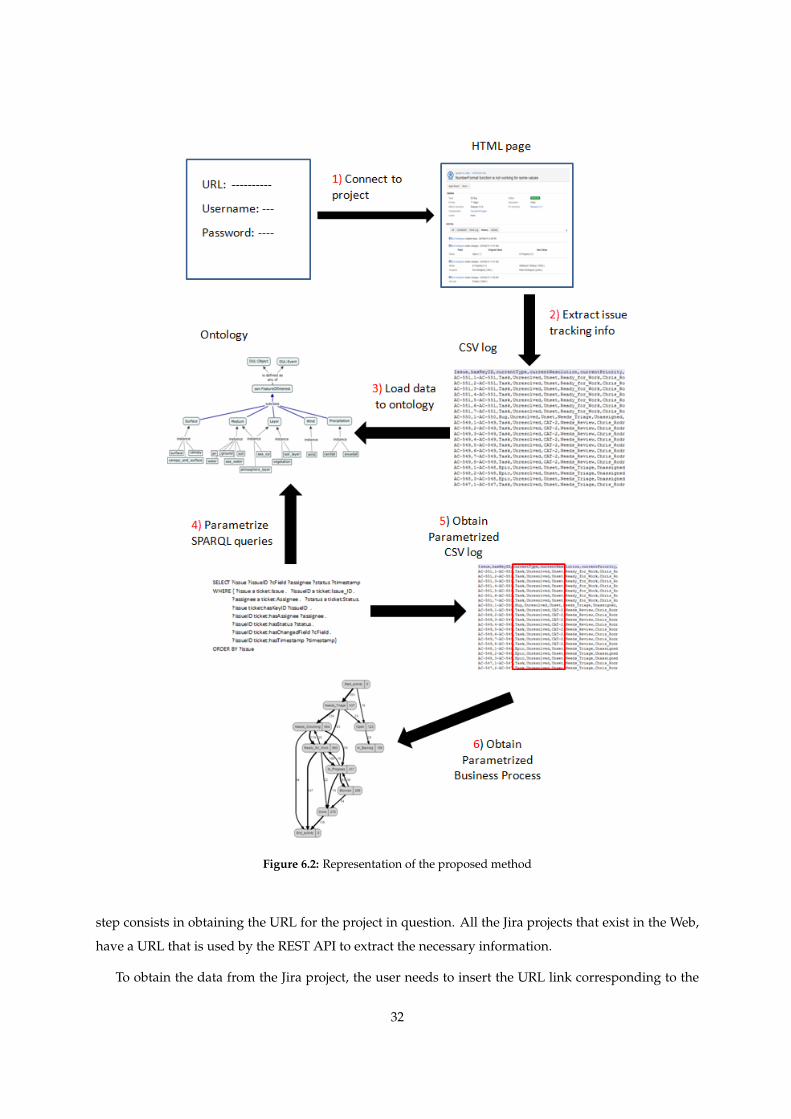
Figure 6.2: Representation of the proposed method
step consists in obtaining the URL for the project in question. All the Jira projects that exist in the Web,
have a URL that is used by the REST API to extract the necessary information.
To obtain the data from the Jira project, the user needs to insert the URL link corresponding to the
32
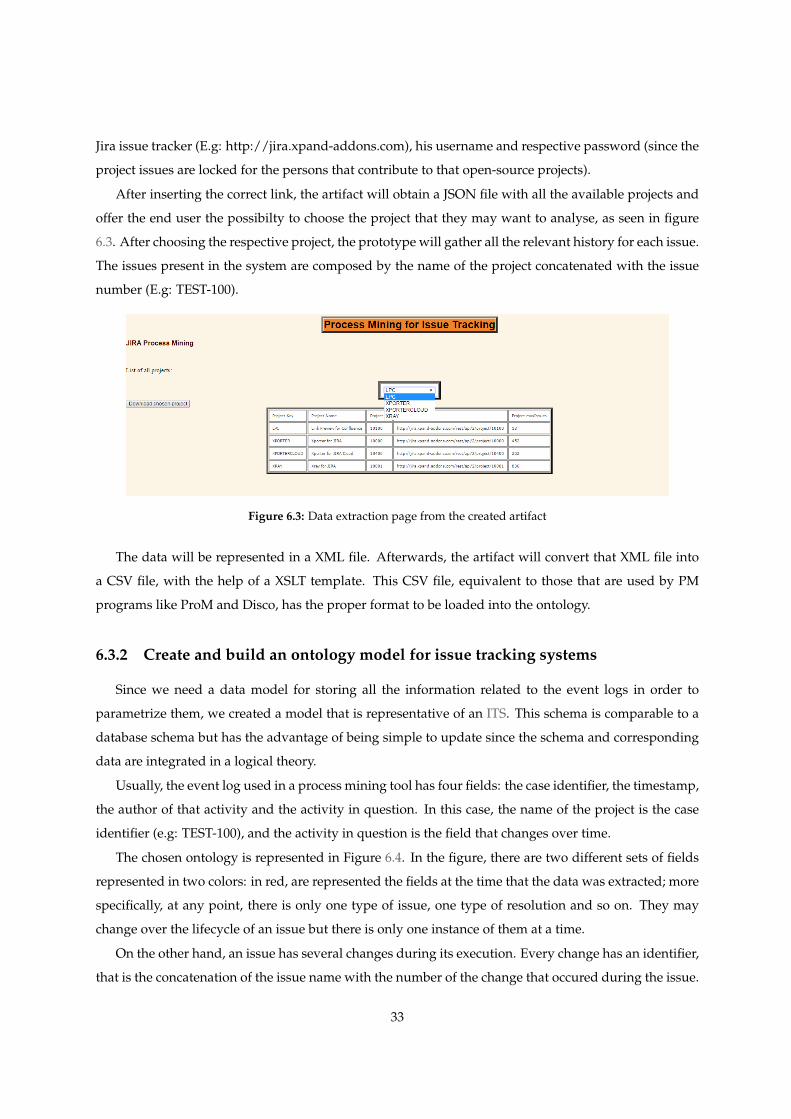
Jira issue tracker (E.g: http://jira.xpand-addons.com), his username and respective password (since the
project issues are locked for the persons that contribute to that open-source projects).
After inserting the correct link, the artifact will obtain a JSON file with all the available projects and
offer the end user the possibilty to choose the project that they may want to analyse, as seen in figure
6.3. After choosing the respective project, the prototype will gather all the relevant history for each issue.
The issues present in the system are composed by the name of the project concatenated with the issue
number (E.g: TEST-100).
Figure 6.3: Data extraction page from the created artifact
The data will be represented in a XML file. Afterwards, the artifact will convert that XML file into
a CSV file, with the help of a XSLT template. This CSV file, equivalent to those that are used by PM
programs like ProM and Disco, has the proper format to be loaded into the ontology.
6.3.2 Create and build an ontology model for issue tracking systems
Since we need a data model for storing all the information related to the event logs in order to
parametrize them, we created a model that is representative of an ITS. This schema is comparable to a
database schema but has the advantage of being simple to update since the schema and corresponding
data are integrated in a logical theory.
Usually, the event log used in a process mining tool has four fields: the case identifier, the timestamp,
the author of that activity and the activity in question. In this case, the name of the project is the case
identifier (e.g: TEST-100), and the activity in question is the field that changes over time.
The chosen ontology is represented in Figure 6.4. In the figure, there are two different sets of fields
represented in two colors: in red, are represented the fields at the time that the data was extracted; more
specifically, at any point, there is only one type of issue, one type of resolution and so on. They may
change over the lifecycle of an issue but there is only one instance of them at a time.
On the other hand, an issue has several changes during its execution. Every change has an identifier,
that is the concatenation of the issue name with the number of the change that occured during the issue.
33
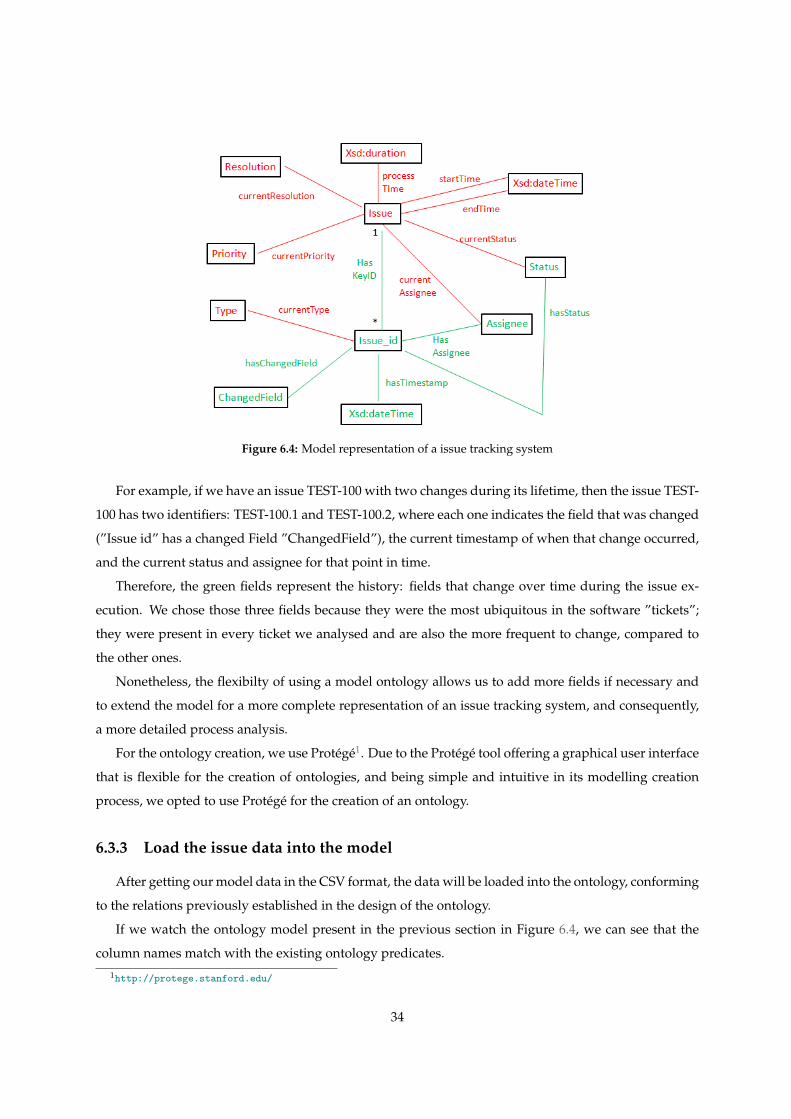
Figure 6.4: Model representation of a issue tracking system
For example, if we have an issue TEST-100 with two changes during its lifetime, then the issue TEST-
100 has two identifiers: TEST-100.1 and TEST-100.2, where each one indicates the field that was changed
(”Issue id” has a changed Field ”ChangedField”), the current timestamp of when that change occurred,
and the current status and assignee for that point in time.
Therefore, the green fields represent the history: fields that change over time during the issue ex-
ecution. We chose those three fields because they were the most ubiquitous in the software ”tickets”;
they were present in every ticket we analysed and are also the more frequent to change, compared to
the other ones.
Nonetheless, the flexibilty of using a model ontology allows us to add more fields if necessary and
to extend the model for a more complete representation of an issue tracking system, and consequently,
a more detailed process analysis.
For the ontology creation, we use Protege1. Due to the Protege tool offering a graphical user interface
that is flexible for the creation of ontologies, and being simple and intuitive in its modelling creation
process, we opted to use Protege for the creation of an ontology.
6.3.3 Load the issue data into the model
After getting our model data in the CSV format, the data will be loaded into the ontology, conforming
to the relations previously established in the design of the ontology.
If we watch the ontology model present in the previous section in Figure 6.4, we can see that the
column names match with the existing ontology predicates.
1http://protege.stanford.edu/
34
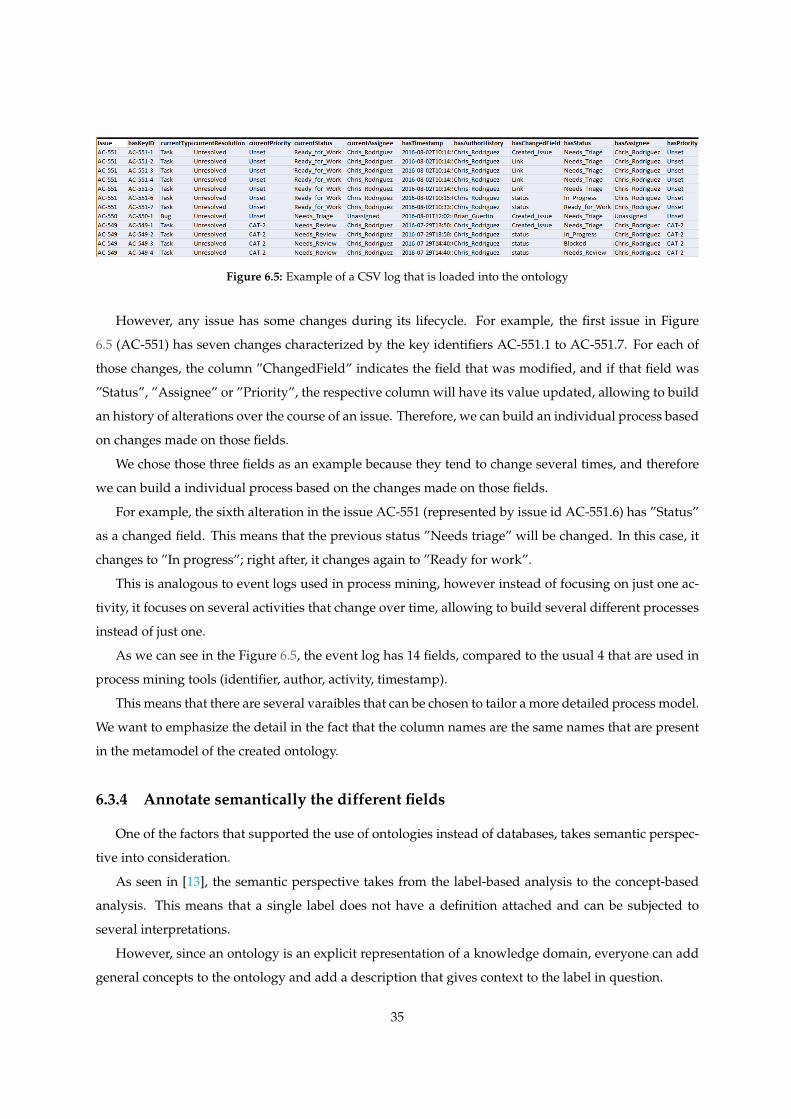
Figure 6.5: Example of a CSV log that is loaded into the ontology
However, any issue has some changes during its lifecycle. For example, the first issue in Figure
6.5 (AC-551) has seven changes characterized by the key identifiers AC-551.1 to AC-551.7. For each of
those changes, the column ”ChangedField” indicates the field that was modified, and if that field was
”Status”, ”Assignee” or ”Priority”, the respective column will have its value updated, allowing to build
an history of alterations over the course of an issue. Therefore, we can build an individual process based
on changes made on those fields.
We chose those three fields as an example because they tend to change several times, and therefore
we can build a individual process based on the changes made on those fields.
For example, the sixth alteration in the issue AC-551 (represented by issue id AC-551.6) has ”Status”
as a changed field. This means that the previous status ”Needs triage” will be changed. In this case, it
changes to ”In progress”; right after, it changes again to ”Ready for work”.
This is analogous to event logs used in process mining, however instead of focusing on just one ac-
tivity, it focuses on several activities that change over time, allowing to build several different processes
instead of just one.
As we can see in the Figure 6.5, the event log has 14 fields, compared to the usual 4 that are used in
process mining tools (identifier, author, activity, timestamp).
This means that there are several varaibles that can be chosen to tailor a more detailed process model.
We want to emphasize the detail in the fact that the column names are the same names that are present
in the metamodel of the created ontology.
6.3.4 Annotate semantically the different fields
One of the factors that supported the use of ontologies instead of databases, takes semantic perspec-
tive into consideration.
As seen in [13], the semantic perspective takes from the label-based analysis to the concept-based
analysis. This means that a single label does not have a definition attached and can be subjected to
several interpretations.
However, since an ontology is an explicit representation of a knowledge domain, everyone can add
general concepts to the ontology and add a description that gives context to the label in question.
35

We will give a practical example that explains the usefulness of semantic annotations in this project.
One of the extracted projects has issues with priority CAT-1 until CAT-5.
Although, the software team that implemented that priorities in their ITS can understand the inner
meaning between the issues of different priorities, to someone that is not working with the project in
question, those labels do not tell absolutely nothing about those issues. However, a detailed research on
the source project shows the following descriptions:
• CAT-1 - Extremly disruptive, cannot release until resolved
• CAT-2 - Very high priority. Needs to be resolved in short time range
• CAT-3 - Infrequent, serious bugs. Should fix in near term
• CAT-4 - Unsure when we are going to fix this
• CAT-5 - A low impact, low urgency issue
• N/A - This issue did not require any action, so this field does not apply.
With this additional meaning, we can understand that there is an priority order in which those issues
need to be solved; in a pool of several issues, those with CAT-1 need to be solved first, after that, it is the
issues with CAT-2, and so on. This means that, we have a priority order in terms of importance (CAT-1
>CAT-2 >CAT-3 >CAT-4 >CAT-5 ), something the end user could never understand, without a proper
description of the meaning of those fields.
Furthermore, the process analysis between issues with those priorities mean that the issues with
priority CAT-1 need to be solved in less time than issues with CAT-2 and so on.
This kind of information is not readily available, and the utilization of an ontology that contains a
list of descriptions, allows a more in-depth analysis in the creation of the parametrized process models
with those labels, since they are accompanied by a proper description.
The utilization of an ontology as a repository of terms is precisely a way to merge those different con-
cepts and sustain a knowledge base in an area where those terms have generally a common description
but there is not any place where those terms are explicitly and clearly defined.
Between the data loading part and the process creation, there is a manual process regarding the
collection of semantic annotations.
To build that collection, we choose a software project to load into the base model. The data from
different fields is loaded automatically into the ontology. However, the fields do not have an inherent
definition attached to them. Let’s use the term ”Bug” as an example. For those who are not in the
software area ,”Bug” may have a different meaning than the software one, but the definition ”A problem
which impairs or prevents the functions of the product” gives a broader approach to the context of the
word.
36
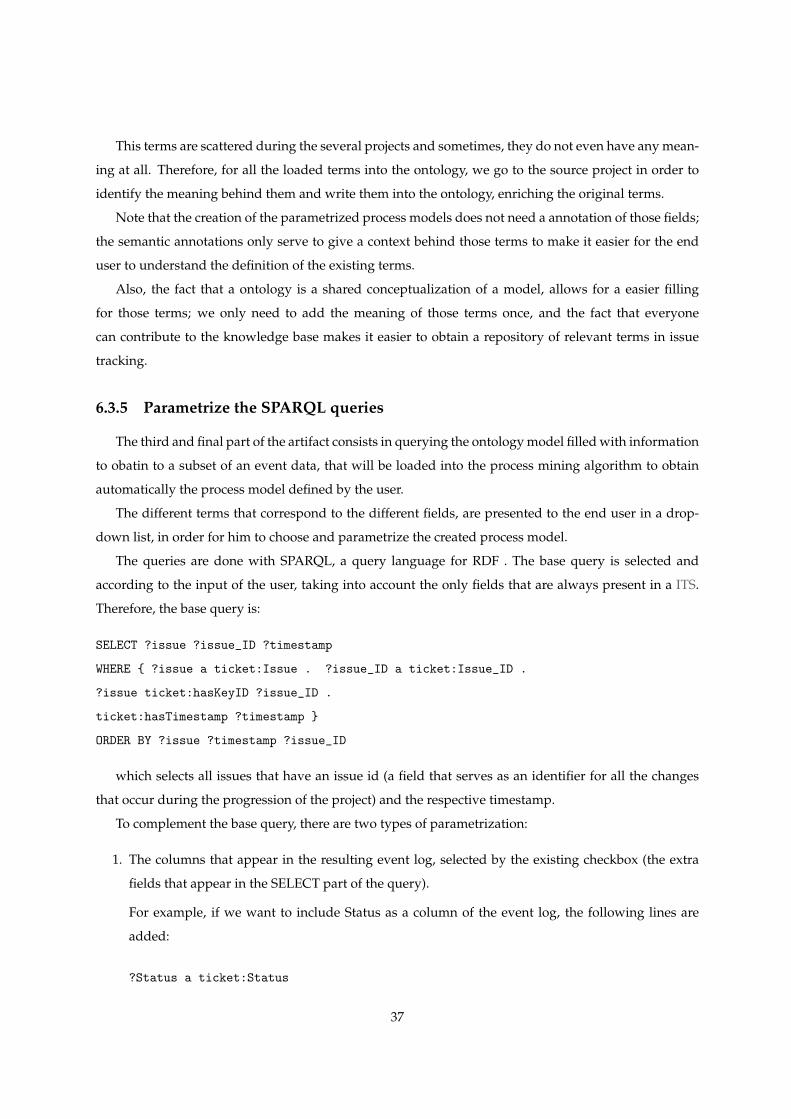
This terms are scattered during the several projects and sometimes, they do not even have any mean-
ing at all. Therefore, for all the loaded terms into the ontology, we go to the source project in order to
identify the meaning behind them and write them into the ontology, enriching the original terms.
Note that the creation of the parametrized process models does not need a annotation of those fields;
the semantic annotations only serve to give a context behind those terms to make it easier for the end
user to understand the definition of the existing terms.
Also, the fact that a ontology is a shared conceptualization of a model, allows for a easier filling
for those terms; we only need to add the meaning of those terms once, and the fact that everyone
can contribute to the knowledge base makes it easier to obtain a repository of relevant terms in issue
tracking.
6.3.5 Parametrize the SPARQL queries
The third and final part of the artifact consists in querying the ontology model filled with information
to obatin to a subset of an event data, that will be loaded into the process mining algorithm to obtain
automatically the process model defined by the user.
The different terms that correspond to the different fields, are presented to the end user in a drop-
down list, in order for him to choose and parametrize the created process model.
The queries are done with SPARQL, a query language for RDF . The base query is selected and
according to the input of the user, taking into account the only fields that are always present in a ITS.
Therefore, the base query is:
SELECT ?issue ?issue_ID ?timestamp
WHERE { ?issue a ticket:Issue . ?issue_ID a ticket:Issue_ID .
?issue ticket:hasKeyID ?issue_ID .
ticket:hasTimestamp ?timestamp }
ORDER BY ?issue ?timestamp ?issue_ID
which selects all issues that have an issue id (a field that serves as an identifier for all the changes
that occur during the progression of the project) and the respective timestamp.
To complement the base query, there are two types of parametrization:
1. The columns that appear in the resulting event log, selected by the existing checkbox (the extra
fields that appear in the SELECT part of the query).
For example, if we want to include Status as a column of the event log, the following lines are
added:
?Status a ticket:Status
37
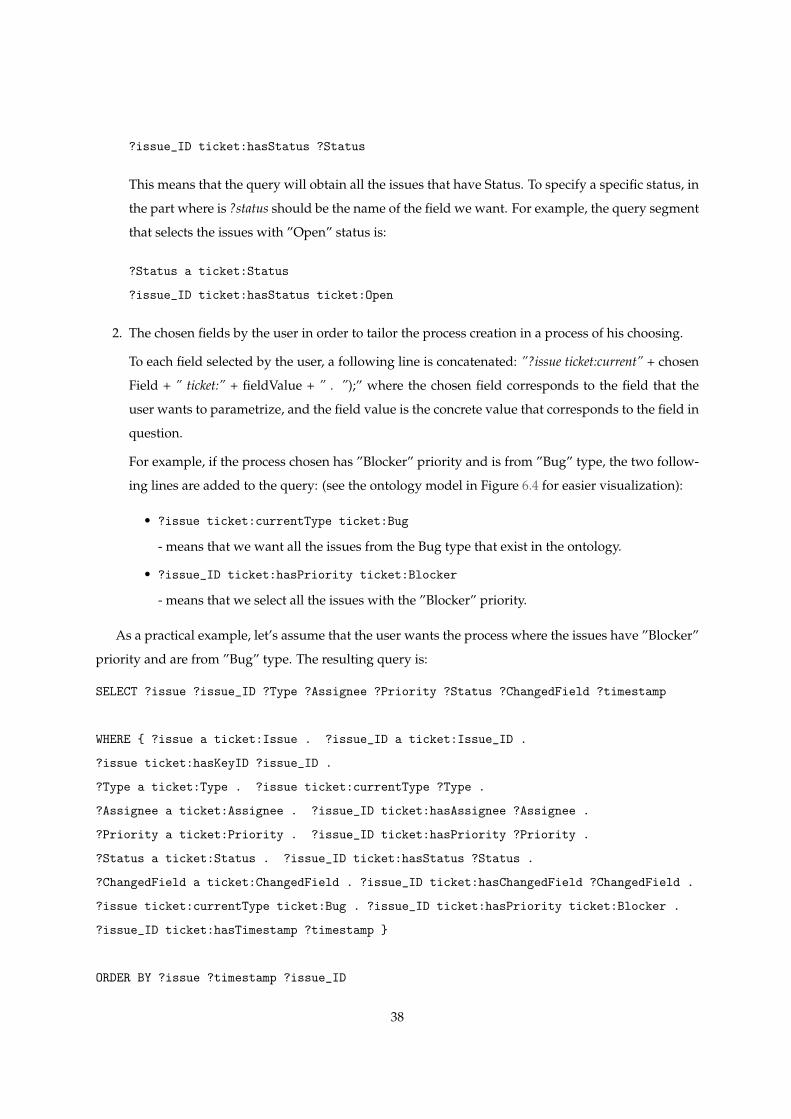
?issue_ID ticket:hasStatus ?Status
This means that the query will obtain all the issues that have Status. To specify a specific status, in
the part where is ?status should be the name of the field we want. For example, the query segment
that selects the issues with ”Open” status is:
?Status a ticket:Status
?issue_ID ticket:hasStatus ticket:Open
2. The chosen fields by the user in order to tailor the process creation in a process of his choosing.
To each field selected by the user, a following line is concatenated: ”?issue ticket:current” + chosen
Field + ” ticket:” + fieldValue + ” . ”);” where the chosen field corresponds to the field that the
user wants to parametrize, and the field value is the concrete value that corresponds to the field in
question.
For example, if the process chosen has ”Blocker” priority and is from ”Bug” type, the two follow-
ing lines are added to the query: (see the ontology model in Figure 6.4 for easier visualization):
• ?issue ticket:currentType ticket:Bug
- means that we want all the issues from the Bug type that exist in the ontology.
• ?issue_ID ticket:hasPriority ticket:Blocker
- means that we select all the issues with the ”Blocker” priority.
As a practical example, let’s assume that the user wants the process where the issues have ”Blocker”
priority and are from ”Bug” type. The resulting query is:
SELECT ?issue ?issue_ID ?Type ?Assignee ?Priority ?Status ?ChangedField ?timestamp
WHERE { ?issue a ticket:Issue . ?issue_ID a ticket:Issue_ID .
?issue ticket:hasKeyID ?issue_ID .
?Type a ticket:Type . ?issue ticket:currentType ?Type .
?Assignee a ticket:Assignee . ?issue_ID ticket:hasAssignee ?Assignee .
?Priority a ticket:Priority . ?issue_ID ticket:hasPriority ?Priority .
?Status a ticket:Status . ?issue_ID ticket:hasStatus ?Status .
?ChangedField a ticket:ChangedField . ?issue_ID ticket:hasChangedField ?ChangedField .
?issue ticket:currentType ticket:Bug . ?issue_ID ticket:hasPriority ticket:Blocker .
?issue_ID ticket:hasTimestamp ?timestamp }
ORDER BY ?issue ?timestamp ?issue_ID
38
This query returns an event log, that is loaded into the process mining algorithm that returns the
corresponding process model.
6.3.6 Process mining algorithm
Since our proposal consists in the creation of an artifact capable of generating dozens of business
processes over a single data model, it would be counterproductive to query the data model and, for
each attempt, use the resulting event log in an existing process mining tool to generate each process
individually.
That would defeat the whole purpose of our approach because each log would still be added man-
ually to a process mining tool, instead of having an artifact that can generate all the process variants by
itself.
Therefore, a PM algorithm similar to heuristic miner [31] was implemented to streamline the creation
of business processes based on selected data from the data model.
With the implementation of the PM algorithm, the artifact receives the user input, translates the
input into a subset of the event log, and that event log is redirected to the process mining algorithm,
generating the corresponding process model as an output.
In this variant of PM algorithm, a process model is modeled after a dependency graph and it is
composed by two elements: activities and paths.
1. Activities represent the main elements in a business process. They represent the vertexes of a
matrix
2. Paths are the connections between activities. They represent the edges of a matrix.
For example, if we have a status ”Open”, and a status ”In Progress” in the next line, we have two
activities and one path connecting those two activities; two vertexes and one edge connecting those two
vertexes.
The implemented algorithm is divided in three parts: the part related to activities, the part related to
paths, and the filtering part.
1. Activities
The first step consists in choosing the activity that we want to observe over time, and selecting
the respective column containing all activities that generate the business process. Afterwards, the
algorithm obtains an activity list based on the occurrence count of each different activity in the
event log.
Using the event log present in the Figure 6.6 as an example, we can see that the chosen activity that
will generate the process is the status change over the course of an issue. By counting the different
39
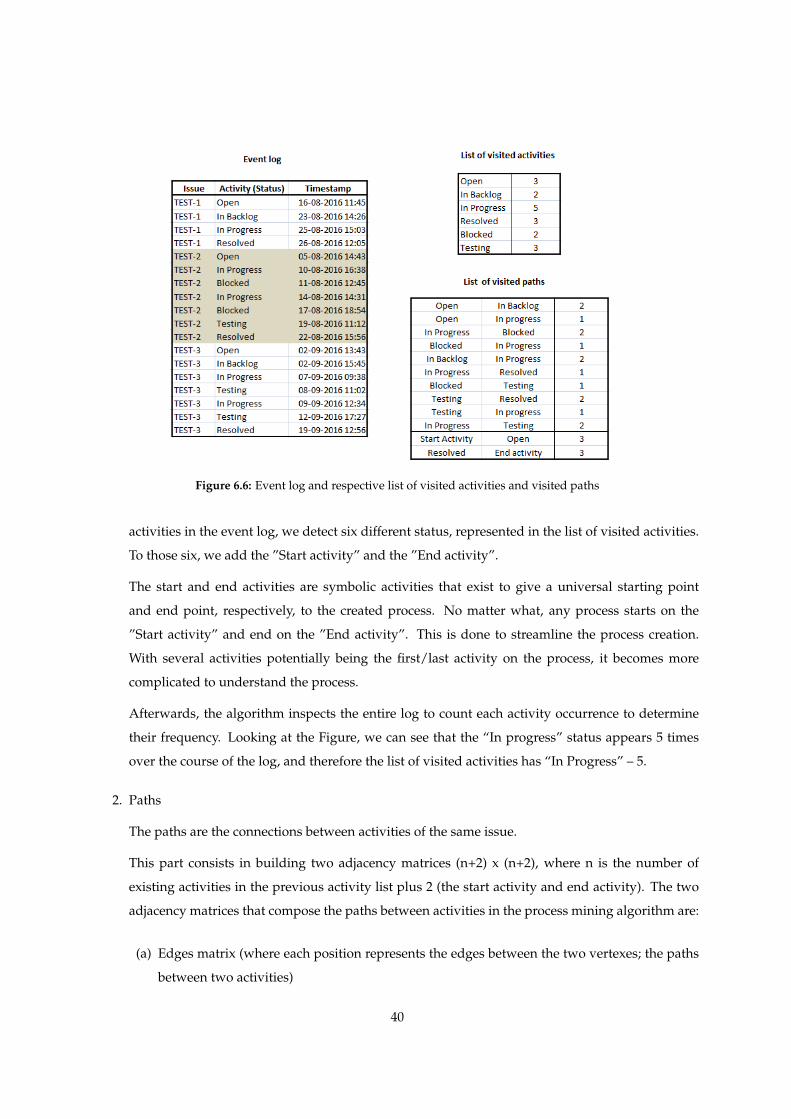
Figure 6.6: Event log and respective list of visited activities and visited paths
activities in the event log, we detect six different status, represented in the list of visited activities.
To those six, we add the ”Start activity” and the ”End activity”.
The start and end activities are symbolic activities that exist to give a universal starting point
and end point, respectively, to the created process. No matter what, any process starts on the
”Start activity” and end on the ”End activity”. This is done to streamline the process creation.
With several activities potentially being the first/last activity on the process, it becomes more
complicated to understand the process.
Afterwards, the algorithm inspects the entire log to count each activity occurrence to determine
their frequency. Looking at the Figure, we can see that the “In progress” status appears 5 times
over the course of the log, and therefore the list of visited activities has “In Progress” – 5.
2. Paths
The paths are the connections between activities of the same issue.
This part consists in building two adjacency matrices (n+2) x (n+2), where n is the number of
existing activities in the previous activity list plus 2 (the start activity and end activity). The two
adjacency matrices that compose the paths between activities in the process mining algorithm are:
(a) Edges matrix (where each position represents the edges between the two vertexes; the paths
between two activities)
40
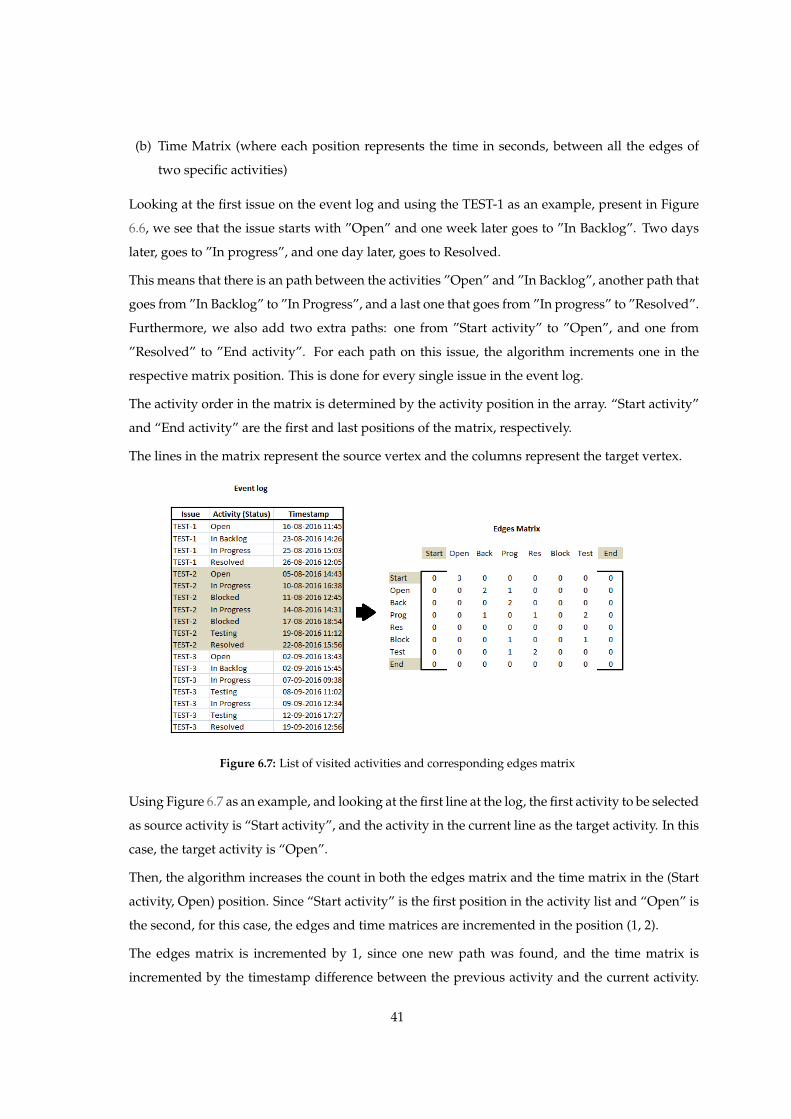
(b) Time Matrix (where each position represents the time in seconds, between all the edges of
two specific activities)
Looking at the first issue on the event log and using the TEST-1 as an example, present in Figure
6.6, we see that the issue starts with ”Open” and one week later goes to ”In Backlog”. Two days
later, goes to ”In progress”, and one day later, goes to Resolved.
This means that there is an path between the activities ”Open” and ”In Backlog”, another path that
goes from ”In Backlog” to ”In Progress”, and a last one that goes from ”In progress” to ”Resolved”.
Furthermore, we also add two extra paths: one from ”Start activity” to ”Open”, and one from
”Resolved” to ”End activity”. For each path on this issue, the algorithm increments one in the
respective matrix position. This is done for every single issue in the event log.
The activity order in the matrix is determined by the activity position in the array. “Start activity”
and “End activity” are the first and last positions of the matrix, respectively.
The lines in the matrix represent the source vertex and the columns represent the target vertex.
Figure 6.7: List of visited activities and corresponding edges matrix
Using Figure 6.7 as an example, and looking at the first line at the log, the first activity to be selected
as source activity is “Start activity”, and the activity in the current line as the target activity. In this
case, the target activity is “Open”.
Then, the algorithm increases the count in both the edges matrix and the time matrix in the (Start
activity, Open) position. Since “Start activity” is the first position in the activity list and “Open” is
the second, for this case, the edges and time matrices are incremented in the position (1, 2).
The edges matrix is incremented by 1, since one new path was found, and the time matrix is
incremented by the timestamp difference between the previous activity and the current activity.
41
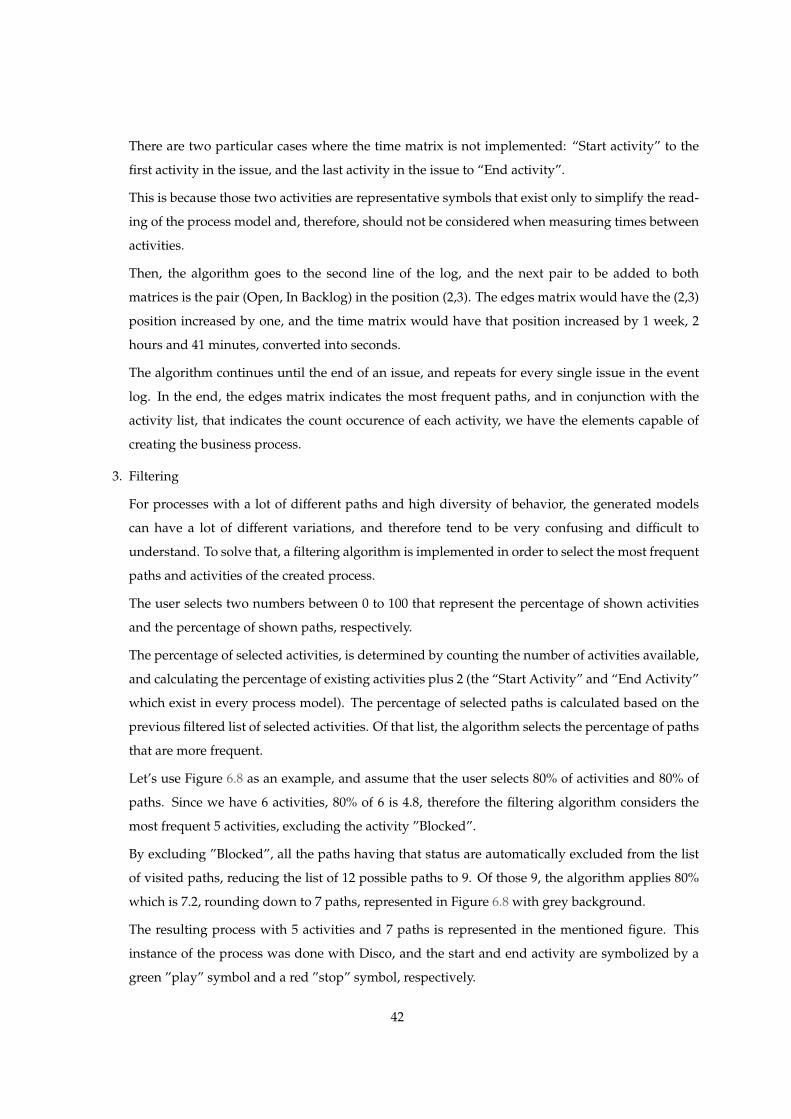
There are two particular cases where the time matrix is not implemented: “Start activity” to the
first activity in the issue, and the last activity in the issue to “End activity”.
This is because those two activities are representative symbols that exist only to simplify the read-
ing of the process model and, therefore, should not be considered when measuring times between
activities.
Then, the algorithm goes to the second line of the log, and the next pair to be added to both
matrices is the pair (Open, In Backlog) in the position (2,3). The edges matrix would have the (2,3)
position increased by one, and the time matrix would have that position increased by 1 week, 2
hours and 41 minutes, converted into seconds.
The algorithm continues until the end of an issue, and repeats for every single issue in the event
log. In the end, the edges matrix indicates the most frequent paths, and in conjunction with the
activity list, that indicates the count occurence of each activity, we have the elements capable of
creating the business process.
3. Filtering
For processes with a lot of different paths and high diversity of behavior, the generated models
can have a lot of different variations, and therefore tend to be very confusing and difficult to
understand. To solve that, a filtering algorithm is implemented in order to select the most frequent
paths and activities of the created process.
The user selects two numbers between 0 to 100 that represent the percentage of shown activities
and the percentage of shown paths, respectively.
The percentage of selected activities, is determined by counting the number of activities available,
and calculating the percentage of existing activities plus 2 (the “Start Activity” and “End Activity”
which exist in every process model). The percentage of selected paths is calculated based on the
previous filtered list of selected activities. Of that list, the algorithm selects the percentage of paths
that are more frequent.
Let’s use Figure 6.8 as an example, and assume that the user selects 80% of activities and 80% of
paths. Since we have 6 activities, 80% of 6 is 4.8, therefore the filtering algorithm considers the
most frequent 5 activities, excluding the activity ”Blocked”.
By excluding ”Blocked”, all the paths having that status are automatically excluded from the list
of visited paths, reducing the list of 12 possible paths to 9. Of those 9, the algorithm applies 80%
which is 7.2, rounding down to 7 paths, represented in Figure 6.8 with grey background.
The resulting process with 5 activities and 7 paths is represented in the mentioned figure. This
instance of the process was done with Disco, and the start and end activity are symbolized by a
green ”play” symbol and a red ”stop” symbol, respectively.
42
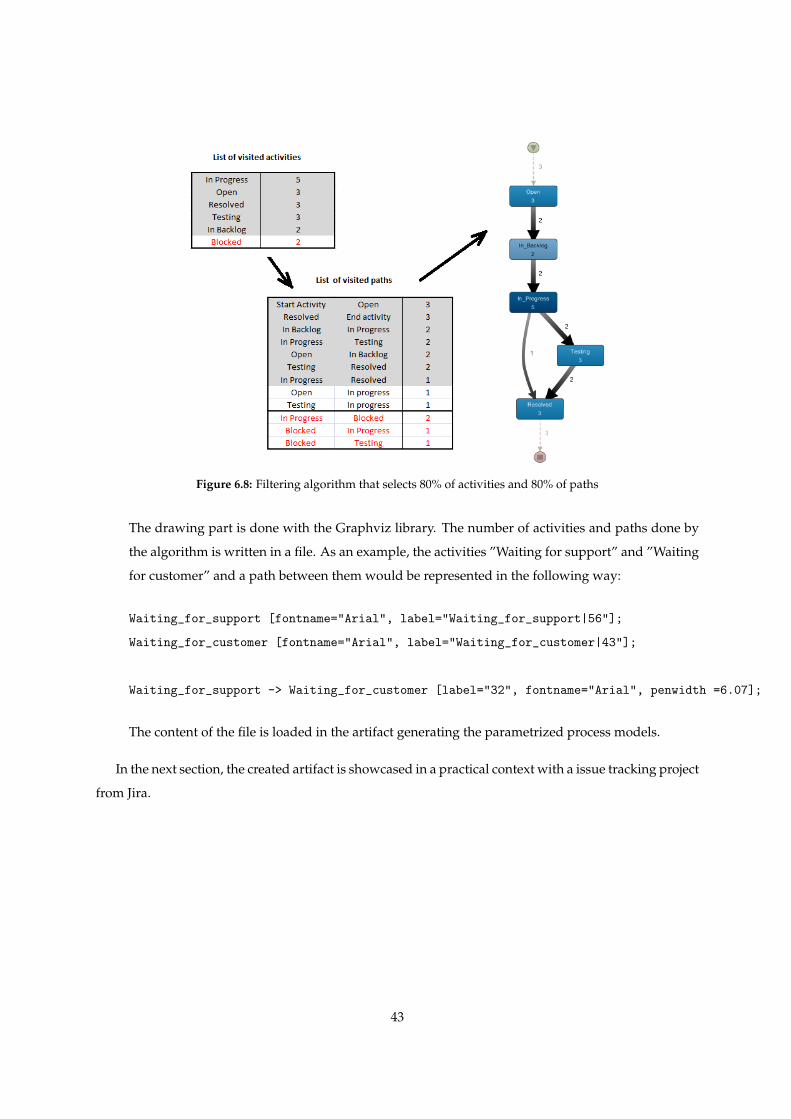
Figure 6.8: Filtering algorithm that selects 80% of activities and 80% of paths
The drawing part is done with the Graphviz library. The number of activities and paths done by
the algorithm is written in a file. As an example, the activities ”Waiting for support” and ”Waiting
for customer” and a path between them would be represented in the following way:
Waiting_for_support [fontname="Arial", label="Waiting_for_support|56"];
Waiting_for_customer [fontname="Arial", label="Waiting_for_customer|43"];
Waiting_for_support -> Waiting_for_customer [label="32", fontname="Arial", penwidth =6.07];
The content of the file is loaded in the artifact generating the parametrized process models.
In the next section, the created artifact is showcased in a practical context with a issue tracking project
from Jira.
43

44

Chapter 7
Demonstration of the artifact
In this chapter, our proposal is applied in a practical setting with the demonstration of the cre-
ated artifact. To do that, we use open-source projects existant in Jira to test the artifact and to create
parametrized process models from the data extracted by the different projects.
7.1 Demonstration
As mentioned before, this approach allows the process discovery tailored for several situations ac-
cording to the user input. In this section, we showcase several practical examples of the more detailed
creation of process models, and understand the process variations that this approach brings, accompa-
nied with images.
For this demonstration, its used a project from Open edX 1: a platform that serves as a open source
course management system (CMS), used for hosting Massive Open Online Courses (MOOCs).
Open Edx has over two dozen projects. In this example, we present the status progression for PLAT:
a Jira project that has over 1000 issues about the instalation and configuration of the Open Edx platform.
Figure 7.1 analyzes all the status changes in the project. This is the kind of process that is generated
with the Process Mining tools, since it only takes the status progression into account.
Due to the sheer size in the generated business process, we select only the 50% most relevant fields
and the 50% most relevant paths.
By looking at Figure 7.1, we can see that going by the most frequent paths, most of the times the issue
starts with ”Needs Triage”, takes in average 110 minutes to go to ”Open”, then goes to ”In Backlog”,
after leaving the backlog, the issue stays ”In progress” in average for over a week, and after being solved
goes to ”Code Review” before being closed. This means that the main order from the Status is ”Needs
Triage ->Open ->In Backlog ->In Progress ->In Code Review ->Closed” or ”Needs Triage ->Open”.
1https://www.atlassian.com/software/jira
45
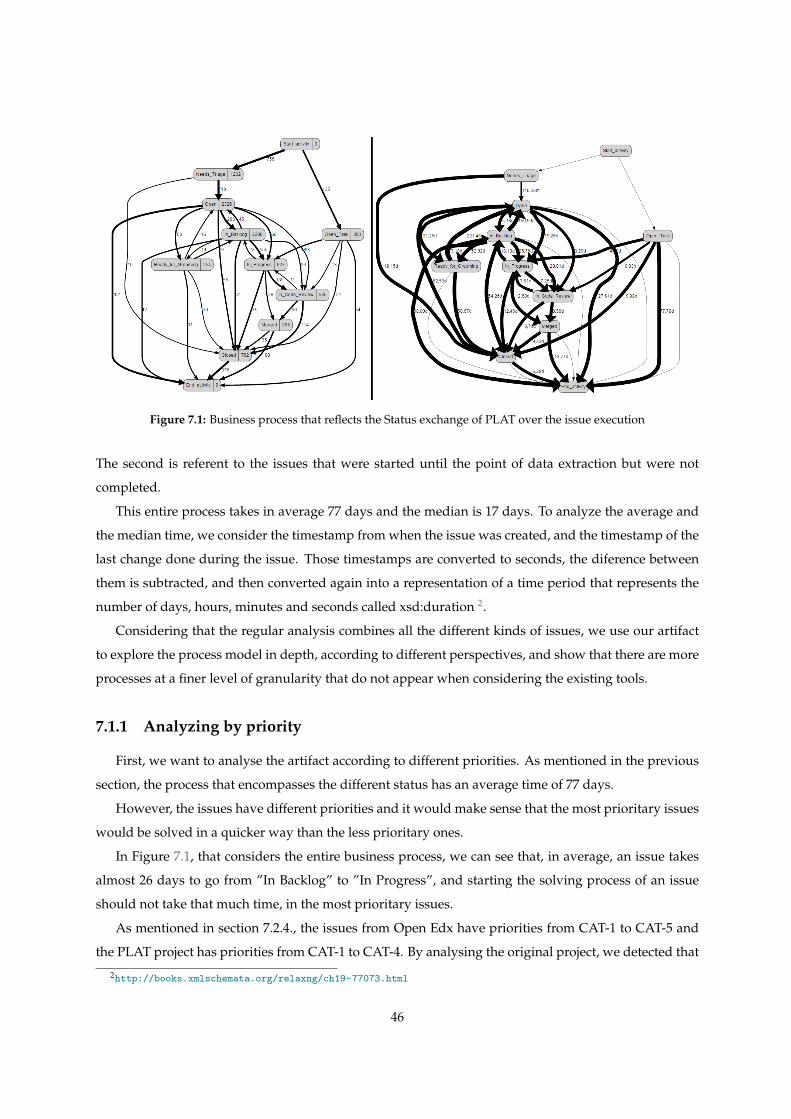
Figure 7.1: Business process that reflects the Status exchange of PLAT over the issue execution
The second is referent to the issues that were started until the point of data extraction but were not
completed.
This entire process takes in average 77 days and the median is 17 days. To analyze the average and
the median time, we consider the timestamp from when the issue was created, and the timestamp of the
last change done during the issue. Those timestamps are converted to seconds, the diference between
them is subtracted, and then converted again into a representation of a time period that represents the
number of days, hours, minutes and seconds called xsd:duration 2.
Considering that the regular analysis combines all the different kinds of issues, we use our artifact
to explore the process model in depth, according to different perspectives, and show that there are more
processes at a finer level of granularity that do not appear when considering the existing tools.
7.1.1 Analyzing by priority
First, we want to analyse the artifact according to different priorities. As mentioned in the previous
section, the process that encompasses the different status has an average time of 77 days.
However, the issues have different priorities and it would make sense that the most prioritary issues
would be solved in a quicker way than the less prioritary ones.
In Figure 7.1, that considers the entire business process, we can see that, in average, an issue takes
almost 26 days to go from ”In Backlog” to ”In Progress”, and starting the solving process of an issue
should not take that much time, in the most prioritary issues.
As mentioned in section 7.2.4., the issues from Open Edx have priorities from CAT-1 to CAT-5 and
the PLAT project has priorities from CAT-1 to CAT-4. By analysing the original project, we detected that
2http://books.xmlschemata.org/relaxng/ch19-77073.html
46
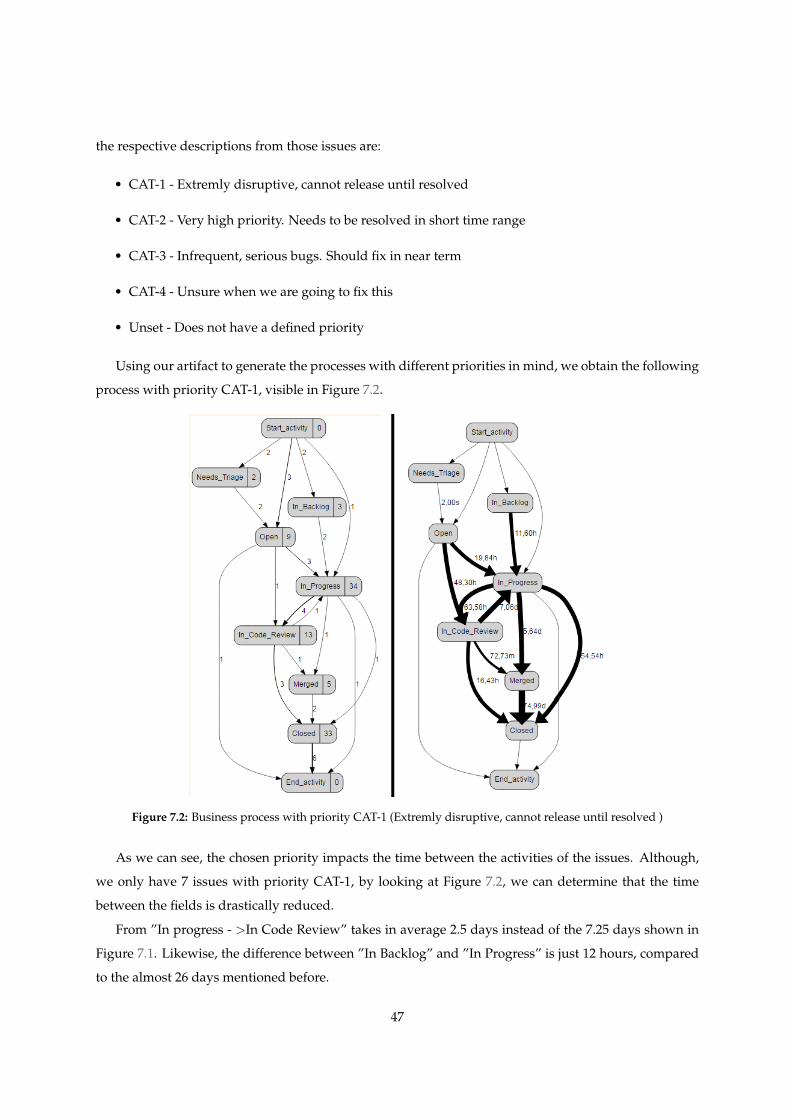
the respective descriptions from those issues are:
• CAT-1 - Extremly disruptive, cannot release until resolved
• CAT-2 - Very high priority. Needs to be resolved in short time range
• CAT-3 - Infrequent, serious bugs. Should fix in near term
• CAT-4 - Unsure when we are going to fix this
• Unset - Does not have a defined priority
Using our artifact to generate the processes with different priorities in mind, we obtain the following
process with priority CAT-1, visible in Figure 7.2.
Figure 7.2: Business process with priority CAT-1 (Extremly disruptive, cannot release until resolved )
As we can see, the chosen priority impacts the time between the activities of the issues. Although,
we only have 7 issues with priority CAT-1, by looking at Figure 7.2, we can determine that the time
between the fields is drastically reduced.
From ”In progress - >In Code Review” takes in average 2.5 days instead of the 7.25 days shown in
Figure 7.1. Likewise, the difference between ”In Backlog” and ”In Progress” is just 12 hours, compared
to the almost 26 days mentioned before.
47
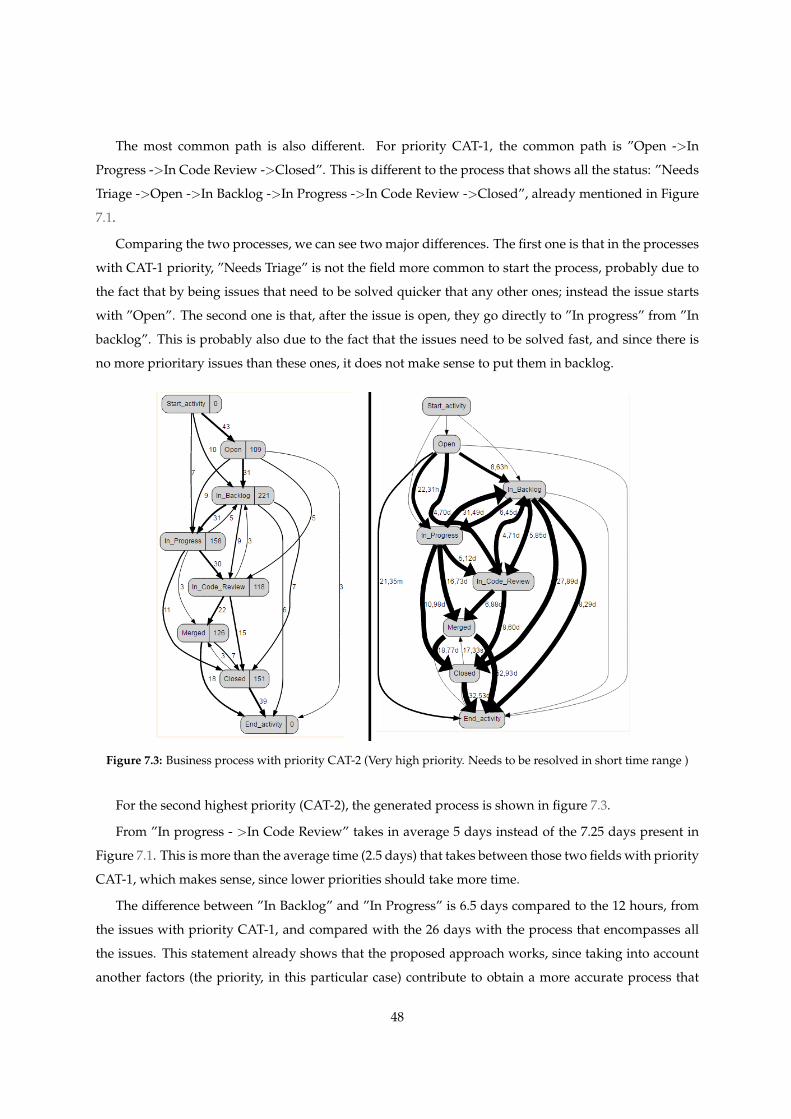
The most common path is also different. For priority CAT-1, the common path is ”Open ->In
Progress ->In Code Review ->Closed”. This is different to the process that shows all the status: ”Needs
Triage ->Open ->In Backlog ->In Progress ->In Code Review ->Closed”, already mentioned in Figure
7.1.
Comparing the two processes, we can see two major differences. The first one is that in the processes
with CAT-1 priority, ”Needs Triage” is not the field more common to start the process, probably due to
the fact that by being issues that need to be solved quicker that any other ones; instead the issue starts
with ”Open”. The second one is that, after the issue is open, they go directly to ”In progress” from ”In
backlog”. This is probably also due to the fact that the issues need to be solved fast, and since there is
no more prioritary issues than these ones, it does not make sense to put them in backlog.
Figure 7.3: Business process with priority CAT-2 (Very high priority. Needs to be resolved in short time range )
For the second highest priority (CAT-2), the generated process is shown in figure 7.3.
From ”In progress - >In Code Review” takes in average 5 days instead of the 7.25 days present in
Figure 7.1. This is more than the average time (2.5 days) that takes between those two fields with priority
CAT-1, which makes sense, since lower priorities should take more time.
The difference between ”In Backlog” and ”In Progress” is 6.5 days compared to the 12 hours, from
the issues with priority CAT-1, and compared with the 26 days with the process that encompasses all
the issues. This statement already shows that the proposed approach works, since taking into account
another factors (the priority, in this particular case) contribute to obtain a more accurate process that
48
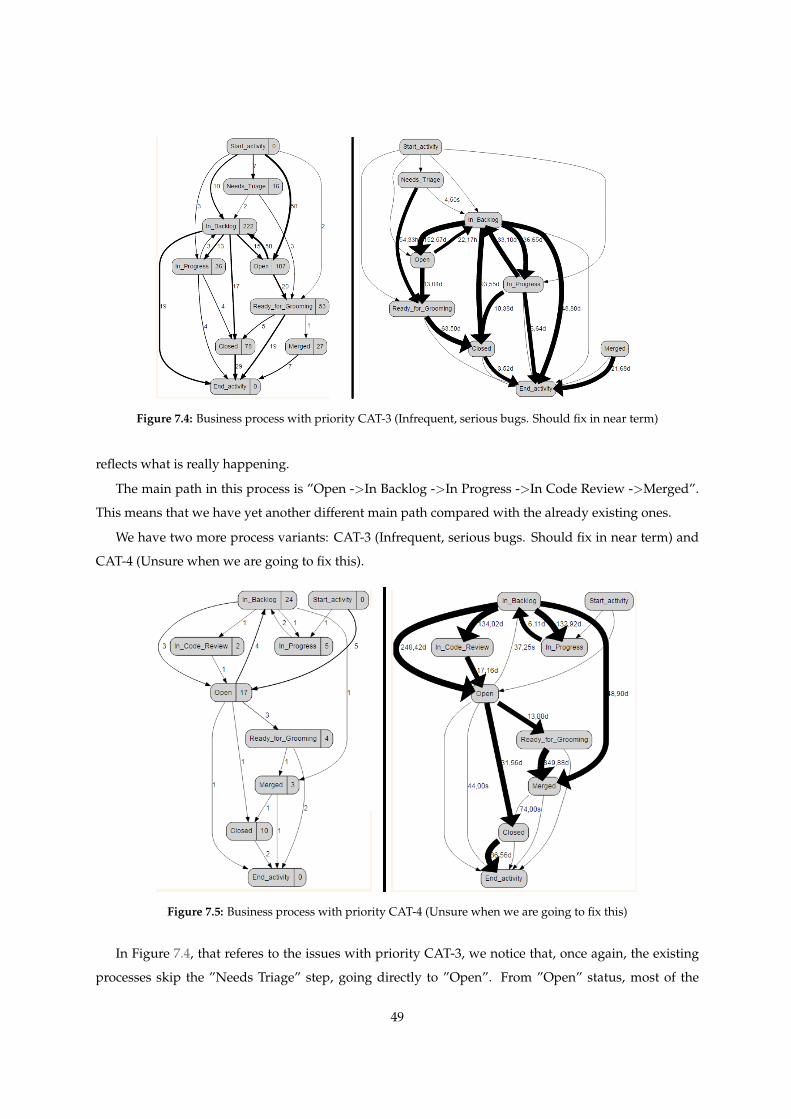
Figure 7.4: Business process with priority CAT-3 (Infrequent, serious bugs. Should fix in near term)
reflects what is really happening.
The main path in this process is ”Open ->In Backlog ->In Progress ->In Code Review ->Merged”.
This means that we have yet another different main path compared with the already existing ones.
We have two more process variants: CAT-3 (Infrequent, serious bugs. Should fix in near term) and
CAT-4 (Unsure when we are going to fix this).
Figure 7.5: Business process with priority CAT-4 (Unsure when we are going to fix this)
In Figure 7.4, that referes to the issues with priority CAT-3, we notice that, once again, the existing
processes skip the ”Needs Triage” step, going directly to ”Open”. From ”Open” status, most of the
49

issues go to the ”Backlog” in less than 24 hours. From ”Backlog” to ”Closed”, they take 3 months in
average, from ”Backlog” to ”In Progress” take over a month, and there are some issues that return to
”Open” after being over 5 months in the ”Backlog”.
The processes with ”CAT-4” priority also go to ”Open” first, then go almost instantly to ”In Backlog”
(taking in average 37 seconds) since this kind of issues are the least important ones. From staying ”In
Backlog” until going to ”Open” again, it takes almost 250 days; over 130 days from going to ”Backlog”
to ”In Code Review” or going to ”In progress”.
All those four processes have something in common that is inconsistent to the process that encom-
passes all the status: all of them almost neglect the ”Needs Triage” status. In fact, even though the
”Needs Triage” step is essential in the main process, from the four main priorities available, that field is
almost never chosen.
The answer to this is in the fifth priority called ”Unset”. According to the semantic description that
refers to this priority, unlike the other issues that have a defined priority, an ”Unset” issue does not have
one. Therefore, this fact supports the need of triaging the issue, analysing the issue and determining its
priority based on the severity of the problem.
Figure 7.6: Business process with priority Unset (Does not have a priority defined)
By looking at Figure 7.6, we can see that he vast majority of processes that have ”Unset” priority,
start with ”Needs Triage”, which supports what was said before regarding the need of triaging the
issues before they have a assigned priority.
From there, the issues take in average 2 hours to go to the ”Open” status. The most common path for
the issues of ”Unset” priority is ”Needs Triage” ->”Open” or in alternative ”Needs Triage” ->”Open”
50
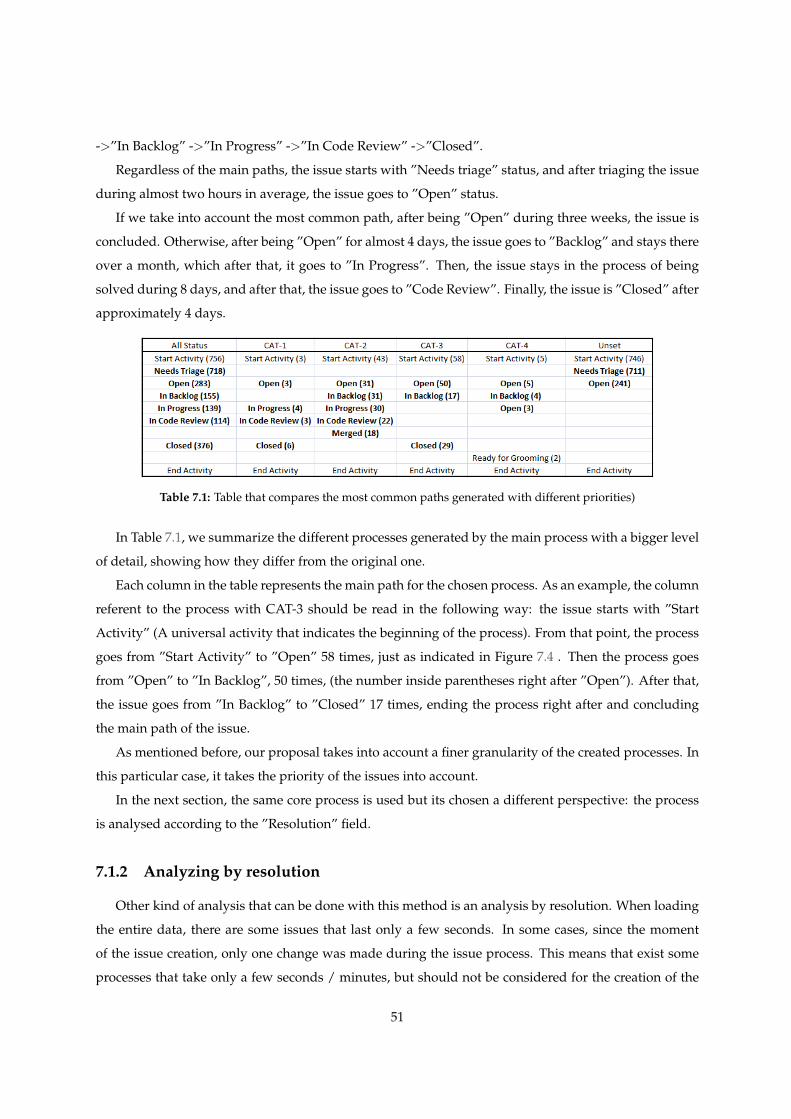
->”In Backlog” ->”In Progress” ->”In Code Review” ->”Closed”.
Regardless of the main paths, the issue starts with ”Needs triage” status, and after triaging the issue
during almost two hours in average, the issue goes to ”Open” status.
If we take into account the most common path, after being ”Open” during three weeks, the issue is
concluded. Otherwise, after being ”Open” for almost 4 days, the issue goes to ”Backlog” and stays there
over a month, which after that, it goes to ”In Progress”. Then, the issue stays in the process of being
solved during 8 days, and after that, the issue goes to ”Code Review”. Finally, the issue is ”Closed” after
approximately 4 days.
Table 7.1: Table that compares the most common paths generated with different priorities)
In Table 7.1, we summarize the different processes generated by the main process with a bigger level
of detail, showing how they differ from the original one.
Each column in the table represents the main path for the chosen process. As an example, the column
referent to the process with CAT-3 should be read in the following way: the issue starts with ”Start
Activity” (A universal activity that indicates the beginning of the process). From that point, the process
goes from ”Start Activity” to ”Open” 58 times, just as indicated in Figure 7.4 . Then the process goes
from ”Open” to ”In Backlog”, 50 times, (the number inside parentheses right after ”Open”). After that,
the issue goes from ”In Backlog” to ”Closed” 17 times, ending the process right after and concluding
the main path of the issue.
As mentioned before, our proposal takes into account a finer granularity of the created processes. In
this particular case, it takes the priority of the issues into account.
In the next section, the same core process is used but its chosen a different perspective: the process
is analysed according to the ”Resolution” field.
7.1.2 Analyzing by resolution
Other kind of analysis that can be done with this method is an analysis by resolution. When loading
the entire data, there are some issues that last only a few seconds. In some cases, since the moment
of the issue creation, only one change was made during the issue process. This means that exist some
processes that take only a few seconds / minutes, but should not be considered for the creation of the
51

modeled process.
By looking to the different fields, there is an element to the individual processes that is common to
the processes that have only a few seconds / minutes of duration: the resolution field that determines
the ways a certain issue can be closed, is represented as ”Unresolved”.
Figure 7.7: List of all semantic annotations for the resolutions in the PLAT project
Since the different issue tracking fields have a semantic annotation attached, we looked at the anno-
tation list, presented in Figure 7.7. By looking at the description of the different resolutions, we can see
that an issue with ”Unresolved” resolution, occurs when ”no resolution is set for an issue”.
Considering that the resolutions are the ways in which an issue can be closed, this definition justifies
the problem mentioned above. Each solved issue has a resolution that summarizes its state after being
solved. E.g : ”Done” when the issue is solved, ”Cannot reproduce” if the issue reported by the user,
cannot be replicated and thus, a proper solution cannot be applied, and so on.
The ”Unresolved” status encompasses all the other issues that do not have a existing resolution; this
includes all the issues that are in the process of being solved, including the issues that were just opened
and did not suffer any modifications.
Thus, the processes that had only a few seconds or a few minutes, and have an ”Unresolved” status
are representative of incomplete issues, and should not be taken into consideration for the creation of a
parametrized process model.
Considering the number of possible resolutions in this project, we choose only the main ones that are
supported by the majority of the issues in this project. In this case, we choose three resolutions: ”Done”,
”Fixed” and ”Unresolved”.
The resolutions ”Done” and ”Fixed” seem to be very similar, and as we will see, the paths are identi-
cal but they represent different cases. Looking at Figure 7.7 with the defintions for the list of resolutions,
52
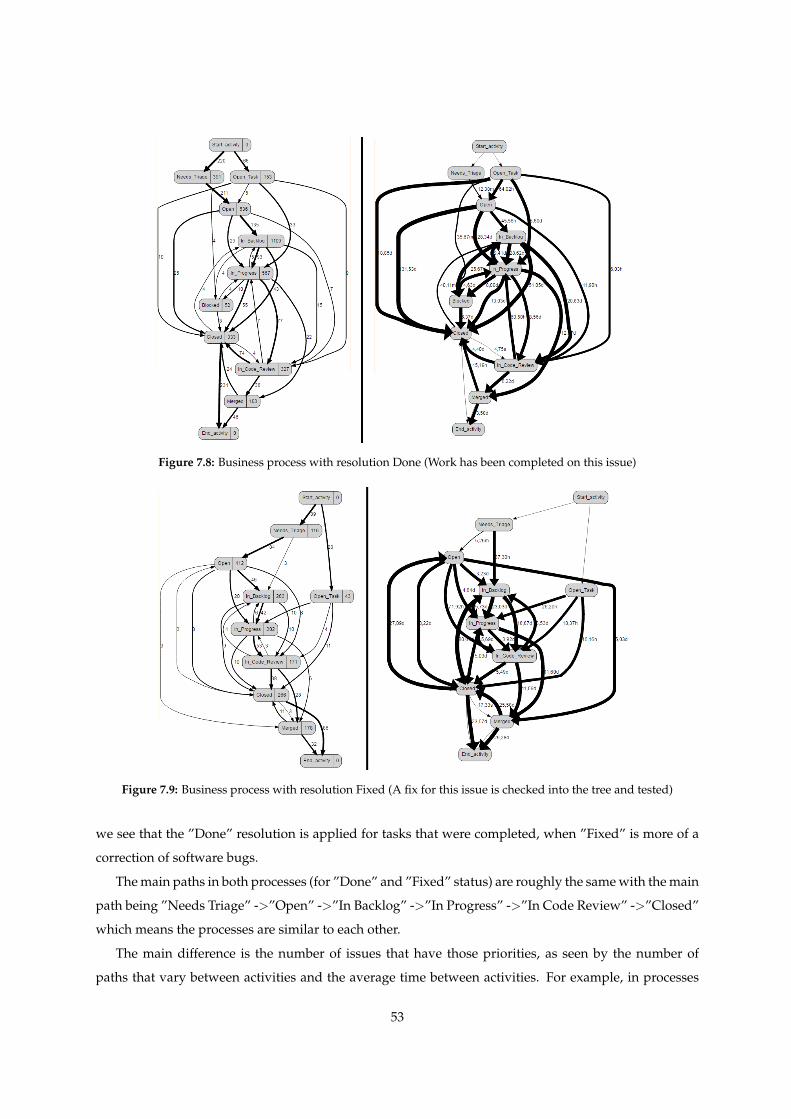
Figure 7.8: Business process with resolution Done (Work has been completed on this issue)
Figure 7.9: Business process with resolution Fixed (A fix for this issue is checked into the tree and tested)
we see that the ”Done” resolution is applied for tasks that were completed, when ”Fixed” is more of a
correction of software bugs.
The main paths in both processes (for ”Done” and ”Fixed” status) are roughly the same with the main
path being ”Needs Triage” ->”Open” ->”In Backlog” ->”In Progress” ->”In Code Review” ->”Closed”
which means the processes are similar to each other.
The main difference is the number of issues that have those priorities, as seen by the number of
paths that vary between activities and the average time between activities. For example, in processes
53
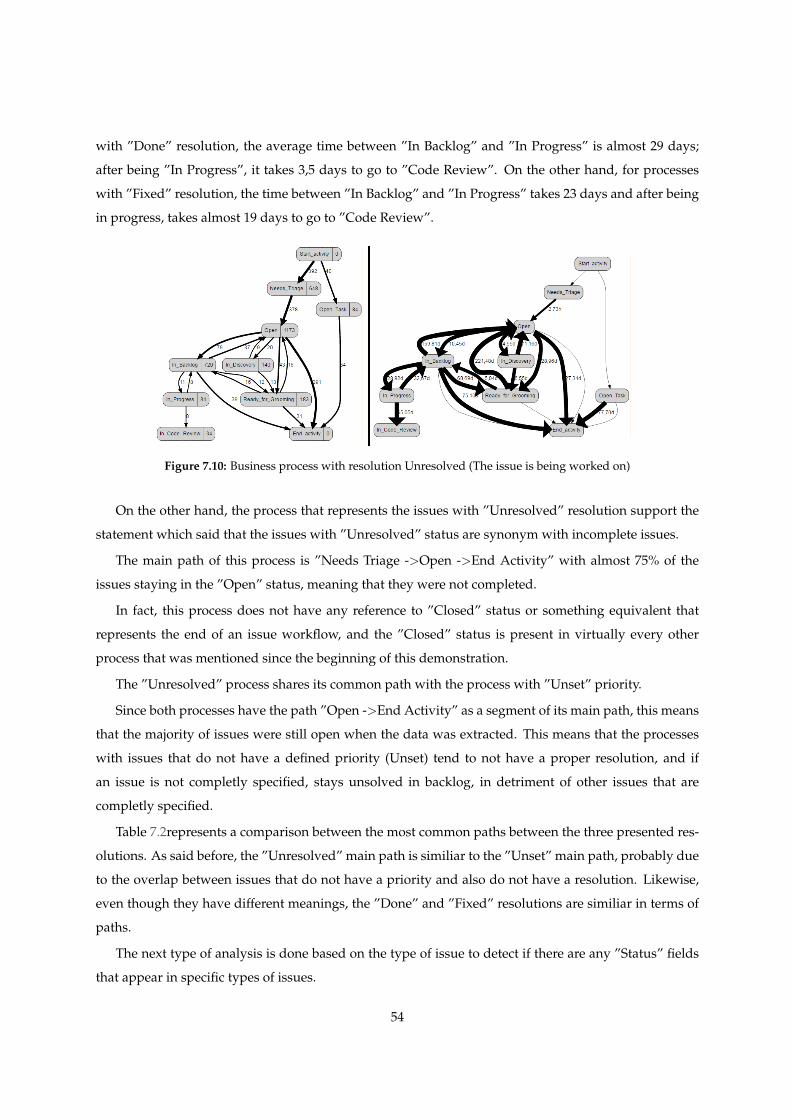
with ”Done” resolution, the average time between ”In Backlog” and ”In Progress” is almost 29 days;
after being ”In Progress”, it takes 3,5 days to go to ”Code Review”. On the other hand, for processes
with ”Fixed” resolution, the time between ”In Backlog” and ”In Progress” takes 23 days and after being
in progress, takes almost 19 days to go to ”Code Review”.
Figure 7.10: Business process with resolution Unresolved (The issue is being worked on)
On the other hand, the process that represents the issues with ”Unresolved” resolution support the
statement which said that the issues with ”Unresolved” status are synonym with incomplete issues.
The main path of this process is ”Needs Triage ->Open ->End Activity” with almost 75% of the
issues staying in the ”Open” status, meaning that they were not completed.
In fact, this process does not have any reference to ”Closed” status or something equivalent that
represents the end of an issue workflow, and the ”Closed” status is present in virtually every other
process that was mentioned since the beginning of this demonstration.
The ”Unresolved” process shares its common path with the process with ”Unset” priority.
Since both processes have the path ”Open ->End Activity” as a segment of its main path, this means
that the majority of issues were still open when the data was extracted. This means that the processes
with issues that do not have a defined priority (Unset) tend to not have a proper resolution, and if
an issue is not completly specified, stays unsolved in backlog, in detriment of other issues that are
completly specified.
Table 7.2represents a comparison between the most common paths between the three presented res-
olutions. As said before, the ”Unresolved” main path is similiar to the ”Unset” main path, probably due
to the overlap between issues that do not have a priority and also do not have a resolution. Likewise,
even though they have different meanings, the ”Done” and ”Fixed” resolutions are similiar in terms of
paths.
The next type of analysis is done based on the type of issue to detect if there are any ”Status” fields
that appear in specific types of issues.
54

Table 7.2: Table that compares the most common paths generated with different resolutions)
7.1.3 Analyzing by type
Another type of analysis that can be done is by type of issue. There are different types of issues; in
this particular project, we have seven types of issues as seen in Figure 7.11.
Considering that there are different types of issues, it makes sense that during their process of reso-
lution, they should be treated in a different way. For example, as seen in the list of annotations for the
type of issues, an issue of type ”Bug” that represents errors that prevent the functioning of the system,
is treated differently than a ”Story”, a type of issue present in agile methodologies.
Figure 7.11: List of all semantic annotations for the types in the PLAT project
The issues that are bigger in scope are ”Epic”. As seen in Figure 7.11, ”Epic” issues are big user
stories that need to be broken down. On the other hand, we have ”Sub-tasks”, a small segment of a task
that needs to be done.
Of the seven types of issues, we chose processes of contrasting sizes: ”Bug” (that represents a normal
kind of issue), ”Epic” (that represent the bigger kind of issue existant in this project) and ”Sub-task” (that
represent the smaller kind of issue in this sub-project). Figure 7.12 represents the issues of ”Bug” type.
Just like the processes of ”Done” and ”Fixed” resolution that were mentioned in the previous section,
55
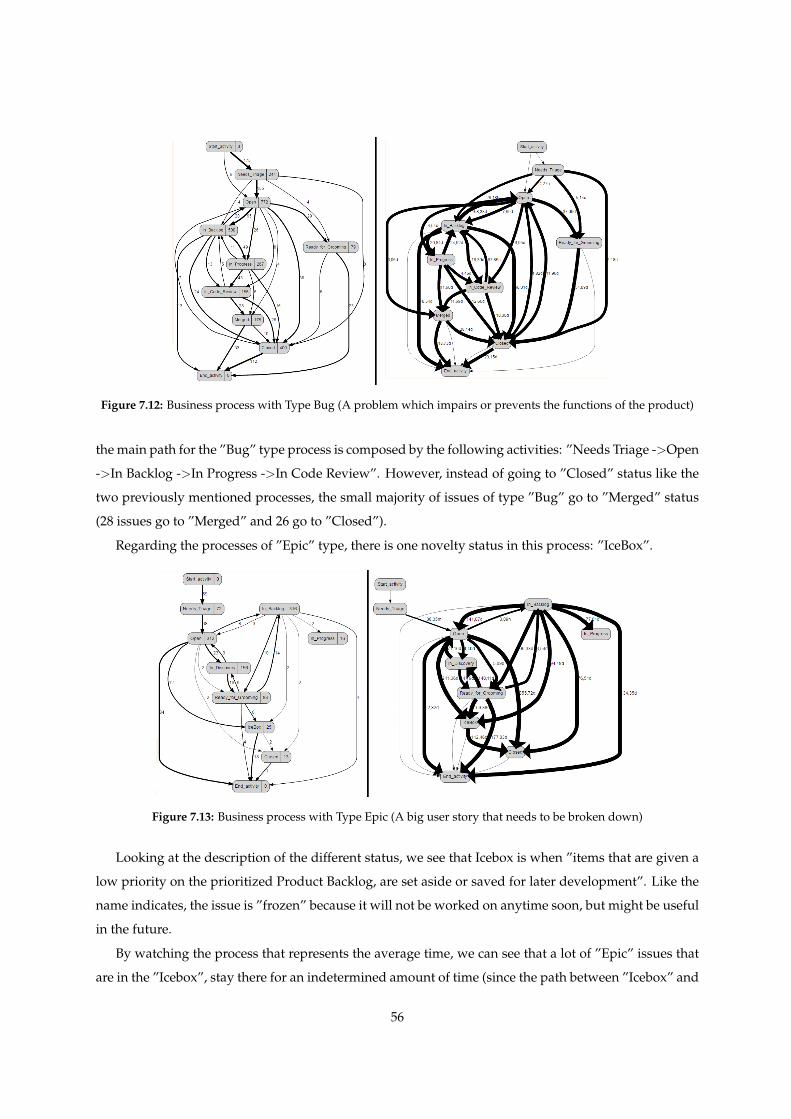
Figure 7.12: Business process with Type Bug (A problem which impairs or prevents the functions of the product)
the main path for the ”Bug” type process is composed by the following activities: ”Needs Triage ->Open
->In Backlog ->In Progress ->In Code Review”. However, instead of going to ”Closed” status like the
two previously mentioned processes, the small majority of issues of type ”Bug” go to ”Merged” status
(28 issues go to ”Merged” and 26 go to ”Closed”).
Regarding the processes of ”Epic” type, there is one novelty status in this process: ”IceBox”.
Figure 7.13: Business process with Type Epic (A big user story that needs to be broken down)
Looking at the description of the different status, we see that Icebox is when ”items that are given a
low priority on the prioritized Product Backlog, are set aside or saved for later development”. Like the
name indicates, the issue is ”frozen” because it will not be worked on anytime soon, but might be useful
in the future.
By watching the process that represents the average time, we can see that a lot of ”Epic” issues that
are in the ”Icebox”, stay there for an indetermined amount of time (since the path between ”Icebox” and
56
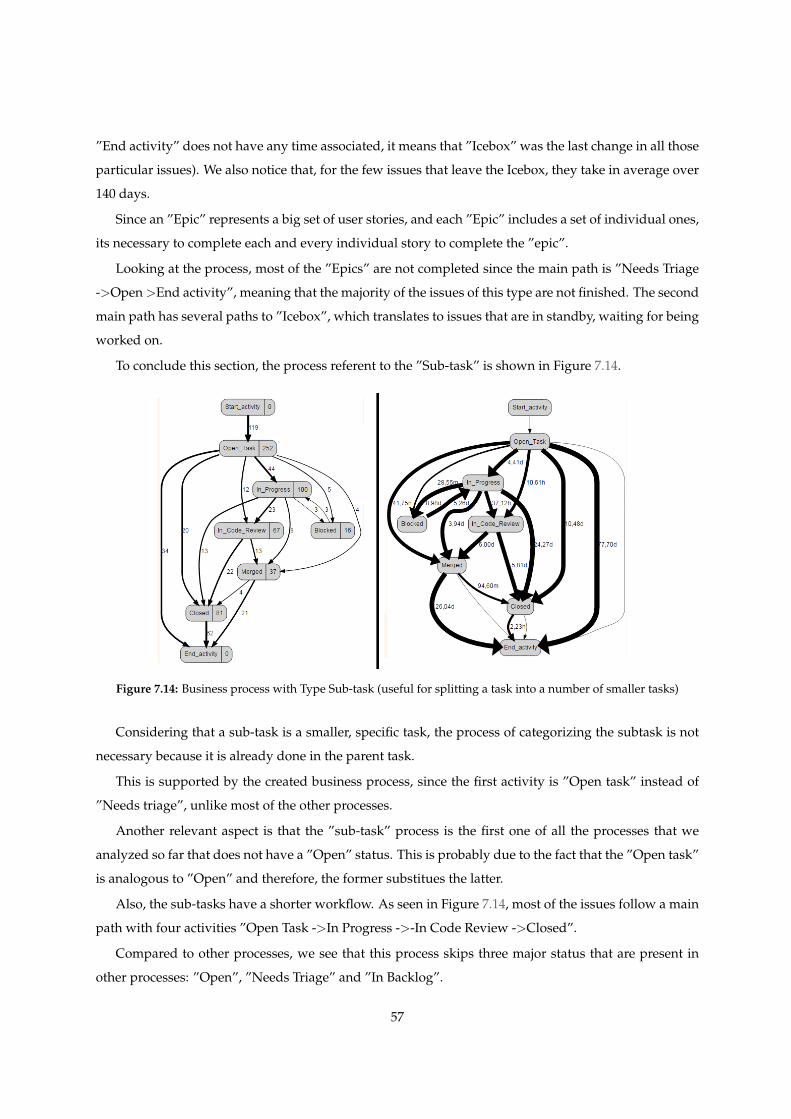
”End activity” does not have any time associated, it means that ”Icebox” was the last change in all those
particular issues). We also notice that, for the few issues that leave the Icebox, they take in average over
140 days.
Since an ”Epic” represents a big set of user stories, and each ”Epic” includes a set of individual ones,
its necessary to complete each and every individual story to complete the ”epic”.
Looking at the process, most of the ”Epics” are not completed since the main path is ”Needs Triage
->Open >End activity”, meaning that the majority of the issues of this type are not finished. The second
main path has several paths to ”Icebox”, which translates to issues that are in standby, waiting for being
worked on.
To conclude this section, the process referent to the ”Sub-task” is shown in Figure 7.14.
Figure 7.14: Business process with Type Sub-task (useful for splitting a task into a number of smaller tasks)
Considering that a sub-task is a smaller, specific task, the process of categorizing the subtask is not
necessary because it is already done in the parent task.
This is supported by the created business process, since the first activity is ”Open task” instead of
”Needs triage”, unlike most of the other processes.
Another relevant aspect is that the ”sub-task” process is the first one of all the processes that we
analyzed so far that does not have a ”Open” status. This is probably due to the fact that the ”Open task”
is analogous to ”Open” and therefore, the former substitues the latter.
Also, the sub-tasks have a shorter workflow. As seen in Figure 7.14, most of the issues follow a main
path with four activities ”Open Task ->In Progress ->-In Code Review ->Closed”.
Compared to other processes, we see that this process skips three major status that are present in
other processes: ”Open”, ”Needs Triage” and ”In Backlog”.
57
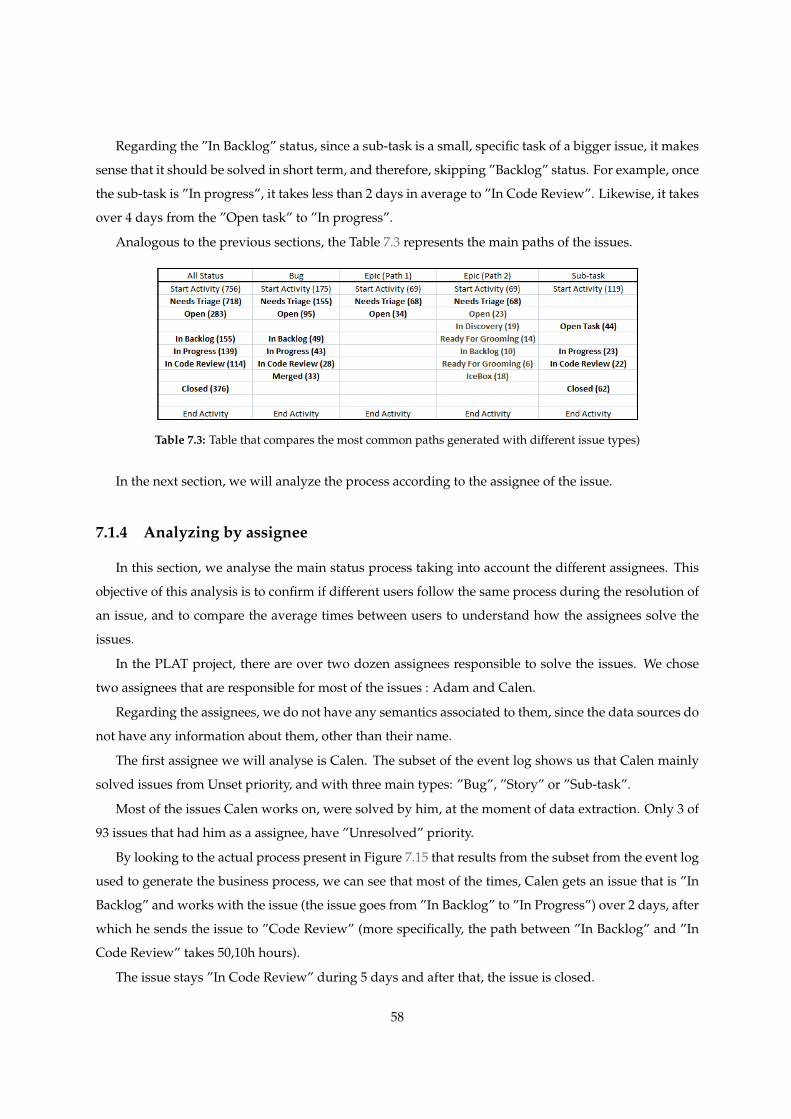
Regarding the ”In Backlog” status, since a sub-task is a small, specific task of a bigger issue, it makes
sense that it should be solved in short term, and therefore, skipping ”Backlog” status. For example, once
the sub-task is ”In progress”, it takes less than 2 days in average to ”In Code Review”. Likewise, it takes
over 4 days from the ”Open task” to ”In progress”.
Analogous to the previous sections, the Table 7.3 represents the main paths of the issues.
Table 7.3: Table that compares the most common paths generated with different issue types)
In the next section, we will analyze the process according to the assignee of the issue.
7.1.4 Analyzing by assignee
In this section, we analyse the main status process taking into account the different assignees. This
objective of this analysis is to confirm if different users follow the same process during the resolution of
an issue, and to compare the average times between users to understand how the assignees solve the
issues.
In the PLAT project, there are over two dozen assignees responsible to solve the issues. We chose
two assignees that are responsible for most of the issues : Adam and Calen.
Regarding the assignees, we do not have any semantics associated to them, since the data sources do
not have any information about them, other than their name.
The first assignee we will analyse is Calen. The subset of the event log shows us that Calen mainly
solved issues from Unset priority, and with three main types: ”Bug”, ”Story” or ”Sub-task”.
Most of the issues Calen works on, were solved by him, at the moment of data extraction. Only 3 of
93 issues that had him as a assignee, have ”Unresolved” priority.
By looking to the actual process present in Figure 7.15 that results from the subset from the event log
used to generate the business process, we can see that most of the times, Calen gets an issue that is ”In
Backlog” and works with the issue (the issue goes from ”In Backlog” to ”In Progress”) over 2 days, after
which he sends the issue to ”Code Review” (more specifically, the path between ”In Backlog” and ”In
Code Review” takes 50,10h hours).
The issue stays ”In Code Review” during 5 days and after that, the issue is closed.
58

Figure 7.15: Business process with Assignee Calen
One interesting thing to notice is that even though Calen works with issues of ”Unset” priority, and
the vast majority of those issues start with the triage process to assign a priority to the issue in question,
the ”Needs Triage” status is not present in Figure 7.15. This is most likely because the process of triaging
the issue is done by someone else, and Calen starts working with the issues from the backlog.
The second assignee we will analyse is Adam. By looking at the subset of the event log, we see that
Adam works with issues with CAT-1, CAT-2 and Unset priorities, and the vast majority of those issues
he works on, are of ”Bug” type.
Looking at the process present in Figure 7.16, we see that the triaging process is skipped (just like
what happens with Calen) since the process does not have the ”Needs Triage” status, even though this
status is prevalent in processes of ”Bug” type. We also see that, at the moment of the data extraction,
almost half of the issues that went from the Backlog were still ”In Progress” (the path goes from ”In
Progress” to ”End activity” 6 times, versus the 8 paths that came from ”In Progress” to other activities).
The average times are also different. For Calen, taking a issue from ”Backlog” to ”In progress” takes
in average 3,3 days when for Adam it takes 8,9 days. Likewise, the time between ”In Progress” and
”Closed” for Calen is about 6,14 days, when for Adam is 7,26 days.
Analysing the issues according to different assignees allows us to compare the times between them
and see the parts of the issues they are responsible for, or to see how they actually solve the issues.
59
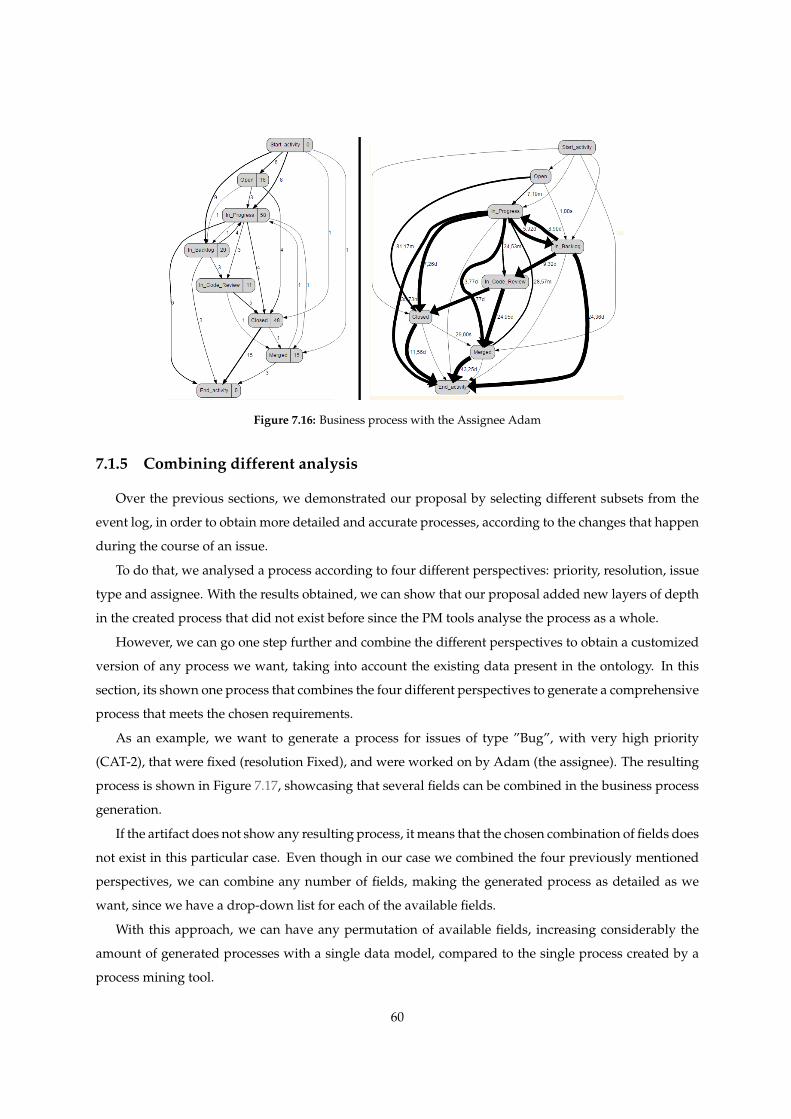
Figure 7.16: Business process with the Assignee Adam
7.1.5 Combining different analysis
Over the previous sections, we demonstrated our proposal by selecting different subsets from the
event log, in order to obtain more detailed and accurate processes, according to the changes that happen
during the course of an issue.
To do that, we analysed a process according to four different perspectives: priority, resolution, issue
type and assignee. With the results obtained, we can show that our proposal added new layers of depth
in the created process that did not exist before since the PM tools analyse the process as a whole.
However, we can go one step further and combine the different perspectives to obtain a customized
version of any process we want, taking into account the existing data present in the ontology. In this
section, its shown one process that combines the four different perspectives to generate a comprehensive
process that meets the chosen requirements.
As an example, we want to generate a process for issues of type ”Bug”, with very high priority
(CAT-2), that were fixed (resolution Fixed), and were worked on by Adam (the assignee). The resulting
process is shown in Figure 7.17, showcasing that several fields can be combined in the business process
generation.
If the artifact does not show any resulting process, it means that the chosen combination of fields does
not exist in this particular case. Even though in our case we combined the four previously mentioned
perspectives, we can combine any number of fields, making the generated process as detailed as we
want, since we have a drop-down list for each of the available fields.
With this approach, we can have any permutation of available fields, increasing considerably the
amount of generated processes with a single data model, compared to the single process created by a
process mining tool.
60
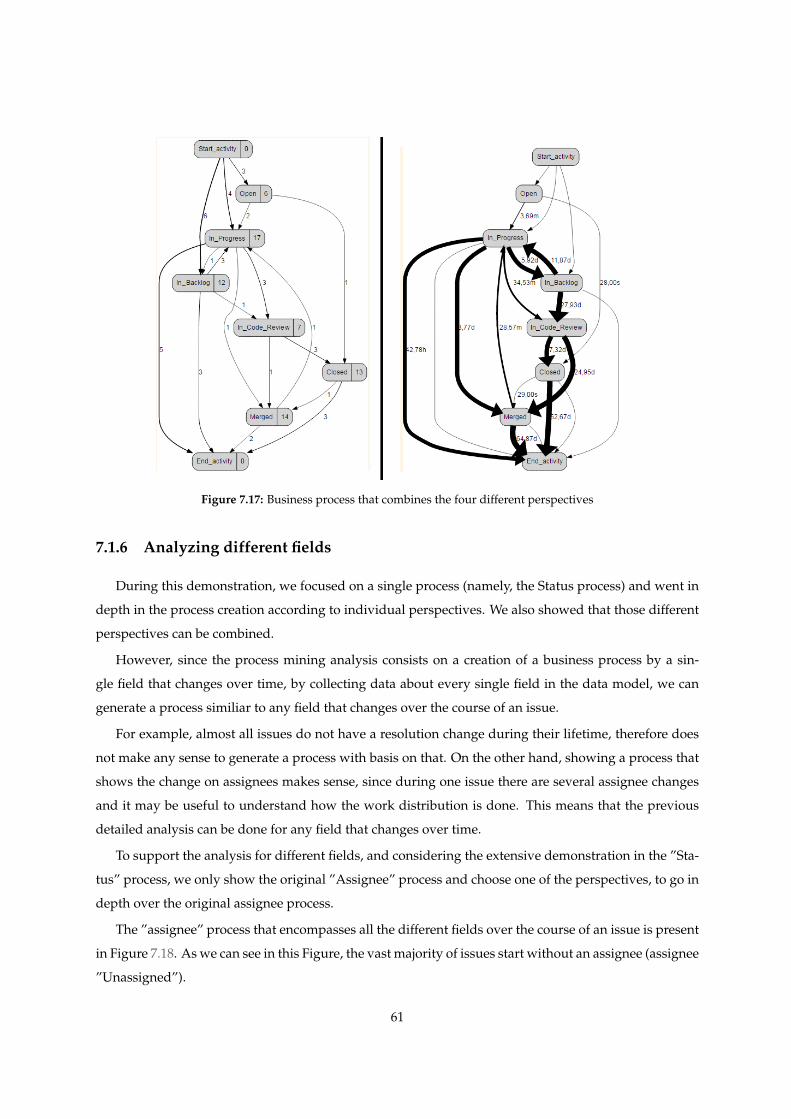
Figure 7.17: Business process that combines the four different perspectives
7.1.6 Analyzing different fields
During this demonstration, we focused on a single process (namely, the Status process) and went in
depth in the process creation according to individual perspectives. We also showed that those different
perspectives can be combined.
However, since the process mining analysis consists on a creation of a business process by a sin-
gle field that changes over time, by collecting data about every single field in the data model, we can
generate a process similiar to any field that changes over the course of an issue.
For example, almost all issues do not have a resolution change during their lifetime, therefore does
not make any sense to generate a process with basis on that. On the other hand, showing a process that
shows the change on assignees makes sense, since during one issue there are several assignee changes
and it may be useful to understand how the work distribution is done. This means that the previous
detailed analysis can be done for any field that changes over time.
To support the analysis for different fields, and considering the extensive demonstration in the ”Sta-
tus” process, we only show the original ”Assignee” process and choose one of the perspectives, to go in
depth over the original assignee process.
The ”assignee” process that encompasses all the different fields over the course of an issue is present
in Figure 7.18. As we can see in this Figure, the vast majority of issues start without an assignee (assignee
”Unassigned”).
61

Figure 7.18: Business process that reflects the Assignee exchange of PLAT over the issue execution
Considering that, once again, the general analysis takes into account all the issues and not only the
completed ones, we drill-down the process according with the ”Resolution” perspective and try to get
all the issues with ”Done” resolution.
We showed this because it makes sense to showcase the work distribution in issues that were com-
pleted, to have the full scope of how the work is being distributed.
Figure 7.19: Business process - assignee - with resolution Done (Work has been completed on this issue
Figure 7.19 shows a more detailed process that showcases the assignee changes for completed issues
with resolution ”Done”.
For those issues that start without an assignee (”Unassigned”), Calen and John are the two persons
that are responsible for more issues.
62

In some issues, the work is shared between Calen Pennington, Ali Mohammad and John Eskew, with
Calen and John sharing some of the work between them (this can be observed due to a cycle between
them).
Once again, the ”Assignee” analysis (or any other analysis for any kind of other field that applies)
can be as detailed as the previously shown ”Status” analysis.
For ”Status”, we analyzed according to 4 different perspectives: priority, resolution, type and as-
signee. For ”Assignee”, we can use the first three perspectives, plus analyzing by status. If we want to
know who is the main person responsible for triaging the issues (status ”Needs Triage”), we select that
status and we obtain a process of all assignees from when that status was present.
63

64
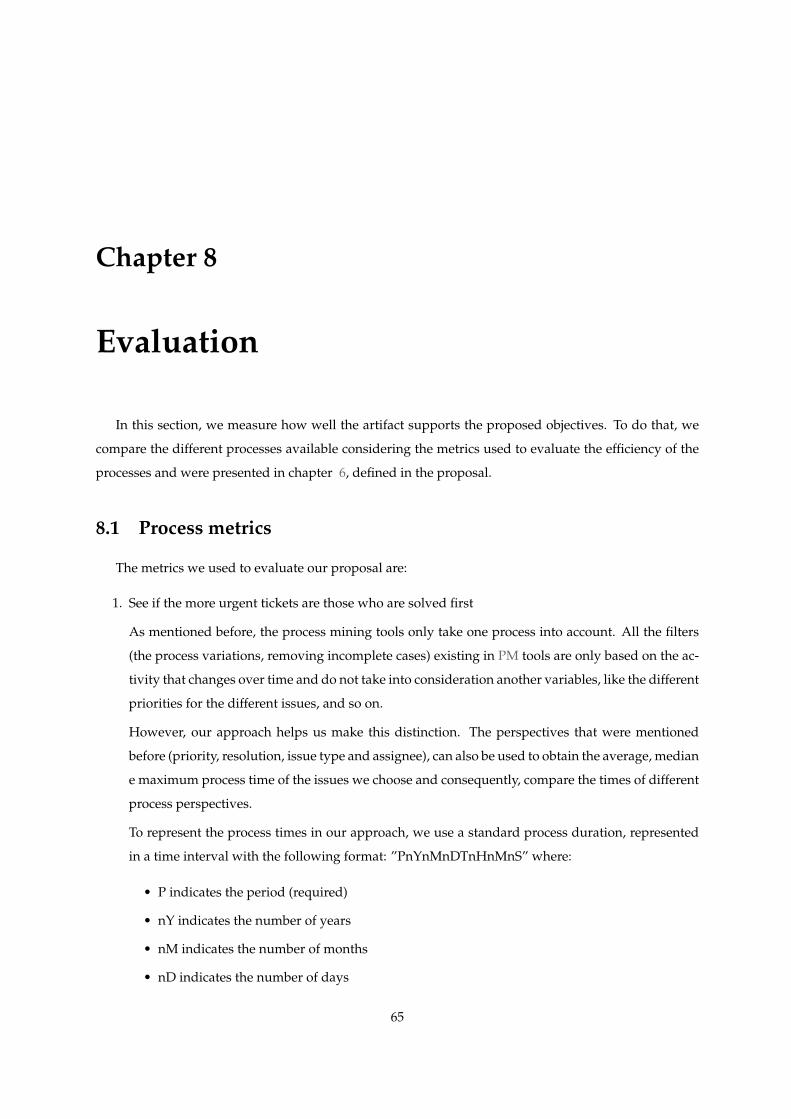
Chapter 8
Evaluation
In this section, we measure how well the artifact supports the proposed objectives. To do that, we
compare the different processes available considering the metrics used to evaluate the efficiency of the
processes and were presented in chapter 6, defined in the proposal.
8.1 Process metrics
The metrics we used to evaluate our proposal are:
1. See if the more urgent tickets are those who are solved first
As mentioned before, the process mining tools only take one process into account. All the filters
(the process variations, removing incomplete cases) existing in PM tools are only based on the ac-
tivity that changes over time and do not take into consideration another variables, like the different
priorities for the different issues, and so on.
However, our approach helps us make this distinction. The perspectives that were mentioned
before (priority, resolution, issue type and assignee), can also be used to obtain the average, median
e maximum process time of the issues we choose and consequently, compare the times of different
process perspectives.
To represent the process times in our approach, we use a standard process duration, represented
in a time interval with the following format: ”PnYnMnDTnHnMnS” where:
• P indicates the period (required)
• nY indicates the number of years
• nM indicates the number of months
• nD indicates the number of days
65
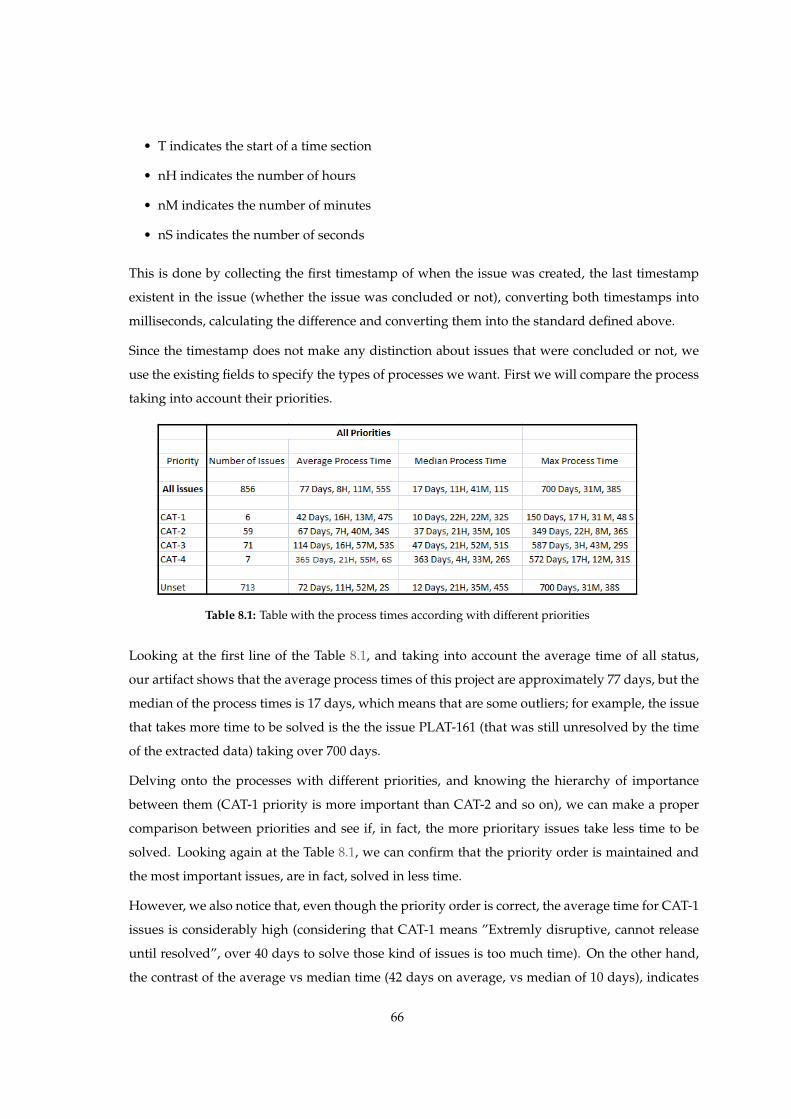
• T indicates the start of a time section
• nH indicates the number of hours
• nM indicates the number of minutes
• nS indicates the number of seconds
This is done by collecting the first timestamp of when the issue was created, the last timestamp
existent in the issue (whether the issue was concluded or not), converting both timestamps into
milliseconds, calculating the difference and converting them into the standard defined above.
Since the timestamp does not make any distinction about issues that were concluded or not, we
use the existing fields to specify the types of processes we want. First we will compare the process
taking into account their priorities.
Table 8.1: Table with the process times according with different priorities
Looking at the first line of the Table 8.1, and taking into account the average time of all status,
our artifact shows that the average process times of this project are approximately 77 days, but the
median of the process times is 17 days, which means that are some outliers; for example, the issue
that takes more time to be solved is the the issue PLAT-161 (that was still unresolved by the time
of the extracted data) taking over 700 days.
Delving onto the processes with different priorities, and knowing the hierarchy of importance
between them (CAT-1 priority is more important than CAT-2 and so on), we can make a proper
comparison between priorities and see if, in fact, the more prioritary issues take less time to be
solved. Looking again at the Table 8.1, we can confirm that the priority order is maintained and
the most important issues, are in fact, solved in less time.
However, we also notice that, even though the priority order is correct, the average time for CAT-1
issues is considerably high (considering that CAT-1 means ”Extremly disruptive, cannot release
until resolved”, over 40 days to solve those kind of issues is too much time). On the other hand,
the contrast of the average vs median time (42 days on average, vs median of 10 days), indicates
66
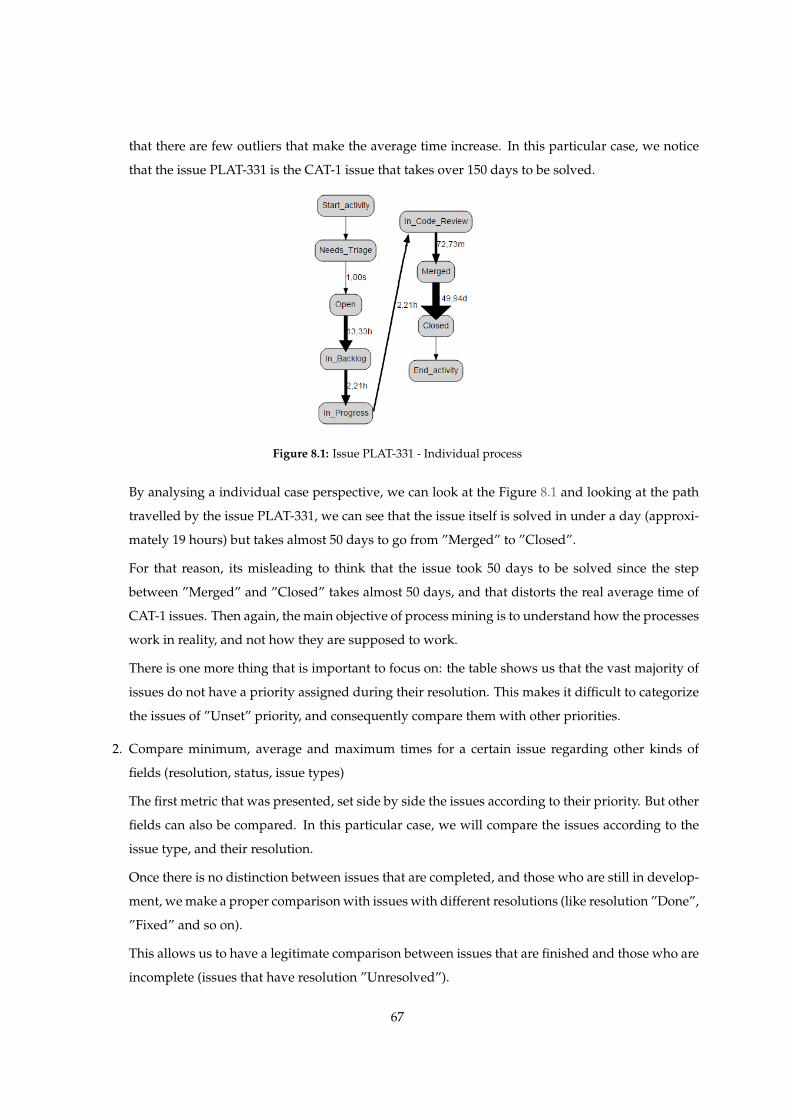
that there are few outliers that make the average time increase. In this particular case, we notice
that the issue PLAT-331 is the CAT-1 issue that takes over 150 days to be solved.
Figure 8.1: Issue PLAT-331 - Individual process
By analysing a individual case perspective, we can look at the Figure 8.1 and looking at the path
travelled by the issue PLAT-331, we can see that the issue itself is solved in under a day (approxi-
mately 19 hours) but takes almost 50 days to go from ”Merged” to ”Closed”.
For that reason, its misleading to think that the issue took 50 days to be solved since the step
between ”Merged” and ”Closed” takes almost 50 days, and that distorts the real average time of
CAT-1 issues. Then again, the main objective of process mining is to understand how the processes
work in reality, and not how they are supposed to work.
There is one more thing that is important to focus on: the table shows us that the vast majority of
issues do not have a priority assigned during their resolution. This makes it difficult to categorize
the issues of ”Unset” priority, and consequently compare them with other priorities.
2. Compare minimum, average and maximum times for a certain issue regarding other kinds of
fields (resolution, status, issue types)
The first metric that was presented, set side by side the issues according to their priority. But other
fields can also be compared. In this particular case, we will compare the issues according to the
issue type, and their resolution.
Once there is no distinction between issues that are completed, and those who are still in develop-
ment, we make a proper comparison with issues with different resolutions (like resolution ”Done”,
”Fixed” and so on).
This allows us to have a legitimate comparison between issues that are finished and those who are
incomplete (issues that have resolution ”Unresolved”).
67
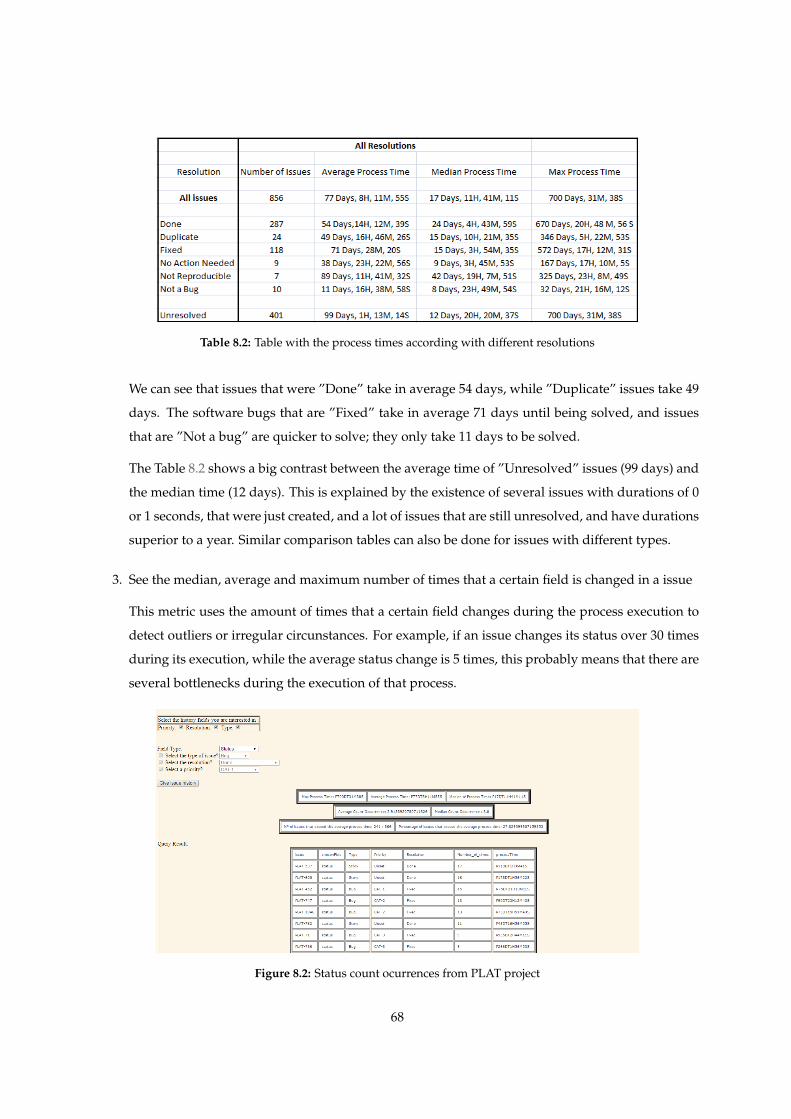
Table 8.2: Table with the process times according with different resolutions
We can see that issues that were ”Done” take in average 54 days, while ”Duplicate” issues take 49
days. The software bugs that are ”Fixed” take in average 71 days until being solved, and issues
that are ”Not a bug” are quicker to solve; they only take 11 days to be solved.
The Table 8.2 shows a big contrast between the average time of ”Unresolved” issues (99 days) and
the median time (12 days). This is explained by the existence of several issues with durations of 0
or 1 seconds, that were just created, and a lot of issues that are still unresolved, and have durations
superior to a year. Similar comparison tables can also be done for issues with different types.
3. See the median, average and maximum number of times that a certain field is changed in a issue
This metric uses the amount of times that a certain field changes during the process execution to
detect outliers or irregular circunstances. For example, if an issue changes its status over 30 times
during its execution, while the average status change is 5 times, this probably means that there are
several bottlenecks during the execution of that process.
Figure 8.2: Status count ocurrences from PLAT project
68
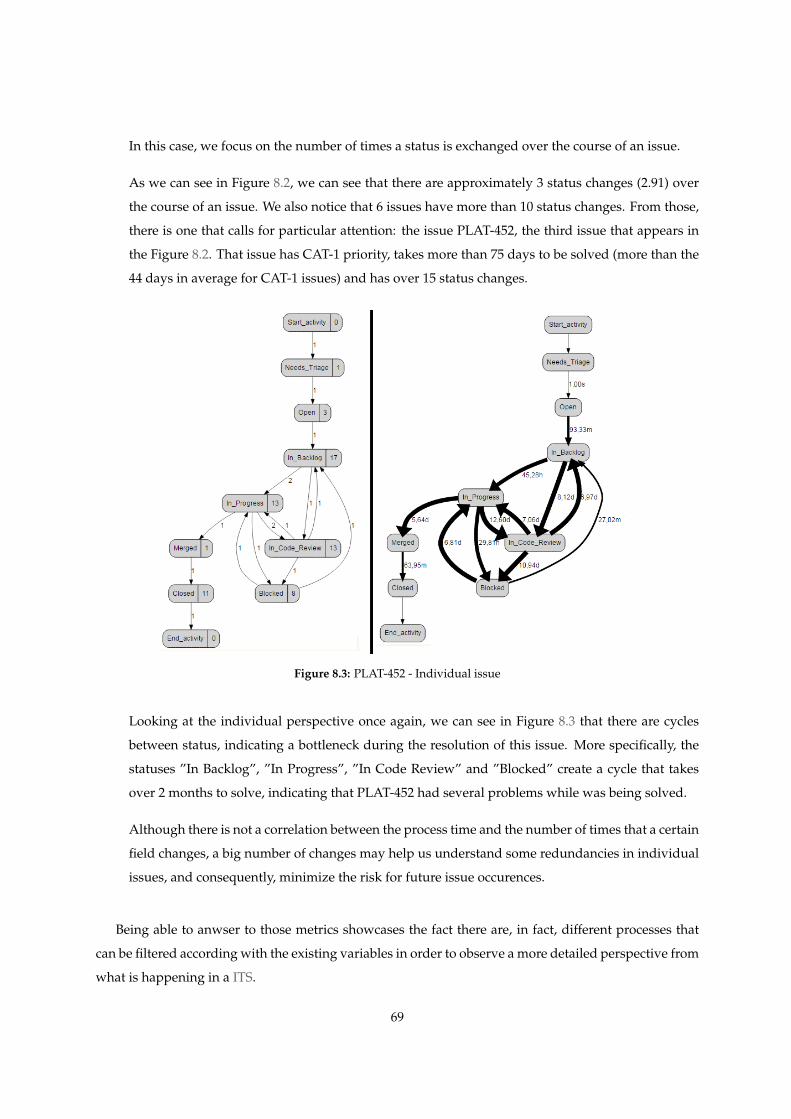
In this case, we focus on the number of times a status is exchanged over the course of an issue.
As we can see in Figure 8.2, we can see that there are approximately 3 status changes (2.91) over
the course of an issue. We also notice that 6 issues have more than 10 status changes. From those,
there is one that calls for particular attention: the issue PLAT-452, the third issue that appears in
the Figure 8.2. That issue has CAT-1 priority, takes more than 75 days to be solved (more than the
44 days in average for CAT-1 issues) and has over 15 status changes.
Figure 8.3: PLAT-452 - Individual issue
Looking at the individual perspective once again, we can see in Figure 8.3 that there are cycles
between status, indicating a bottleneck during the resolution of this issue. More specifically, the
statuses ”In Backlog”, ”In Progress”, ”In Code Review” and ”Blocked” create a cycle that takes
over 2 months to solve, indicating that PLAT-452 had several problems while was being solved.
Although there is not a correlation between the process time and the number of times that a certain
field changes, a big number of changes may help us understand some redundancies in individual
issues, and consequently, minimize the risk for future issue occurences.
Being able to anwser to those metrics showcases the fact there are, in fact, different processes that
can be filtered according with the existing variables in order to observe a more detailed perspective from
what is happening in a ITS.
69
8.2 Semantic annotations
During our demonstration, the semantic annotations present in our ontology provided a richer con-
ceptualization of a ITS. By storing data about priorities, resolutions, and other terms alike in an ontology,
we can store a set of concepts that are prevalent in ITS as a whole and have a better understanding of
them thanks to their descriptions.
As mentioned in [16], two main reasons of using an ontology are ”sharing common understanding of
the structure of information among people or software agents” and to ”enable reuse of domain knowl-
edge”. This is supported by providing a populated ontology of a ITS that can serve as a repository for
storing all kinds of different definitions, and share it via Web. This way, a central repository can be used
by everybody to fill the different kinds of fields with the appropriate descriptions.
Therefore, the proposed artifact that generates the business processes with a bigger level of detail,
will be richer, since every field will have a list of semantic annotations associated, that gives context to
the existing labels in ITS.
Thanks to the semantic annotations, we enhanced the process analysis in three different viewpoints
in our artifact:
1. Priorities
Thanks to the descriptions found in priorities, we could define a proper hierarchy between them
(CAT-1 to CAT-4), something that would be impossible to do, if we did not had a description of
what those terms meant.
In this particular case, the priority descriptions helped us understand what those terms mean and
how they rank with each other in terms of importance.
That ranking allowed us to make a proper comparison between processes with different priorities,
confirming if the most important issues are solved in less time.
2. Issue types and status
By providing a description of the different issue types, and another description of available status,
we can contextualize them and understand what are the status that should or should not appear
in a certain type of issue.
For example, it makes sense that the status Icebox - an ”item that is given a low priority on the
prioritized Product Backlog, and is set aside or saved for later development”. should only belong
to ”story” issues or ”epic” issues, that are bigger ”story” issues.
A product backlog is a term usually used in agile methodologies, like Scrum, and is a list of features
to be implemented by the development team. Therefore, the term ”Product Backlog” present in the
70

”Icebox” description indicates that the ”Icebox” should only appear in ”Status” issues (or ”Epic”
issues - that are lists of ”Status” issues)
3. Resolutions
Through the descriptions of resolutions, a correlation was made between ”Unresolved” issues and
any other kind of issues that are complete; ”Unresolved” issues (”The issue was not solved / is
being worked on”) are incomplete, either by being in the very beginning of their creation (issues
with 1/2 seconds that did not suffer any changes), or issues that are in backlog or any other kind
of intermediate status.
By analyzing the different resolutions and their corresponding descriptions, we understood that
the ”Unresolved” status can be ignored for a general process analysis of finished issues.
71

72
Chapter 9
Conclusion
In this section, we will summarize the main themes that were presented in this thesis.
The main objective of this proposal was the creation of a knowledge base for an ITS that gathers
information from the event logs, and allows the execution of queries in order to parametrize the creation
of process models at a finer level of granularity.
In chapter 2, we presented the research area: ITS. We talked about the main functions of a ITS, their
benefits and showed a practical example of a issue tracking system: Jira.
In chapter 3, we explored the related work in the PM area. The main components are mentioned
and the two main PM tools are presented in detail. The relation between PM and the semantic area is
presented, with emphasis to the main building blocks: ontologies and semantic annotations. The main
ontology languages (RDF, RDFS, and OWL) are presented.
We followed with the research paradigm that was used in the implementation of this thesis, trying
to solve an objective for a real-life problem. That same problem is identified in the following chapter:
the utilization of a event log that takes only one activity into account leads to the creation of generic
business processes that do not take into consideration the other fields that exist in ITS.
Our approach provided a additional architecture layer between the event log obtainment and the
automatic process model creation that deals with the different fields by storing the existing data in a
repository, querying them to obtain a specific subset of an event log that can be loaded into a process
mining algorithm. By doing that, the proposed artifact can create dozens of process models tailored for
the end user, according to the chosen input.
The steps for the creation of this artifact are detailed in chapter 6. This includes the metamodel
creation of a ITS, the process of obtaining the event log and loading that log into the representation
model, the query building part that parametrizes the user input in order to select a relevant subset of
the event log and the implementation of the process mining algorithm that generates automatically the
business process.
73
Afterwards, we went in depth according to four different fields in the ontology; four different per-
spectives that generated more than a dozen of different processes (five from ”Priority” analysis, four
from ”Resolution”, four from issue ”Type” and two from ”Assignee”), all from one single process, show-
casing that the different fields available allow for a more detailed process creation. Although, this was
only done for a few fields in every type of analysis (due to the lack of space), this can be done for every
single field in a column, allowing to increase considerably the number of generated processes.
In summary, our proposal streamlines the process of obtaining event logs for different analysis since
all the relevant data is already stored in a data model and therefore, by choosing the correct fields, we
can obtain a business process that conforms with the fields of our choosing, instead of getting a different
log for each process.
Finally, we used several metrics to compare the time of the different processes in order to compare
the times and evaluate the efficiency between them.
9.1 Future Work
From the proposed approach, we opted to implement ontologies as a semantic data model for three
reasons:
1. Using them as a portable data model since the model and the data are integrated in a logical
manner that can be easily carried to any application.
2. The semantic approach that includes the definition of all the different fields that are stored in the
model.
3. Being an conceptual representation of a knowledge domain made to be distributed in the web,
makes it easier to collect different kinds of fields and getting an uniform representation of the
descripted fields.
However, querying models with thousands of issues is relatively slow. Therefore, for future work,
we might try to implement our approach with databases instead of ontologies to increase the query
speed that supports the creation of business processes. The structural concept is the same, including the
chosen metamodel. However, the schema is implemented in a database and the parametrized queries
from the artifact are done in SQL instead of SPARQL.
Additionaly, more fields can be added to the main schema to obtain a richer conceptualization of a
issue tracking system.
We will continue to collect more information about different issue tracking projects in order to obtain
more different fields with proper descriptions added to them, in order to have a more complete base
model and publish it in the Web.
74
Bibliography
[1] W. van der Aalst, Process Mining: Discovery, Conformance and Enhancement of Business Processes, 2011,
vol. 136, no. 2.
[2] A. D. Medeiros, A. Karla, and V. D. Aalst, “Semantic process mining tools: Core building blocks,”
in In 16th European Conference on Information Systems, 2008.
[3] W. Humphrey, “Why big software projects fail: the 12 key questions,” The Software Engineering
Institute, vol. 18, no. 3, pp. 25–29, 2005.
[4] J. Janak, “Issue tracking systems,” pp. 9–13, 2009.
[5] W. e. a. Van Der Aalst, “Process mining manifesto,” Lecture Notes in Business Information Processing,
vol. 99 LNBIP, pp. 169–194, 2012.
[6] D. Georgakopoulos, M. Hornick, and A. Sheth, “An overview of workflow management: From
process modeling to workflow automation infrastructure,” Distributed and Parallel Databases, vol. 3,
no. 2, pp. 119–153, 1995.
[7] J. Fisher, D. Koning, and A. P. Ludwigsen, “Utilizing Atlassian Jira For Large-Scale Software De-
velopment Management,” in Proceedings of the 14th International Conference on Accelerator & Large
Experimental Physics Control Systems (ICALEPCS), 2013.
[8] A. K. Alves de Medeiros and W. M. P. van der Aalst, “Process mining towards semantics,” in Ad-
vances in Web Semantics I - Ontologies, Web Services and Applied Semantic Web, 2008, vol. 4891 LNCS,
pp. 35–80.
[9] W. M. P. Van Der Aalst and B. F. V. Dongen, “ProM : The Process Mining Toolkit,” Industrial Engi-
neering, vol. 489, pp. 1–4, 2009.
[10] B. F. van Dongen, A. K. A. de Medeiros, H. M. W. Verbeek, A. Weijters, and W. M. P. van der Aalst,
“The ProM framework: A new era in process mining tool support,” in Applications and theory of
Petri Nets, vol. 3536, no. i, 2005, pp. 444–454.
75
[11] C. W. Gunther and A. Rozinat, “Disco: Discover your processes,” in CEUR Workshop Proceedings,
vol. 936, 2012, pp. 40–44.
[12] C. W. Gunther and W. M. P. V. D. Aalst, “Fuzzy Mining – Adaptive Process Simplification Based
on Multi-perspective Metrics,” Business Process Management - Lecture Notes in Computer Science, vol.
4714, pp. 328–343, 2007.
[13] A. K. Alves de Medeiros, C. Pedrinaci, W. M. P. van der Aalst, J. Domingue, M. Song, A. Rozinat,
B. Norton, and L. Cabral, “An Outlook on Semantic Business Process Mining and Monitoring,”
Proceedings of the On the Move to Meaningful Internet Systems 2007 Workshops, vol. 4806, pp. 1244–
1255, 2007.
[14] F. Lautenbacher, B. Bauer, and C. Seitz, “Semantic Business Process Modeling-Benefits and Capa-
bility.” AI Meets Business Rules and Process, 2008.
[15] T. R. Gruber, “Toward Principles for the Design of Ontologies,” International Journal of Human-
Computer Studies, vol. 43, no. 5-6, pp. 907–928, 1995.
[16] N. Noy and D. McGuinness, “Ontology development 101: A guide to creating your first ontology,”
Development, vol. 32, pp. 1–25, 2001.
[17] M. Uschold and M. Gruninger, “Ontologies: Principles, methods and applications,” Knowledge En-
gineering Review, vol. 11, no. 2, pp. 93–136, 1996.
[18] D. L. McGuinness and F. van Harmelen, “OWL Web Ontology Language Overview,” Tech. Rep.,
2004.
[19] G. Klyne and J. J. Carroll, “Resource Description Framework (RDF): Concepts and Abstract Syn-
tax,” W3C Recommendation, vol. 10, pp. 1—-20, 2004.
[20] W3C Working Group, “RDF 1.1 XML Syntax,” 2014.
[21] D. Brickley and R. Guha, “RDF Schema 1.1 - W3C Recommendation,” pp. 91–122, 2008.
[22] M. K. Smith, C. Welty, and D. L. McGuinness, “Owl web ontology language guide, W3C Recom-
mendation,” Tech. Rep., 2004.
[23] E. H. M. W. Verbeek, J. C. A. M. Buijs, B. F. van Dongen, and W. M. P. van der Aalst, “XES, XESame,
and ProM 6,” Lecture Notes in Business Information Processing, vol. 72 LNBIP, pp. 60–75, 2011.
[24] J. Buijs, “Mapping Data Sources to XES in a Generic Way,” Chelsea, no. March, p. 123, 2010.
[25] J. Perez, M. Arenas, and C. Gutierrez, “Semantics and Complexity of SPARQL,” in The Semantic
Web - ISWC 2006, 2006, vol. 4273, pp. 30–43.
76
[26] A. R. Hevner, S. T. March, J. Park, and S. Ram, “Design Science in Information Systems Research,”
MIS Quarterly, vol. 28, no. 1, pp. 75–105, 2004.
[27] H. A. Simon, The Sciences of the Artificial, 1969, vol. 1.
[28] K. Peffers, T. Tuunanen, M. a. Rothenberger, and S. Chatterjee, “A Design Science Research Method-
ology for Information Systems Research,” Journal of Management Information Systems, vol. 24, no. 3,
pp. 45–77, 2008.
[29] N. Prat, I. Comyn-Wattiau, and J. Akoka, “Artifact Evaluation in Information Systems Design-
Science Research - A Holistic View,” in 8th Pacific Asia Conference on Information Systems, Chengdu,
China, 2014.
[30] C. Martinez-Cruz, I. J. Blanco, and M. A. Vila, “Ontologies versus relational databases: Are they so
different? a comparison,” Artif. Intell. Rev., vol. 38, no. 4, pp. 271–290, Dec. 2012.
[31] A. J. M. M. Weijters and J. T. S. Ribeiro, “Flexible heuristics miner (FHM),” in IEEE SSCI 2011:
Symposium Series on Computational Intelligence - CIDM 2011: 2011 IEEE Symposium on Computational
Intelligence and Data Mining, 2011, pp. 310–317.
77

78