Using PERT in Portfolio Management - betterinvesting.org · Using PERT in Portfolio ......
15
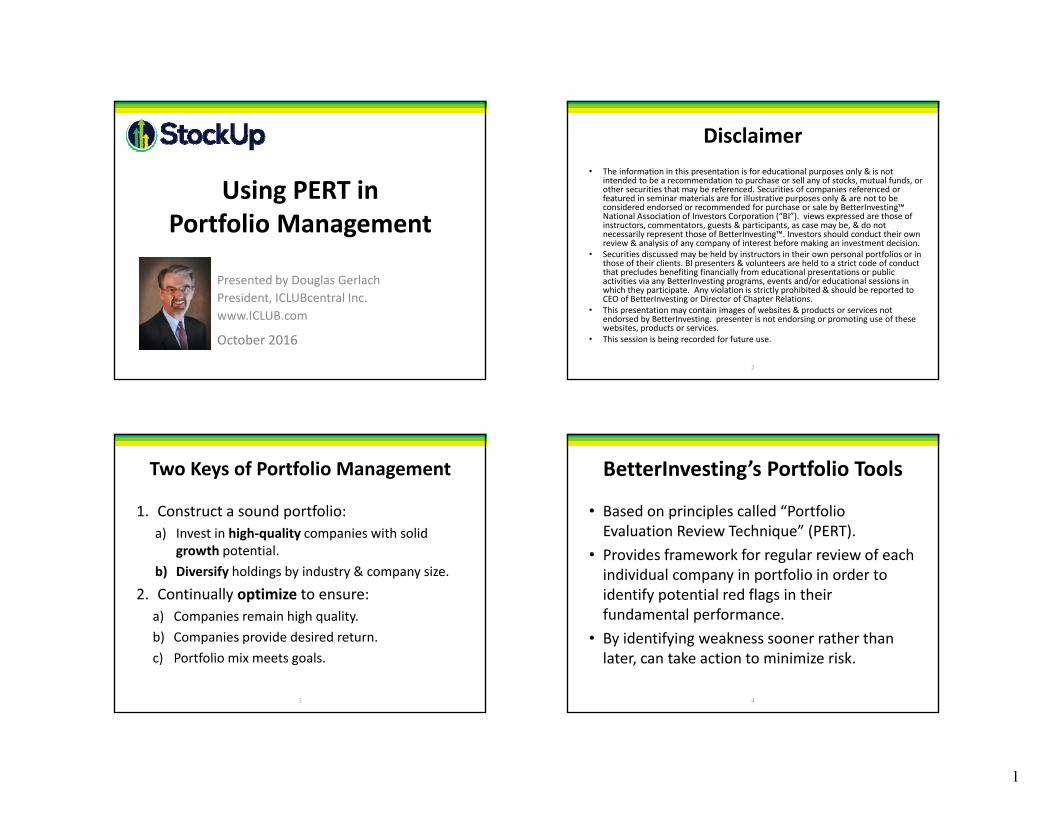
10/4/2016 1 Using PERT in Portfolio Management Presented by Douglas Gerlach President, ICLUBcentral Inc. www.ICLUB.com October 2016 Disclaimer • The information in this presentation is for educational purposes only & is not intended to be a recommendation to purchase or sell any of stocks, mutual funds, or other securities that may be referenced. Securities of companies referenced or featured in seminar materials are for illustrative purposes only & are not to be considered endorsed or recommended for purchase or sale by BetterInvesting™ National Association of Investors Corporation (“BI”). views expressed are those of instructors, commentators, guests & participants, as case may be, & do not necessarily represent those of BetterInvesting™. Investors should conduct their own review & analysis of any company of interest before making an investment decision. • Securities discussed may be held by instructors in their own personal portfolios or in those of their clients. BI presenters & volunteers are held to a strict code of conduct that precludes benefiting financially from educational presentations or public activities via any BetterInvesting programs, events and/or educational sessions in which they participate. Any violation is strictly prohibited & should be reported to CEO of BetterInvesting or Director of Chapter Relations. • This presentation may contain images of websites & products or services not endorsed by BetterInvesting. presenter is not endorsing or promoting use of these websites, products or services. • This session is being recorded for future use. 2 Two Keys of Portfolio Management 1. Construct a sound portfolio: a) Invest in high‐quality companies with solid growth potential. b) Diversify holdings by industry & company size. 2. Continually optimize to ensure: a) Companies remain high quality. b) Companies provide desired return. c) Portfolio mix meets goals. 3 BetterInvesting’s Portfolio Tools • Based on principles called “Portfolio Evaluation Review Technique” (PERT). • Provides framework for regular review of each individual company in portfolio in order to identify potential red flags in their fundamental performance. • By identifying weakness sooner rather than later, can take action to minimize risk. 4
Transcript of Using PERT in Portfolio Management - betterinvesting.org · Using PERT in Portfolio ......
10/4/2016
1
Using PERT inPortfolio Management
Presented by Douglas GerlachPresident, ICLUBcentral Inc.www.ICLUB.com
October 2016
Disclaimer• The information in this presentation is for educational purposes only & is not
intended to be a recommendation to purchase or sell any of stocks, mutual funds, or other securities that may be referenced. Securities of companies referenced or featured in seminar materials are for illustrative purposes only & are not to be considered endorsed or recommended for purchase or sale by BetterInvesting™ National Association of Investors Corporation (“BI”). views expressed are those of instructors, commentators, guests & participants, as case may be, & do not necessarily represent those of BetterInvesting™. Investors should conduct their own review & analysis of any company of interest before making an investment decision.
• Securities discussed may be held by instructors in their own personal portfolios or in those of their clients. BI presenters & volunteers are held to a strict code of conduct that precludes benefiting financially from educational presentations or public activities via any BetterInvesting programs, events and/or educational sessions in which they participate. Any violation is strictly prohibited & should be reported to CEO of BetterInvesting or Director of Chapter Relations.
• This presentation may contain images of websites & products or services not endorsed by BetterInvesting. presenter is not endorsing or promoting use of these websites, products or services.
• This session is being recorded for future use.
2
Two Keys of Portfolio Management
1. Construct a sound portfolio:a) Invest in high‐quality companies with solid
growth potential.b) Diversify holdings by industry & company size.
2. Continually optimize to ensure:a) Companies remain high quality.b) Companies provide desired return.c) Portfolio mix meets goals.
3
BetterInvesting’s Portfolio Tools
• Based on principles called “Portfolio Evaluation Review Technique” (PERT).
• Provides framework for regular review of each individual company in portfolio in order to identify potential red flags in their fundamental performance.
• By identifying weakness sooner rather than later, can take action to minimize risk.
4

10/4/2016
2
BetterInvesting’s Portfolio ToolsCore SSG, SSGPlus, Toolkit 6:• Summary Report: Overview of portfolio focusing on SSG zoning.
SSGPlus, Toolkit 6:• PERT Report: Master report of all stocks in portfolio.• Diversification Reports: By Sector & Industry or by Company Size.• Quarterly Growth Trend Graph & Table (aka PERT Worksheet A ):
Graph & table of fundamental quarterly performance.
Toolkit 6:• PERT Worksheet B (aka Annual P/E Analysis): Tracks annual average
P/E Ratios (not in Online Tools).• Portfolio Management Guide: Tracks monthly PE Ratios, price, &
relative value (not in Online Tools).
5
Where Did That Number Come From?
6
PORTFOLIO REPORTINGIN DETAIL
7
Before Initiating Portfolio Review
• Stock studies must be updated (both data & judgment) prior to review on PERT.
• Historical data is based on actual results as included in data.
• All projected future values are based on your individual judgment of each company.
8

10/4/2016
3
CoreSSG & SSGPlus Portfolio Reports
Access from My Tools on BI website.
9
Click New Portfolio to create new portfolio,
Or select existing Portfolio.
Portfolio Actions
• Click icons to Refresh Data, Edit, Delete, or View Reports.
10
Selecting Reports
11
Select from available reports from Report Options at top.
Click PDF icon to download, save, or print formatted report.
SUMMARY REPORT
Overview of Portfolio Focusing on Valuation & SSG Zoning.
(CoreSSG, SSGPlus, Toolkit 6.)
12

10/4/2016
4
Summary Report
• Purely related to valuation & useful for reviewing Price as relates to buy zone.– Red price indicates “stale” data.
• Judgment items (Buy Below, Sell Above, Upside/Downside, % Total Return) come from your SSG.
• Recommends Buy if US/DS > 3 and % Total Return > 15% and Price is below “Buy Below.”– Confirm recommendation before taking action.
13
PERT REPORT
Master Report of All Stocks in Portfolio.
(SSGPlus, Toolkit 6.)
14
Two Purposes of PERT
1. Identify fundamental company weakness to determine possible sell signs.
2. Review current valuation of each stock in portfolio to determine if sale or additional purchase is warranted.
15
PERT Report
16

10/4/2016
5
PERT Report Highlighting
• Red shading indicates potential red flags.
• Yellow highlighting indicates caution.
• Red text indicates outdated prices or data.
17
PERT Report Navigation
• Click any column header to sort by that column in ascending/descending order.
18
1. IDENTIFY COMPANY WEAKNESSDo recent trends show that company is on track to meet your growth projections?
19
Identify Weakness: Left Side of PERT• View companies’ quarterly operations & percent changes from last quarter.• Compare to your Estimated EPS Growth Projection (on right side of table).
20
EPS – Quarterly
Sales – Quarterly
PTP – Quarterly
EPS – TTM
EPS—Proj

10/4/2016
6
Red Flags
• PERT highlights in red shading values that are below your long‐term projected growth rates.
21
Interpreting the Report
• Pay special attention to changes in PTP growth.– PTP is not affected by share buybacks or issuances, so can provide better insight into fundamental profitability.
• Beware if quarterly/TTM results are below your long‐term projected growth of EPS & Sales.
• If trend continues, your projected growth rates will not be achieved!
22
Red Flags in Recent Performance
23
Note: PTP results are compared to EPS projected growth rate.
Taking Action on Company Weakness
• If recent results don’t support your projections:– Do you need to lower your projections?– Is company experiencing short‐term troubles that may get resolved?
– Is company experiencing problem that will affect results long‐term?
24

10/4/2016
7
2. REVIEW VALUATIONIs the stock overvalued at its current price? Or would it be wise to add to your position at this price?
25
Review Valuation• Right side of PERT Report.• Various valuation metrics to support buy/sell/hold decision.
26
Proj PE
Proj RV
Proj PE Ratios
PEG Ratio
U/DRatio
Proj Total Return
Key Definitions
• Projected PE: Current Price ÷ Forward 12‐month (FTM) EPS .
• Projected Relative Value: Projected PE Ratio ÷ Average Projected PE Ratio.
• Projected High, Low, Average PE Ratios: From your SSG Section 4 PE Ratio selections.
• PEG Ratio: P/E Ratio ÷ Projected EPS Growth Rate.
27
Proj PE
Proj RV
Proj PE Ratios
PEG Ratio
PERT – Right Side
28

10/4/2016
8
Identifying Sell Candidates• Projected RV:
– Above 150% is “expensive” or “overvalued.”– Below 80% is “suspicious” – stock is so depressed in price that
fundamentals may be weakening or average valuation is declining.
• Upside/Downside Ratio:– Below 1.0 is too low for risk of investing in stocks.
• High Price:– If Current Price comes close or exceeds Projected High Price,
stock is at high end of typical valuation range.• Projected Total Return:
– Flagged if below 10%; too much further below that is too little return for level of risk of investing in stocks.
29
Identifying Buy Candidates
• Projected RV:– Around 100% is “fair price” territory.
• PEG Ratio:– Around or below 1.0.
• Upside/Downside Ratio:– 3.0 or higher.
• Projected Total Return:– 15% or higher.
30
31
Time for QuestionsDIVERSIFICATION REPORTS
How well is your portfolio is diversified.(SSGPlus, Toolkit 6.)
32

10/4/2016
9
Diversification Rules of Thumb• Diversification is moving target.
– Portfolio will never be “perfect.”– Aim to always improve your diversification.
• Concentrated holdings are best.– Never hold stock or industry less than 3% of total portfolio.– Avoid stock, industry, or sector concentrations about 25% of total portfolio.
• Include small, midsized, & large companies in portfolio.– 25% small (revs < $1B).– 50% midsized (revs between $1B and $10B).– 25% large (revs > $10B).– Avoid holding too many companies with revs > $25B.
33
Sector & Industry Diversification
34
35 36

10/4/2016
10
Company Size Diversification
37 38
Time for Questions
QUARTERLY GROWTH TRENDS
Dig deeper when red flags appear.(SSGPlus, Toolkit 6.)
39
Quarterly Growth Trends
• Formerly known as PERT‐A.• Provides “closer look” after reviewing PERT Report for portfolio.
• Tracks subtle changes in individual company performance that spotlight potential down trends before they have deep impact.
• Compares recent trends to historical trends.– Tracks company’s performance during “thick” & “thin.”
• Charts percentage of change of Sales, EPS, & Pre‐Tax Profit on quarterly or trailing 4‐quarter basis.
40

10/4/2016
11
Accessing Quarterly Trends
• Open SSG, then click Quarterly Data tab.
41
QUARTERLY GROWTH TREND GRAPH
42
Suggested settings: Trailing 4 Quarters, EPS Growth Reference Line, PTP.
Limiting to 50% Growth
43
Limiting growth to 50% allows better analysis of trends when outliers or earlier high growth may exist.
What to Look For
• PTP growth should be above EPS Growth Projection line.– If PTP growth is below EPS growth line, growth is slowing dangerously.
– If PTP growth is below 0%, growth has stalled completely.
• 3‐5 quarters of downtrend in PTP growth rate is warning sign.
44

10/4/2016
12
QUARTERLY GROWTH TREND DATA
45
Two Sides of Story:
• Left side: quarterly changes.• Right side: changes in last 12 months (TTM).
– Often more significant, since data is smoothed over four quarters.
46
Left Side ‐ Quarterly
47
% Chg ‐ Compares most recent quarter to year‐ago quarter.
Scanning for Quarterly Trends
48
Can often scan down column & observe trends.

10/4/2016
13
49
Right Side ‐ TTM
% Chg ‐ Compares sum of last 4 quarters to sum of last 4 quarters exactly 1 year ago.
50
TTM Smooths Out TrendsScan % Chg column to
observe trends.
Declining values can be troublesome.
Rates of change below projected growth rates
are problematic.
Negative figures are disastrous.
What to Look For
• Unusual rates of negative change in a quarter.• Pay particular attention to % Change TTM Pre‐Tax Profit Margins.– Compare to industry, other similar companies.
• Are sales, PTP & EPS increasing as projected on your SSG?– Beware if PTP is growing more slowly than sales.
51
Find Out Reasons for Changes
• Are changes permanent or temporary?– Investigate using online resources: company website, SEC filings, trusted sources.
• Don't sell a high quality stock because of one or two quarters of bad news.– Opinions of traders & investors with different investing styles are often irrelevant to our approach.
• BetterInvesting experience shows that it is best to hold high quality stocks during periods of over‐valuation & add to holdings during down periods.
52

10/4/2016
14
Warning!
• 3 to 5 consecutive quarters of deteriorating performance are no longer short‐term.– At 3 quarters of slowing PTP growth, companies should be watched closely.
– By 5 quarters, companies are likely candidates for replacement.
• Older data can be less relevant.• Don’t focus too much on short term trends.
53
Summary• Individual investors are generally very bad at knowing
when to sell.– Relying on discipline can be more effective than “instinct” or emotion.
• Individual investors tend not to repurchase stocks in own portfolio that have already appreciated.– Stocks of growing, quality companies have near‐infinite upside.
– You might already own the next best new stock for your portfolio.
• Ignore principles of sound portfolio management at your own peril!
54
55
Time for QuestionsN E X T S T O C K U P W E B I N A R :
November 2, 2016 “Utilize BetterInvesting Online Tools to
Review a Portfolio”Discussion led by Ken Kavula
Register at www.betterinvesting.org/stockup
56