Using HECRAS TO Evaluate Scour At Bridges -...
69
Using HECRAS TO Evaluate Using HECRAS TO Evaluate Scour At Bridges Scour At Bridges County of Orange Presented to the Flood Division August 13, 2001 by Nadeem Majaj
Transcript of Using HECRAS TO Evaluate Scour At Bridges -...

Using HECRAS TO Evaluate Using HECRAS TO Evaluate Scour At BridgesScour At Bridges
County of Orange Presented to the Flood Division
August 13, 2001by
Nadeem Majaj
Approximately 575,000 bridges are built over waterways in the US. The most common cause of bridge failure is due to bridge scour of the foundation.
In 1993, the upper Mississippi flooding caused 23 bridge failures.
In 1994, flooding in Georgia (Alberto storm) 500 bridges were scour damaged. 31 experienced 15-20 feet of scour.

Definition of ScourDefinition of ScourScour is the removal of sediment (soil and rocks) from stream beds and stream banks caused by moving water
HEC18 HEC18 -- Evaluating Scour At BridgesEvaluating Scour At Bridges
HEC18 was originally prepared by the FHWA in 1988. A fourth edition was completed in May 2001 and released to the public in July 2001
HECRAS HECRAS -- Version 3.0.1Version 3.0.1The Hydrologic Engineering Center recently released River Analysis System (HECRAS) version 3.0.1 which includes significant new features, most notably the Unsteady Flow and Bridge Scour options. The bridge scour evaluation follows closely the HEC18 (4th Edition) methodology.
No reliable equations are available to predict No reliable equations are available to predict all hydraulic flow conditions that may be all hydraulic flow conditions that may be reasonably expected to occur. Engineering reasonably expected to occur. Engineering judgement is required.judgement is required.

Hey HECRAS!HECRAS!Evaluate this!

Rate of ScourRate of Scour
Scour will reach its maximum depth in:Scour will reach its maximum depth in:•• sand and gravel bed materials in hours; sand and gravel bed materials in hours; •• cohesive bed materials in days; cohesive bed materials in days; •• glacial tills, sand stones and glacial tills, sand stones and shalesshales in months; in months; •• limestoneslimestones in years and dense granites in centuries. in years and dense granites in centuries.

Interstate 90 crossing of Schoharie Creek near Amsterdam, NY on April 5, 1987
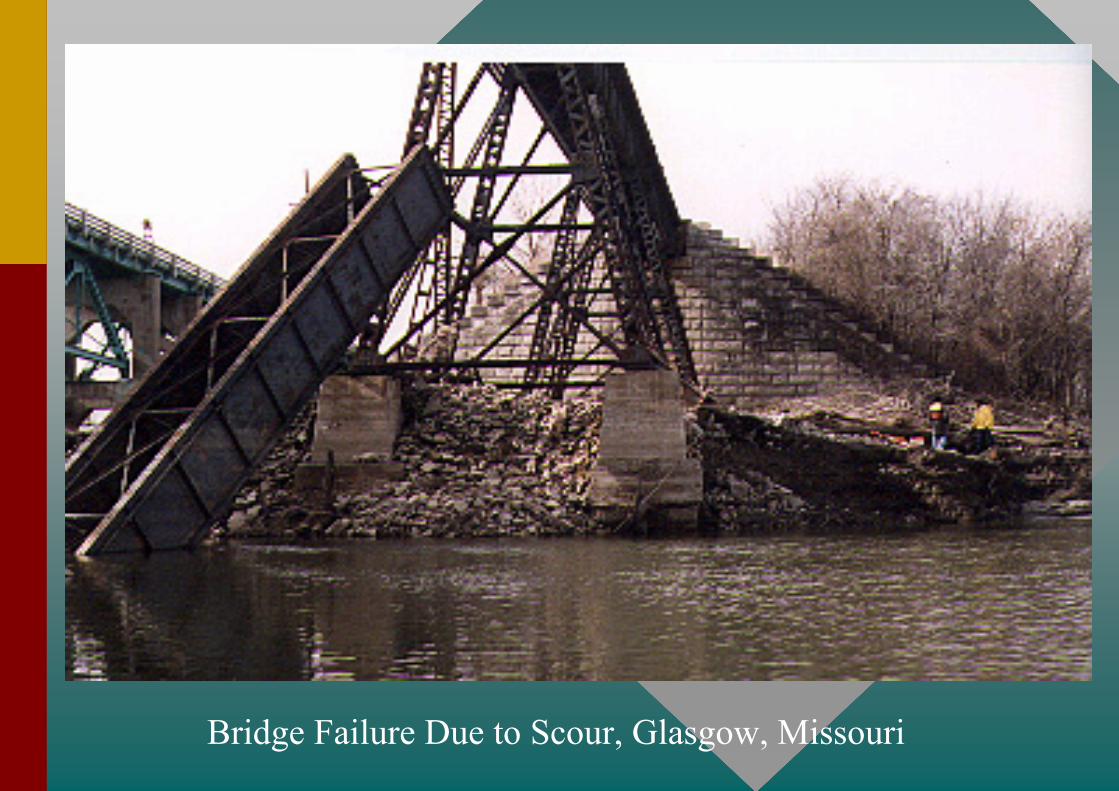
Bridge Failure Due to Scour, Glasgow, Missouri
Components of ScourComponents of Scour
I - Long Term Aggradation or Degradation+
II - Contraction Scour+
III - Local Scour (Piers and Abutments)=
Total Scour

LongLong--Term Term AggradationAggradation or Degradationor Degradation
LongLong--term term aggradationaggradation or degradation is due to or degradation is due to natural or mannatural or man--made induced causes which can made induced causes which can affect the reach of river on which the bridge is affect the reach of river on which the bridge is located. The challenge for the engineer is to estimate located. The challenge for the engineer is to estimate longlong--term bed elevation changes that will occur term bed elevation changes that will occur during the life of the structure. during the life of the structure.
I I -- Long Term Long Term AggradationAggradation or Degradationor DegradationII - Contraction ScourIII - Local Scour at Piers and Abutments

Contraction ScourContraction ScourInvolves removal of material from bed and banks across most of the channel width.
May be “LiveLive--bedbed Contraction Scour” or “ClearClear--waterwater Contraction Scour”
I - Long Term Aggradation or DegradationII II -- Contraction ScourContraction ScourIII - Local Scour at Piers and Abutments

Local ScourLocal ScourAt PiersAt Piers:: Pier scour occurs due to the acceleration of Pier scour occurs due to the acceleration of flow around the pier and the formation of flow vortices. flow around the pier and the formation of flow vortices. The The ““horseshoe vorticeshorseshoe vortices”” remove material from the base remove material from the base of the pier and creates a scour hole. of the pier and creates a scour hole.
I - Long Term Aggradation or DegradationII - Contraction ScourIII III -- Local Scour at Piers and AbutmentsLocal Scour at Piers and Abutments

I - Long Term Aggradation or DegradationII - Contraction ScourIII III -- Local Scour at PiersLocal Scour at Piers
Scour at a cylindrical pier

Local ScourLocal ScourAt AbutmentsAt Abutments::The obstruction of the flow forms a The obstruction of the flow forms a horizontal vortex starting at the upstream end of the horizontal vortex starting at the upstream end of the abutment and running along the toe of the abutment abutment and running along the toe of the abutment and forms a vertical wake vortex at the downstream and forms a vertical wake vortex at the downstream end of the abutmentend of the abutment
I - Long Term Aggradation or DegradationII - Contraction ScourIII III -- Local Scour at Piers and AbutmentsLocal Scour at Piers and Abutments

I - Long Term Aggradation or DegradationII - Contraction ScourIII III -- Local Scour at AbutmentsLocal Scour at Abutments
Abutment scour

Contraction scour (somewhere) in Missouri during May and June of 1995.
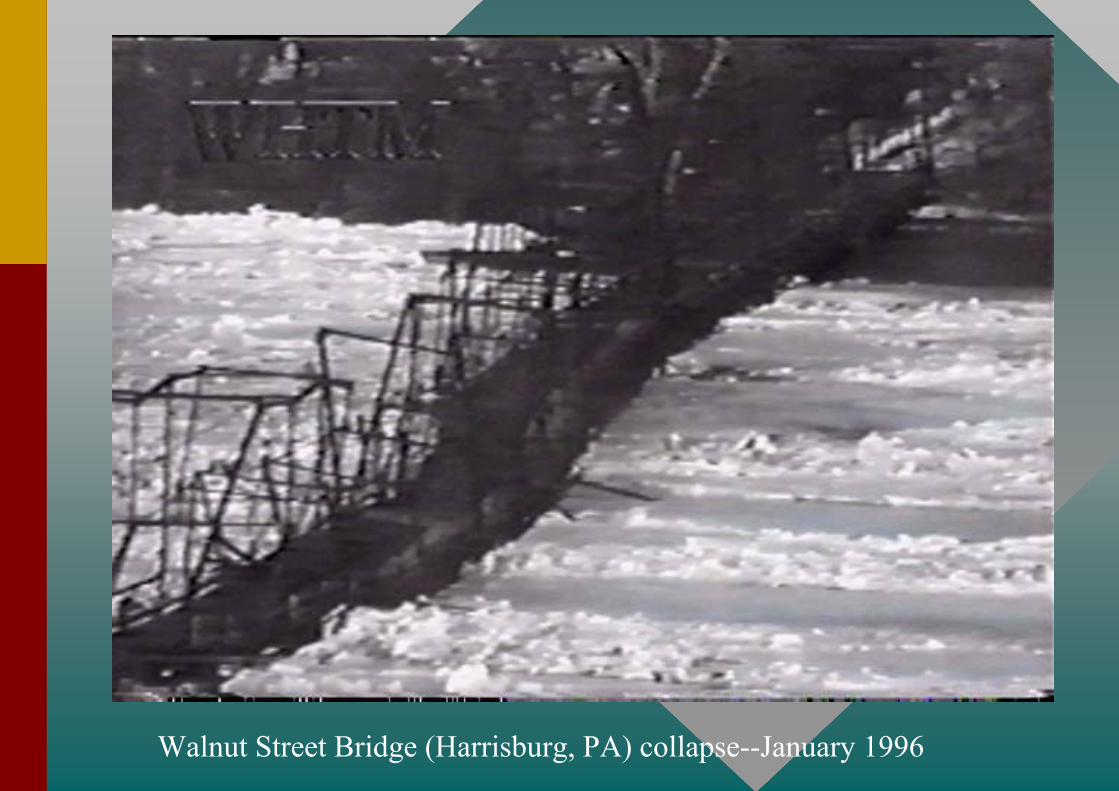
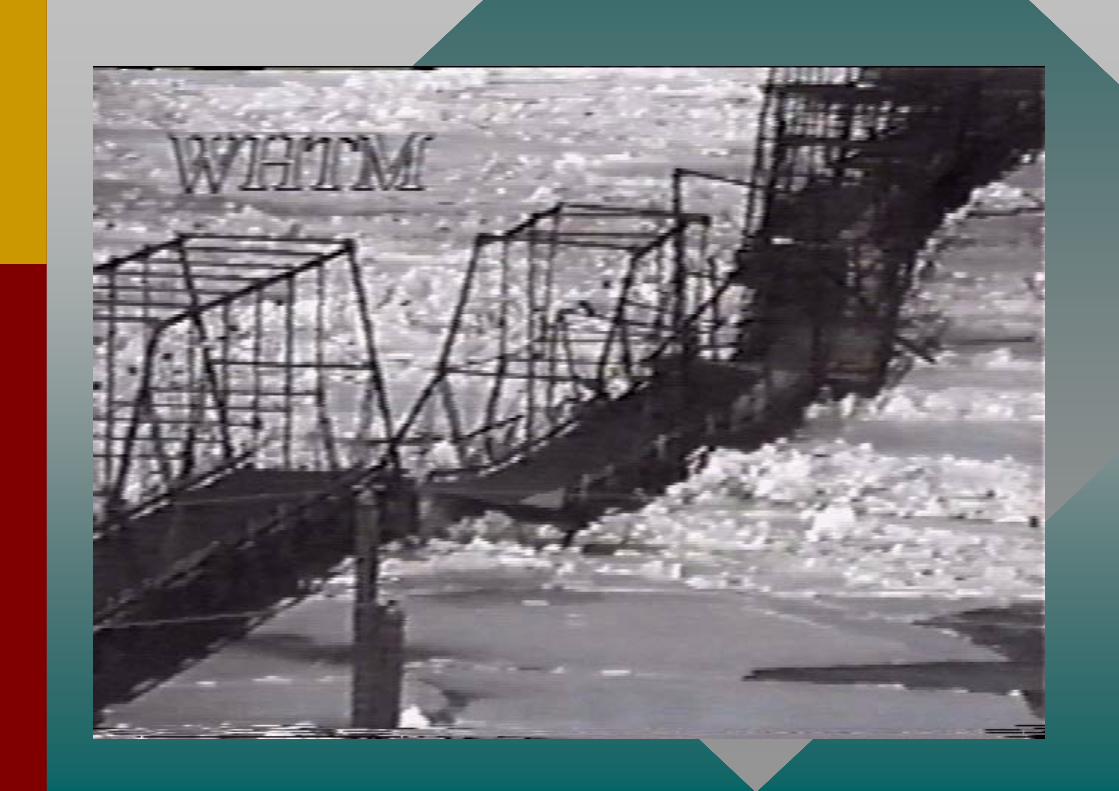
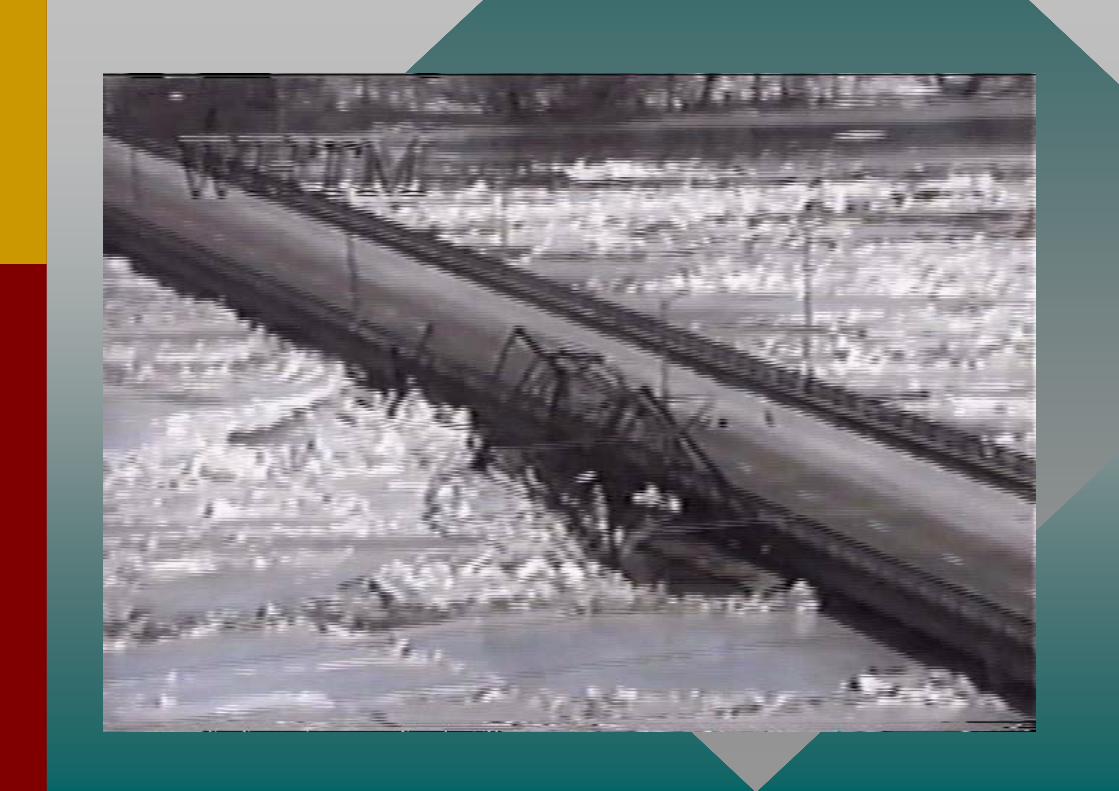
Walnut Street Bridge (Harrisburg, PA) collapse--January 1996

This bridge (location unknown) failed due to scour at the base of the piers caused by a turbulent horseshoe vortex system.
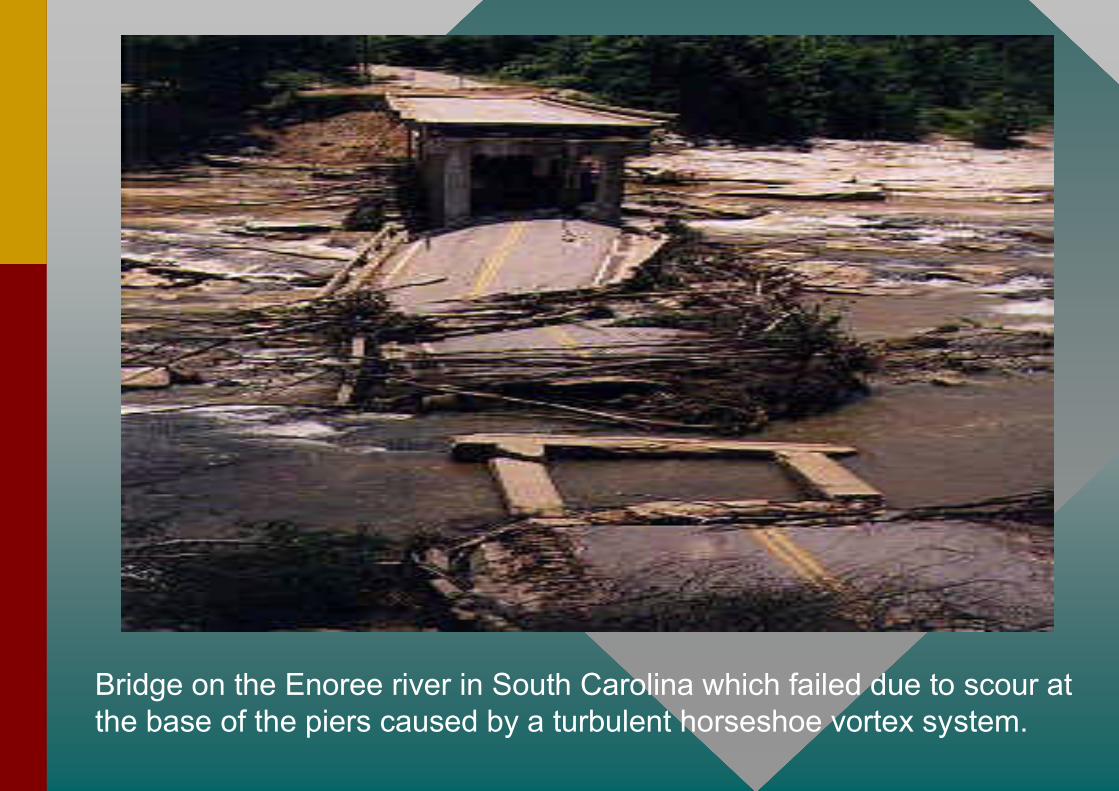
Bridge on the Enoree river in South Carolina which failed due to scour at the base of the piers caused by a turbulent horseshoe vortex system.

March 10, 1995 - Interstate 5 near Coalinga, over the Arroyo Pasajero

LongLong--Term Term AggradationAggradation or Degradationor Degradation
Procedures for estimating longProcedures for estimating long--term term aggradationaggradation and and degradation at bridges are presented in HEC20 degradation at bridges are presented in HEC20 (Stream Stability at Highway Structures) and are not (Stream Stability at Highway Structures) and are not a part of this presentationa part of this presentation
I I -- Long Term Long Term AggradationAggradation or Degradationor DegradationII - Contraction ScourIII - Local Scour at Piers and Abutments

Contraction Scour CasesContraction Scour Cases• Case I - Overbank flow on a floodplain being forced back to
the main channel by the approaches to the bridge
• Case II - Flow is confined to the main channel (no overbankflow). The normal river channel width becomes narrower due to the bridge itself or the bridge site is located at a narrowing reach of river
• Case III - A relief bridge in the overbank area with little or no bed material transport in the overbank area (clear water scour)
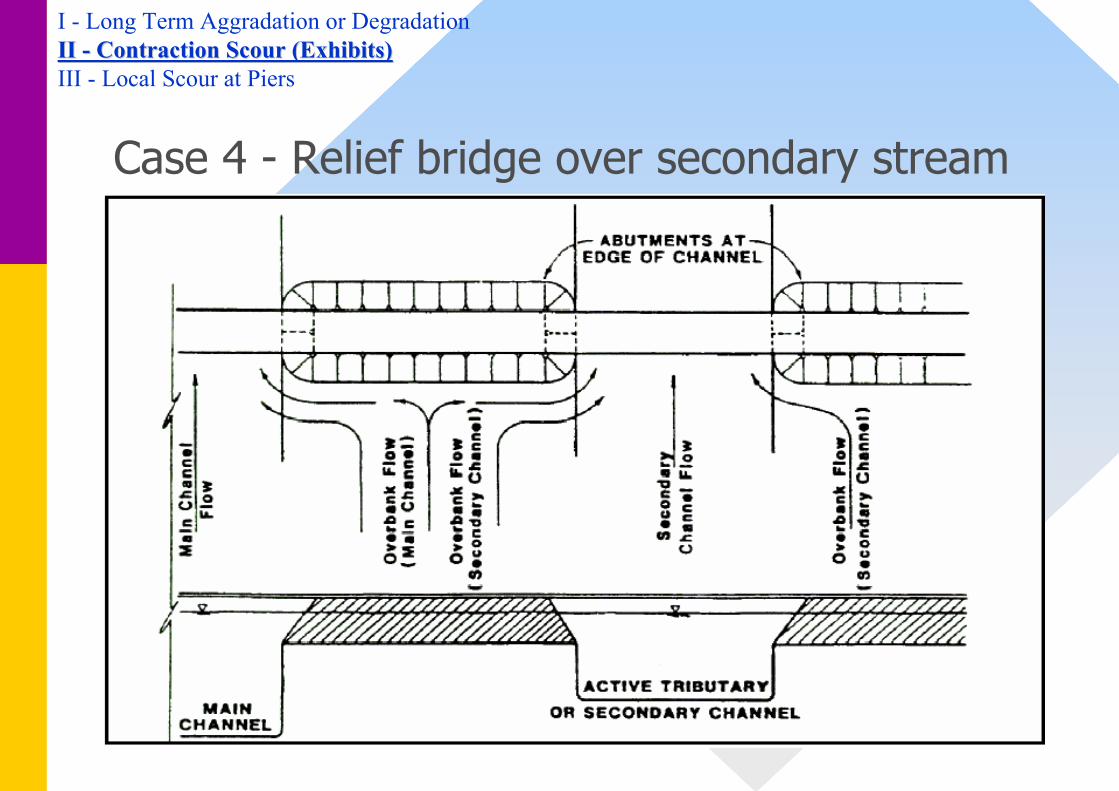
• Case IV - A relief bridge over a secondary stream in the overbank area with bed material transport (similar to case 1)
I - Long Term Aggradation or DegradationII II -- Contraction Scour (Cases)Contraction Scour (Cases)III - Local Scour at Piers and Abutments
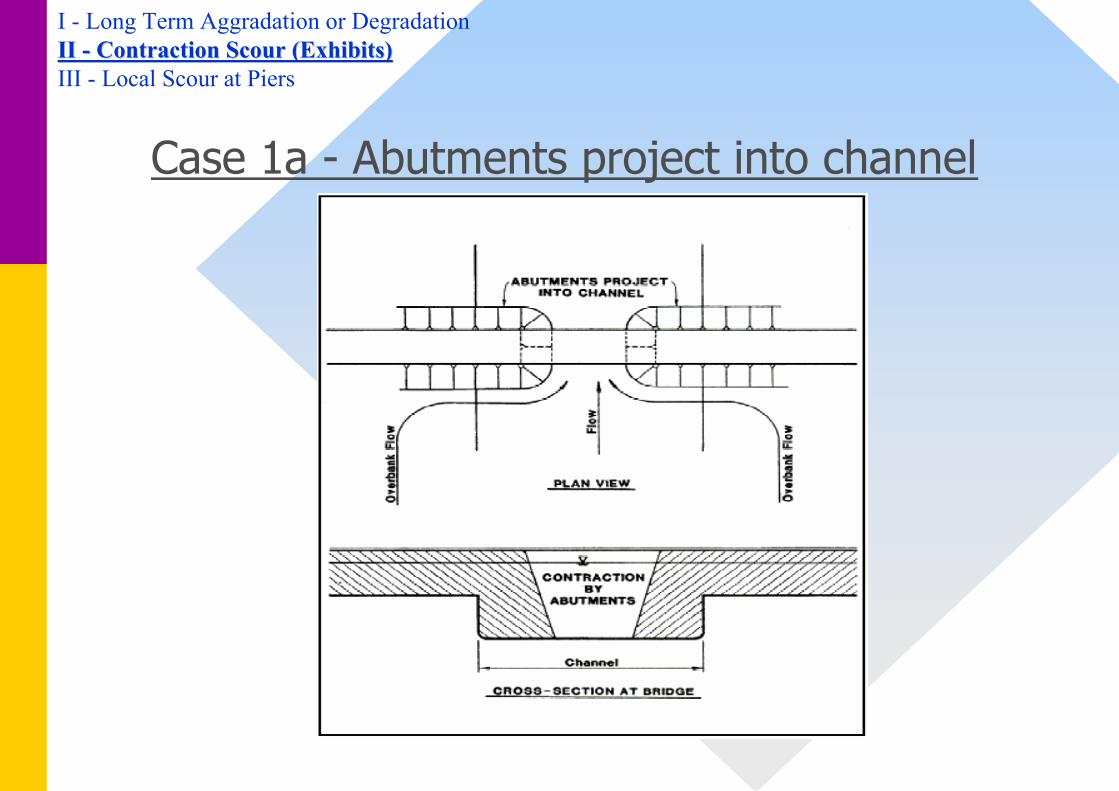
I - Long Term Aggradation or DegradationII II -- Contraction Scour (Exhibits)Contraction Scour (Exhibits)III - Local Scour at Piers
Case 1a - Abutments project into channel
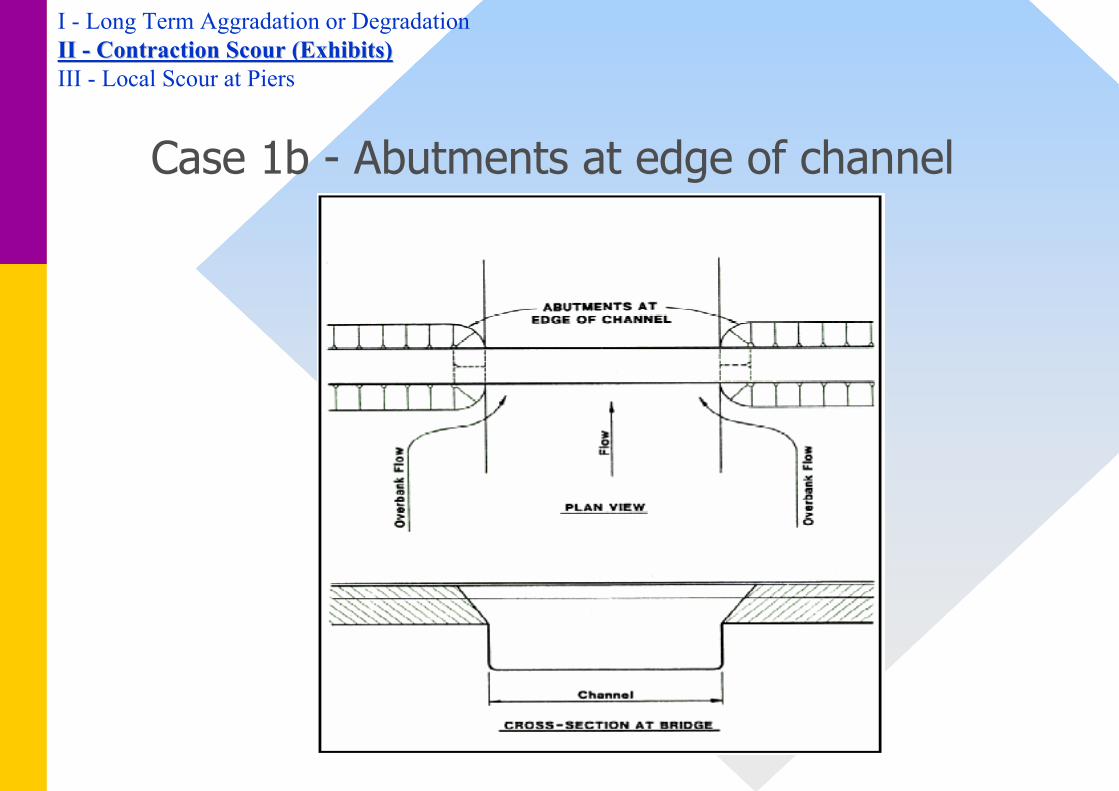
I - Long Term Aggradation or DegradationII II -- Contraction Scour (Exhibits)Contraction Scour (Exhibits)III - Local Scour at Piers
Case 1b - Abutments at edge of channel

I - Long Term Aggradation or DegradationII II -- Contraction Scour (Exhibits)Contraction Scour (Exhibits)III - Local Scour at Piers
Case 1c - Abutments set back from channel
I - Long Term Aggradation or DegradationII II -- Contraction Scour (Exhibits)Contraction Scour (Exhibits)III - Local Scour at Piers
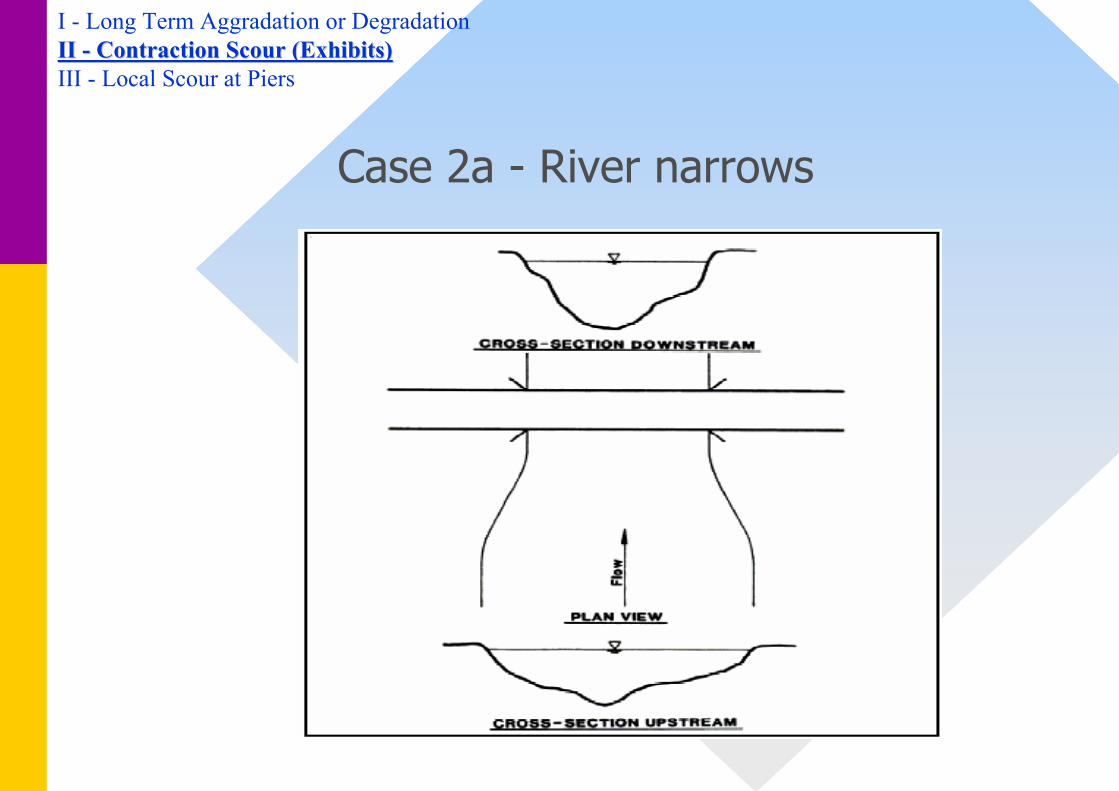
Case 2a - River narrows

I - Long Term Aggradation or DegradationII II -- Contraction Scour (Exhibits)Contraction Scour (Exhibits)III - Local Scour at Piers
Case 2b - Bridge abutments and or piers constrict flow

I - Long Term Aggradation or DegradationII II -- Contraction Scour (Exhibits)Contraction Scour (Exhibits)III - Local Scour at Piers
Case 3 - Relief bridge over floodplain
I - Long Term Aggradation or DegradationII II -- Contraction Scour (Exhibits)Contraction Scour (Exhibits)III - Local Scour at Piers
Case 4 - Relief bridge over secondary stream

LiveLive--bed Contraction Scour:bed Contraction Scour:This occurs when bed material is already being transported into the contracted bridge section from upstream of the approach section (before the Contraction reach).
Contraction Scour TypesContraction Scour Types
I - Long Term Aggradation or DegradationII II -- Contraction Scour (Types)Contraction Scour (Types)III - Local Scour at Piers and Abutments

ClearClear--water Contraction Scour:water Contraction Scour: This occurs when the bed material sediment transport in the uncontractedapproach section is negligible or less than the carrying capacity of the flow.
Contraction Scour TypesContraction Scour Types
I - Long Term Aggradation or DegradationII II -- Contraction Scour (Types)Contraction Scour (Types)III - Local Scour at Piers and Abutments

Clear-water: Vc > mean velocity
Live-bed: Vc < mean velocity
where Vc = critical velocity for beginning of motion
LiveLive--bed or Clearbed or Clear--water Determinationwater Determination
I - Long Term Aggradation or DegradationII II -- Contraction Scour (Type Determination)Contraction Scour (Type Determination)III - Local Scour at Piers and Abutments

LiveLive--bed or Clearbed or Clear--water Determinationwater Determination
I - Long Term Aggradation or DegradationII II -- Contraction Scour (Determination)Contraction Scour (Determination)III - Local Scour at Piers and Abutments
Clear-water: Vc > mean velocity
Live-bed: Vc < mean velocity
1/350D1/6
110.95ycV = (Laursen, 1963)
Where: Y1 =depth of flow in the upstream of bridgeD50 = median diameter of bed material

LiveLive--bed Contraction Scour Determinationbed Contraction Scour Determination
And
Where: Ys = Average depth of scourY0 = Average depth of flow in the contracted section before scourY1 = depth of flow in the upstream of bridgeY2 = depth of flow in the contracted sectionW1 = bottom width upstream of bridgeW2 = bottom width in the contracted sectionQ1 = flow in the upstream of bridge transporting sedimentQ2 = flow in the contracted sectionn1 = Manning’s “n” for the upstream of bridgen2 = Manning’s “n” for the contracted sectionK1 and K2 = Exponents depending upon the mode of bed material transport
(Laursen, 1960)21
1
2
2
1
7/6
1
2
1
2
k
nn
WW
yy K
=
V*/w K1 K2 Mode of Bed Material Transport<0.50 0.59 0.066 Mostly contact bed material0.50 to 2.0 0.64 0.21 Some suspended bed material discharge> 2.0 0.69 0.37 Mostly suspended bed material discharge
I - Long Term Aggradation or DegradationII II -- Contraction Scour (LiveContraction Scour (Live--bed)bed)III - Local Scour at Piers and Abutments
02 yyys −=

LiveLive--bed Contraction Scour Determinationbed Contraction Scour Determination
I - Long Term Aggradation or DegradationII II -- Contraction Scour (LiveContraction Scour (Live--bed)bed)III - Local Scour at Piers and Abutments
( )21
11
21
* SgyV =
=
ρτ
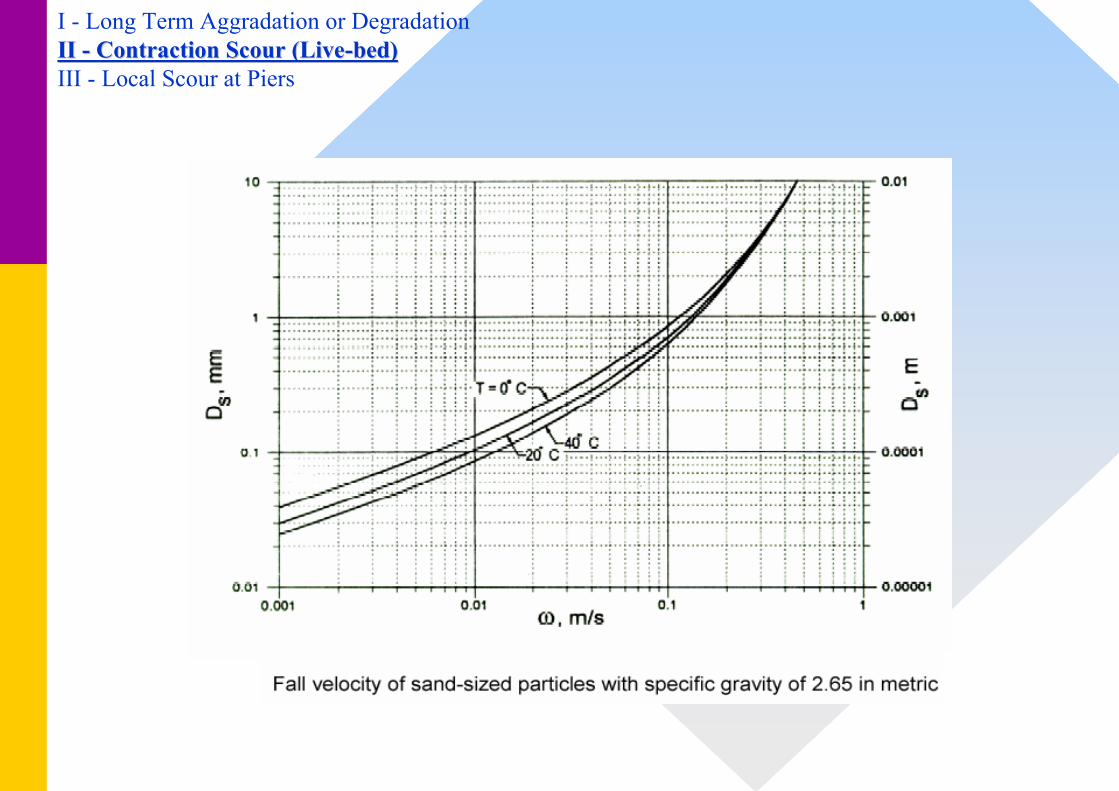
Where: V* = Shear Velocity in the upstream sectionw = Fall velocity of bed materialT = Shear stress on the bedp = Density of waterg = Acceleration of gravityS1 = Slope of the energy grade line of main channel
V*/w K1 K2 Mode of Bed Material Transport<0.50 0.59 0.066 Mostly contact bed material0.50 to 2.0 0.64 0.21 Some suspended bed material discharge> 2.0 0.69 0.37 Mostly suspended bed material discharge
I - Long Term Aggradation or DegradationII II -- Contraction Scour (LiveContraction Scour (Live--bed)bed)III - Local Scour at Piers

LiveLive--bed Contraction Scour Determinationbed Contraction Scour Determination
02 yyys −=And
Where: Ys = Average depth of scourY0 = Average depth of flow in the contracted section before scourY1 = depth of flow in the upstream of bridgeY2 = depth of flow in the contracted sectionW1 = bottom width upstream of bridgeW2 = bottom width in the contracted sectionQ1 = flow in the upstream of bridge transporting sedimentQ2 = flow in the contracted sectionK1 = Exponents depending upon the mode of bed material transport
Modified (Laursen, 1960)
1
2
1
7/6
1
2
1
2K
WW
yy
=
V*/w K1 Mode of Bed Material Transport <0.50 0.59 Mostly contact bed material0.50 to 2.0 0.64 Some suspended bed material discharge > 2.0 0.69 Mostly suspended bed material discharge
I - Long Term Aggradation or DegradationII II -- Contraction Scour (LiveContraction Scour (Live--bed)bed)III - Local Scour at Piers and Abutments

LiveLive--bed Contraction Scour Determinationbed Contraction Scour Determination
V*/w K1 Mode of Bed Material Transport <0.50 0.59 Mostly contact bed material0.50 to 2.0 0.64 Some suspended bed material discharge > 2.0 0.69 Mostly suspended bed material discharge
I - Long Term Aggradation or DegradationII II -- Contraction Scour (LiveContraction Scour (Live--bed)bed)III - Local Scour at Piers and Abutments
( )21
11
21
* SgyV =
=
ρτ
Where: V* = Shear Velocity in the upstream sectionw = Fall velocity of bed materialT = Shear stress on the bedp = Density of waterg = Acceleration of gravityS1 = Slope of the energy grade line of main channel
(Laursen, 1963)
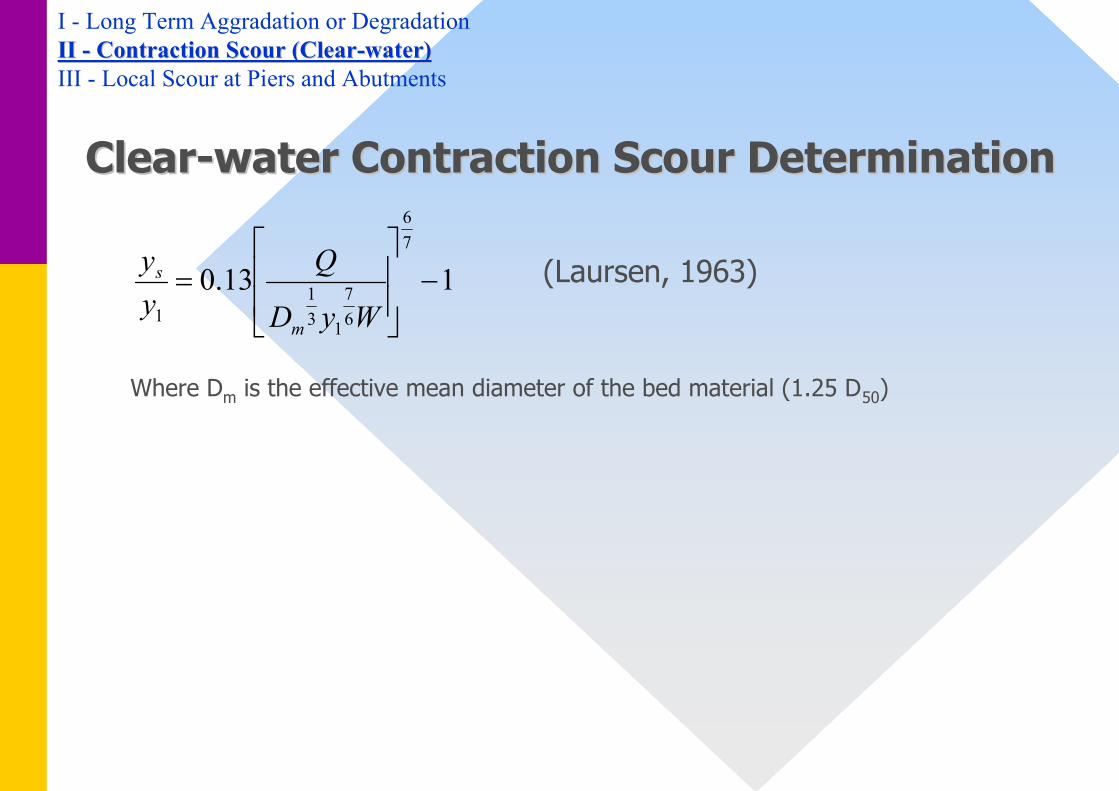
ClearClear--water Contraction Scour Determinationwater Contraction Scour Determination
I - Long Term Aggradation or DegradationII II -- Contraction Scour (ClearContraction Scour (Clear--water)water)III - Local Scour at Piers and Abutments
113.076
67
131
1
−
=
WyD
Qyy
m
s
Where Dm is the effective mean diameter of the bed material (1.25 D50)

Local ScourLocal Scourat Piersat Piers
Pier scour occurs due to the acceleration of flow around the Pier scour occurs due to the acceleration of flow around the pier and the formation of flow vortices. The pier and the formation of flow vortices. The ““horseshoe horseshoe vortices) remove material from the base of the pier and creates vortices) remove material from the base of the pier and creates a scour hole. a scour hole.
I - Long Term Aggradation or DegradationII - Contraction ScourIII III -- Local Scour (at Piers)Local Scour (at Piers)
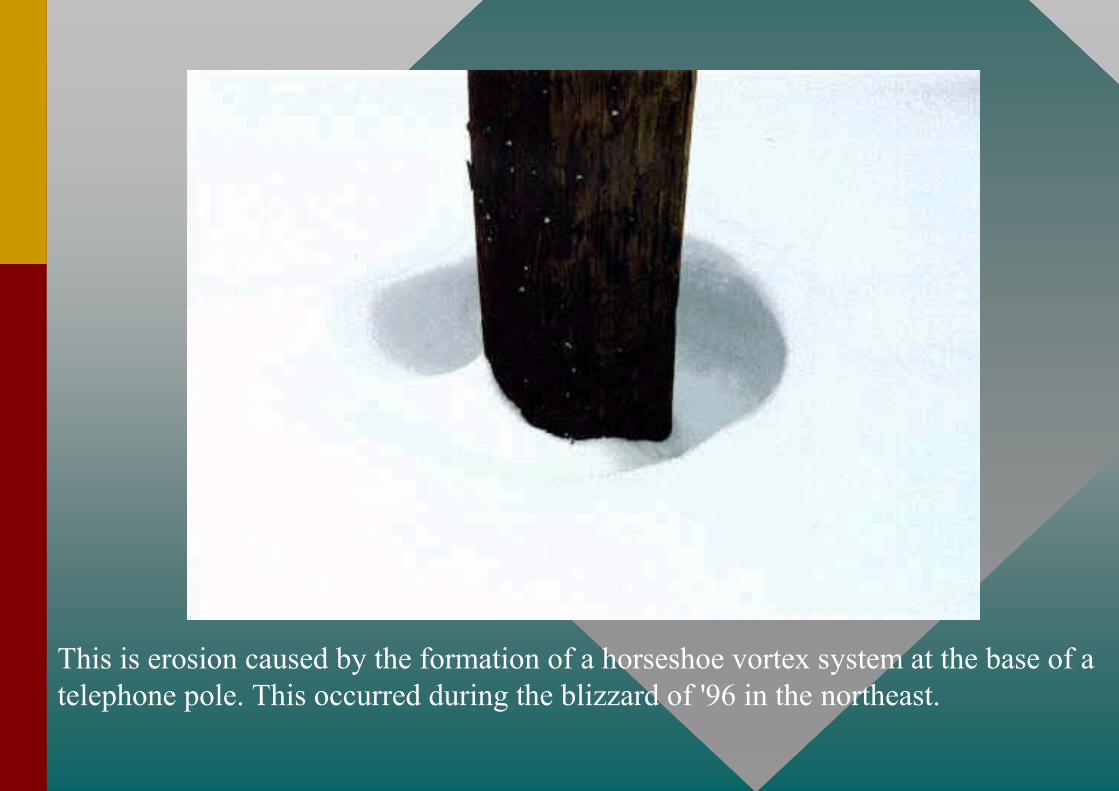
This is erosion caused by the formation of a horseshoe vortex system at the base of a telephone pole. This occurred during the blizzard of '96 in the northeast.
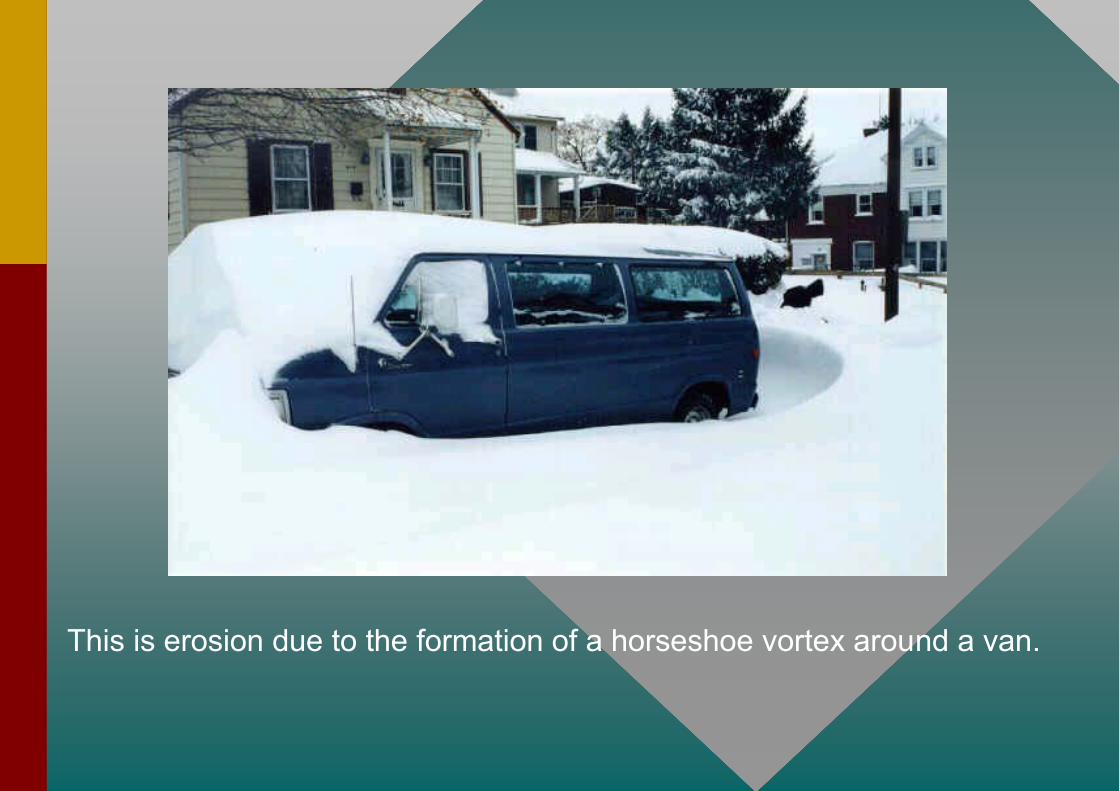
This is erosion due to the formation of a horseshoe vortex around a van.

Pier Scour FactorsPier Scour Factors• The greater the velocity upstream of the pier the deeper the scour
• An increase in flow depth can have a significant influence on the scour depth. It can be as much as twice.
• As the width of the pier increases, so does the scour depth
• If pier is skewed to the flow, the length can have an influence on the scour depth. When doubling the length, the scour depth increased by 30-60% depending upon angle of attack.
• Size and gradation of the bed material generally will not have an effect on the scour depth. What differs is the time it takes to achieve the maximum scour.
• Shape of the pier plays an important part in the scour depth.
• Formation of debris can increase the width of the pier, change its shape or change its projected length.
I - Long Term Aggradation or DegradationII - Contraction ScourIII III -- Local Scour (at Piers)Local Scour (at Piers)
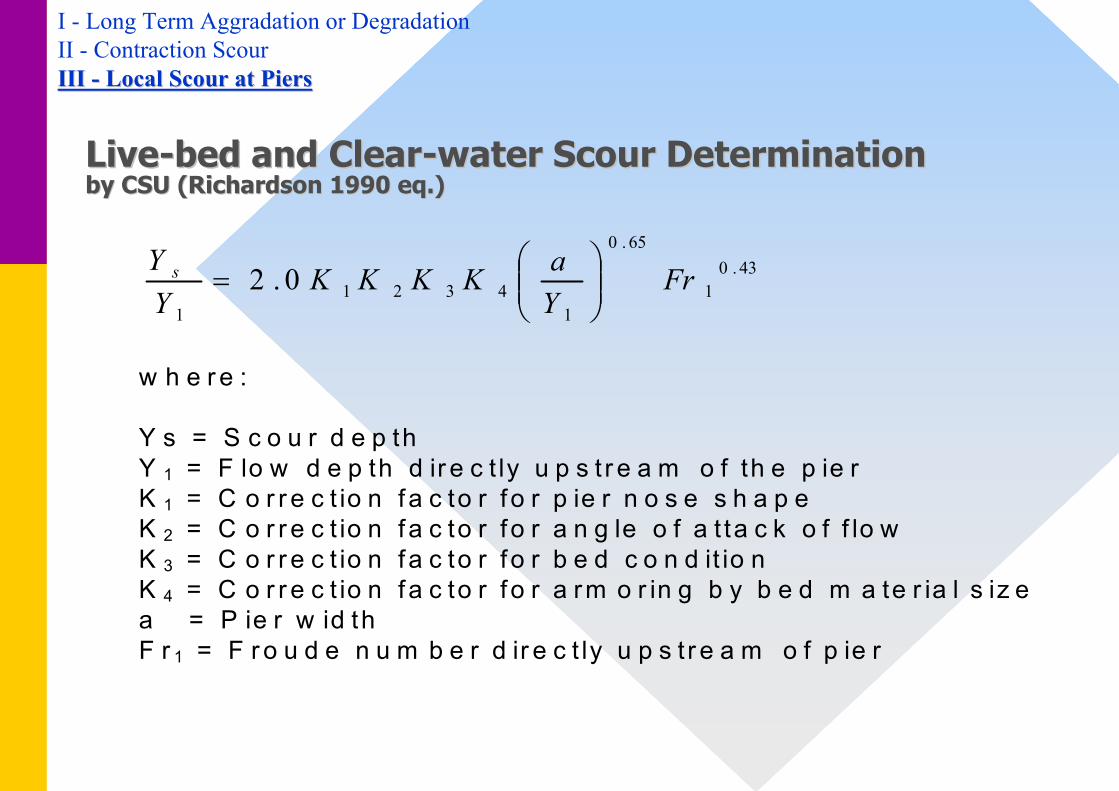
LiveLive--bed and Clearbed and Clear--water Scour Determinationwater Scour Determinationby CSU (Richardson 1990 by CSU (Richardson 1990 eqeq.).)
I - Long Term Aggradation or DegradationII - Contraction ScourIII III -- Local Scour at PiersLocal Scour at Piers
43.01
65.0
14321
1
0.2 FrYaKKKK
YY s
=
w h e r e :
Y s = S c o u r d e p thY 1 = F lo w d e p th d ir e c t ly u p s t r e a m o f th e p ie rK 1 = C o r r e c t io n f a c to r f o r p ie r n o s e s h a p eK 2 = C o r r e c t io n f a c to r f o r a n g le o f a t ta c k o f f lo wK 3 = C o r r e c t io n f a c to r f o r b e d c o n d it io nK 4 = C o r r e c t io n f a c to r f o r a rm o r in g b y b e d m a te r ia l s iz ea = P ie r w id thF r 1 = F r o u d e n u m b e r d ir e c t ly u p s t r e a m o f p ie r

I - Long Term Aggradation or DegradationII - Contraction ScourIII III -- Local Scour at PiersLocal Scour at Piers
Common Pier Shapes
To be used for determining the K1 (Pier Nose Shape correction factor) in equation:
43.01
65.0
14321
1
0.2 FrYaKKKK
YYs
=

I - Long Term Aggradation or DegradationII - Contraction ScourIII III -- Local Scour at PiersLocal Scour at Piers
For angle of attack < 5 deg. For greater angles, K1=1.0 and K2 dominates
43.01
65.0
14321
1
0.2 FrYaKKKK
YYs
=K1 is the Pier Nose Shape correction factor in equation:
I - Long Term Aggradation or DegradationII - Contraction ScourIII III -- Local Scour at PiersLocal Scour at Piers
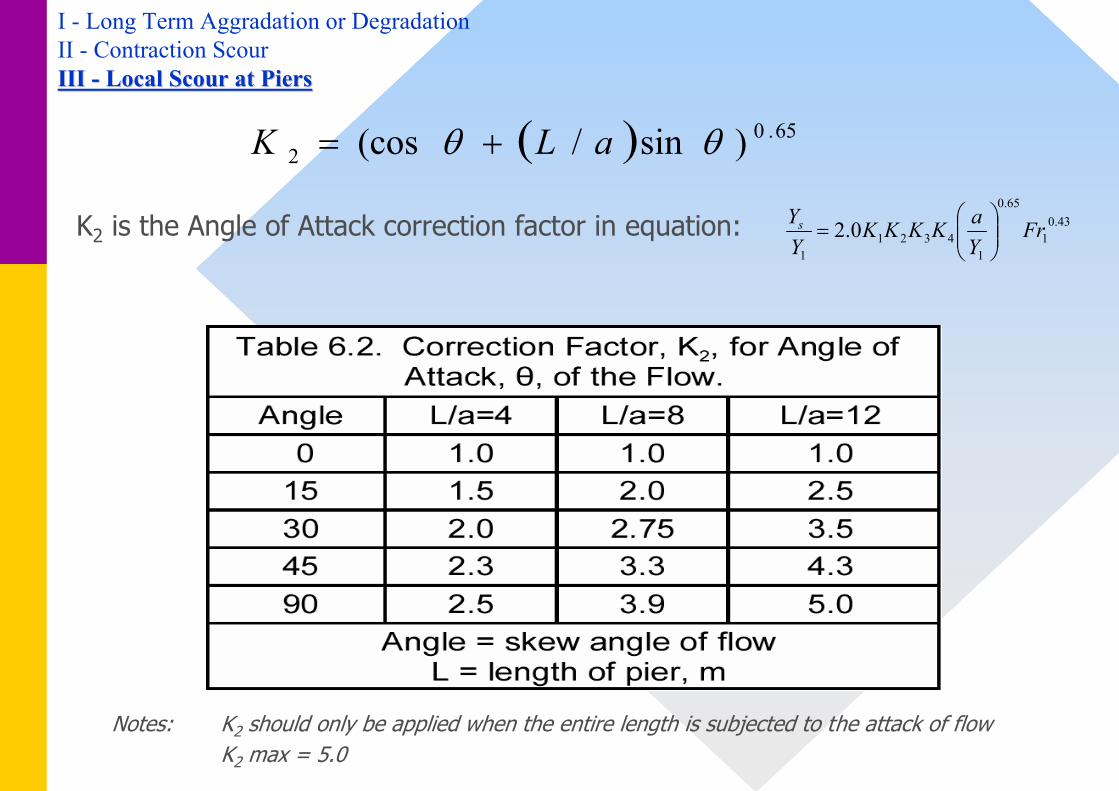
( ) 65.02 )sin/(cos θθ aLK +=
Notes: K2 should only be applied when the entire length is subjected to the attack of flowK2 max = 5.0
K2 is the Angle of Attack correction factor in equation: 43.01
65.0
14321
1
0.2 FrYaKKKK
YYs
=
I - Long Term Aggradation or DegradationII - Contraction ScourIII III -- Local Scour at PiersLocal Scour at Piers
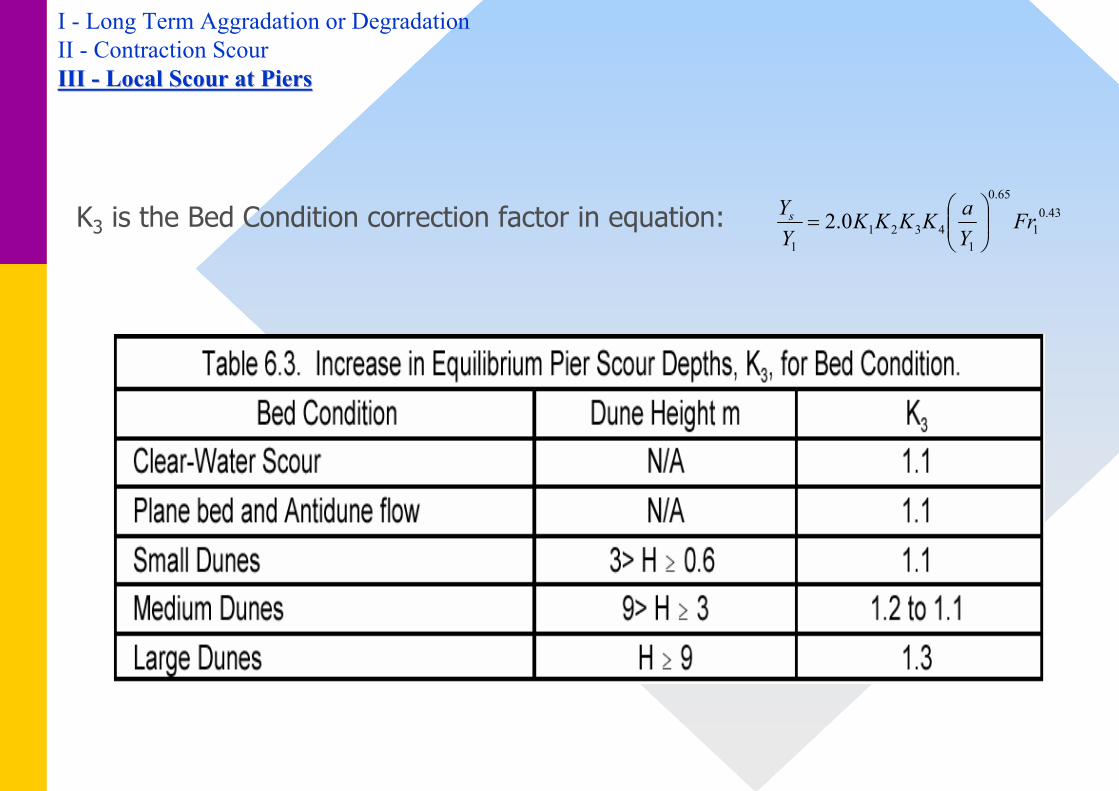
K3 is the Bed Condition correction factor in equation: 43.01
65.0
14321
1
0.2 FrYaKKKK
YYs
=
I - Long Term Aggradation or DegradationII - Contraction ScourIII III -- Local Scour at PiersLocal Scour at Piers
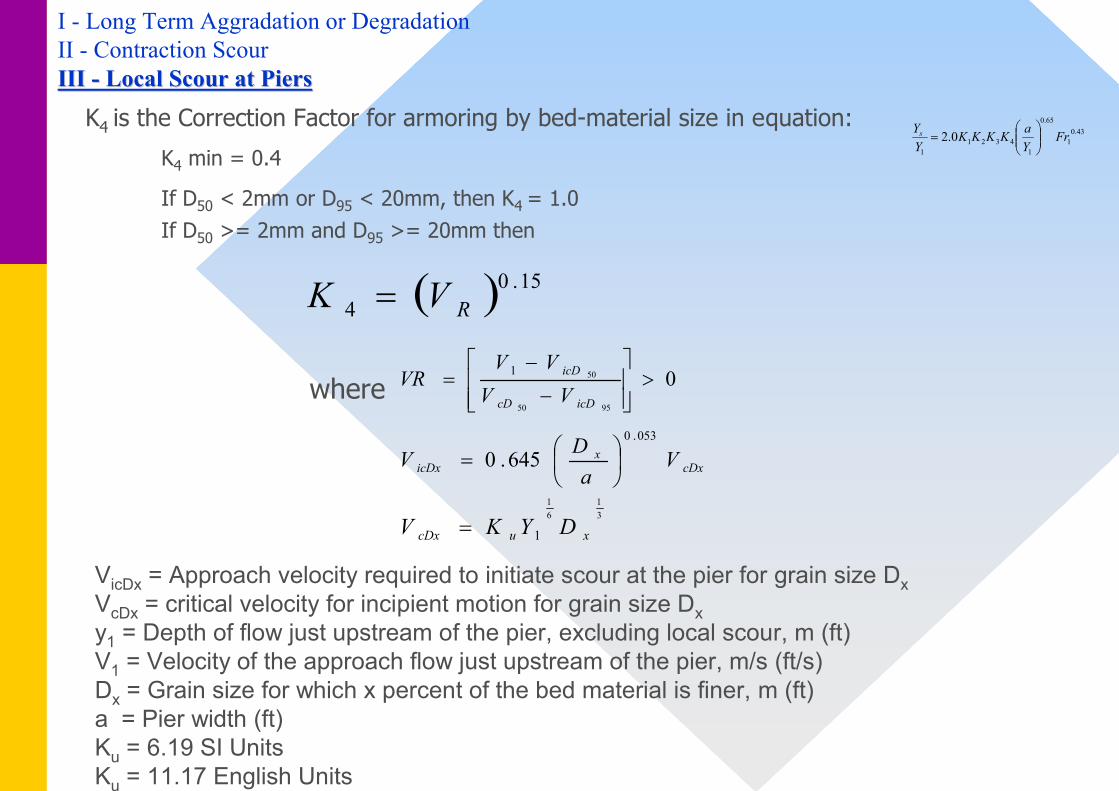
VicDx = Approach velocity required to initiate scour at the pier for grain size DxVcDx = critical velocity for incipient motion for grain size Dxy1 = Depth of flow just upstream of the pier, excluding local scour, m (ft)V1 = Velocity of the approach flow just upstream of the pier, m/s (ft/s)Dx = Grain size for which x percent of the bed material is finer, m (ft)a = Pier width (ft)Ku = 6.19 SI UnitsKu = 11.17 English Units
K4 is the Correction Factor for armoring by bed-material size in equation:
K4 min = 0.4
If D50 < 2mm or D95 < 20mm, then K4 = 1.0If D50 >= 2mm and D95 >= 20mm then
( ) 15.04 RVK =
09550
501 >
−
−=
icDcD
icD
VVVV
VRwhere
cDxx
icDx VaDV
053.0
645.0
=
31
61
1 xucDx DYKV =
43.01
65.0
14321
1
0.2 FrYaKKKK
YYs
=
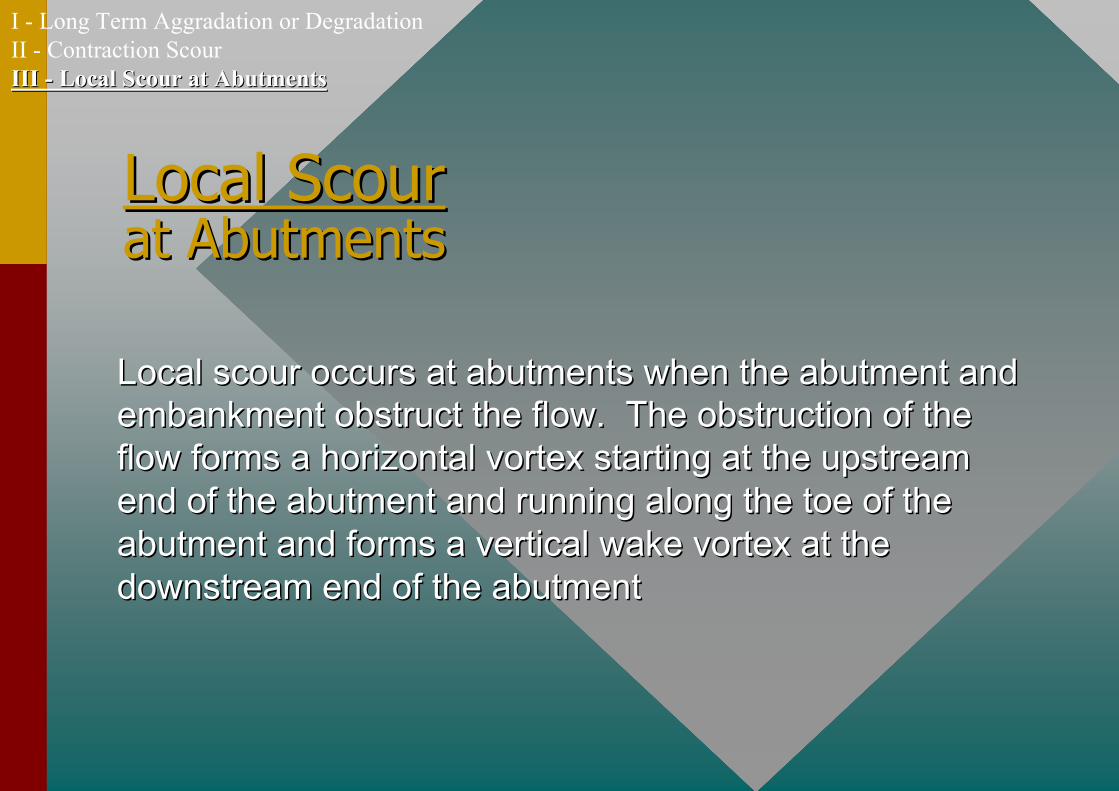
Local ScourLocal Scourat Abutmentsat Abutments
Local scour occurs at abutments when the abutment and Local scour occurs at abutments when the abutment and embankment obstruct the flow. The obstruction of the embankment obstruct the flow. The obstruction of the flow forms a horizontal vortex starting at the upstream flow forms a horizontal vortex starting at the upstream end of the abutment and running along the toe of the end of the abutment and running along the toe of the abutment and forms a vertical wake vortex at the abutment and forms a vertical wake vortex at the downstream end of the abutmentdownstream end of the abutment
I - Long Term Aggradation or DegradationII - Contraction ScourIII III -- Local Scour at AbutmentsLocal Scour at Abutments
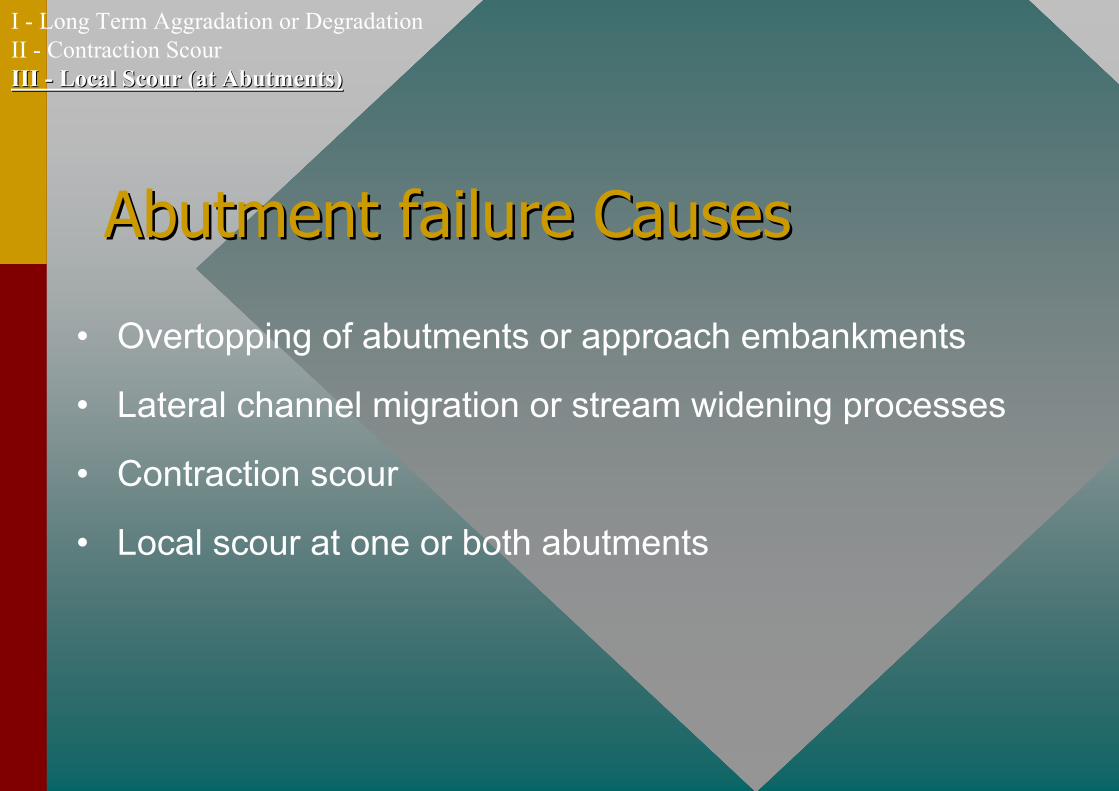
Abutment failure CausesAbutment failure Causes
• Overtopping of abutments or approach embankments
• Lateral channel migration or stream widening processes
• Contraction scour
• Local scour at one or both abutments
I - Long Term Aggradation or DegradationII - Contraction ScourIII III -- Local Scour (at Abutments)Local Scour (at Abutments)
I - Long Term Aggradation or DegradationII - Contraction ScourIII III -- Local Scour at AbutmentsLocal Scour at Abutments
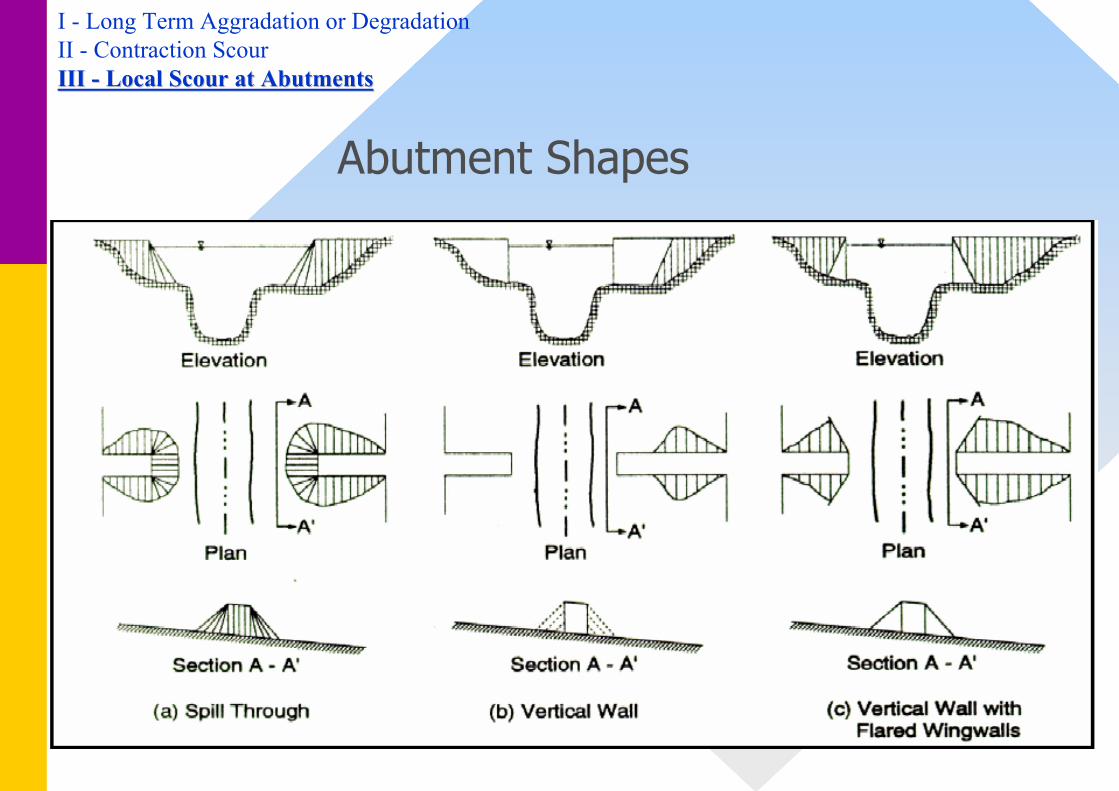
Abutment Shapes
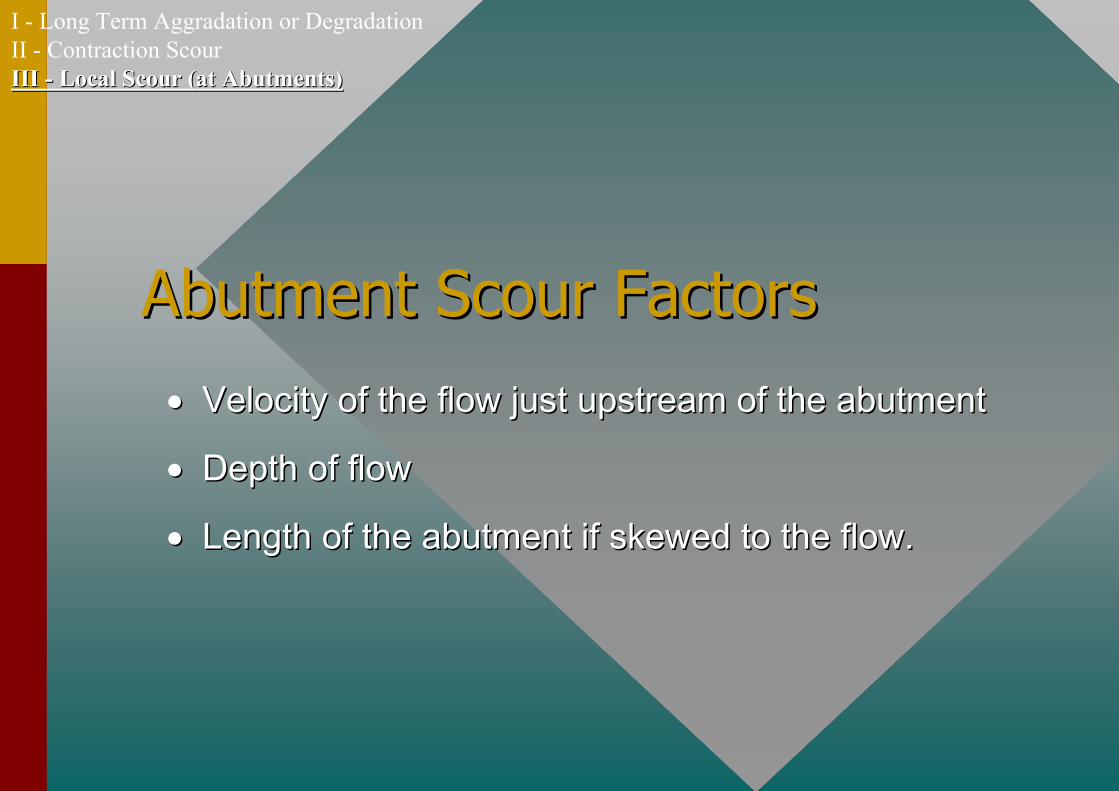
Abutment Scour FactorsAbutment Scour Factors•• Velocity of the flow just upstream of the abutmentVelocity of the flow just upstream of the abutment
•• Depth of flowDepth of flow
•• Length of the abutment if skewed to the flow. Length of the abutment if skewed to the flow.
I - Long Term Aggradation or DegradationII - Contraction ScourIII III -- Local Scour (at Abutments)Local Scour (at Abutments)

I - Long Term Aggradation or DegradationII - Contraction Scour (Clear-water)III III -- Local Scour at AbutmentsLocal Scour at Abutments
LiveLive--bed and Clearbed and Clear--waterwaterScour DeterminationScour Determination
I I -- FroelichFroelich’’ss LiveLive--bed Abutment Scour Equationbed Abutment Scour Equation(when the ratio of the length of the abutment (normal to flow) t(when the ratio of the length of the abutment (normal to flow) to flow depth <= 25)o flow depth <= 25)
II II -- Hire LiveHire Live--bed Abutment Scour Equationbed Abutment Scour Equation(when the ratio of the length of the abutment (normal to flow) t(when the ratio of the length of the abutment (normal to flow) to flow depth > 25)o flow depth > 25)

I - Long Term Aggradation or DegradationII - Contraction Scour (Clear-water)III III -- Local Scour at AbutmentsLocal Scour at Abutments
I I -- FroelichFroelich’’s (1989) s (1989) LiveLive--bed Abutment Scour Equationbed Abutment Scour Equation
1)'(27.2 61.01
57.043.021 += FryLKK
YY
aa
s
WhereK1 = Coefficient for abutment shapeK2 = Coefficient for angle of embankment to flowK2 = ( ) 13.090/θ
90<θ if embankment points downstream90>θ if embankment points upstream
L’ = Length of active flow obstructed by the embankmentAe = Flow area of the approach cross section obstructed by the embankmentFr = Froude Number of approach flow upstream of the abutment
= Ve/(gya) 1/2
Ve = Qe / AeQe = Flow obstructed by the abutment and approach embankmentYa = Average depth of flow on the floodplain (Ae /L)L = Length of embankment projected normal to the flowYs = Scour depth
(ratio of the length of the abutment (normal to flow) to flow depth <= 25)

I - Long Term Aggradation or DegradationII - Contraction Scour (Clear-water)III III -- Local Scour at Abutments Local Scour at Abutments -- FroelichFroelich
Abutment CoefficientsAbutment Coefficients
K2 = Coefficient for angle of embankment to flowK2 = ( ) 13.090/θ
90<θ if embankment points downstream90>θ if embankment points upstream
K1
K2

I - Long Term Aggradation or DegradationII - Contraction ScourIII III -- Local Scour at Abutments Local Scour at Abutments -- FroelichFroelich
Abutment Skew
For abutments angles upstream, the depth of scour increases

I - Long Term Aggradation or DegradationII - Contraction Scour (Clear-water)III III -- Local Scour at Abutments Local Scour at Abutments -- HIREHIRE
II II -- HIRE (Richardson 1990) HIRE (Richardson 1990) LiveLive--bed Abutment Scour bed Abutment Scour EquationEquation
33.102
1
1 55.04 FrKK
YYs
=
K1 = Coefficient for abutment shapeK2 = Coefficient for angle of embankment to flow as calculated for Froelich’s equationFr = Froude Number based upon the velocity and depth adjacent to and upstream of the
abutmentY1 = Depth of flow at the abutment on the overbank or in the main channel.Ys = Scour depth
(Recommended when the ratio of the length of the abutment (normal to flow) to flow depth > 25)

Suggested design approachSuggested design approach
•• No reliable equations are available to predict all hydraulic No reliable equations are available to predict all hydraulic flow conditions that may be reasonably expected to occur. flow conditions that may be reasonably expected to occur. Engineering judgement is required.Engineering judgement is required.
•• Place piers & abutment on scour resistant foundation such Place piers & abutment on scour resistant foundation such as rock or deep foundation.as rock or deep foundation.
•• Pilings should be driven below the elevation of longPilings should be driven below the elevation of long--term term degradation and contraction scour.degradation and contraction scour.
•• Need to consider the potential for lateral channel Need to consider the potential for lateral channel instability.instability.
•• Spread footings should be placed below the elevation of Spread footings should be placed below the elevation of total scour.total scour.
I - Long Term Aggradation or DegradationII - Contraction ScourIII III -- Local Scour (at Abutments)Local Scour (at Abutments)

General Design ProcedureGeneral Design Procedure
1. Select flood event
2. Develop water surface profiles
3. Estimate total scour
4. Plot total scour depth
5. Evaluate answers to above
6. Evaluate the bridge type, size and location
7. Perform bridge foundation analysis
8. Repeat the above procedure and calculate the scour for asuper flood (500-year recommended). If hydrology for thisflood is unavailable, use 1.7xQ100.

HECRAS EXAMPLEHECRAS EXAMPLE

HECRAS EXAMPLEHECRAS EXAMPLE

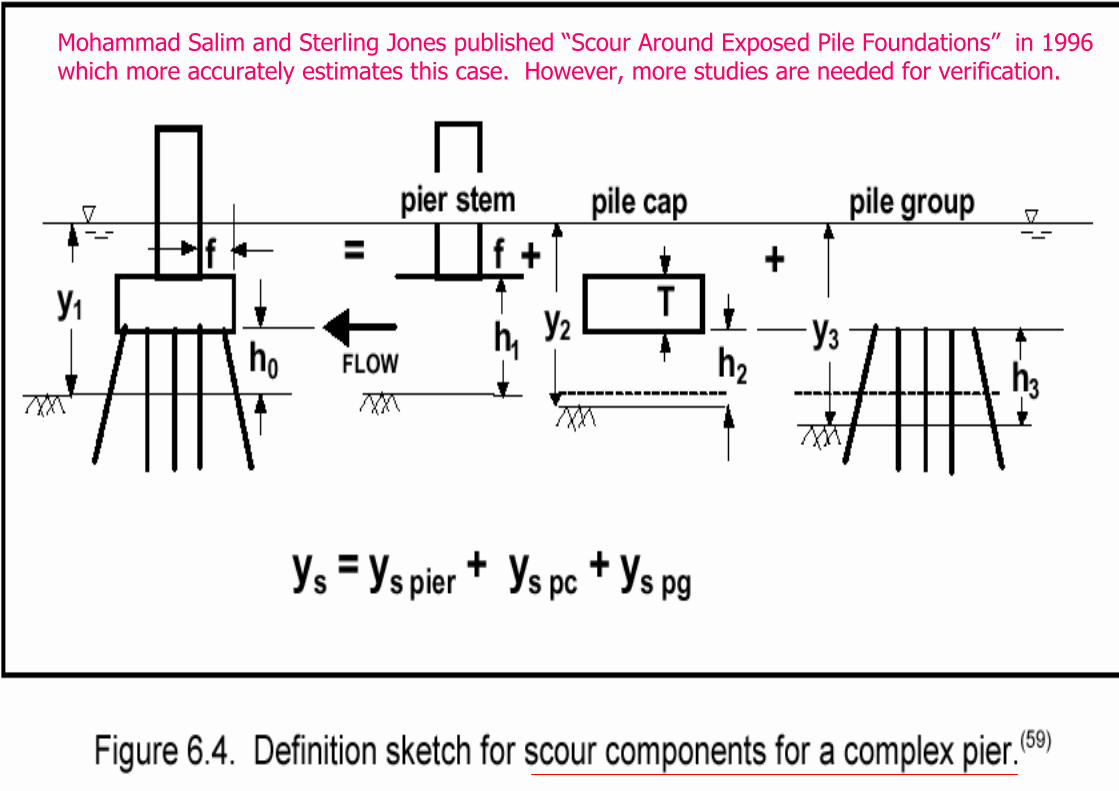
Mohammad Salim and Sterling Jones published “Scour Around Exposed Pile Foundations” in 1996 which more accurately estimates this case. However, more studies are needed for verification.

Pressure Flow ScourWS is > than the LC and plunges flow downward.


![1, 1,2 and Enrico Tubaldi · Association (CIRIA) manual on scour at bridges and other hydraulic structures [23], which are briefly reported below. Natural scour: Natural scour occurs](https://static.fdocuments.in/doc/165x107/61374d4c0ad5d2067648886a/1-12-and-enrico-tubaldi-association-ciria-manual-on-scour-at-bridges-and-other.jpg)