Using A Virtual BAF in EW Testing
20
Approved for Public Release: PA# AFFTC-PA-10013 Using A Virtual BAF in EW Testing William C. Chen 772 nd Test Squadron, 412 Electronic Warfare Group, Edwards AFB, CA 93524-8210 Chad Kuffenkam 772 nd Test Squadron, 412 Electronic Warfare Group, Edwards AFB, CA 93524-8210 Benjamin Hua* 772 nd Test Squadron, 412 Electronic Warfare Group, Edwards AFB, CA 93524-8210 James D. Brownlow 772 nd Test Squadron, 412 Electronic Warfare Group, Edwards AFB, CA 93524-8210 *Previous worked with 772TS/EWOI, Edwards AFB U.S. Air Force T&E Days 2010 2 - 4 February 2010, Nashville, Tennessee AIAA 2010-1767 Copyright © 2010 by the American Institute of Aeronautics and Astronautics, Inc. The U.S. Government has a royalty-free license to exercise all rights under the copyright claimed herein for Governmental purposes. All other rights are reserved by the copyright owner.
Transcript of Using A Virtual BAF in EW Testing
Approved for Public Release: PA# AFFTC-PA-10013
Using A Virtual BAF in EW Testing
William C. Chen
772nd
Test Squadron, 412 Electronic Warfare Group, Edwards AFB, CA 93524-8210
Chad Kuffenkam
772nd
Test Squadron, 412 Electronic Warfare Group, Edwards AFB, CA 93524-8210
Benjamin Hua*
772nd
Test Squadron, 412 Electronic Warfare Group, Edwards AFB, CA 93524-8210
James D. Brownlow
772nd
Test Squadron, 412 Electronic Warfare Group, Edwards AFB, CA 93524-8210
*Previous worked with 772TS/EWOI, Edwards AFB
U.S. Air Force T&E Days 20102 - 4 February 2010, Nashville, Tennessee
AIAA 2010-1767
Copyright © 2010 by the American Institute of Aeronautics and Astronautics, Inc.The U.S. Government has a royalty-free license to exercise all rights under the copyright claimed herein for Governmental purposes.All other rights are reserved by the copyright owner.
Approved for Public Release: PA# AFFTC-PA-10013
Abstract:
The Benefield Anechoic Facility (BAF), located at Edwards Air
Force Base, is the world‟s largest anechoic chamber. The BAF provides
a test environment that has a number of uses:
Evaluation of radar warning receiver (RWR) systems. The BAF can
generate both free-space and direct-inject signals to test RWR
systems, provide real-time environment monitoring, and can record
both the simulated signal environment and system under test (SUT)
emissions.
Evaluation of defensive avionics system testing: communication,
navigation, and identification friend or foe (IFF) testing (CNI).
The BAF can simulate a wide variety of signals in the IFF arena.
Measure antenna patterns. The BAF can measure antenna patterns
of both installed and uninstalled systems.
Perform electromagnetic interference / electromagnetic
compatibility (EMI/EMC) testing.
Test requirements at the BAF are increasing in complexity with the
development of sophisticated manned and unmanned systems; as a result,
ways to improve existing test methods are important. Test setup and
test execution must be done in an efficient and timely manner. A
“Virtual BAF” 3D modeling and simulation tool is proposed to be used
to assess test set up and produce simulation model results. This
Virtual BAF simulation tool is a software model of the anechoic
chamber and uses the uniform theory of diffraction to predict the RF
field environment in the BAF.
The Virtual BAF 3D computer simulation model uses Remcom‟s XGTD
ray-tracing electromagnetic simulation software to provide a
preliminary RF analysis of test setup. Test requirements are used
to set up a „virtual test‟ in software; this will allow test
engineers to complete RF link analyses and to identify potential
problems with the test early in the process. As a result, this
testing methodology will help resolve test ambiguities and insure
that the facility is used in the best possible manner. This paper
presents the major components of the “Virtual BAF” simulation model
as well as a few examples of its use in preliminary test design and
setup. Example applications are given that show how the Virtual
BAF simulation may be used in the following areas:
multipath investigation,
Approved for Public Release: PA# AFFTC-PA-10013
evaluate the test set up before the SUT and BAF facilities
are brought into play.
incoming receiver signal magnitude as a function of
location.
1. Introduction
The US DoD Defense Acquisition Guidebook states “Modeling and
Simulation (M&S) technology is a fundamental part of all product
design and development. It is also a fundamental part of Test &
Evaluation (T&E)” [1]
. The U. S. Air Force Flight Test Center (AFFTC)
at Edwards Air Force Base has a long history of using modeling and
simulation (M&S) in the test and evaluation (T&E) process. “M&S works
have been in the continued and expanded way at all area such as flight
test, ground test, system design, extensive work is also ongoing in
the Avionics and Electronic Warfare (EW) arenas attempting to
replicate a real world battlefield environment by combining the radio
frequency capabilities of the Benefield Anechoic Chamber (BAF), the
avionics simulation abilities of the IFAST and the Digital Integrated
Air Defense System (DIADS). The M&S use across the test process is
expanding” [2]. In this paper, we propose pre-system test simulation
using the “Virtual BAF.” In short we propose to model the test
process in order to assist in test set up, to provide insight into the
conduct of the test and to establish preliminary expected test
results.
2. Benefield Anechoic Chamber (BAF)[3]
The Benefield Anechoic Facility (BAF), located at Edwards Air Force
Base, is the world‟s largest anechoic chamber. Figure (1) is a
picture of the BAF at Edwards AFB.

Approved for Public Release: PA# AFFTC-PA-10013
Figure (1) Benefield Anechoic Chamber (BAF) at Edwards AFB
The BAF provides a test environment that has a number of uses:
Evaluation of radar warning receiver (RWR) systems. The BAF can
generate both free-space and direct-inject signals to test RWR
systems, provide real-time environment monitoring, and can record
both the simulated signal environment and system under test (SUT)
emissions.
Evaluation of defensive avionics system testing: communication,
navigation, and identification friend or foe (IFF) testing. The
BAF can simulate a wide variety of signals in the IFF arena.
Measure antenna patterns. The BAF can measure antenna patterns
of both installed and uninstalled systems.
Perform electromagnetic interference / electromagnetic
compatibility (EMI/EMC) testing.
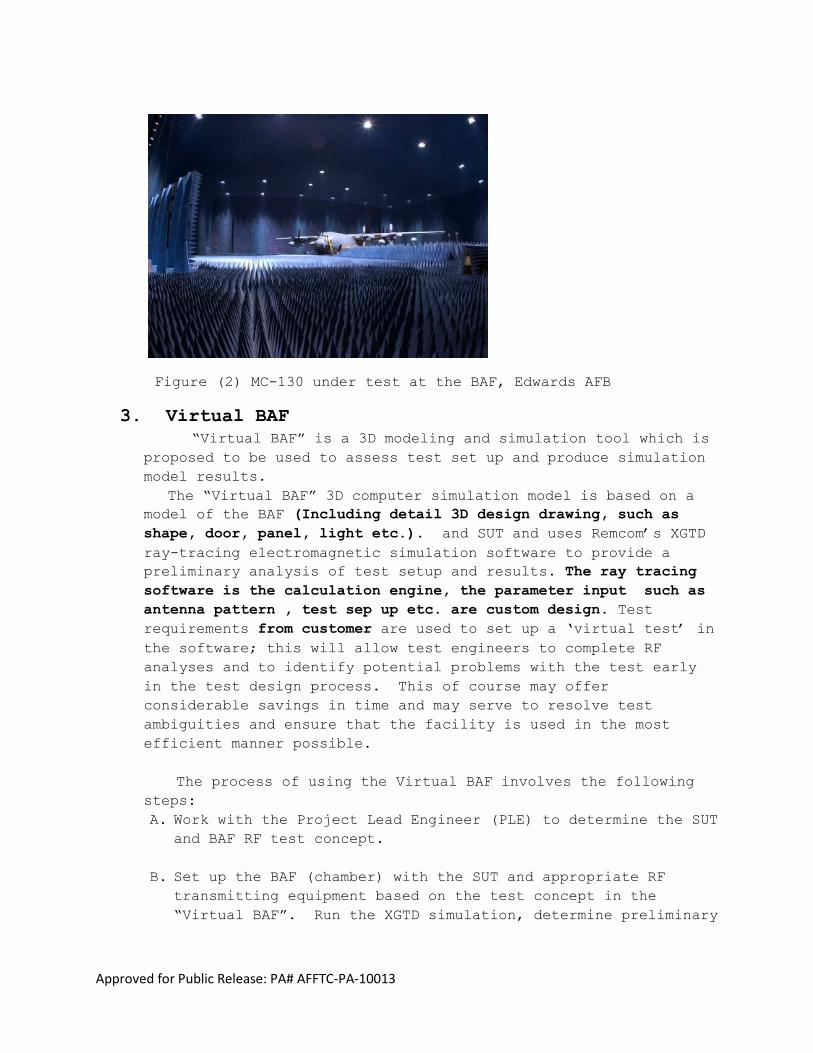
An example of a SUT at the BAF[3]
is shown in Figure (2).
Approved for Public Release: PA# AFFTC-PA-10013
Figure (2) MC-130 under test at the BAF, Edwards AFB
3. Virtual BAF “Virtual BAF” is a 3D modeling and simulation tool which is
proposed to be used to assess test set up and produce simulation
model results.
The “Virtual BAF” 3D computer simulation model is based on a
model of the BAF (Including detail 3D design drawing, such as
shape, door, panel, light etc.). and SUT and uses Remcom‟s XGTD
ray-tracing electromagnetic simulation software to provide a
preliminary analysis of test setup and results. The ray tracing
software is the calculation engine, the parameter input such as
antenna pattern , test sep up etc. are custom design. Test
requirements from customer are used to set up a „virtual test‟ in
the software; this will allow test engineers to complete RF
analyses and to identify potential problems with the test early
in the test design process. This of course may offer
considerable savings in time and may serve to resolve test
ambiguities and ensure that the facility is used in the most
efficient manner possible.
The process of using the Virtual BAF involves the following
steps:
A. Work with the Project Lead Engineer (PLE) to determine the SUT
and BAF RF test concept.
B. Set up the BAF (chamber) with the SUT and appropriate RF
transmitting equipment based on the test concept in the
“Virtual BAF”. Run the XGTD simulation, determine preliminary

Approved for Public Release: PA# AFFTC-PA-10013
expected RF results and identify possible difficulties in the
RF test
C. An example of the computer “Virtual BAF” model is shown in Figure
(3).
Figure (3) An example of a “Virtual BAF” test setup
Figure (3) shows an application of the “Virtual BAF” model being
used to investigate aircraft radar wave reflections expected in a test
set up. The System Under Test (SUT) transmit the test signal to
Advanced Radar Environment Simulator (ARES)Radar Repeater receive port
(Rx), the interference signal from Jammers to the ARES Rx is simulated
and examined. The purpose is to simulate antenna isolation in between
Jammers and ARES Repeater receiving signals, and set up the optimal
system test condition. Ray tracing and geometric theory of
diffraction[4]
is used (reflection/diffraction wave tracing) to
identify propagation paths and associated reflections and diffractions
in the chamber that are expected to occur in an actual test.
Multipath effects that occur during testing in the BAF introduce
errors in measurement data (signal strength and direction of arrival
for example). To reduce this error, the “Virtual BAF” model can
Approved for Public Release: PA# AFFTC-PA-10013
investigate the multipath phenomena, and in turn may help to determine
a test set up that will minimize this effect.
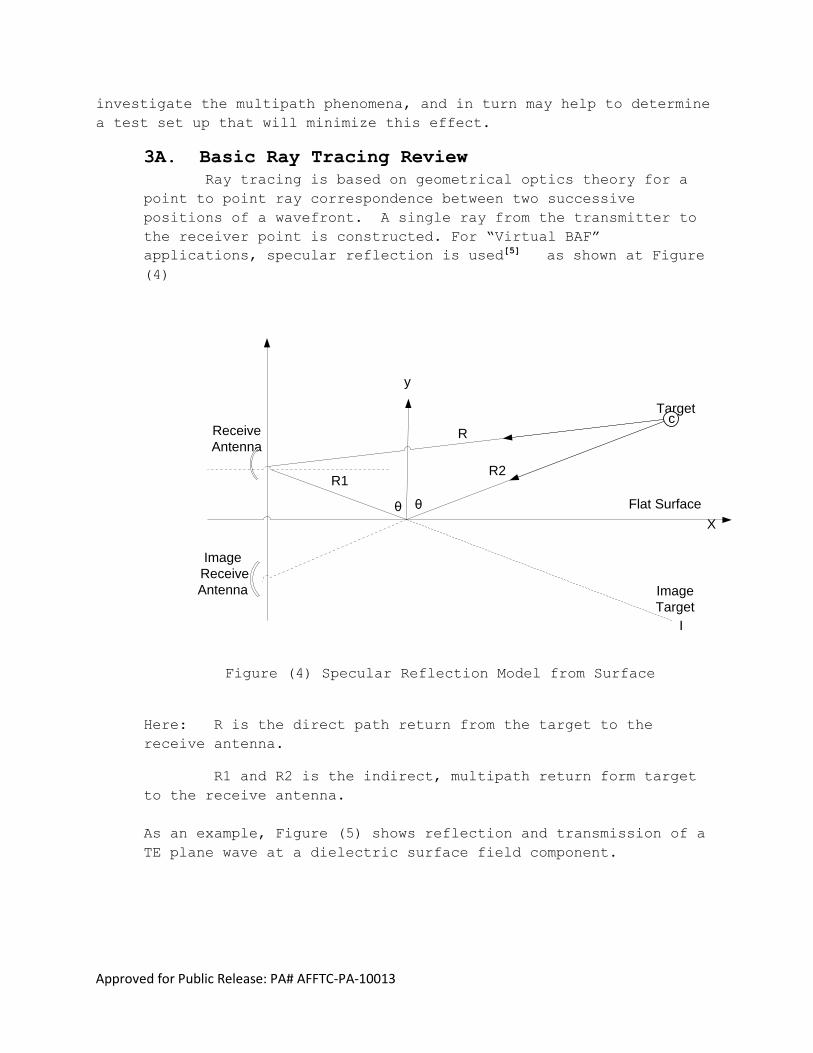
3A. Basic Ray Tracing Review
Ray tracing is based on geometrical optics theory for a
point to point ray correspondence between two successive
positions of a wavefront. A single ray from the transmitter to
the receiver point is constructed. For “Virtual BAF”
applications, specular reflection is used[5] as shown at Figure
(4)
X
R
R1R2
Target
Flat Surface
Image
Target
Receive
Antenna
c
Image
Receive
Antenna
I
y
θθ
Figure (4) Specular Reflection Model from Surface
Here: R is the direct path return from the target to the
receive antenna.
R1 and R2 is the indirect, multipath return form target
to the receive antenna.
As an example, Figure (5) shows reflection and transmission of a
TE plane wave at a dielectric surface field component.

Approved for Public Release: PA# AFFTC-PA-10013
y
x
E
H
E
H
Z
θθ
θT
Figure (5) Field component of reflection and
transmission TE plane wave.
Θ is the incident and reflect angle
is the deflection angle to dielectric surface
For a simple example, if we consider the Transverse
Electrical (TE) mode propagation of an electromagnetic plane wave
in the chamber as shown in Figure (5) the electrical and magnetic
fields along the x, y and z (into the direction of paper) can be
written as [6]
----------- (1)
------- (2)
------- (3)
Where:
: is the incident wave strength of the electrical field
: is the reflective wave strength of the electrical field
: is the wave impedance of the surface medium in ohms
k : is the wave vector which points to the direction of
propagation
From equation (1),(2) and (3) the electrical field
strength can be calculated , or programmed via software

Approved for Public Release: PA# AFFTC-PA-10013
calculation, at point to point or point to multipoint field
magnitude and phenomena.
3B. Virtual BAF Application
As shown in Figure(3), the application of the “Virtual BAF” model. The Model was used in conjunction with an Advanced Radar
Environment Simulator (ARES). ARES is a radar signal repeater. ARES
is shown on the left side of figure (6). The “Virtual BAF” was used
in the investigation of a pre-system test set-up to evaluate aircraft
radar wave reflections expected in this test. Figure (8) shows the
pre-system test of the interference transmit and radar repeater
receiver port isolation [7]
that was designed from the simulation
result.
Figure (6) Antenna Isolation Designed from “Virtual BAF” Simulation.
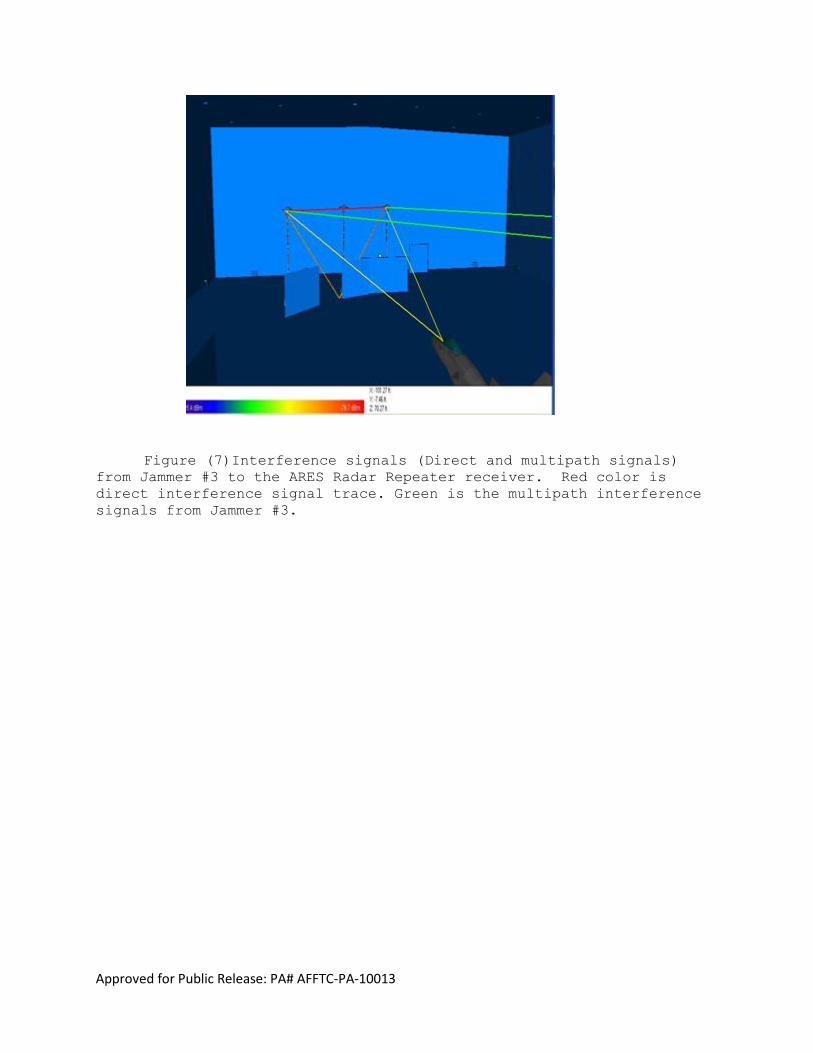
Figure (7) shows the ray tracing example of how Jammer #3‟s
interference signal (direct and multipath signals) propagate to the
receiver port of the ARES Radar repeater. The time of arrival of the
direct and multipath signals to the radar repeater receiver can also
be calculated and plotted as shown in Figure (8).
Approved for Public Release: PA# AFFTC-PA-10013
Figure (7)Interference signals (Direct and multipath signals)
from Jammer #3 to the ARES Radar Repeater receiver. Red color is
direct interference signal trace. Green is the multipath interference
signals from Jammer #3.
Approved for Public Release: PA# AFFTC-PA-10013
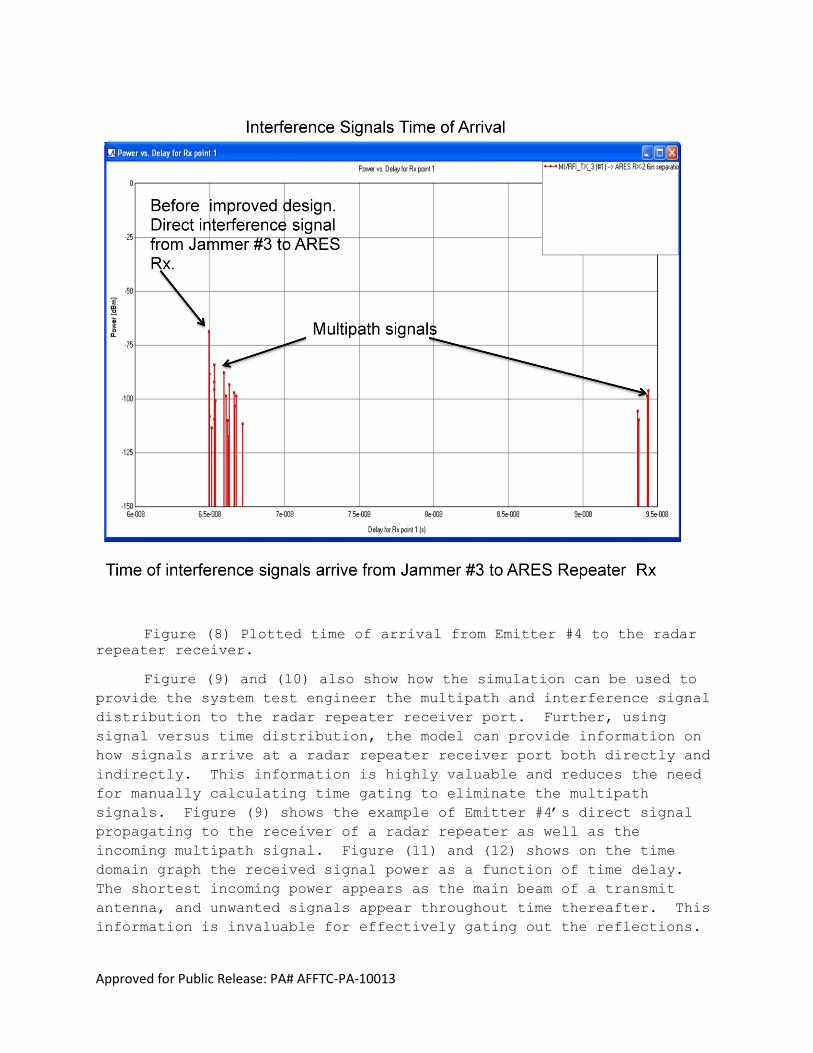
Figure (8) Plotted time of arrival from Emitter #4 to the radar
repeater receiver.
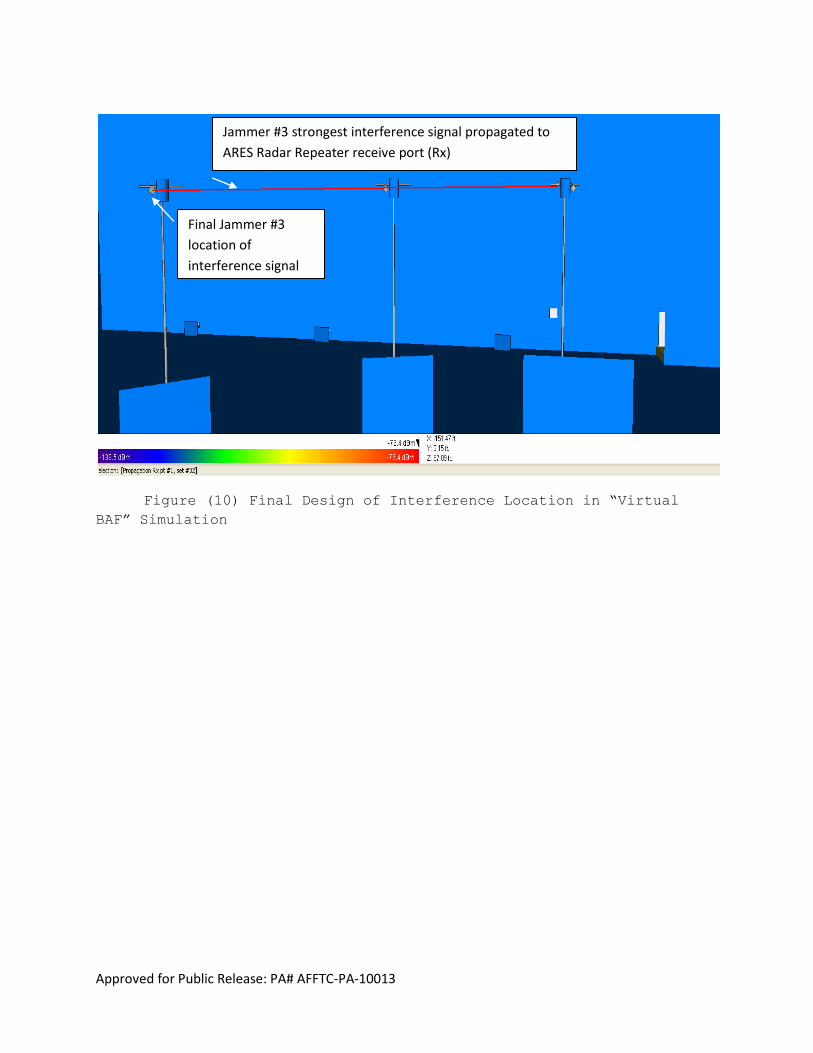
Figure (9) and (10) also show how the simulation can be used to
provide the system test engineer the multipath and interference signal
distribution to the radar repeater receiver port. Further, using
signal versus time distribution, the model can provide information on
how signals arrive at a radar repeater receiver port both directly and
indirectly. This information is highly valuable and reduces the need
for manually calculating time gating to eliminate the multipath
signals. Figure (9) shows the example of Emitter #4‟s direct signal
propagating to the receiver of a radar repeater as well as the
incoming multipath signal. Figure (11) and (12) shows on the time
domain graph the received signal power as a function of time delay.
The shortest incoming power appears as the main beam of a transmit
antenna, and unwanted signals appear throughout time thereafter. This
information is invaluable for effectively gating out the reflections.

Approved for Public Release: PA# AFFTC-PA-10013
The application will be useful in such cases where the BAF tests EW
jammer interference.
Figure (9) Initial Design of Interference Signal Location in
“Virtual BAF” Simulation
Jammer #4 Initial
location of
interference
signal
Jammer #3 strongest interference signal propagated to
ARES Radar Repeater receive port (Rx)
Approved for Public Release: PA# AFFTC-PA-10013
Figure (10) Final Design of Interference Location in “Virtual
BAF” Simulation
Final Jammer #3
location of
interference signal
Jammer #3 strongest interference signal propagated to
ARES Radar Repeater receive port (Rx)

Approved for Public Release: PA# AFFTC-PA-10013
Figure (11) Jammer #4 Interference Signals Delay vs. Power into
ARES Radar Repeater Receive Port.
Note this output corresponds to Figure (8)‟s set up
configuration. The strongest interference multipath signal is -
66 dB.

Approved for Public Release: PA# AFFTC-PA-10013
Figure (12) Multipath Interference Signals Delay vs. Power into radar
Repeater Received.
Note this output is correspond to Figure (9)‟s set up configuration,
and the strongest interference signal cut down to below -75 dB.
Power distribution can also be investigated with the “Virtual
BAF” model. This reveals potential “hot spots” inside the chamber.
This information will be useful from a safety perspective in
determining safe zones for personnel and for the Radar absorbing
material (RAM). Figure (13) shows an example power distribution. RAM
has a specific tolerance for absorbing energy before it will burn, and
this is a major concern with any high-power RF testing. With the
“Virtual BAF” model, analysis can be done beforehand to identify and
mitigate these issues.

Approved for Public Release: PA# AFFTC-PA-10013
Figure (13) Power distribution of received power at ground
level
These are just a few examples of how a simulated “Virtual BAF”
model could benefit the BAF testing. Using a basic ray tracing
simulation tool like Remcom‟s XGTD program the “Virtual BAF” model,
will help improve the test design, execution and increase overall
confidence in test results. For all these reasons the “Virtual BAF”
model, incorporate the custom waveform design, antenna pattern, etc.,
can be a useful tool for modeling and simulation in EW testing at the
772nd Test Squadron and the BAF.
4. Data Analysis – Design of Experiments (DOE)
The “Virtual BAF” simulation system has been in development for a
year and a half. The simulation uses XGTD software. Throughout this
developmental time period the XGTD software has been corrected and
improved upon. To gain further confidence in the simulation software
we have applied a data analysis tool – Design of Experiments (DOE) to
analyze the results of the simulated data.
DOE is one of the mature data analysis tools widely applied in the M&S
field here at the AFFTC, Edwards AFB. For example, it was used in a
recent test of an AN/ALR 69A(V) Radar Warning Receiver (RWR) installed
on a Block 30 F-16C/D [8]
. The technical report was selected as the
“best technical paper of the year” at the AFFTC, Edwards AFB of 2009.

Approved for Public Release: PA# AFFTC-PA-10013
One application of DOE with the “Virtual BAF” was to determine what
(if any) interference was present in a Radar Warning Receiver (RWR)
test. Transmit signals were received by a radar receiver and it was
thought that there may be interference (either additive or
cancelative) RF energy also feeding into the radar receiver. For this
data experiment, the transmit signal going into the receiving port of
the radar repeater was designed as follows:
Designated Emitter Source
Transmit #1
(Tx.1)
System under
test
Transmit #2
(Tx.2)
Interference
#1
Transmit #3
(Tx.3)
Interference
#2
Transmit #4
(Tx.4)
Interference
#3
Table (1) Jammer source designated
An error signal was introduced at the system under test emitter
(SUT, Tx.1)which assume the SUT radome is not a perfect EM wave
transmission. Full factor statistical data was applied to
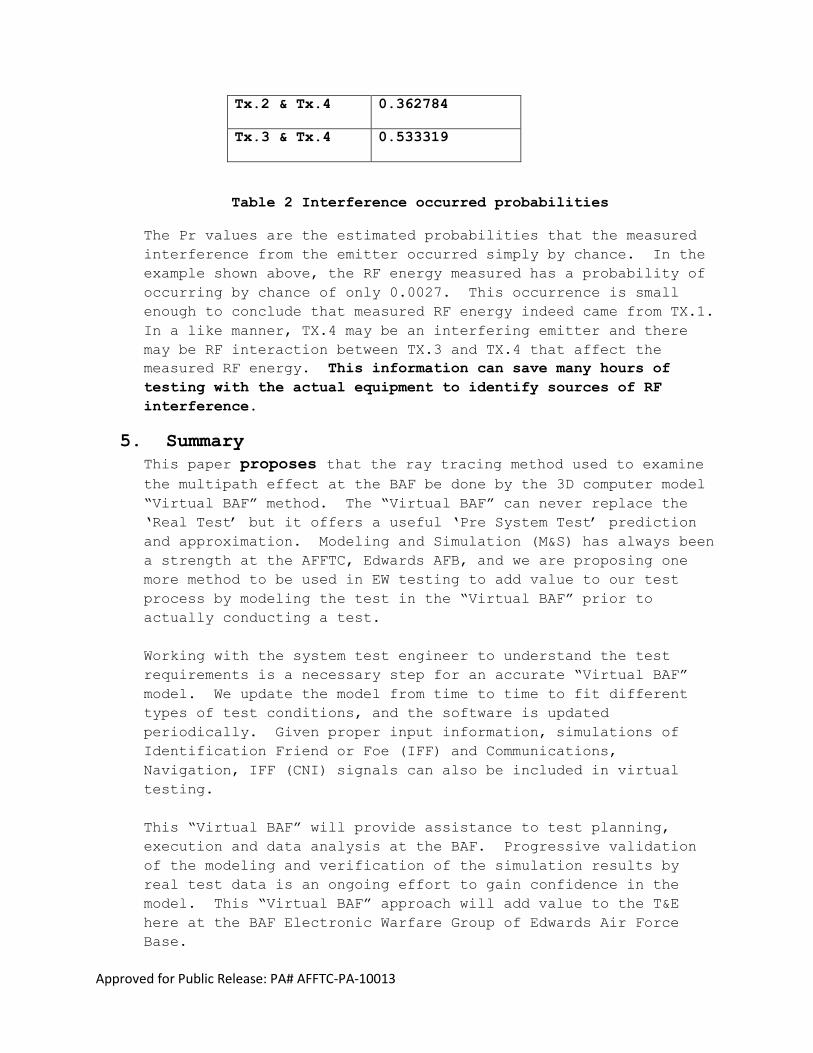
examine the first set of data. Table (2) lists the Pr value when
the emitter was on.
Emitter
turned on
Pr value (Error
ray result)
Tx.1 only 0.002715
Tx.2 only 0.306183
Tx.3 only 0.826737
Tx.4 only 0.450528
Tx.1 & Tx.2 0.448212
Tx.1 & Tx.3 0.82622
Tx.1 & Tx.4 0.450895
Tx.2 & Tx.3 0.370572
Approved for Public Release: PA# AFFTC-PA-10013
Tx.2 & Tx.4 0.362784
Tx.3 & Tx.4 0.533319
Table 2 Interference occurred probabilities
The Pr values are the estimated probabilities that the measured
interference from the emitter occurred simply by chance. In the
example shown above, the RF energy measured has a probability of
occurring by chance of only 0.0027. This occurrence is small
enough to conclude that measured RF energy indeed came from TX.1.
In a like manner, TX.4 may be an interfering emitter and there
may be RF interaction between TX.3 and TX.4 that affect the
measured RF energy. This information can save many hours of
testing with the actual equipment to identify sources of RF
interference.
5. Summary
This paper proposes that the ray tracing method used to examine
the multipath effect at the BAF be done by the 3D computer model
“Virtual BAF” method. The “Virtual BAF” can never replace the
„Real Test‟ but it offers a useful „Pre System Test‟ prediction
and approximation. Modeling and Simulation (M&S) has always been
a strength at the AFFTC, Edwards AFB, and we are proposing one
more method to be used in EW testing to add value to our test
process by modeling the test in the “Virtual BAF” prior to
actually conducting a test.
Working with the system test engineer to understand the test
requirements is a necessary step for an accurate “Virtual BAF”
model. We update the model from time to time to fit different
types of test conditions, and the software is updated
periodically. Given proper input information, simulations of
Identification Friend or Foe (IFF) and Communications,
Navigation, IFF (CNI) signals can also be included in virtual
testing.
This “Virtual BAF” will provide assistance to test planning,
execution and data analysis at the BAF. Progressive validation
of the modeling and verification of the simulation results by
real test data is an ongoing effort to gain confidence in the
model. This “Virtual BAF” approach will add value to the T&E
here at the BAF Electronic Warfare Group of Edwards Air Force
Base.

Approved for Public Release: PA# AFFTC-PA-10013
References:
1. “Techniques for integrating ground and flight test and modeling
and simulation to improve aircraft propulsion system
acquisition”, David S. Kidman , Donald J. Malloy and Andrew A.
Hughes. 40th International SFTE Symposium, 7-11 September 2009,
Linkoping and Stockholm, Sweden.
2. “Lesson Learned From Modeling & Simulation Use In The Flight
Dynamics Test And Evaluation Process. 55 Years Of AFFTC
Experience. Fredrick R. Webster, 773 TS. Edwards Air Force
Base.
40th Annual SFTE International Symposium, 7-11 September 2009,
Linkoping and Stockholm, Sweden
3. “EW Survivability Ground Testing”, Lt Col Taylor Selden, 772 TS
. Antelope Valley Chapter , The International Test &
Evalution Association , April 8, 2009
4. “Introduction to The Uniform Geometrical Theory of
Diffraction”. D.A. McNamara, C. W. I. Pistorius, and J. A. G.
Malherbe. Artech House, Boston, 1990
5. “Modern Radar System Analysis”, David K. Barton, Artech House,
pp 512 – 528
6. “ Radio Propagation for Modern Wireless System”, Henry L.
Bertoni, Prentice Hall, pp 62-68
7. “Antenna Isolation Determination Test”, Hans Lambrecht, Josh
Rozas, John Parra, Saul Correa. Internal Report, 772TS/EWOI.
August 18, 2009.
8. “F-16 ALR-69A Testing at the Benefield Anechoic Facility Using
Design Of Experiments” , James D. Brownlow, William Kitto,
Mario Dorado and Paul E. Kladitis, all AFFTC, Edwards AFB. AIAA
Air Force T&E Days, 5-7 February 2008, Los Angeles, CA.

Approved for Public Release: PA# AFFTC-PA-10013