USING A TEST HAY FOR FEEDING LIVESTOCK · CP = %N x 6.25 Acid Detergent Fiber (ADF; cellulose &...
36
USING A TEST HAY FOR FEEDING LIVESTOCK Shelby J. Filley Regional Livestock & Forage Specialist Proper nutrition at a lower cost
-
Upload
truonghanh -
Category
Documents
-
view
217 -
download
0
Transcript of USING A TEST HAY FOR FEEDING LIVESTOCK · CP = %N x 6.25 Acid Detergent Fiber (ADF; cellulose &...
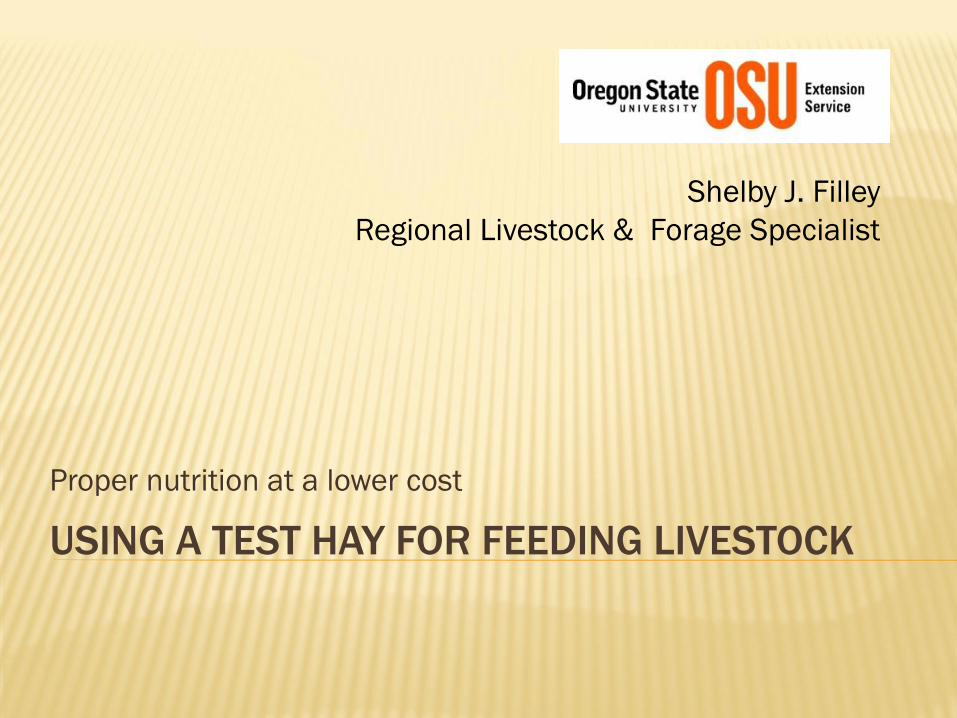
USING A TEST HAY FOR FEEDING LIVESTOCK
Shelby J. Filley
Regional Livestock & Forage Specialist
Proper nutrition at a lower cost
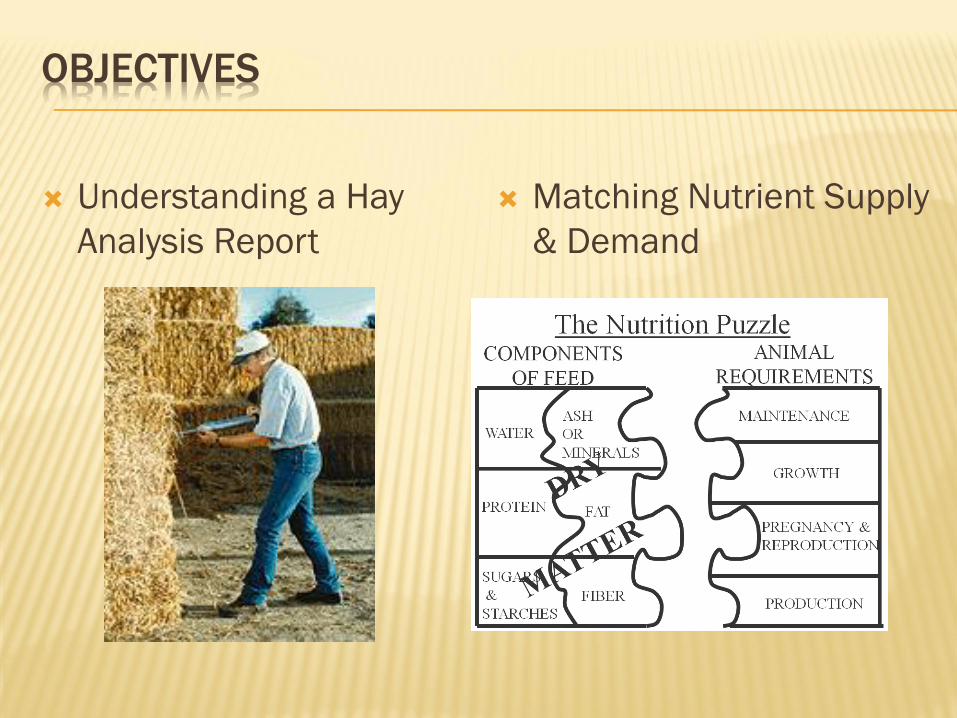
OBJECTIVES
Understanding a Hay
Analysis Report
Matching Nutrient Supply
& Demand

TESTING HAY/FEEDING APPROPRIATELY
One producer reduced feeding cost by $38/cow by substituting a low-quality forage (grass seed straw) for 25% of his feed
Another sold 90 tons of high quality hay determined to be in excess of his needs
A third reduced the cost per pound gain on weaned calves by adding barley to a forage-based program
A forth purchased Orchard grass straw, sold alfalfa, and profited $4,000
Average savings = $18/head
over the winter feeding period
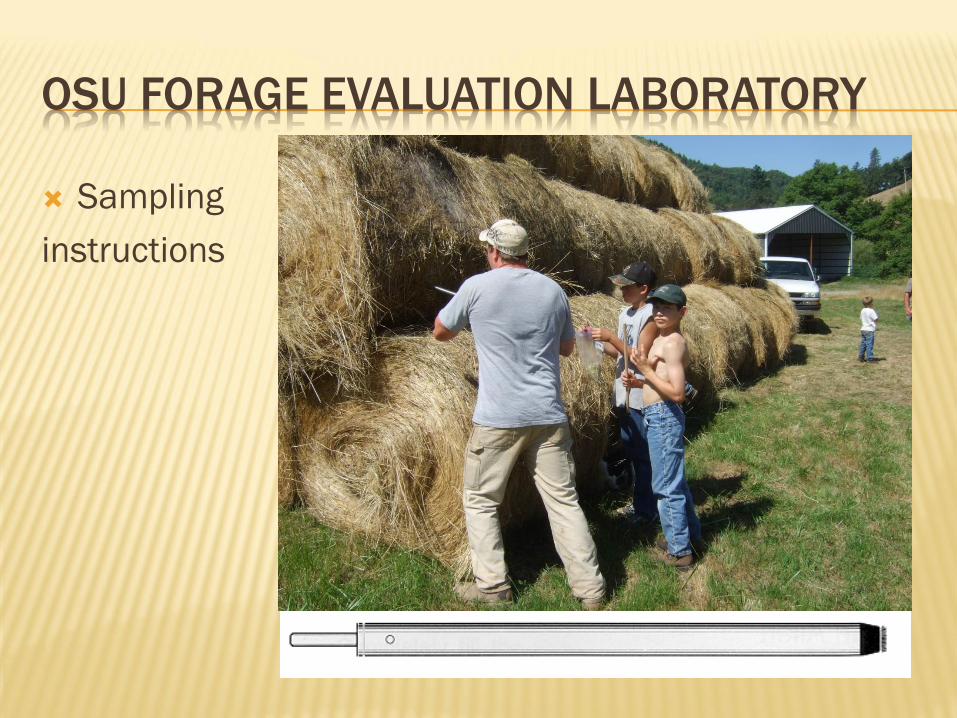
OSU FORAGE EVALUATION LABORATORY
Sampling
instructions
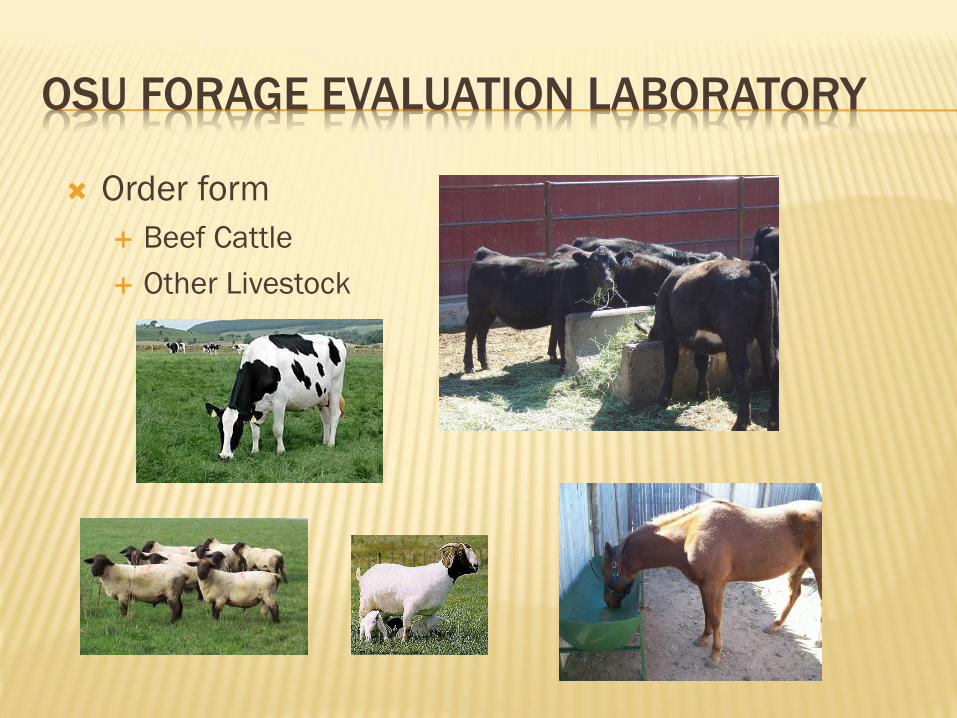
OSU FORAGE EVALUATION LABORATORY
Order form
Beef Cattle
Other Livestock

UNDERSTANDING YOUR FORAGE TEST RESULTS
Many terms/acronyms
Related to plant
components
Cell wall
Cell contents
Lets start with the plant
first, then return to the
laboratory report
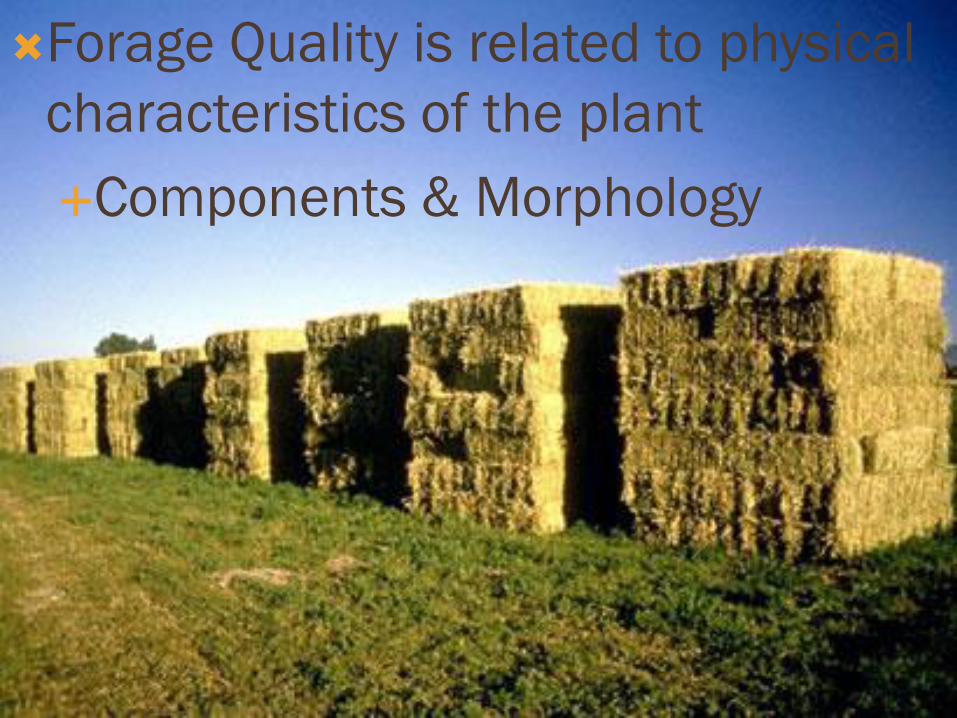
Forage Quality is related to physical
characteristics of the plant
Components & Morphology
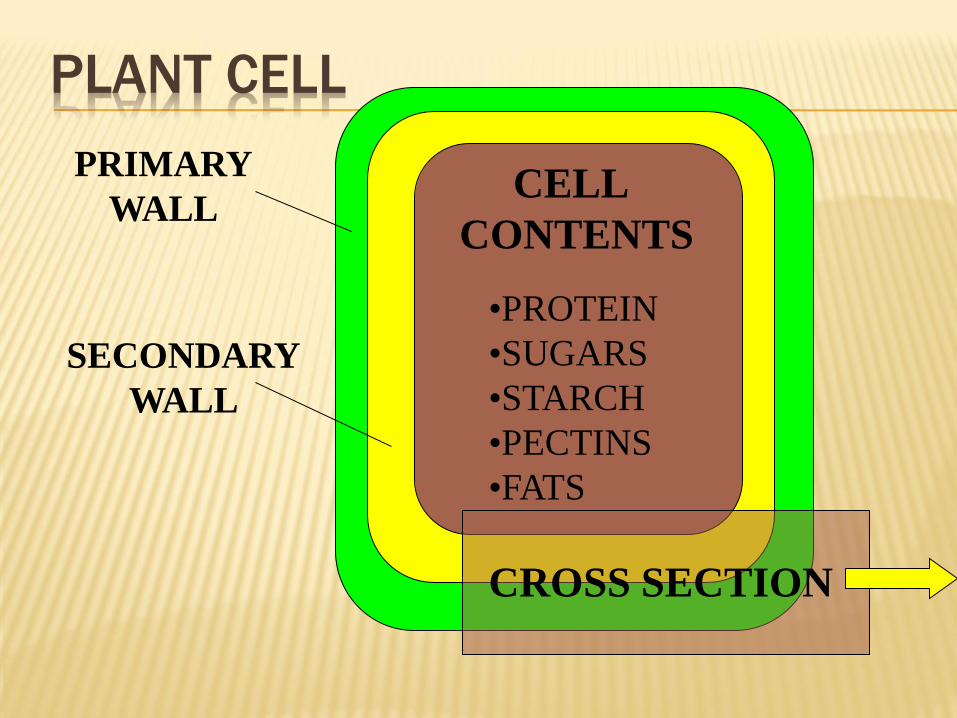
PLANT CELL
•PROTEIN
•SUGARS
•STARCH
•PECTINS
•FATS
PRIMARY
WALL
SECONDARY
WALL
CELL
CONTENTS
CROSS SECTION
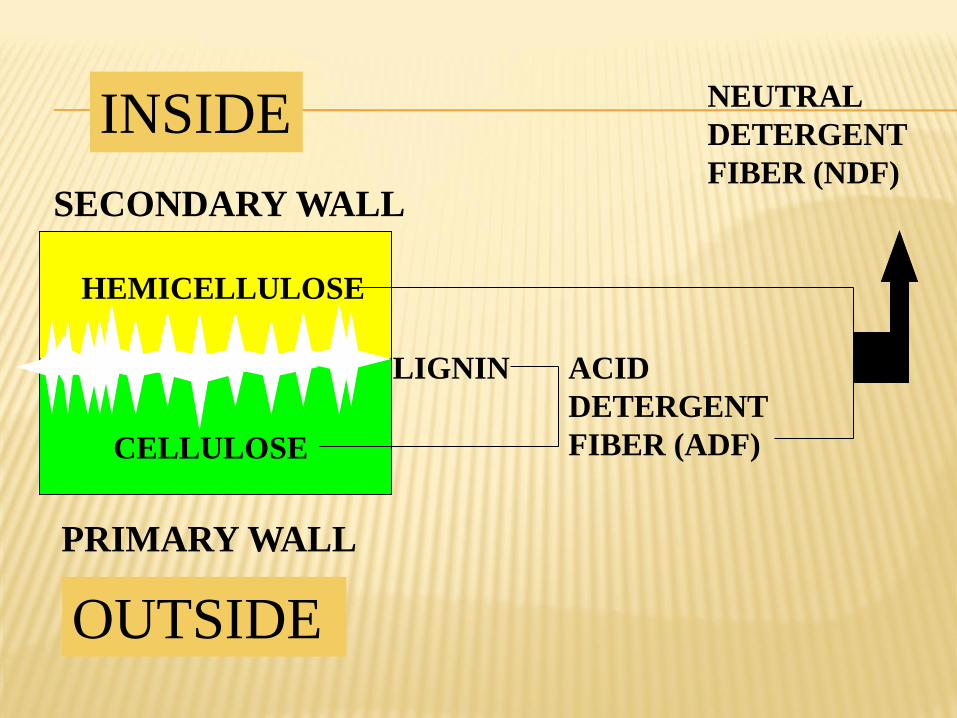
SECONDARY WALL
PRIMARY WALL
CELLULOSE
HEMICELLULOSE
LIGNIN ACID
DETERGENT
FIBER (ADF)
NEUTRAL
DETERGENT
FIBER (NDF)
OUTSIDE
INSIDE

FORAGE ADF AND DRY
MATTER DIGESTIBILITY
57
59
61
63
65
67
69
28 29 30 31 32 33 34 35
Forage ADF (%)
Dry
Ma
tte
r D
ige
sti
bilit
y (
%)
Adapted from Miller et al. (1991)
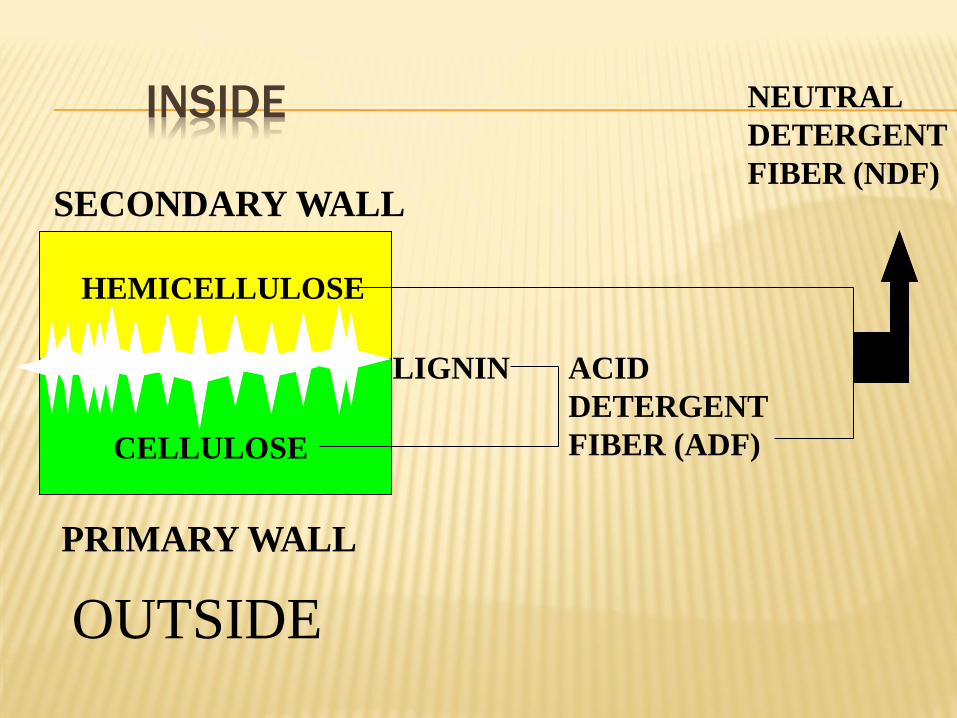
INSIDE
SECONDARY WALL
PRIMARY WALL
CELLULOSE
HEMICELLULOSE
LIGNIN ACID
DETERGENT
FIBER (ADF)
NEUTRAL
DETERGENT
FIBER (NDF)
OUTSIDE

FORAGE NDF AND DRY
MATTER INTAKE
.0
.5
1.0
1.5
2.0
2.5
3.0
3.5
38 42 46 50 54 58 62 66 70 74 78
Forage NDF (%)
Dry
Ma
tte
r in
tak
e (
% o
f B
W)
Adapted from Mertens (1985) & Burns et al. (1997)
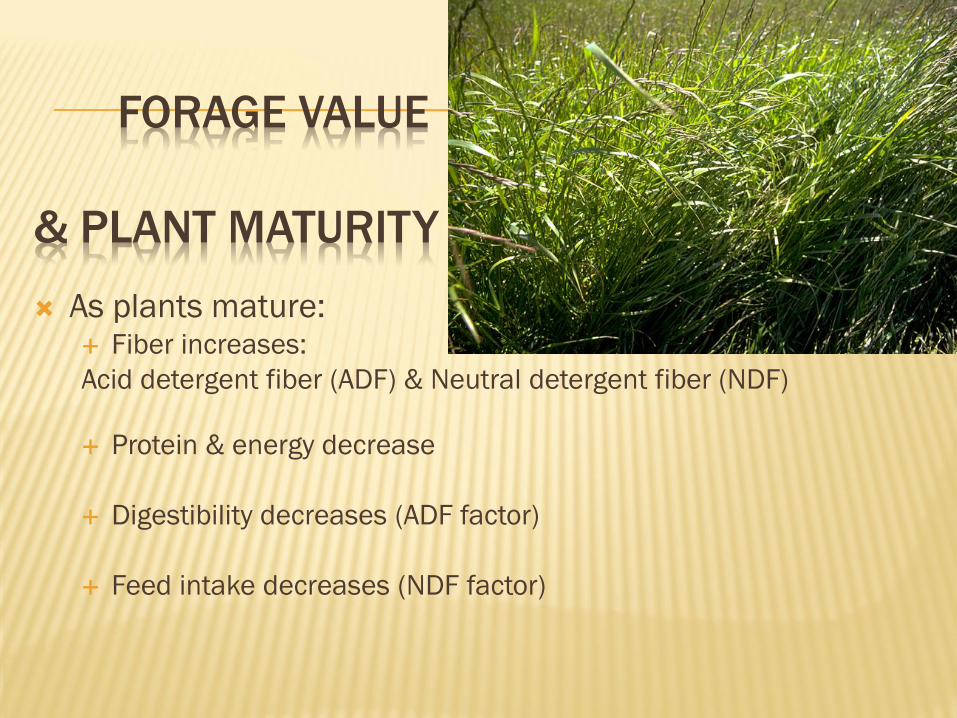
FORAGE VALUE
& PLANT MATURITY
As plants mature: Fiber increases:
Acid detergent fiber (ADF) & Neutral detergent fiber (NDF)
Protein & energy decrease
Digestibility decreases (ADF factor)
Feed intake decreases (NDF factor)
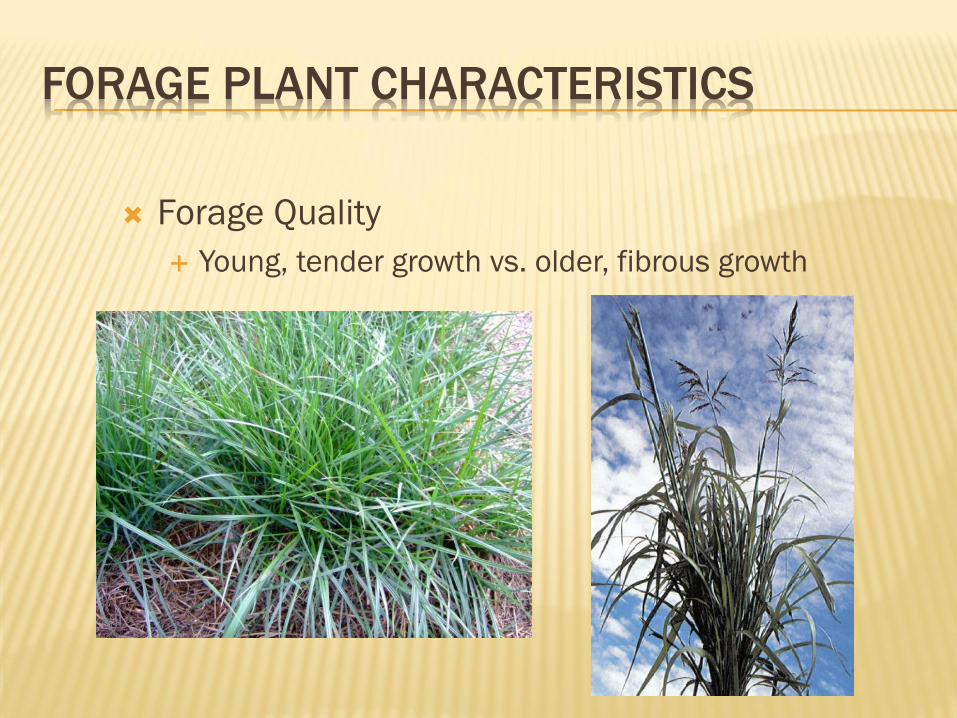
FORAGE PLANT CHARACTERISTICS
Forage Quality
Young, tender growth vs. older, fibrous growth

0
1
2
3
4
5
5/20 5/30 6/9 6/19 6/29 7/9 7/19
40
45
50
55
60
65
70
TRADE-OFF BETWEEN YIELD AND
ENERGY
DM
(T
on
/acr
e)
CUTTING DATE
EARLY
BLOOM

0
1
2
3
4
5
5/20 5/30 6/9 6/19 6/29 7/9 7/19
10
15
20
25
30
TRADE-OFF BETWEEN YIELD AND
PROTEIN
DM
(T
on
/acr
e)
CUTTING DATE
EARLY
BLOOM

MAKE GOOD HAY
OR… WATCH YOUR NEIGHBORING FIELDS
FOR GOOD CUTTING PRACTICES
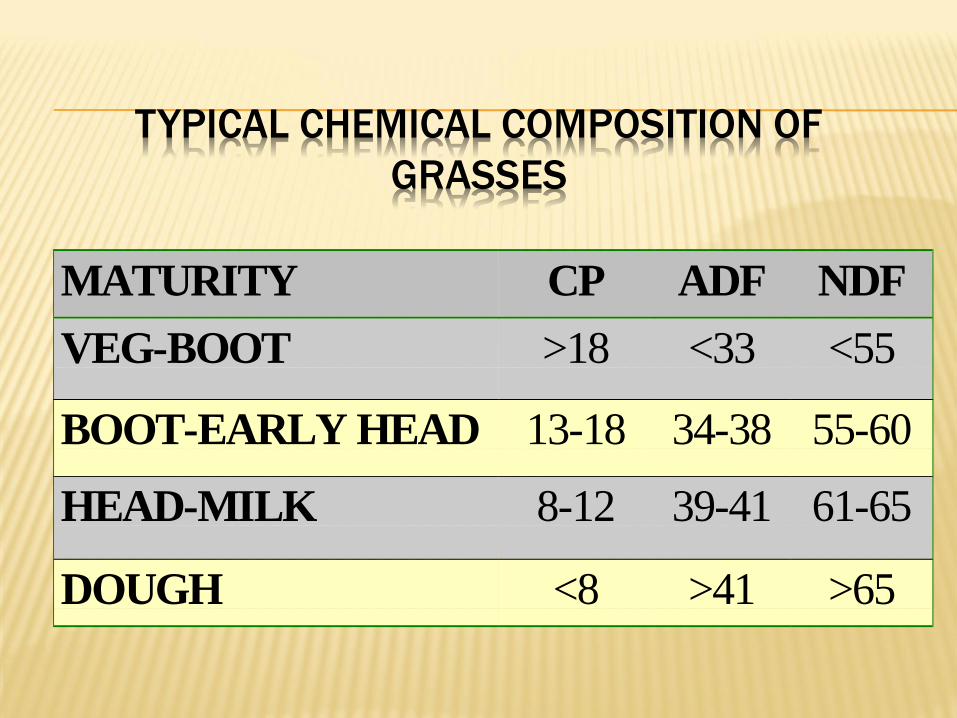
TYPICAL CHEMICAL COMPOSITION OF
GRASSES
MATURITY CP ADF NDF
VEG-BOOT >18 <33 <55
BOOT-EARLY HEAD 13-18 34-38 55-60
HEAD-MILK 8-12 39-41 61-65
DOUGH <8 >41 >65
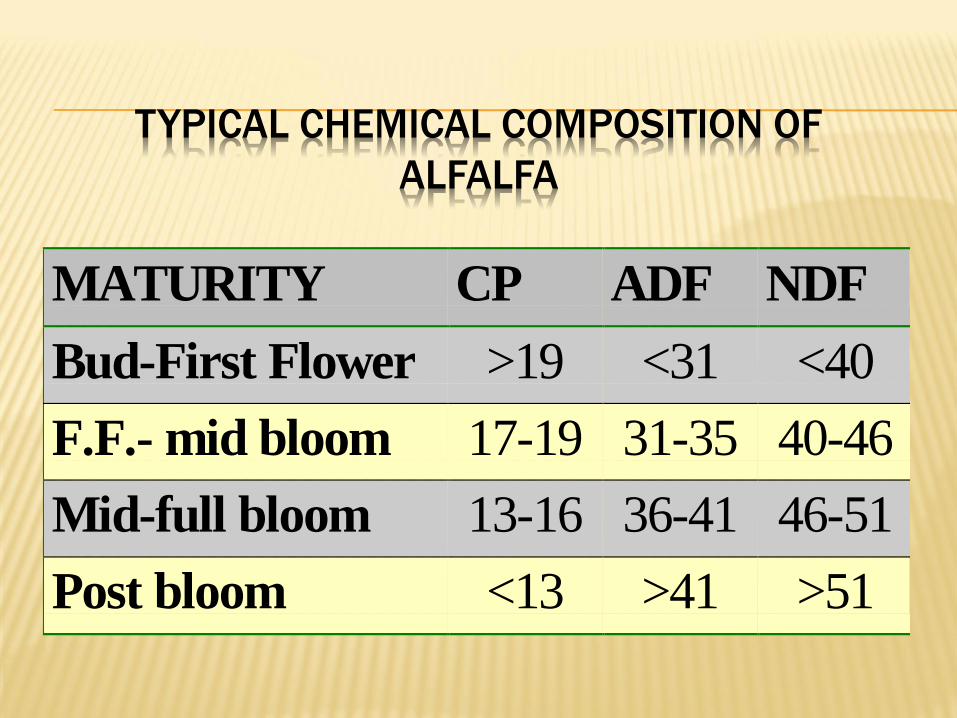
TYPICAL CHEMICAL COMPOSITION OF
ALFALFA
MATURITY CP ADF NDF
Bud-First Flower >19 <31 <40
F.F.- mid bloom 17-19 31-35 40-46
Mid-full bloom 13-16 36-41 46-51
Post bloom <13 >41 >51
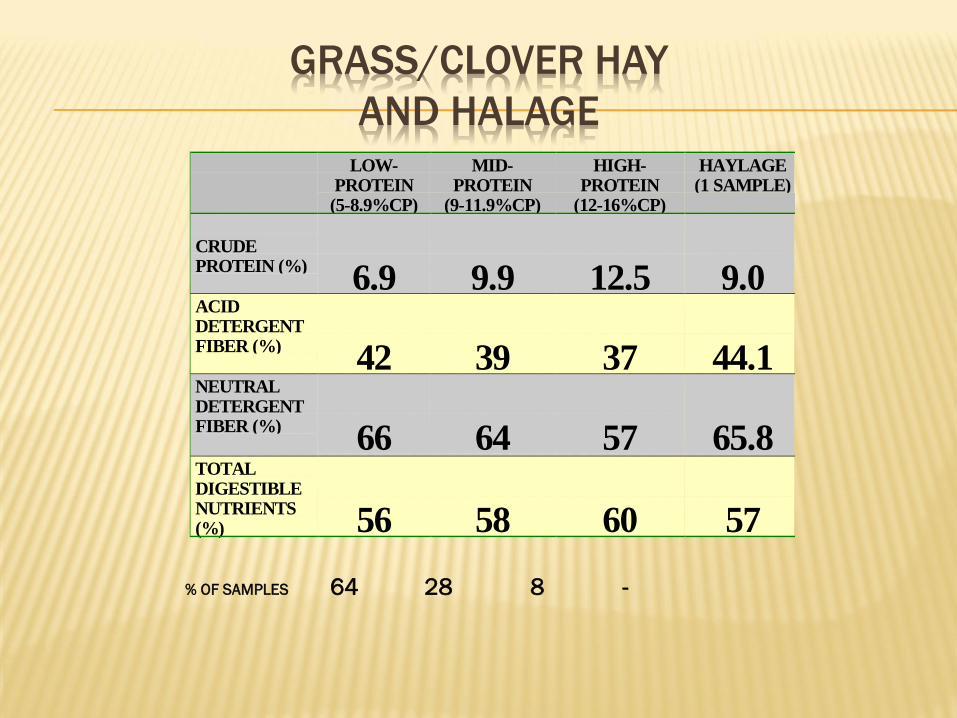
GRASS/CLOVER HAY
AND HALAGE LOW-
PROTEIN(5-8.9%CP)
MID-PROTEIN
(9-11.9%CP)
HIGH-PROTEIN
(12-16%CP)
HAYLAGE(1 SAMPLE)
CRUDEPROTEIN (%)
6.9 9.9 12.5 9.0ACIDDETERGENTFIBER (%)
42 39 37 44.1NEUTRALDETERGENTFIBER (%)
66 64 57 65.8TOTALDIGESTIBLENUTRIENTS(%) 56 58 60 57
% OF SAMPLES 64 28 8 -

ALFALFA BASED FORAGES
ALFALFA/GRASS MIX
ALFALFA ALFALFAHAYLAGE
CRUDEPROTEIN(%) 17 - 20 16- 20 20ACIDDETERGENTFIBER (%) 31 -38 34-43 41
NEUTRALDETERGENTFIBER (%) 43 - 50 41-53 50TOTALDIGESTIBLENUTRIENTS(%)
59 - 61 56-60 57


Moisture = water
Dry Matter = total - water DM = protein, fats, carbohydrates, ash
For example:
1 ton load of feed
Differing %DM
Differs in amount of feed
Compare feeds (hay
or baleage)
on a 100% DM basis
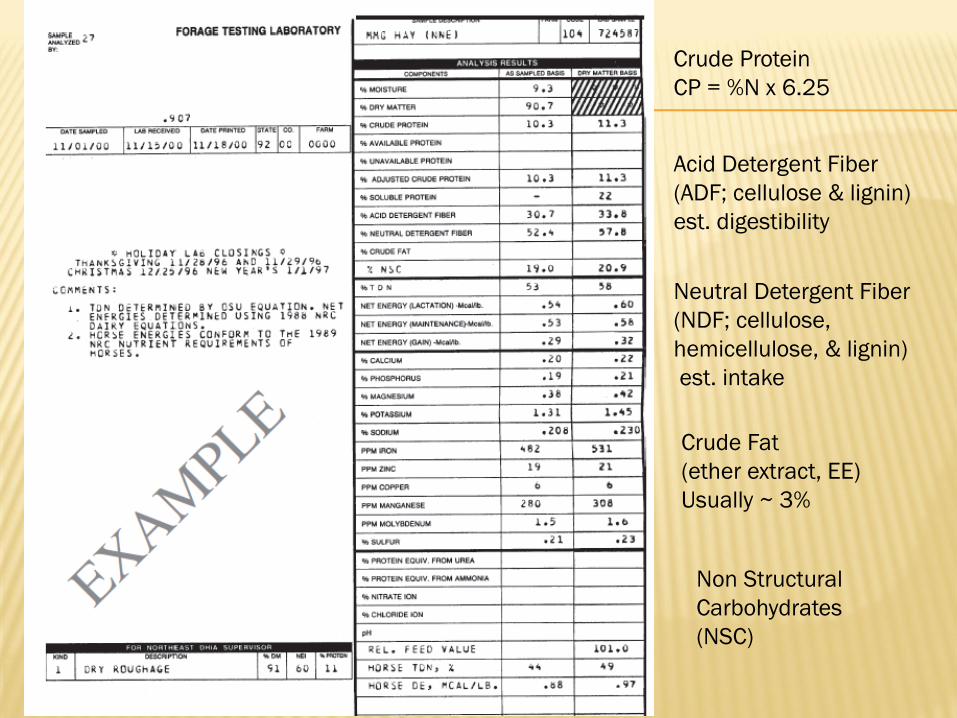
Crude Protein
CP = %N x 6.25
Acid Detergent Fiber
(ADF; cellulose & lignin)
est. digestibility
Neutral Detergent Fiber
(NDF; cellulose,
hemicellulose, & lignin)
est. intake
Crude Fat
(ether extract, EE)
Usually ~ 3%
Non Structural
Carbohydrates
(NSC)
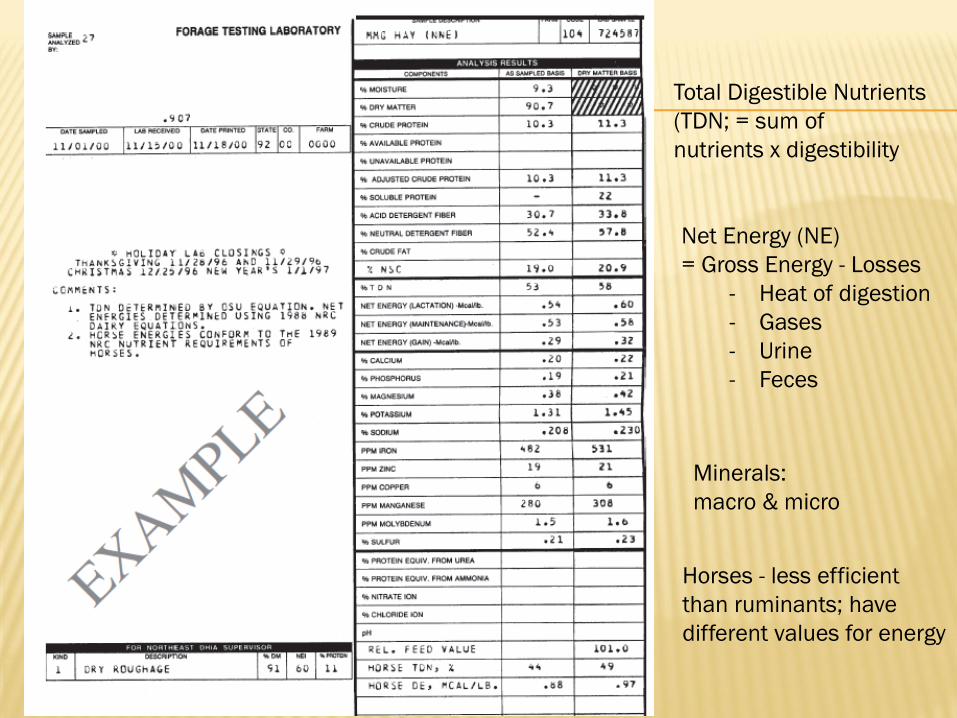
Total Digestible Nutrients
(TDN; = sum of
nutrients x digestibility
Net Energy (NE)
= Gross Energy - Losses
- Heat of digestion
- Gases
- Urine
- Feces
Minerals:
macro & micro
Horses - less efficient
than ruminants; have
different values for energy

USDA AGRICULTURAL MARKETING SERVICE ALFALFA & ALFALFA\GRASS HAY TESTING GUIDELINES
Grade ADF
(%) NDF
(%) RFV
TDN
100 (%)
TDN
90 (%) CP (%)
Supreme <27 <34 >185 >62 55.9 >22
Premium 27-29 34-36
170-
185 60-62
54.5-
55.9 20-22
Good 29-32 36-40
150-
170 58-60
52.5-
54.5 18-20
Fair 32-35 40-44
130-
150 56-58
50.5-
52.5 16-18
Utility >35 >44 <130 <56 <50.5 <16 RFV: Relative Feed Value
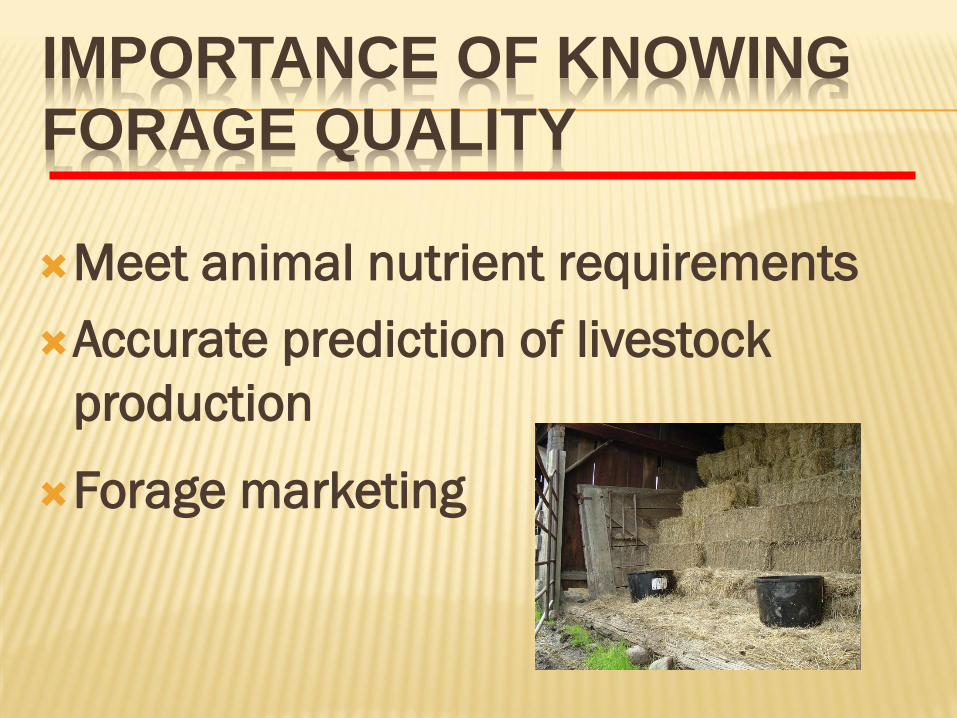
IMPORTANCE OF KNOWING
FORAGE QUALITY
Meet animal nutrient requirements
Accurate prediction of livestock
production
Forage marketing

THE NUTRITION PUZZLE

48505254565860626466
MAIN
T 0 5 10 15 20
LACTATIO
N
EWE requirements HAY content
WEEKS OF GESTATION
Energy content of grass hay and energy requirements of ewes.

02468
1012141618
MAIN
T 0 5 10 15 20
LA
CTA
TIO
N
EWE Requirements HAY contnet
WEEKS OF GESTATION
Protein content of grass hay and protein requirements of ewes

NUTRIENT REQUIREMENTS OF SELECTED
LIVESTOCK… COMPARE TO HAY
Animal
Weight
(lb)
gain
(lb/day)
protein
(%)
TDN
(energy; %)
Pregnant yearling heifer 830 lb 1.3 8.6 58.8
Dry pregnant mature cow 1100 lb 0.9 7.8 53.1
Lactating yearling heifer 830 .4 10.9 63.8
Lactating cow 1100 0 9.7 56.6
Pregnant ewe lamb 121 0.35 11.8 63
Pregnant Ewe 154 0.4 10.7 59
Ewe with twins 154 -0.13 15.0 65
Ewe with singles 154 -0.06 13.4 65
Medium-frame steer
calves
500 1 9.5 58.5
Medium-frame steer
calves
500 3 14.4 85.0
(NRC Sheep 1985 ; NRC Beef 1984).
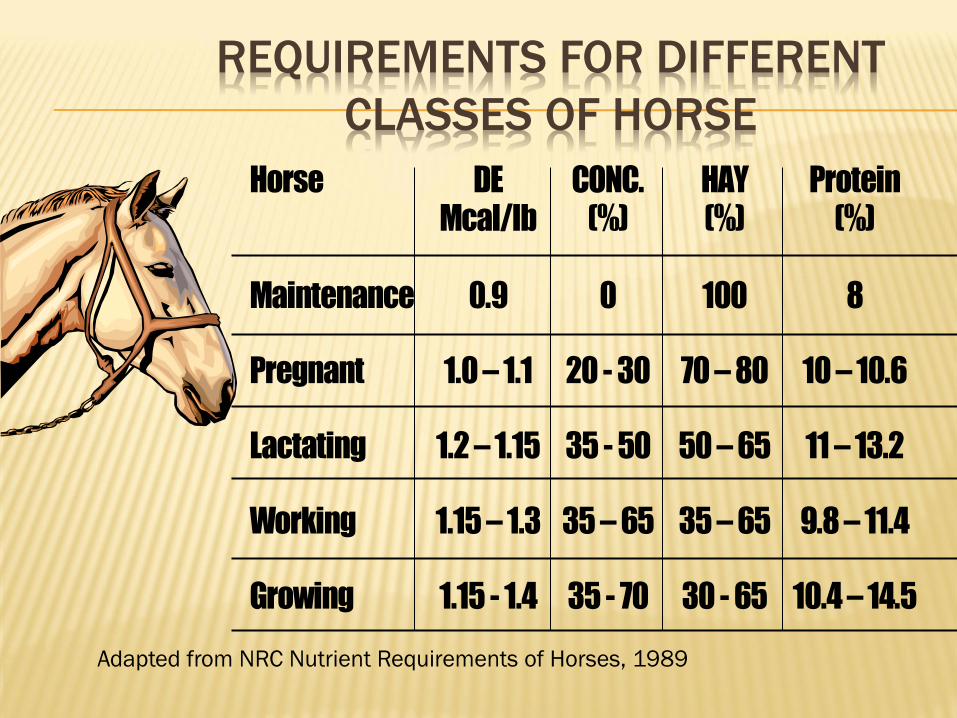
REQUIREMENTS FOR DIFFERENT
CLASSES OF HORSE
Horse DE
Mcal/lb
CONC.
(%)
HAY
(%)
Protein
(%)
Maintenance 0.9 0 100 8
Pregnant 1.0 – 1.1 20 - 30 70 – 80 10 – 10.6
Lactating 1.2 – 1.15 35 - 50 50 – 65 11 – 13.2
Working 1.15 – 1.3 35 – 65 35 – 65 9.8 – 11.4
Growing 1.15 - 1.4 35 - 70 30 - 65 10.4 – 14.5
Adapted from NRC Nutrient Requirements of Horses, 1989

HORSE HAY
Sugar Content in Feed &
Forage Affects Horses' Health
CSU 01818
No “Low Carb” hay
Low sugar hay
<10% sugars as WSC
(Water Soluble Carbohydrates)
Potassium (K)
Watch fertilizer practices
Species of grasses and
legumes
All are okay
Feed appropriately
Nutrients to match activity
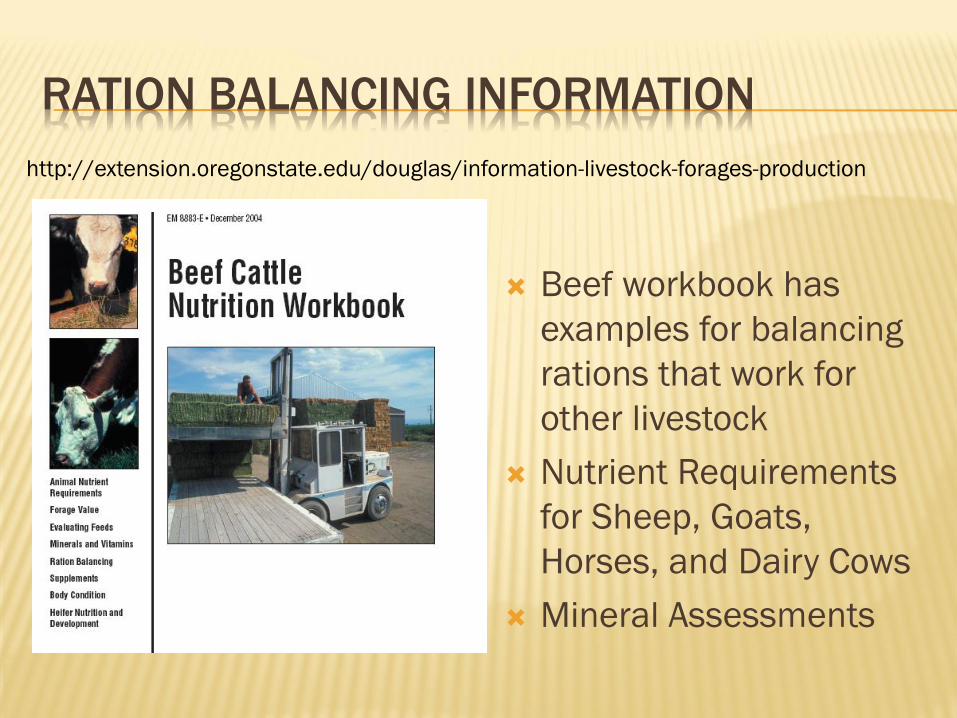
RATION BALANCING INFORMATION
http://extension.oregonstate.edu/douglas/information-livestock-forages-production
Beef workbook has
examples for balancing
rations that work for
other livestock
Nutrient Requirements
for Sheep, Goats,
Horses, and Dairy Cows
Mineral Assessments
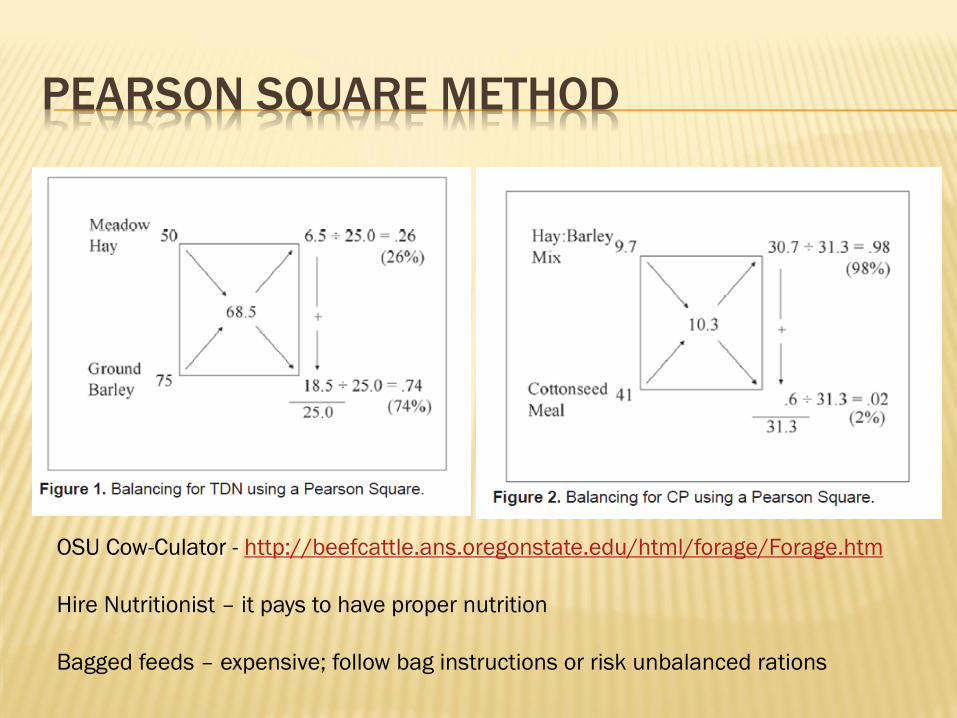
PEARSON SQUARE METHOD
OSU Cow-Culator - http://beefcattle.ans.oregonstate.edu/html/forage/Forage.htm
Hire Nutritionist – it pays to have proper nutrition
Bagged feeds – expensive; follow bag instructions or risk unbalanced rations
NEXT STEPS…
TAKE AN ANIMAL NUTRITION CLASS