User’s Guide - Electric Power Group...Organizations (RTOs), Reliability Coordinators, and...
83
User’s Guide Release 7 - CONFIDENTIAL Date: Oct 1 st , 2012 Prepared by: for C onsortium for E lectric R eliability T echnology Solutions NERC Resource Adequacy Application Release 7.0 ©Electric Power Group, LLC. All rights reserved.
Transcript of User’s Guide - Electric Power Group...Organizations (RTOs), Reliability Coordinators, and...

User’s Guide
Release 7 - CONFIDENTIAL
Date: Oct 1st, 2012
Prepared by:
for
Consortium for
Electric
Reliability
Technology
Solutions
NERC Resource Adequacy Application
Release 7.0
©Electric Power Group, LLC. All rights reserved.

CONFIDENTIAL ©Electric Power Group, LLC. All rights reserved. No portion of this report may be reproduced in any form without prior written consent.
Table of Contents
1. Introduction .................................................................................................................. 1
2. Wide-Area Resource Adequacy Real-Time Monitoring Overview ................................ 2
2.1. Wide-Area Grid Performance Monitoring and Prediction Platform (Grid-3P) Overview ........................................................................................................................... 2
2.2. Wide-Area Resource Adequacy Real-Time Monitoring Functional Overview ....... 4
2.3. Wide-Area Resource Adequacy Real-Time Monitoring Visualization Overview .... 5
3. Wide-Area Resource Adequacy Real-Time Monitoring Visualization and Navigation . 8
3.1. Grid-3P Visualization Infrastructure ....................................................................... 8
3.2. Display Overview – Keyboard & Mouse Functions ................................................ 9
3.3. Jurisdictional Tabs and Dynamic Window ............................................................ 13
3.4. Set Jurisdiction Focus and Display Options .......................................................... 16
Set Jurisdictional Boundary Focus ............................................................................... 16
User Enterable Options ............................................................................................... 18
4. Wide-Area Resource Adequacy Real-Time Monitoring System ................................. 21
4.1. Current Data Monitoring Visuals .......................................................................... 21
Interconnection Map and Data Display ...................................................................... 21
Reliability Regions Map and Data Display ................................................................... 22
Balancing Authority Map and Data Display ................................................................ 22
ISO-RTO Jurisdiction Data Display ............................................................................... 24
4.2. Last 30-Minute of 1 Minute ACE/Freq Bar Chart ................................................. 25
ACE/Freq Bar Chart ..................................................................................................... 27
Balancing Authority Image Chart ................................................................................ 28
Balancing Authority Line/Cave Chart .......................................................................... 29
4.3. Last Hour of 10-Minute Avg ACE/Frequency........................................................ 31
4.4. Last 10-Min of 1-Min Resolution ACE/Frequency ................................................ 32
4.5. Last 24-Hours and Last 30-Days Interconnection Epsilon .................................... 34
5. Analysis and Assessment Functions ............................................................................ 37
5.1. Last 30-Minutes CPS1/CPS2/BAAL Monitoring .................................................... 37
5.2. Last 24-Hours CPS1/CPS2/BAAL Tracking ............................................................. 40
5.3. Last 30-Days CPS1/CPS2/BAAL Tracking .............................................................. 43
6. Data Replay Functions ................................................................................................. 46
7. Situational Awareness Functions ................................................................................ 47

CONFIDENTIAL ©Electric Power Group, LLC. All rights reserved. No portion of this report may be reproduced in any form without prior written consent.
7.1. Detection and Alarm Dashboard .......................................................................... 48
7.2. Adequacy Trace – Trend Dashboard .................................................................... 52
7.3. Navigation Overview for Situational Awareness .................................................. 54
8. Data Collection and Reporting Functions ................................................................... 56
8.1. Data Collection Tool (Interactive Data Collection) ............................................... 56
8.2. Data Unavailability Report Generator .................................................................. 58
Sample Report ............................................................................................................. 60
9. Resource Adequacy Report Generator ....................................................................... 62
9.1. Alarming and Monitoring Reports ........................................................................ 62
9.2. Analysis and Assessment Reports ........................................................................ 65
9.3. Situational Awareness Reports............................................................................. 66
9.4. Intelligent Alarm Report ....................................................................................... 67
9.5. ACE-Frequency Correlations Report ..................................................................... 68
9.6. NERC Data Quality Report .................................................................................... 70
9.7. Time Error Correction (TEC) Report ..................................................................... 72
10. Resource Adequacy Logon and Preferences ............................................................ 73
11. Wide-Area Resource Adequacy Real-Time Monitoring Help ................................... 75
Appendix A: Terms and Definitions ..................................................................................... 76

CONFIDENTIAL ©Electric Power Group, LLC. All rights reserved. No portion of this report may be reproduced in any form without prior written consent.
List of Figures
Figure 1: Wide-Area Real Time Monitoring Center ............................................................... 2
Figure 2: Grid-3P Applications for Reliability Coordinators and Balancing Authority Dispatchers ............................................................................................................................ 3
Figure 3: Schematic Illustration of Grid-3P Application to NERC Resource Adequacy .......... 4
Figure 4: Wide-Area Real-Time Resource Adequacy Monitoring System Functional Overview ................................................................................................................................ 5
Figure 5: Reliability Functional Levels and Visualization Hierarchy ...................................... 6
Figure 6: CERTS Grid-3P Integrated Visualization Model ...................................................... 6
Figure 7: Desktop Icon used to start Wide-Area Real-Time Resource Adequacy Monitoring System ................................................................................................................................... 7
Figure 8: Home Web Page ..................................................................................................... 7
Figure 9: The default screen is the Reliability Coordinator screen ........................................ 8
Figure 10: ACE Color Code ..................................................................................................... 9
Figure 11: Mouse Control ...................................................................................................... 9
Figure 12: Direct Buttons ..................................................................................................... 11
Figure 13: View Angle Window ........................................................................................... 11
Figure 14: Date and Time .................................................................................................... 11
Figure 15: Date Selection Window Function ....................................................................... 11
Figure 16: Date/Time Calendar ........................................................................................... 12
Figure 17: Date/Time Selection Function ............................................................................ 12
Figure 18: Auto Refresh Checked ........................................................................................ 12
Figure 19: Auto Refresh Unchecked .................................................................................... 12
Figure 20: Reliability Coordinator (Default Display)............................................................ 13
Figure 21: Overview tab data .............................................................................................. 14
Figure 22: Worst/Best BA’s tab data ................................................................................... 14
Figure 23: Interconnection frequency and ACE quality tab data ........................................ 15
Figure 24: Reliability Coordinator Wide Area Data tab ...................................................... 15
Figure 25: Balancing Authority (Inner Circle) tab data ....................................................... 16
Figure 26: Pop Up Text Box – Set Jurisdictional Boundary Focus ........................................ 16
Figure 27: Interconnection “Set Boundary Focus” .............................................................. 17
Figure 28: Interconnection with Jurisdictional Boundary Focus Set .................................... 17
Figure 29: Set Jurisdictional Boundary Focus Reset ............................................................ 18
Figure 30: RMB Functions ................................................................................................... 18
Figure 31: User Enterable Options ...................................................................................... 19
Figure 32: 3D Map of the Reliability Regions ...................................................................... 20
Figure 33: Interconnection Map .......................................................................................... 21
Figure 34: Data displayed with “Interconnections Data” selected ..................................... 21
Figure 35: Reliability Region Map ....................................................................................... 22
Figure 36: Data displayed in the window with “Reliability Regions Data” selected ........... 22
Figure 37: Balancing Authority Map ................................................................................... 23
Figure 38: Data displayed with “Balancing Authority Data” selected ................................ 23
Figure 39: ISO-RTO Map ...................................................................................................... 24
Figure 40: Data displayed in the window with “ISO-RTO Data” selected ........................... 24
Figure 41: RMB option to select “Last 30-Min of 1-Min ACE/Freq Bar-Chart” display ....... 25
Figure 42: Last 30-Min of 1-Min ACE/Freq Bar-Chart 3-panel display ................................ 25

CONFIDENTIAL ©Electric Power Group, LLC. All rights reserved. No portion of this report may be reproduced in any form without prior written consent.
Figure 43: 3-Panel view RMB menu .................................................................................... 26
Figure 44: Time Range options ............................................................................................ 26
Figure 45: ACE/Freq Bar Chart ............................................................................................ 27
Figure 46: Bar-Chart display options ................................................................................... 27
Figure 47: BA ACE Frequency image chart .......................................................................... 28
Figure 48: BA ACE Freq display user options ....................................................................... 28
Figure 49: Tracking_1 Image ............................................................................................... 29
Figure 50: 30-Minute ACE/Frequency Plot (Panel 3) ........................................................... 29
Figure 51: 3-Panel Display Options (Panel 3) ...................................................................... 30
Figure 52: Panel 3 Cave_1 Prediction Display ..................................................................... 30
Figure 53: RMB option to select “Last Hour of 10-Minute Avg ACE/Frequency” display ... 31
Figure 54: Last Hour of 10-Minute Avg ACE/Frequency 3-panel display ............................ 31
Figure 55: Last 10-min of 1-min resolution ACE/Freq menu ............................................... 32
Figure 56: 10-Min of 1-Min resolution ACE/Freq three panel display................................. 32
Figure 57: Scatter Plot Grouping Options ........................................................................... 33
Figure 58: Interconnection Epsilon Frequency Menu .......................................................... 34
Figure 59: Interconnection Epsilon Frequency 3-Panel Display .......................................... 34
Figure 60: Interconnection Map Color Code ....................................................................... 35
Figure 61: Interconnection Epsilon Frequency Panel-2 Daily Image ................................... 35
Figure 62: Interconnection Epsilon Frequency Panel-3 Daily Plot ....................................... 36
Figure 63: Analysis and Assessment Functions Menu ......................................................... 37
Figure 64: Last 30-Minutes CPS1/CPS2/BAAL Monitoring 3-Panel Display ........................ 38
Figure 65: Color code threshold legend for the Panel-1 Map and Panel-2 Image Displays 38
Figure 66: Last 30-Minute CPS1 “Tracking_1” Image Display ............................................ 39
Figure 67: Last 30-Minute CPS1 “Tracking_2” Image Display ............................................ 39
Figure 68: Last 30-Minute CPS1 Bar-Chart Display for any BA correlated with Frequency 40
Figure 69: Last 24-Hours CPS1/CPS2/BAAL Tracking 3-Panel Display ................................ 40
Figure 70: Last 24-Hours CPS2/BAAL Summary Statistics ................................................... 41
Figure 71: Last 24-Hours CPS1/CPS2/BAAL Performance Circular Plot............................... 42
Figure 72: Last 30-Days CPS1/CPS2/BAAL Tracking 3-Panel Display .................................. 43
Figure 73: Last 30-Days CPS2/BAAL Summary Statistics .................................................... 44
Figure 74: Last 30-Days CPS1/CPS2/BAAL Performance Circular Plot ................................ 44
Figure 75: Replay of Last 24-Hours Data ............................................................................. 46
Figure 76: Replay Controls Toolbox ..................................................................................... 46
Figure 77: Resources Adequacy Application Visualization Overview .................................. 47
Figure 78: Situational Awareness Functions Menu ............................................................. 48
Figure 79: Situational Awareness Alarm Types and Definitions ......................................... 49
Figure 80: Detection and Alarm Dashboard Display for Interconnections.......................... 49
Figure 81: Detection and Alarm Dashboard Display for Reliability Regions ....................... 50
Figure 82: Detection and Alarm Dashboard Display for Reliability Coordinators ............... 51
Figure 83: Detection and Alarm Dashboard Right Mouse Button User Menu .................... 51
Figure 84: Adequacy Trace – Trend Dashboard 4-Panel Display ........................................ 52
Figure 85: RMB Menu Options for Alarm and Trace-Trend Dashboards ............................ 53
Figure 86: Situational Awareness Display and Configuration Options ............................... 54
Figure 87: Situational Awareness Navigation Overview ..................................................... 55
Figure 88: Data Collection Tool Access Button .................................................................... 56
Figure 89: Data Collection Tool Options .............................................................................. 56

CONFIDENTIAL ©Electric Power Group, LLC. All rights reserved. No portion of this report may be reproduced in any form without prior written consent.
Figure 90: Data Collection Tool Parameter Dialog .............................................................. 57
Figure 91: CERTS Data Collection Tool – Scatter Chart ....................................................... 58
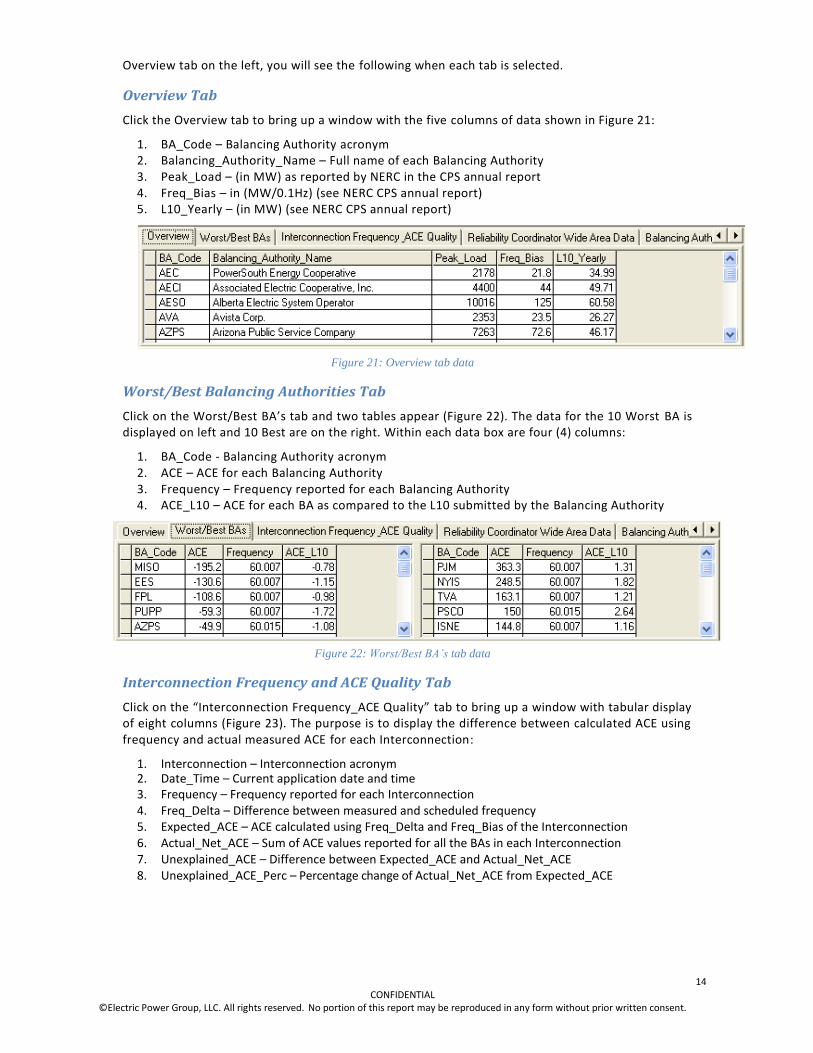
Figure 92: Data Unavailability Report Generator Dialog .................................................... 59
Figure 93: Report Type Rolling Window Time Range .......................................................... 59
Figure 94: Sample Data Unavailability Monthly Report Bar-Chart ..................................... 60
Figure 95: Sample Data Unavailability Summation Report Bar-Chart ................................ 60
Figure 96: Sample Hourly Data Unavailability Report ........................................................ 61
Figure 97: Sample Monthly Data Unavailability Report ..................................................... 61
Figure 98: Resource Adequacy Report Generator User Options ......................................... 62
Figure 99: Last Minute Data Quality and Performance Report .......................................... 63
Figure 100: Last Hour Frequency Sources Data Quality Report .......................................... 64
Figure 101: Last Hour ACE Data Quality/Unavailability Report .......................................... 64
Figure 102: Last Hour BA-ACE vs. Interconnection Frequency Comparisons Report .......... 64
Figure 103: Analysis and Assessment Reports User Options .............................................. 65
Figure 104: Last Hour BA ACE vs. BAAL Comparisons Report ............................................. 65
Figure 105: Situational Awareness Reports User Options .................................................. 66
Figure 106: Last 90 Days Situational Awareness Reports ................................................... 66
Figure 107: Intelligent Alarm Reports User Options ........................................................... 67
Figure 108: Event ACE/Frequency Bar/Line Chart ............................................................... 67
Figure 109: ACE-Frequency Correlations Report User Options ........................................... 68
Figure 110: ACE-Frequency Correlations Report – Top 10 BAs ........................................... 69
Figure 111: ACE-Frequency Correlations Report – List of Alarms and Settings .................. 69
Figure 112: ACE-Frequency Correlations Report – All BAs ACE Frequency Correlation ...... 70
Figure 113: NERC Data Quality Report User Options .......................................................... 70
Figure 114: Last 30 Days NERC ACE-Frequency Data Quality Performance Report ........... 71
Figure 115: Time Error Correction (TEC) Report User Options ............................................ 72
Figure 116: Last 30 Days’ Time Error Correction (TEC) Report ............................................ 72
Figure 117: Database Connectivity and Logon Information Menu ..................................... 73
Figure 118: Frequency Calculation and Threshold Settings ................................................ 73
Figure 119: BAAL Alarm Threshold Settings ........................................................................ 74
Figure 120: Help File Settings .............................................................................................. 74
Figure 121: Resource Adequacy Application Online Interactive Help page ........................ 75

1 CONFIDENTIAL
©Electric Power Group, LLC. All rights reserved. No portion of this report may be reproduced in any form without prior written consent.
1. Introduction
The North American Electric Reliability Corporation (NERC) is in the process of developing mandatory compliance standards. An important aspect of a standard is the associated performance metrics that are employed to determine if the appropriate entities are in compliance. The Consortium for Electric Reliability Technology Solutions (CERTS) has been working with NERC and other organizations to research, develop, and disseminate new methods, tools and technologies to protect and enhance the reliability of the U.S. electric power system under the emerging competitive electricity market structures. In particular, CERTS has developed and demonstrated the Grid Real-Time Performance Monitoring and Prediction Platform (Grid-3P
©); which is a platform to develop applications for monitoring grid reliability and
market performance in real time. Grid 3P complements and integrates with existing SCADA systems and utilizes real time data engines and graphic-geographic visualization tools to develop reliability applications to assist operating authorities, e.g., Independent System Operators (ISOs), Regional Transmission Organizations (RTOs), Reliability Coordinators, and Balancing Authority Dispatchers in their management of grid reliability.
The Resource Adequacy Real-Time Monitoring System applications, using CERTS’ Grid-3P, will enable NERC Reliability Coordinators to monitor ACE and Frequency performance and compliance with performance operational guides within their jurisdictions. It will also allow NERC staff and subcommittees to analyze and assess control data to improve reliability performance. The Wide-Area Resource Adequacy Real-Time Monitoring System translates raw operational control data into meaningful operations performance information for end users. Should an abnormal interconnection frequency occur, a Real-Time Interconnection Abnormal Frequency Notification (AFN) is automatically issued via email or beeper describing the date, time, and magnitude of the frequency abnormality to specific Operational Authorities, NERC Resource Subcommittee members, and NERC Staff. The notification recipients using the Wide-Area Resource Adequacy Monitoring System functionality can quickly assess the abnormality’s root cause by drilling down from wide-area to local-area visualization displays that include appropriate information and analysis graphs to easily identify and assess those balancing authority(s) out of compliance and potential originators of the notified interconnection frequency abnormality.
This “User’s Guide” has been developed for the Wide-Area Resource Adequacy Real-Time Monitoring System. The main sections include the following:
Wide-Area Resource Adequacy Real-Time Monitoring Overview: Provides an overview of Grid-3P as applied to the five major functional components of the Wide-Area Resource Adequacy Real-Time Monitoring System, and the geographic-graphic visualization model used to develop the user interface.
Wide-Area Resource Adequacy Real-Time Monitoring Visualization and Navigation: Describes the Grid-3P visualization infrastructure including map and data display functions.
Wide-Area Resource Adequacy Real-Time Monitoring System – Monitoring Functions: Details various functions allowing users to drill down to the desired level of data and graphic displays, including local-visualization options covering from current time to 1-hour.
Wide-Area Resource Adequacy Real-Time Monitoring System – Analysis and Assessment Functions: Describes functions to access data and graphic displays for the 30-Minutes, 24-Hour and 30-Days CPS1/CPS2/BAAL monitoring and tracking.
Wide-Area Resource Adequacy Real-Time Monitoring System – Situational Awareness Functions: Describes Situational Awareness functions and the graphic displays.
Wide-Area Resource Adequacy Complementary Functions: Characterizes Abnormal Frequency Notification (AFN), Interactive Data Collection (IDC), and Unavailable Data Reporter (UDR).

2 CONFIDENTIAL
©Electric Power Group, LLC. All rights reserved. No portion of this report may be reproduced in any form without prior written consent.
2. Wide-Area Resource Adequacy Real-Time Monitoring Overview
2.1. Wide-Area Grid Performance Monitoring and Prediction Platform (Grid-3P) Overview
The vertically integrated business model historically used by utilities has evolved to a segmented market dispersed among separate entities. From a control-monitoring perspective, layers 1, 2, and 3 from Figure-1 below shows the traditional control-monitoring levels. Layer 4 is surfacing as an expansion of those traditional layers responding to the need to monitor the system in a wide- area basis as the creation of electricity markets is demanding. The right side from Figure-1 shows the operational tools for the different layers including the new layer 4. The Resource Adequacy Real Time Monitoring tool is considered part of the group label as Wide-Area Load-Generation Balance Monitoring. The Grid Real-Time Performance Monitoring and Prediction Platform (Grid- 3P) has been developed by CERTS to serve as the base for the development of wide-area reliability applications for real-time monitoring and prediction for the reliability performance of Balancing Authorities, generation, grid, markets, and security. Balancing Authority ACE and Interconnection frequency and interchange data on top of the Grid-3P provide a common tool to be used by NERC Reliability Coordinators, Balancing Authority Dispatchers, and Transmission Dispatchers. The bottom of Figure 1 also shows that reliability applications developed using Grid-3P serve as complement for traditional SCADA/EMS systems and for the periodic reporting requested by NERC for post-performance assessment.
Figure 1: Wide-Area Real Time Monitoring Center
Figure 2 shows an expansion of the Grid-3P block from Figure 1 and includes the major reliability applications for real-time reliability monitoring for NERC Reliability Coordinators and Balancing Authority Dispatchers. The top part from Figure 2 shows the applications targeted for Reliability Coordinators: ACE-Frequency, AIE and Control Performance Standards (CPS). The bottom part from Figure 2 shows the applications targeted to Balancing Authority Dispatchers: performance compliance of balancing authorities and suppliers to AGC, FRR, and Ancillary Services markets. NERC

3 CONFIDENTIAL
©Electric Power Group, LLC. All rights reserved. No portion of this report may be reproduced in any form without prior written consent.
Reliability Coordinators monitor several requirements, including ACE-Frequency, to maintain and enhance the reliability of their jurisdictions. The Resource Adequacy Monitoring System, shown in the upper applications box, provides applications for each Coordinator within each of their reliability regions. Reliability Coordinators utilize those applications to monitor performance and compliance within their regions and notify the appropriate Balancing Authority Dispatchers as abnormalities occur. Balancing Authority Dispatchers pinpoint problem sources by monitoring the response performance of their balancing authorities and suppliers to the Automatic Generation Control (AGC) Monitoring System, Frequency Response Resources, and Ancillary Services.
Figure 2: Grid-3P Applications for Reliability Coordinators and Balancing Authority Dispatchers
Figure 3 illustrates the architecture of the Wide-Area Resource Adequacy Real-Time Monitoring System application using CERTS’ Grid-3P. Resource Adequacy receives ACE and frequency data from the nation’s Balancing Authorities (Data Collection), calculates performance parameters for each reliability jurisdiction, and compares those performance parameters to NERC reliability compliance guides. The results of these comparisons are then displayed graphically (Visualization) on a geographical map (Geography) for use by each of the Reliability Organizations from each of the layers, depicted in the lower, right pyramid. The tiers of the pyramid comprise the Balancing Authorities, Reliability Coordinators, Reliability Transmission Organizations, Reliability Regions, and Interconnections.

4 CONFIDENTIAL
©Electric Power Group, LLC. All rights reserved. No portion of this report may be reproduced in any form without prior written consent.
Figure 3: Schematic Illustration of Grid-3P Application to NERC Resource Adequacy
2.2. Wide-Area Resource Adequacy Real-Time Monitoring Functional Overview
Figure 4 shows the five major functional components of the NERC Wide-Area Resource Adequacy Real-Time Monitoring System: Local Monitoring, Global Monitoring, Abnormal Frequency Notification, Interactive Data Collection, and Unavailable Data Reporting. The following are descriptions of each of the components.
Local Monitoring Geographic-Graphic Visualization
Most of the Resource Adequacy visualization is geographic-graphic oriented and covers different time windows from current time to 30-days. The local-visualization option covers from current time to 1-hour, and it offers to end users three different views of Balancing Authority ACE and Interconnection frequency data displayable in the Grid-3P three-panel window visualization.
Global Monitoring Geographic-Graphic Visualization This option uses the Epsilon performance parameter as an indicator of the frequency performance for each of the interconnections. It shows the performance parameter for two time windows, 6-hours and 30-days. It also uses the Grid-3P three-panel window visualization.
Abnormal Frequency Notification (AFN) The Real Time Abnormal Frequency Notification (AFN) is a real-time monitoring component of the Resource Adequacy Monitoring System. The AFN is designed for real-time monitoring of abnormal interconnection frequencies. It automatically issue emails to specific NERC Resources Subcommittee members and NERC Staff when predefined abnormal frequency performance criteria are met. Email recipients can use the Wide-Area Resource Adequacy Monitoring System capabilities to assess root causes of the abnormal frequencies when notified.
The input data to the AFN is provided by Balancing Authorities to NERC over a secure connection using NERCnet, XML, and SOAP technologies.

5 CONFIDENTIAL
©Electric Power Group, LLC. All rights reserved. No portion of this report may be reproduced in any form without prior written consent.
Figure 4: Wide-Area Real-Time Resource Adequacy Monitoring System Functional Overview
Interactive Data Collection (IDC) Function
NERC Subcommittees, NERC Staff, and Operating Engineers can interactively define the historical window of time and the specific control-performance parameter they need to analyze and assess frequent disturbances via the IDC functionality. Once data is collected from the NERC data server, the users can use equivalent reliability coordinator visualization and/or save the data in comma-delimited files.
Unavailable Data Report (UDR) Function
UDR offers the capability to interactively identify and report Balancing Authority data transfer performance. Users can select hourly, daily, weekly, and monthly reports and select the specific data they want to assess for availability.
2.3. Wide-Area Resource Adequacy Real-Time Monitoring Visualization Overview
It has been demonstrated by Dispatchers that the more effective operational displays are those that follow a hierarchical approach to present operational data for current time and other key windows of time. The Grid-3P visualization model encompasses displays at high and low levels to meet the varying needs of different reliability application users. Thus, monitoring applications are developed for wide-area and local area users. The hierarchal structure in Figure 5 shows that Reliability Coordinators need to have a wide-area view of their jurisdictions for reliability compliance monitoring. ISOs and RTOs need the ability to assess performance and trends of their Balancing Authorities. In turn, Balancing Authorities need local area information to pinpoint specific supplier’s reliability performance issues. The Resource Adequacy tool allows Reliability Coordinators to monitor ACE-Frequency performance and compliance for each of their jurisdictions using wide-area graphic-geographic visualization.

6 CONFIDENTIAL
©Electric Power Group, LLC. All rights reserved. No portion of this report may be reproduced in any form without prior written consent.
Figure 5: Reliability Functional Levels and Visualization Hierarchy
The definition and design of the Resource Adequacy graphic-geographic visuals for each of the visualization layers shown in Figure 5 closely followed the Grid-3P data collection, computational, and visualization models shown in the first three vertical segments in Figure 6.
For the NERC Resource Adequacy Real-Time Monitoring System, about 102 Balancing Authorities transmit ACE and frequency data to a data server located at NERC (data collection). Data is processed and performance parameters are calculated in the Grid-3P computational engines (computational model). The design and deployment of each of the displays follows the three steps shown in the display model section on Figure 6, human factors, user interaction, and composition.
Figure 6: CERTS Grid-3P Integrated Visualization Model

7 CONFIDENTIAL
©Electric Power Group, LLC. All rights reserved. No portion of this report may be reproduced in any form without prior written consent.
To start the Wide-Area Real-Time Resource Adequacy Monitoring System from a Desktop, click on the icon shown in Figure 7.
Figure 7: Desktop Icon used to start Wide-Area Real-Time Resource Adequacy Monitoring System
Home Page
After clicking on the “Grid-3P Resource Adequacy” icon, the Grid-3P program Home Web Page is the first screen (default) to be displayed (Figure 8).
Figure 8: Home Web Page
The background for the “Home Page” is the Reliability Coordinator graphic for all the Interconnections. Entering valid User Name and Password and clicking “Login” button will take the user to the “Reliability Coordinator” default display (Figure 9). The time zone displayed is the default time zone during time of the software installation and can be changed during login.

8 CONFIDENTIAL
©Electric Power Group, LLC. All rights reserved. No portion of this report may be reproduced in any form without prior written consent.
3. Wide-Area Resource Adequacy Real-Time Monitoring Visualization and Navigation
3.1. Grid-3P Visualization Infrastructure
Logging in to the application will give the user the Default Monitoring Display, as seen below in Figure 9.
Figure 9: The default screen is the Reliability Coordinator screen
From this panel the user has the ability to move the screen through the use of the “Screen Controls” (circled, lower right), zoom in or out as needed (circled, upper right) or choose one of the Jurisdiction options. The default map when opening the monitoring system is the Reliability Coordinator jurisdiction (circled, upper left). The Date and Time and Auto Refresh/static option is circled in the lower left corner. The “Reliability Coordinator Wide Area Data” tab is circled in the center of bottom panel.
In this jurisdiction map the 16 Reliability Coordinator Jurisdictions are drawn. The circles (red/blue pies) within each jurisdiction shown represent the BA within the Reliability Coordinator areas of responsibility with the worst/best ACE. The data for the Reliability Coordinator’s map is presented at the bottom of the main panel. The date and time are shown to the left of the data tables.
Main Panel
Zoom Buttons
Screen Controls
Default Screen

9 CONFIDENTIAL
©Electric Power Group, LLC. All rights reserved. No portion of this report may be reproduced in any form without prior written consent.
Balancing Authority ACE and ACE/L10 Map Color Codes Color is used to designate the ACE for each Balancing Authority. As the Balancing Authority ACE changes, the color and its associated range of values change. The colors and associated ACE numerical values are as shown below in Figure 10.
Figure 10: ACE Color Code
3.2. Display Overview – Keyboard & Mouse Functions
Zoom Function
The Zoom Buttons located at top right of display allows the user to zoom in or out.
Zoom In
By clicking the “Zoom In” button the diagram is enlarged for better observation. This button can be clicked up to four times with each click enlarging the image.
Zoom Out
After zoom in, the user can click “Zoom Out” for a wider angle views.
Reset (1:1)
Allows the operator to return the diagram to its default size.
To manipulate the panel on the screen, screen controls are provided. These controls are located on the lower right side of the screen.
Mouse Functions
Navigating with the Mouse – You can use the mouse to perform a variety of useful functions in viewing and working with the graphical display. The mouse and view controls are located in the lower right hand of the screen (See Figure 11).
Figure 11: Mouse Control

10 CONFIDENTIAL
©Electric Power Group, LLC. All rights reserved. No portion of this report may be reproduced in any form without prior written consent.
The following are the features and how to launch these functions:
Function Mouse Control Icon What it Does Selection Arrow
- Click the selection arrow; move the cursor to the viewing panel, click the left mouse on the desired location on any of the displays.
Needs to be selected (clicked) prior to selecting the desired area to be viewed.
Reposition
- Click the crossed arrows, move the cursor to the viewing panel, click the left mouse and drag the object to the desired location in the panel.
Allows the user to reposition or center objects being displayed in the panel.
Zoom In/Out
- Click the magnifying glass the image. With the mouse image hold down the left
button and slide the mouse
or to the left to reduce the size of the image or move the mouse up or to the right to increase its size
Zoom In – Enlarge the details of a selected area
Zoom Out – Provides an aerial view for a selected diagram.
Rotation
- Click on the open circle icon, move the cursor to the panel, click and hold the left mouse and move the mouse in the desired direction.
Rotate the axis of a selected panel.
Keyboard Control
This button is only used in the 3D format.
Click on the keyboard icon. To
Rotate the diagram; depress the <Alt> key. Place the cursor on the panel and depress the left mouse button. The diagram can be rotated as desired.
To Select an object on the diagram depress the <Ctrl> key. Then select one or move area by using the left mouse button and clicking.
To Zoom In/Out depress the <Shift> key. With the mouse on the panel click the left mouse button. Move the mouse up or to the right to Zoom In; move the mouse down or to the left to Zoom out.
Moves diagram within panel to desired angle for viewing
Selects areas to be viewed
Zooms In/Out as needed for better monitoring

11 CONFIDENTIAL
©Electric Power Group, LLC. All rights reserved. No portion of this report may be reproduced in any form without prior written consent.
The displayed image can be rotated by selecting one of the direction buttons shown in Figure 12. This control was implemented specifically to rotate the 3-D diagrams.
Figure 12: Direct Buttons
Depressing the:
North “N” button inverts the diagram
East “E” button rotates the diagram 90 degrees clockwise
South “S” button returns the diagram to its default position
West “W” button rotates the diagram counterclockwise
The “+” button will reset the diagram to its default position, same as the 1:1 “Zoom Button” (Reset) in the upper right corner
The View Angle allows the position of the diagram to be changed (see Figure 13). A “0” degree angle gives a view of the panel on edge; whereas “90” degree is a flat view. The default angle is 55 degrees. The view Angle can be changed in one of two ways. First place the mouse arrow adjacent to the number and click so the cursor appears. While holding down the left mouse button highlight the number or number(s) to be changed. The second method is to click on the “Reset Keyboard Control,” then use the arrow keys on the computer to move the cursor to the “View Angle” box and delete the numbers to be changed and key in the new numbers.
Figure 13: View Angle Window
Date and Time
The date and time of the data being displayed is presented to the left of the text box, as shown in Figure 14.
Figure 14: Date and Time
To view historical data, change the date and time by clicking in the box presenting the date and time. The Date/Time text box will then appear (Figure 15).
Figure 15: Date Selection Window Function
Click on the down arrow and a calendar for the month shown will appear (Figure 16).

12 CONFIDENTIAL
©Electric Power Group, LLC. All rights reserved. No portion of this report may be reproduced in any form without prior written consent.
Figure 16: Date/Time Calendar
To change the date, place the cursor over the desired date and click. The Date will change to the date desired in the text box. Should a different month be desired the arrows at the top of the calendar will move the calendar month by month. The left arrow moves the calendar back; the right arrow moves it ahead. Today’s date is shown at the bottom of the calendar.
The time can be changed by clicking either the up or down arrow to the right of the time as shown in Figure 17.
Figure 17: Date/Time Selection Function
To change the hour, minute, seconds or AM/PM click on the number or alpha notation to be changed and it will be highlighted. Then clicking on the arrows, either up or down, will change the highlighted number. The default value is the hour number. If there isn’t a highlighted value, then clicking the up/down arrow changes only the hour value. The AM/PM will toggle with the use of the arrows once highlighted. A second method of changing the time is to highlight the number to be changed and key in the desired number(s). The user has approximately two seconds to enter multiple numbers from the keyboard. That is, to enter “23” the two and three must be keyed within a two second window. To change the ante meridiem (AM) to Post meridiem (PM), highlight the area and key either an “A” for AM or “P” for PM.
Auto Refresh
Just below the date and time is the command that automatically refreshes the data and display. The display and data will automatically update every minute (Figure 18).
Figure 18: Auto Refresh Checked
To hold the data at the present time or chose a time in history, click the “Auto Refresh” box. The auto refresh function will be cancelled and the data is frozen. The check mark is removed from the Auto Refresh box, as seen in Figure 19.
Figure 19: Auto Refresh Unchecked
It must be remembered that this box must be checked to return to real time. Clicking on the vacant box as seen in Figure 19 the check mark will reappear in the check box. The data will now be

13 CONFIDENTIAL
©Electric Power Group, LLC. All rights reserved. No portion of this report may be reproduced in any form without prior written consent.
automatically updated every minute.
3.3. Jurisdictional Tabs and Dynamic Window
Jurisdictional Tabs
The Jurisdictional Tabs (top left side of screen) represent the Reliability Organizations Entry Points (Figure 20). The Five Jurisdictional Tabs that are used for Grid-3P are as follows:
1. Interconnections 2. Reliability Regions 3. Reliability Coordinator Wide Area (Default) 4. Balancing Authority 5. ISO-RTO
Text Dynamic Window
The Text Dynamic Window (bottom left center of screen in Figure 20) has five tabs. This text window shows the Balancing Authority data in text-tabular format, corresponding to the data on the graphic-geographic displays. The five tabs are:
1. Overview 2. Worst/Best BAs 3. Interconnection Frequency_ACE Quality 4. Reliability Coordinator Wide Area Data (This tab will change to the Jurisdiction selected) 5. Balancing Authority (Inner Circle)
The fourth tab (data tab) always matches the selected map display, which in Figure 20 is the Reliability Coordinator Map. When the Interconnection Map is displayed, the fourth label is “Interconnection Data.” This relationship between the map display and the dynamic window also holds for the Reliability Regions Map, the Balancing Authorities Map and the ISO RTO Map. The other four tabs are always the same.
The Reliability Coordinator Map, shown below in Figure 20, is displayed when the Reliability Coordinator tab (upper left, circled) is selected.
Figure 20: Reliability Coordinator (Default Display)
The data that appears in the dynamic window depends on the tab selected. Starting with the
14 CONFIDENTIAL
©Electric Power Group, LLC. All rights reserved. No portion of this report may be reproduced in any form without prior written consent.
Overview tab on the left, you will see the following when each tab is selected.
Overview Tab
Click the Overview tab to bring up a window with the five columns of data shown in Figure 21:
1. BA_Code – Balancing Authority acronym 2. Balancing_Authority_Name – Full name of each Balancing Authority 3. Peak_Load – (in MW) as reported by NERC in the CPS annual report 4. Freq_Bias – in (MW/0.1Hz) (see NERC CPS annual report) 5. L10_Yearly – (in MW) (see NERC CPS annual report)
Figure 21: Overview tab data
Worst/Best Balancing Authorities Tab
Click on the Worst/Best BA’s tab and two tables appear (Figure 22). The data for the 10 Worst BA is displayed on left and 10 Best are on the right. Within each data box are four (4) columns:
1. BA_Code - Balancing Authority acronym 2. ACE – ACE for each Balancing Authority 3. Frequency – Frequency reported for each Balancing Authority 4. ACE_L10 – ACE for each BA as compared to the L10 submitted by the Balancing Authority
Figure 22: Worst/Best BA’s tab data
Interconnection Frequency and ACE Quality Tab
Click on the “Interconnection Frequency_ACE Quality” tab to bring up a window with tabular display of eight columns (Figure 23). The purpose is to display the difference between calculated ACE using frequency and actual measured ACE for each Interconnection:
1. Interconnection – Interconnection acronym 2. Date_Time – Current application date and time 3. Frequency – Frequency reported for each Interconnection 4. Freq_Delta – Difference between measured and scheduled frequency 5. Expected_ACE – ACE calculated using Freq_Delta and Freq_Bias of the Interconnection 6. Actual_Net_ACE – Sum of ACE values reported for all the BAs in each Interconnection 7. Unexplained_ACE – Difference between Expected_ACE and Actual_Net_ACE 8. Unexplained_ACE_Perc – Percentage change of Actual_Net_ACE from Expected_ACE

15 CONFIDENTIAL
©Electric Power Group, LLC. All rights reserved. No portion of this report may be reproduced in any form without prior written consent.
Figure 23: Interconnection frequency and ACE quality tab data
Reliability Coordinator Jurisdiction Data
Clicking on the Reliability Coordinator Data tab brings up a data table showing the following five (5) columns (also, see Figure 24):
1. RC_Code – Reliability Coordinator Code 2. ACE - ACE for each Reliability Coordinator 3. Frequency – Frequency reported for each Reliability Coordinator 4. ACE_L10 - ACE for each Reliability Coordinator as compared to the L10 submitted by the individual
Balancing Authority 5. Quality - Number of minutes data has not been received from a Balancing Authority ACE data. The
BA color code for the quality of the data is as follows: a. Data received correctly – White background b. Data not received for one (1) to three (3) minutes the background is Yellow c. Data not received for three (3) to ten (10) minutes the background color is Red
6. Frequency_Quality – Number of minutes Frequency data has not been received from either the primary or secondary frequency source (See Appendix for list of sources)
Figure 24: Reliability Coordinator Wide Area Data tab
The Reliability Coordinator Jurisdiction is the default Jurisdiction that is shown in Figure 2 4. As explained above, should one of the other four (4) Jurisdictions be selected, then that selected Jurisdiction data would appear in the dynamic window.
Balancing Authority (Inner Circle) Clicking the Balancing Authority (Inner Circle) tab displays the data box shown in Figure 25. In this data box are the following twelve (12) columns:
1. IN_Code – An abbreviation for Interconnection 2. ISO_RTO_Code – Regional Transmission Organization 3. RR_Code – Reliability Region 4. RC_Code – Reliability Coordinator 5. BA_Code – Balancing Authority 6. ACE – Area Control Error 7. Frequency – Frequency reported for the Interconnection. 8. ACE_L10 - ACE for the BA compared to the L10 9. Quality – Number of minutes data has not been received from a BA 10. Longitude – Plotting coordinate 11. Latitude - Plotting coordinate 12. L10_Yearly – Compares actual ACE for the past 12 months to L10 submitted by the BA

16 CONFIDENTIAL
©Electric Power Group, LLC. All rights reserved. No portion of this report may be reproduced in any form without prior written consent.
Figure 25: Balancing Authority (Inner Circle) tab data
3.4. Set Jurisdiction Focus and Display Options Placing the mouse on the map and clicking the right mouse button will bring up the pop-up menu for the Function Text box as viewed in Figure 26.
Set Jurisdictional Boundary Focus
Figure 26: Pop Up Text Box – Set Jurisdictional Boundary Focus
This function can be used to focus users on a specific jurisdiction, disregarding the remaining areas. To exercise this function, click on the required jurisdiction tab. In Figure 27 the Interconnection has been selected and the West Interconnection has been highlighted (in Magenta color). By right clicking the mouse the Function Pop up Box appeared.

17 CONFIDENTIAL
©Electric Power Group, LLC. All rights reserved. No portion of this report may be reproduced in any form without prior written consent.
Figure 27: Interconnection “Set Boundary Focus”
By selecting “Set Jurisdictional Boundary Focus” the map will change to show only the highlighted area with the balancing authorities as seen in Figure 28.
Figure 28: Interconnection with Jurisdictional Boundary Focus Set
To return to the default view, right click and click on the check mark adjacent to “Set Jurisdictional Boundary Focus” to uncheck (Figure 29).

18 CONFIDENTIAL
©Electric Power Group, LLC. All rights reserved. No portion of this report may be reproduced in any form without prior written consent.
Figure 29: Set Jurisdictional Boundary Focus Reset
User Enterable Options
Selecting “User Enterable Options” (Figure 29) will give the user the options to configure the graphic and data displays (Figure 30).
Figure 30: RMB Functions

19 CONFIDENTIAL
©Electric Power Group, LLC. All rights reserved. No portion of this report may be reproduced in any form without prior written consent.
Figure 31: User Enterable Options
The “User Enterable Options” text box is the same for all five (5) “Jurisdiction Tabs.” There are four sections in this box: Frequency Calculation and Alarm Options, Circle Options, Jurisdictional Map Options, and ACE Components. These options can be changed by clicking the check boxes or radio buttons.
Frequency Calculation and Alarm Options
To view the frequency deviation alarm circles, use this option to set the minimum frequency deviation value to trigger the alarm.
Circle Options
Circle Options gives the user the four (4) choices shown in Figure 31. Each bubble on the Jurisdiction maps represents a Balancing Authority. The inner circle represents the BA’s current ACE/L10 ratio. Circle segments or outer circles indicate that the BA currently is one of the ten (10) worst performers. When a DCS event occurs a flashing light-blue band is present between the two circular areas. There is option to turn on/off the labels on circles.
Jurisdictional Map Options
To view the labels on the map the “Show Map Labels” box must be checked. Now the labels will appear on the map after “OK” is clicked. The default “Map Style” is 2D. To change the map to 3D, the 3D box must be checked and the “OK” button clicked. This will change the view of the map as seen in Figure 31. The other option is to turn the background of the map to white (it is black by default). This is to make the screenshots printer friendly.

20 CONFIDENTIAL
©Electric Power Group, LLC. All rights reserved. No portion of this report may be reproduced in any form without prior written consent.
Figure 32: 3D Map of the Reliability Regions
ACE Components
ACE Components option gives the user the option to display on the map either the “ACE Total” (default) or its individual components “ACE Freq. Bias” or “ACE Ties”. This option also allows setting of the threshold for the color scheme scale on the maps.

21 CONFIDENTIAL
©Electric Power Group, LLC. All rights reserved. No portion of this report may be reproduced in any form without prior written consent.
4. Wide-Area Resource Adequacy Real-Time Monitoring System
4.1. Current Data Monitoring Visuals
In addition to the Reliability Coordinator Jurisdiction Tab (Default) discussed in Section 3.3, current data can be viewed for Interconnections, Reliability Regions, Balancing Authorities, and ISO RTOs by selecting the corresponding Jurisdiction Tab on the top left side of the screen.
Interconnection Map and Data Display
When “Interconnection” (upper left tab) is selected, the Interconnection Map will be displayed (see Figure 33)
Figure 33: Interconnection Map
The Interconnections Map is divided into the four (4) NERC Interconnections: West, East, Quebec and Texas.
When the Interconnections Data tab is selected (top left of screen) the data from the map will be displayed in the following six columns (see Figure 34).
1. IN_Code – An abbreviation for the Interconnection 2. ACE – Area Control Error for the Interconnection 3. Frequency – Frequency reported for the Interconnection 4. ACE_L10 – ACE for each Interconnection as compared to the L10 submitted by the Balancing
Authorities 5. Quality - Number of minutes data has not been received from an Interconnection 6. Frequency_Quality - Number of minutes Frequency data has not been received from either
the primary or secondary frequency source.
Figure 34: Data displayed with “Interconnections Data” selected

22 CONFIDENTIAL
©Electric Power Group, LLC. All rights reserved. No portion of this report may be reproduced in any form without prior written consent.
Reliability Regions Map and Data Display
The Reliability Regions tab allows the user to view the map in a regional format. Figure 35 shows the eight (8) regions that are displayed when this tab is selected.
Figure 35: Reliability Region Map
With the Reliability Regions Data tab selected, (top left of screen) the data for the map will be displayed in the six columns defined below (see Figure 36).
1. RR_Code – Reliability Region Code 2. ACE – Area Control Error for the Reliability Region 3. Frequency – Frequency reported for the Reliability Region 4. ACE_L1 0 – ACE for each Reliability Region as compared to the L1 0 submitted by the
Balancing Authorities 5. Quality - Number of minutes data has not been received from a Reliability Region 6. Frequency_Quality - Number of minutes Frequency data has not been received from either
the primary or secondary frequency source
Figure 36: Data displayed in the window with “Reliability Regions Data” selected
Balancing Authority Map and Data Display
The Balancing Authority tab will give the user a map of all the NERC Balancing Authorities as seen in Figure 37.

23 CONFIDENTIAL
©Electric Power Group, LLC. All rights reserved. No portion of this report may be reproduced in any form without prior written consent.
Figure 37: Balancing Authority Map
Figure 38 shows the dynamic window that appears when the Balancing Authority jurisdiction is selected (top left of screen). The six columns of cells in the figure are:
1. BA_Code – Balancing Authority Code 2. ACE – Area Control Error 3. Frequency – Frequency reported for the Balancing Authority 4. ACE_L1 0 – ACE for each Balancing Authority as compared to the L1 0 submitted by the
individual Balancing Authority 5. Quality - Number of minutes data has not been received from a Balancing Authority 6. Frequency_Quality - Number of minutes Frequency data has not been received from either
the primary or secondary frequency source
Figure 38: Data displayed with “Balancing Authority Data” selected

24 CONFIDENTIAL
©Electric Power Group, LLC. All rights reserved. No portion of this report may be reproduced in any form without prior written consent.
ISO-RTO Jurisdiction Data Display
The ISO-RTO tab will give the user a map of all the ISOs and RTOs as seen in Figure 39.
Figure 39: ISO-RTO Map
When the ISO RTO Data tab is selected, (top left of screen) the data from the map will be displayed as seen in Figure 40. The six columns of cells in the window are:
1. ISO_RTO_Code – Independent System Operator - Regional Transmission Organization 2. ACE – Area Control Error for the ISO RTO 3. Frequency – Frequency reported for the ISO RTO 4. ACE_L10 – ACE for each ISO RTO as compared to the L10 submitted by the Balancing
Authorities 5. Quality - Number of minutes ACE data has not been received from a Balancing Authority 6. Freq_Quality – Number of minutes Frequency data has not been received from either the
primary or secondary frequency source
Figure 40: Data displayed in the window with “ISO-RTO Data” selected

25 CONFIDENTIAL
©Electric Power Group, LLC. All rights reserved. No portion of this report may be reproduced in any form without prior written consent.
4.2. Last 30-Minute of 1 Minute ACE/Freq Bar Chart
From any Jurisdictional map display Main Panel, select a jurisdiction using left click (the jurisdiction will turn Magenta), then right click the mouse and the pop-up menu appears as seen in seen in Figure 41.
Figure 41: RMB option to select “Last 30-Min of 1-Min ACE/Freq Bar-Chart” display
Selecting the option will bring a 3-panel display of ACE and frequency information of the selected jurisdiction (figure 42).
Figure 42: Last 30-Min of 1-Min ACE/Freq Bar-Chart 3-panel display
There are three graphic panels and one bottom Dynamic Data Text Window with actual data displayed in tabular fashion for each panel. Following briefly describes the contents of each panel:
1. Panel 1: Bar Chart with Last 30-Minute ACE-Frequency for BAs in Selected Jurisdiction (sorted for highest/lowest frequency). Option available to display o nly top-5 offenders (BA ACE not helping frequency)
2. Panel 2: 2D-Image with Last 30-Minute BA color coded ACE for BAs of Selected Jurisdiction 3. Panel 3: Line/Cave Plot for last 30-Min of user selected BA-ACE overlapping interconnection
frequency and frequency sensitivity bar chart
3-Panel View RMB Menu
To maximize any of the three displays, right click on the desired panel. A pop-up menu will appear and with

26 CONFIDENTIAL
©Electric Power Group, LLC. All rights reserved. No portion of this report may be reproduced in any form without prior written consent.
the selection of “Maximize Display” (Figure 43) the panel will become a full screen. To return to the former view, right click on the panel and the pop-up menu will reappear. With the selection of “Minimize Display”, the three-panel display will reappear.
Figure 43: 3-Panel view RMB menu
Clicking on “Enter Time Range” in the menu brings up the option window as shown in Figure 44. This option allows displaying data of larger duration than the default 30 minutes.
Figure 44: Time Range options
“User Enterable Options” in the menu will display option window which is specific to the particular panel and chart type and allows the user to access different chart types defined for the panel and also edit the chart display parameters.
“Print Panel” lets user either print that particular panel or all the three panels.
“Relocate Panel” allows for panel placement configuration where the user can move a particular panel to another location in the 3-panel layout. This option is typically used to give more visibility to a panel-2 or panel-3 display by moving it to panel-1 location.

27 CONFIDENTIAL
©Electric Power Group, LLC. All rights reserved. No portion of this report may be reproduced in any form without prior written consent.
ACE/Freq Bar Chart
ACE/Freq Bar Chart display is displayed in Panel-1 by default with Last 30-Minute ACE-Frequency data for BAs in Selected Jurisdiction (sorted for highest/lowest frequency) (Figure 45). The Bar chart is 1-minute bars created by stacking BAs ACE over each other and is overlaid by interconnection frequency line-chart. Right-clicking on the panel provides the menu as shown in figure 43. From here the item “User Enterable Options” generates the menu option (Figure 46) which allows drop-down list option to display only top-5 offenders (BA ACE not helping frequency).
BAs ACE bar-chart and frequency line-chart are aligned at 0 MW and 60 Hz respectively. The scaling relationship between ACE and Frequency y-axis scales is displayed below the chart (in the example of western interconnection in the figure ACE vs Frequency is 0.1 Hz / 1800 MW). Difference between expected ACE (using frequency value and bias) and actual ACE (reported ACE) is reported as “Missing ACE” and represented by a gray bar at the end in the bar-chart.
Figure 45: ACE/Freq Bar Chart
Figure 46: Bar-Chart display options

28 CONFIDENTIAL
©Electric Power Group, LLC. All rights reserved. No portion of this report may be reproduced in any form without prior written consent.
Balancing Authority Image Chart
Balancing Authority Image Chart is displayed in Panel-2 by default with last 30-Minute ACE and Frequency in a grid for BAs in Selected Jurisdiction (Figure 47). The grid is color coded based on the ACE value compared to the threshold scale shown below the chart. The Image chart is per-minute sorted descending by ACE compared to L10 values. On top of the BA ACE values there is a row of Net ACE Total of all the selected BAs. On top of Net ACE there is a row of color coded Interconnection frequency. Topmost row is color coded Frequency response difference value of the topmost BA in the image plot.
Figure 47: BA ACE Frequency image chart
Figure 47 is called the “Tracking_2 Image” and it is the “default” option for this panel. The original chart for this panel is now called “Trackin_1 Image”. To select this option right-click on Panel 2 and from the menu select “User Enterable Options” which will show options as in Figure 48. Select the down arrow at the “Image Display” and the selection can be made for the “Tracking_1 Image” then click “OK”. Figure 49 is the “Tracking_1 Image”.
Figure 48: BA ACE Freq display user options
Tracking_1 Image is color coded 1-minute ACE values of the selected BAs presented in a grid sorted alphabetically.

29 CONFIDENTIAL
©Electric Power Group, LLC. All rights reserved. No portion of this report may be reproduced in any form without prior written consent.
Figure 49: Tracking_1 Image
Balancing Authority Line/Cave Chart
The ACE-Frequency line chart (default) in the lower right hand corner of the three-panel graphic defaults to the first Balancing Authority listed in the 30-Minute Image Plot. Each displayed Balancing Authority can be clicked to change the Hourly Cave graph. Right clicking on the Cave graph will allow the user to maximize the graphic, as shown in Figure 50. The line chart is divided into one-minute increments with Frequency in Blue and ACE in Red shown over the same 30-minute interval. The lower bar chart shows the 1-minute frequency differential for the interconnection.
Figure 50: 30-Minute ACE/Frequency Plot (Panel 3)

30 CONFIDENTIAL
©Electric Power Group, LLC. All rights reserved. No portion of this report may be reproduced in any form without prior written consent.
Right clicking in Panel 3 will produce the “Maximize/Display Option” pop-up. Select the “User Enterable Options” and Figure 51 will be presented. Select the “Cave Display” down arrow. Then select “Cave_1 Prediction Display” and click OK and Figure 52 will appear. This function can be performed in either the three panel display or the maximized view.
Figure 51: 3-Panel Display Options (Panel 3)
Figure 52: Panel 3 Cave_1 Prediction Display
The advanced view demonstrates the “ACE” in red and the “Frequency” in blue. This 30-minute view allows the user to inspect the last thirty minutes for the selected jurisdictions. The jurisdictions can be changed by left clicking on the desired jurisdiction in Panel 2.

31 CONFIDENTIAL
©Electric Power Group, LLC. All rights reserved. No portion of this report may be reproduced in any form without prior written consent.
4.3. Last Hour of 10-Minute Avg ACE/Frequency
From any Jurisdictional map display Main Panel, select a jurisdiction using left click (the jurisdiction will turn Magenta), then right click the mouse and the pop-up menu appears as seen in seen in Figure 53.
Figure 53: RMB option to select “Last Hour of 10-Minute Avg ACE/Frequency” display
Selecting the option will bring a 3-panel display of ACE and frequency information of the selected jurisdiction (figure 54).
Figure 54: Last Hour of 10-Minute Avg ACE/Frequency 3-panel display
Panel 1 displays last 10-minute average ACE value of the BAs of the selected jurisdiction. The color coding is based on the scale as shown in the bottom right of the panel. Panel 2 and Panel 3 have are the same chart types as described in last section. The only difference is that here the ACE and frequency values are 10-minute averages instead of previous 1-minute average values.

32 CONFIDENTIAL
©Electric Power Group, LLC. All rights reserved. No portion of this report may be reproduced in any form without prior written consent.
4.4. Last 10-Min of 1-Min Resolution ACE/Frequency
From any Jurisdictional map display Main Panel, select a jurisdiction using left click (the jurisdiction will turn Magenta), then right click the mouse and the pop-up menu appears as seen in seen in Figure 55. The “Last 10-Min of 1-Min Resolution ACE/Freq” sub-menu is available in “Jurisdiction ACE-Frequency” main menu.
Figure 55: Last 10-min of 1-min resolution ACE/Freq menu
Clicking on “Last 10-Min of 1-Min Resolution ACE/Freq” moves directly to the three-panel display for analyzing the ACE/Frequency as seen in Figure 56. This function is available from all Jurisdiction Tabs.
Figure 56: 10-Min of 1-Min resolution ACE/Freq three panel display
The main panel (Panel 1) displays the ACE value for each Balancing Authority in one-minute intervals. The upper right hand corner (Panel2) shows the ACE value ranges for the last ten minutes in one-minute intervals. The Cave graph in the lower right corner (Panel3) displays Frequency and ACE of one Balancing Authority for the last ten minutes.
The default, panel (Panel 1) in Figure 56 displays is the “Unique Time Value” with ACE the title for the x-axis and Jurisdictions in the y-axis. Other display options are available by right clicking the mouse over this panel

33 CONFIDENTIAL
©Electric Power Group, LLC. All rights reserved. No portion of this report may be reproduced in any form without prior written consent.
and selecting “Scatter Plot Grouping” from the pop-up menu. “Scatter Plot Grouping” contains the following three options:
1. Unique Frequency Value (X-ACE Total (MW), Y-Jurisdiction) 2. Unique Time Value (X- ACE Total (MW), Y-Jurisdiction) 3. Unique Jurisdiction (X-Frequency, Y- ACE Total (MW))
Figure 57: Scatter Plot Grouping Options
The “Scatter Plot Grouping” display can be changed in either the three panel or maximized format.

34 CONFIDENTIAL
©Electric Power Group, LLC. All rights reserved. No portion of this report may be reproduced in any form without prior written consent.
4.5. Last 24-Hours and Last 30-Days Interconnection Epsilon
From any Jurisdictional map display Main Panel, right click the mouse and the pop-up menu appears as seen in seen in Figure 58. Click on “Last 24-Hours and Last 30-Days Interconnection Epsilon” submenu under menu “Interconnection Epsilon-Frequency” to access the Interconnection Epsilon Frequency 3-panel display (Figure 59).
Figure 58: Interconnection Epsilon Frequency Menu
Figure 59: Interconnection Epsilon Frequency 3-Panel Display
This is an Interconnection level display and is the same three panels for all five tabs. The “Daily Interconnection Map – Last 24 Hours Epsilon1” occupies the first panel (Panel 1), The “Daily Image Panel” is in the upper right hand corner (Panel 2). The “Daily Plot Panel” is located in the lower right hand corner of the display (Panel 3).
To view any one of the panels as a full screen, right click on the desired panel and a pop-up menu appears. Select “Maximize” and the panel will be shown as a full screen. The Daily Image Panel will expand to the full-screen size as shown in Figure 61.

35 CONFIDENTIAL
©Electric Power Group, LLC. All rights reserved. No portion of this report may be reproduced in any form without prior written consent.
The Map displays Interconnection Data for the Last 24-Hour Interconnection Epsilon 1 (Figure 59). The four columns for the map display in the data tables (panel-4) are:
1. IN_Code – Interconnection Code 2. Epsilon1 – Constant derived yearly from the targeted Interconnection frequency deviations found
from the prior year 3. Epsilon1_Threshold – That threshold where the last hour frequency performance is compared to
the Epsilon constant 4. Quality – Number of minutes data has not been received from a Balancing Authority
The display colors of the map are coded. This color code, which appears as shown in Figure 60, is displayed in the lower right corner of the main panel.
Figure 60: Interconnection Map Color Code
Red Epsilon of >20
Yellow Epsilon of 18-20
Green Epsilon of 15-18
Blue Epsilon of 0-15
Epsilon is a function of the Frequency. It is a constant derived yearly from the targeted Interconnection frequency deviations found the prior year. This constant is used to compare the last hour frequency performance against this constant. It is used to assist the Regional Coordinator on knowing how the Interconnection control has performed.
Figure 61: Interconnection Epsilon Frequency Panel-2 Daily Image
Epsilon 1 Daily Image panel above displays Epsilon 1 for the last six hours (by default). The Date/Time selected is represented on the far right of the display. The previous five hours are shown to the left of the time selected. The Epsilon color code is displayed in the bottom right hand corner of the panel.

36 CONFIDENTIAL
©Electric Power Group, LLC. All rights reserved. No portion of this report may be reproduced in any form without prior written consent.
Figure 62: Interconnection Epsilon Frequency Panel-3 Daily Plot
The “Daily Plot Graph” displays the last 30 days for Epsilon 1. The Red plot displays the first period listed on the bottom of the graph (first 15 days). The Blue plot displays the second period listed on the top of the graph (last 15 days).

37 CONFIDENTIAL
©Electric Power Group, LLC. All rights reserved. No portion of this report may be reproduced in any form without prior written consent.
5. Analysis and Assessment Functions
CERTS has developed the ACE-Frequency Real-Time Monitoring System for NERC and Reliability Coordinators. NERC subcommittees have request CERTS to provide additional functionality to:
Calculate and track an appropriate metric, such as CPS1 1-Minute to capture unscheduled flows associated with large Balancing Authority imbalances;
Monitor in real time interconnection frequency errors and their root causes;
Capture real time data of poorly performing Balancing Authorities according to the new performance metric (BAAL);
Real time CPS1 alarming, monitoring and tracking with BAAL threshold;
Alarm Reliability Coordinators when power system is being driven to risky, abnormal conditions;
Recommend the corrective actions when alarms indicate abnormal conditions.
In the Main geographic panel, select a jurisdiction (the color turns purple), and right click to get the menu. Click “Jurisdiction CPS/BAAL Performance (Field Trial)” (Figure 63) and select one of the following sub-menus:
1. Last 30-Minutes CPS1/CPS2/BAAL Monitoring 2. Last 24-Hours CPS1/CPS2/BAAL Tracking 3. Last 30-Days CPS1/CPS2/BAAL Tracking
Figure 63: Analysis and Assessment Functions Menu
5.1. Last 30-Minutes CPS1/CPS2/BAAL Monitoring
The application calculates, displays, and tracks CPS1-based values for each Reliability Jurisdiction.
1-minute CPS1 calculation from 1-minute ACE and frequency for all Balancing Authorities;
CPS1 Monitoring for all Reliability Jurisdiction;
CPS1 Monitoring for user selected Balancing Authority;
CPS1 Tracking for 30-minute or user enterable extension.
The application also tracks and monitors balancing performance.
1-minute BAAL calculation from 1-minute frequency for all Balancing Authorities;
BAAL monitoring for all Reliability Jurisdiction;
BAAL monitoring for user selected Balancing Authority;
BAAL violation tracking for all Reliability Jurisdiction;
BAAL violation tracking for user selected Balancing Authority;
Clicking the appropriate right-click submenu (figure 63) will allow Reliability Coordinators to monitor 30-min

38 CONFIDENTIAL
©Electric Power Group, LLC. All rights reserved. No portion of this report may be reproduced in any form without prior written consent.
CPS1 with BAAL performance via 4-panel displays.
Figure 64: Last 30-Minutes CPS1/CPS2/BAAL Monitoring 3-Panel Display
This graphic displays CPS1 data for all Reliability Coordinators.
Panel 1 Geographic View with last Minute CPS1 for Balancing Authorities in Selected Jurisdiction;
Panel 2 2D Image Plot with possible BAAL Violation (Last 30-Minute of CPS1) for BAs of Selected Jurisdiction;
Panel 3 Bar-chart for last 30-Min of Thresholds for CPS1 and BAAL violations correlated with frequency;
Panel 4 Dynamic data text window with actual data displayed in tabular fashion for each panel.
The color of BAs in Panel-1 map and Panel-2 image displays is based on the color code threshold as defined in figure 65.
Figure 65: Color code threshold legend for the Panel-1 Map and Panel-2 Image Displays
The image plot in Panel-2 displays 1-Minute color coded CPS1 for each Balancing Authority. If lower than -572 then the Balancing Authority ACE exceed its BAAL (red-color). If ACE exceeds BAAL for continuous 30-minutes or more then it is BAAL violation. There are two displays that can be accessed through RMB menus “Tracking_1” (Figure 66) and “Tracking_2” (Figure 67) image. Tracking_2 Image sorts the BAs based on their CPS1/L10 ratio.

39 CONFIDENTIAL
©Electric Power Group, LLC. All rights reserved. No portion of this report may be reproduced in any form without prior written consent.
Figure 66: Last 30-Minute CPS1 “Tracking_1” Image Display
Figure 67: Last 30-Minute CPS1 “Tracking_2” Image Display

40 CONFIDENTIAL
©Electric Power Group, LLC. All rights reserved. No portion of this report may be reproduced in any form without prior written consent.
Figure 68: Last 30-Minute CPS1 Bar-Chart Display for any BA correlated with Frequency
The Panel-3 above displays CPS1 bar-chart with threshold lines at +/- 100 and +/- 572. The frequency line chart is plotted over the bar-chart, makes it easy to correlate CPS1 with frequency.
5.2. Last 24-Hours CPS1/CPS2/BAAL Tracking
Clicking the submenu “Last 24-Hours CPS1/CPS2/BAAL Tracking” navigates the user to 3-panel display (Figure 69):
Figure 69: Last 24-Hours CPS1/CPS2/BAAL Tracking 3-Panel Display
This graphic displays BAAL data for all selected Reliability Jurisdictions.

41 CONFIDENTIAL
©Electric Power Group, LLC. All rights reserved. No portion of this report may be reproduced in any form without prior written consent.
Panel 1 Geographic View of selected BAs color coded based on Last Hour CPS1 average value compared to threshold scale shown in lower right corner
Panel 2 ACE exceeding BAAL summary vs. CPS2 for selected BAs using 24-Hours of cumulative Bar-Plot.
Panel 3 Hourly Circular-Chart for a selected BA.
Panel 4 Dynamic data text window with actual data displayed in tabular fashion for each selection criteria. – Date_Time: Date and time of the data presented. – BA_Code: Balancing Authority code. – ACEExBAAL_30Min: Number of ACE exceeding BAAL for more than 30 minutes during each
hourly time range. – NumACEExBAAL: Number of ACE exceeding BAAL during each hourly time range. – MinACEExBAAL: Number of minutes of ACE exceeding BAAL during each hourly time range. – RMS_FreqDev: root mean square of frequency deviation during each hourly time range. – Avg_CPS2: Average CPS2 during each hourly time range.
Figure 70: Last 24-Hours CPS2/BAAL Summary Statistics
The panel-2 (figure 70) bar chart has the hourly bars stacked with height of each corresponding to number of time ACE exceeding BAAL during that hour. In addition, there is a scatter plot for CPS2 with average CPS2 percentage value over last 24-hour. The CPS2 threshold line is at 90%.

42 CONFIDENTIAL
©Electric Power Group, LLC. All rights reserved. No portion of this report may be reproduced in any form without prior written consent.
Figure 71: Last 24-Hours CPS1/CPS2/BAAL Performance Circular Plot
The Circular-plot in Figure 71 has following features:
The circle is created by using 24 data points of hourly values for the last 24 hours.
There are four concentric circles color coded green and red based on their value compared with threshold. The maximum and minimum values are also printed on the plot. The circles from outer to inner are:
– CPS2: Threshold line is at 90%. – CPS1: Threshold line is at 100% – Epsilon: Threshold is at 18 mHz – BAAL Violation: Threshold is at 0. Any violation shows up in red.
Plot is updated every hour.
Click on any BA in the Bar-Chart in Panel-2 to see the corresponding BA’s circular plot in Panel-3

43 CONFIDENTIAL
©Electric Power Group, LLC. All rights reserved. No portion of this report may be reproduced in any form without prior written consent.
5.3. Last 30-Days CPS1/CPS2/BAAL Tracking
Clicking the submenu “Last 30-Days CPS1/CPS2/BAAL Tracking” navigates the user to 3-panel display (Figure 72):
Figure 72: Last 30-Days CPS1/CPS2/BAAL Tracking 3-Panel Display
This graphic displays last 30-days CPS1/CPS2/BAAL data for BAs in the selected jurisdiction.
Panel 1 Geographic View of selected BAs color coded based on Last Day CPS1 average value compared to threshold scale shown in lower right corner.
Panel 2 ACE exceeding BAAL summary vs. CPS2 for selected BAs using 30-Days of cumulative Bar-Plot.
Panel 3 Daily Circular-Chart for a selected BA.
Panel 4 Dynamic data text window with actual data displayed in tabular fashion for each panel. – Date_Time: Date and time of the data presented. – BA_Code: Balancing Authority code. – ACEExBAAL_30Min: Number of ACE exceeding BAAL for more than 30 minutes during each
daily time range. – NumACEExBAAL: Number of ACE exceeding BAAL during each daily time range. – MinACEExBAAL: Number of minutes of ACE exceeding BAAL during each daily time range. – RMS_FreqDev: root mean square of frequency deviation during each daily time range. – Avg_CPS2: Average CPS2 during each daily time range.

44 CONFIDENTIAL
©Electric Power Group, LLC. All rights reserved. No portion of this report may be reproduced in any form without prior written consent.
Figure 73: Last 30-Days CPS2/BAAL Summary Statistics
The panel-2 bar chart has the bars are stacked with daily sections with height of each corresponding to number of time ACE exceeding BAAL during that day. In addition, there is a scatter plot for CPS2 with average CPS2 percentage value over last 30 days. The CPS2 threshold line is at 90%.
Figure 74: Last 30-Days CPS1/CPS2/BAAL Performance Circular Plot
The Circular-plot in Figure 74 has following features:
The circle is created by using 30 data points of hourly values for the last 30 days.
There are four concentric circles color coded green and red based on value comparison with threshold. The maximum and minimum values are also printed on the plot. The circles from outer to inner are:

45 CONFIDENTIAL
©Electric Power Group, LLC. All rights reserved. No portion of this report may be reproduced in any form without prior written consent.
– CPS2: Threshold line is at 90%. – CPS1: Threshold line is at 100% – Epsilon: Threshold is at 18 mHz – BAAL Violation: Threshold is at 0. Any violation shows up in red.
Plot is updated every day.
Click on a BA in the Bar-Chart in Panel-2 to see the corresponding circular plot in Panel-3.

46 CONFIDENTIAL
©Electric Power Group, LLC. All rights reserved. No portion of this report may be reproduced in any form without prior written consent.
6. Data Replay Functions
From the three-panel screens (as described in previous sections), a replay of the last 24 hours can be viewed by clicking the “Replay” button on the lower right corner. The desired panel for replay should be maximized and then replay button used for replaying data for the selected panel. When this button is clicked the replay display will appear as seen in Figure 75.
Figure 75: Replay of Last 24-Hours Data
To replay the last 24 hours, click the rerun button and the time indicator will return to the far left, the beginning of the sequence. The replay controls are shown in Figure 76.
Figure 76: Replay Controls Toolbox
The “Speed Control” lever controls the speed of the replay. Move the lever right for quicker viewing; move it left for a slower view of the last 24 hours. Click the Play/Start button to begin viewing the last 24 hours. Pause replay by clicking play button again while playing.
To return to the original display without the time line click on the “Replay” button and the timeline will be removed and the display can be minimized.
For the hourly displays (Interconnection Epsilon, section 4.5), replay function plays back last 7 days of data.
Replay on/off toggle button
End replay/ fast forward
Control replay speed
Rewind/Rerun replay
Play/Pause replay

47 CONFIDENTIAL
©Electric Power Group, LLC. All rights reserved. No portion of this report may be reproduced in any form without prior written consent.
7. Situational Awareness Functions
Figure-77 shows the required visualization solution overview for the NERC Resources Adequacy application which is used as the base infrastructure for the Situational Awareness functions. To respond to the three fundamental functional requirements for an effective Situational Awareness system, detection, comprehension and trend, two basic dashboards have been researched and defined: Detection-Alarm Dashboard, and Adequacy Trace-Trend Dashboard.
Users will interact between the two dashboards. One of the dashboards should allow for identification of abnormal balance resource conditions, and the other will help to identify possible root causes for unbalances, its dimension and impact. As shown in Figure-77, two complementary functions are also required for helping the situational awareness process: Automatic Alarm Broadcasting and Archiving, and Performance Reports.
Figure 77: Resources Adequacy Application Visualization Overview
To access Situational Awareness functions, right click on any top level jurisdiction tab 1-panel geographic display. The two situational awareness functions are presented in the menu (Figure 78):
1. Detection and Alarm Dashboard 2. Adequacy Trace and Trend Dashboard
Each dashboard is launched with components specifically designed for the required jurisdiction level. The dashboard components and navigation is explained in subsequent sections.

48 CONFIDENTIAL
©Electric Power Group, LLC. All rights reserved. No portion of this report may be reproduced in any form without prior written consent.
Figure 78: Situational Awareness Functions Menu
7.1. Detection and Alarm Dashboard
The alarm-dashboards are available for interconnections, reliability regions, and reliability coordinators. The definition and layout of the load-generation alarms for the detection-alarm dashboard follows very closely the current reliability coordinators local-area operating generation/capacity alert conditions shown at the top of figure 79 below. The wide-area situational awareness alarms are based in the theoretical-operational principles and frequency thresholds from NERC Balancing Authorities ACE limit (BAAL) definitions and results of its Field Trial. They follow very closely the format and nomenclature of its equivalent alerts at the local-area level shown in figure 79. The figure shows the four situational awareness alarm types and definitions categorized under the following four wide-area operational conditions:
Normal - System can tolerate a generation or load contingency without abnormal load-generation unbalances and without violating any frequency limits.
Alert - The risk and impact of a second contingency becomes greater than acceptable.
Emergency Manual Load Drop - System is exposed to unacceptable level of risk. Customers load maybe be manually dropped, restoration procedures in place.
Automatic Load Shed - Load has already being dropped by under-frequency relays, restoration procedures in place.

49 CONFIDENTIAL
©Electric Power Group, LLC. All rights reserved. No portion of this report may be reproduced in any form without prior written consent.
Figure 79: Situational Awareness Alarm Types and Definitions
Figure 80, 81, and 82 show the required 3-panel detection-alarm dashboard for interconnections, reliability regions, and reliability coordinators with panel-1 showing alarm-conditions for each wide-area jurisdiction. Following are detail functional descriptions for this dashboard three panels. Users can select jurisdictions via the tabs at the top-left. Both the alarms in panel-1 and the geographic maps in panel-2 will change accordingly to visualize the corresponding data for the selected jurisdiction.
Figure 80: Detection and Alarm Dashboard Display for Interconnections

50 CONFIDENTIAL
©Electric Power Group, LLC. All rights reserved. No portion of this report may be reproduced in any form without prior written consent.
Panel-1 Color-coded Alarms
Panel-1 on the left side shows color-coded the Normal, Alert, Manual Load Shedding required, and Automatic Load shedding alarms for all four North America interconnections which are the alarm default jurisdiction.
Panel-2 Geographical Boundaries of Jurisdiction Selected
Panel-2 on the right side shows the geographical boundaries for the jurisdiction selected together with the total MW that already were dropped (during such event). The maps are color coded based on the alarming state of the particular jurisdiction. The state boundaries are shown in the background. Any map will have the capability to display state or county boundaries.
Panel-3 Alarm Timing and Trace Rate Tabular Text Tables
Panel-3 shows three data tabs: Overview, Alarm Timing –Trace Rates, and Load Shed.
1. The Overview tab (figure 80) consists of two sections. The section on the right is constant for all the jurisdictions. This lists the Frequency Alarming limits (Frequency Trigger Limit (FTL), Frequency Abnormal Limit (FAL) and Frequency Reliability Limit (FRL)) for each Interconnection. The section on the left displays the “Peak Load” value of each jurisdiction displayed in Panel-1.
2. The Alarm Timing and Trace Rates tab (figure 82) shows a table with the jurisdictions selected, the current interconnection frequency, and the time (number of minutes, max 30) the system has been in a particular alarm mode.
3. The Load Shed tab (Figure 81) shows the interconnection frequency for load drop, the jurisdiction name, the estimate numbers of GW/customers dropped, and the cumulative total of GW/customers dropped. The current Interconnection frequency is shown as reference. The data corresponds to the Panel-2 bar-chart in figure 81. The load shed bar-chart is displayed by default for Reliability Region Alarm Dashboard. This can be replaced with Alarm Map display using the right mouse button user menu (figure 83).
Figure 81: Detection and Alarm Dashboard Display for Reliability Regions

51 CONFIDENTIAL
©Electric Power Group, LLC. All rights reserved. No portion of this report may be reproduced in any form without prior written consent.
Figure 82: Detection and Alarm Dashboard Display for Reliability Coordinators
User Options to Rearrange Graphs and Plots in Panels
The right mouse button menu shown in figure 83 can be used to access user options to:
Navigate back to “Monitoring and Analysis” displays
Customize display parameters using “Situational Awareness Options” (figure 86)
Change load shed visuals (only available for panel-2)
Maximize/Minimize display of panel
Print panel
Figure 83: Detection and Alarm Dashboard Right Mouse Button User Menu

52 CONFIDENTIAL
©Electric Power Group, LLC. All rights reserved. No portion of this report may be reproduced in any form without prior written consent.
7.2. Adequacy Trace – Trend Dashboard
After users have been alarmed and notified of abnormal resource adequacy unbalances via the detection-alarm dashboard, they can navigate by clicking on the any of the alarm circles to a second dashboard showing a 4 panel visual solution to allow investigation of possible root-causes and reasons for the resource abnormal unbalances. Figure-84 shows multi-view visual containing four major functions: a trace for the resources adequacy status in panel-1, a color-coded reliability coordinators geographic view with its color code ACE in panel-2, load-shed bars or alarm-map plots in panel-3, and in panel-4 the tabular text tables showing the magnitudes of the data corresponding to the plots or graphs showing in each of the other three panels. All four functions are presented as an integrated and coordinated trace-trend dashboard.
Figure 84: Adequacy Trace – Trend Dashboard 4-Panel Display
Following are brief descriptions of each panel of the trace-trend dashboard:
Panel-1 Operational Trace Plot
Panel-1 (main panel) shows minute-by-minute resources adequacy trace for the selected jurisdiction for last 10-minutes as a default, the trace-length in minutes can be selected by users. The trace is generated by using Jurisdiction ACE (y-axis) and Interconnection Frequency (x-axis) over the defined time period. Start and End of Trace designated by “S” and “E”. This operational trace is compared with the four major operational references which are also shown:
The frequency alarms BAAL boundaries (Normal, Alert, Emergency, Load Drop)
The frequency bias rate-line
Probabilistic grouped historical-data polygons selected by user. By default there are two polygons – one for last hour of data and other for last day’s data for next hour.
Jurisdictional CPS1 curve.
As shown in Figure-84, the text-labels for the trace and the references data are shown at the bottom-right corner of panel-1. Most of these references can be configured in the user options (figure 86).
Panel-2 Color coded ACE map
Panel-2 shows the color-coded ACE magnitude and geographic location for those reliability coordinators having the most impact in the resources adequacy imbalances shown in panel-1. The visual and information

53 CONFIDENTIAL
©Electric Power Group, LLC. All rights reserved. No portion of this report may be reproduced in any form without prior written consent.
in panel-2 complements panel-1 information by directing users to identify the root-causes, magnitude and geographic location of resources adequacy imbalances.
Panel-3 Load-Shed Bars or Alarm-Map
Panel-3 gives user additional information by showing per reliability region the estimated number of customers whose load has been dropped and the equivalent GW already shed when the resources adequacy trace-trend in panel-1 is already in the automatic load-shed red-area. The red-coloring of the bars in panel-3 shows load already shed.
Panel-2 and Panel-3 visuals can be changed using the Right Mouse Button user menu as shown in figure 85. Alarm Circles and Alarm Map are from panel-1 and panel-2 of “Detection and Alarm Dashboard”
Panel-4 Load-Shed Bars or Alarm-Map
Panel-4 gives the parameters magnitudes in a tabular text format. The data table for each tab contains the data used for the corresponding plot in either of the panels.
Overview – This tab is carried over from “Detection and Alarm Dashboard”
Trace Plot – Data used in the Panel-1 “Operational Trace” plot. This includes the date time, Net ACE of the jurisdiction, Interconnection frequency, Frequency Bias and estimated BAAL
Interconnection Map – Last minute ACE value of jurisdictions shown in Panel-2
Load Shed Plot – As explained for Figure 81 in last section
Replay Data – The data used to display when Last-Hour of Operational Trace plot is replayed using the “Replay” button on the bottom right. The Replay function works the same way as described earlier.
RMB Menu Options for Alarm and Trace-Trend Dashboards
Figure-85 shows the RMB menu options adequacy trace-trend dashboards. Right clicks on any of the dashboards will bring the menu with its different options. Following is a brief description of each of the situational awareness RMB menu options
Monitoring and Analysis – This option will display the Monitoring, Analysis, and Assessment default 1-Panel visual.
Detection-Alarm Dashboard – This option will display the Detection-Alarm Dashboard
Situational Awareness Options – This option will display the window shown in Figure-86 for users to enter trace and reference parameters.
Load Shed Visuals – This option will bring a second menu for the user to select the plot they will like to show in panel-2 or panel-3 of the dashboards.
Maximize Display – Maximize the display to full screen
Print Current Panel – Print either current panel or all three panels
Figure 85: RMB Menu Options for Alarm and Trace-Trend Dashboards

54 CONFIDENTIAL
©Electric Power Group, LLC. All rights reserved. No portion of this report may be reproduced in any form without prior written consent.
Figure 86: Situational Awareness Display and Configuration Options
7.3. Navigation Overview for Situational Awareness
Figure-87 shows an overview of Situational Awareness Navigation. The different arrows and RMB menus in the right-side of Figure-87 show the navigation from the top functions, starting with the application icon and ending on the adequacy trace-trend dashboard. The different arrows and RMB menus in the left-side of the figure show the navigation from the bottom functions starting at the trace dashboard and going back to alarming and monitoring functions on the 1-panel display.
Because the initial focus and utilization will be with the detection-alarm dashboard, the current top-left jurisdictional tabs will be used to obtain the detection- alarm dashboard for the interconnections, reliability regions and reliability coordinators. Any jurisdictional change required for the adequacy trace-trend dashboard will require the user to go back, via the RMB (or simply click the top jurisdiction tab); to the detection-alarm dashboard and select the jurisdiction required from any of the alarms circles in panel-1.
To navigate between the two situational awareness dashboards and have access to the options window that will allow users to define parameters for the trace-trend and reference plots, the RMB has been designed and is shown in Figure-85 with its different options. Figure-85 shows the expanded and categorized RMB menu including the situational awareness alarm and trace dashboards options. When users select the “Detection-Alarm Dashboard” option, the DOE-SA Detection-Alarm Dashboard will be displayed. If the user selects “Adequacy Trace-Trend Dashboard”, the respective dashboard will be displayed.

55 CONFIDENTIAL
©Electric Power Group, LLC. All rights reserved. No portion of this report may be reproduced in any form without prior written consent.
Figure 87: Situational Awareness Navigation Overview

56 CONFIDENTIAL
©Electric Power Group, LLC. All rights reserved. No portion of this report may be reproduced in any form without prior written consent.
8. Data Collection and Reporting Functions
8.1. Data Collection Tool (Interactive Data Collection)
The CERTS Data Collection Tool is an easy way for engineers and/or other support personnel to view/extract the raw data from the NERC Database that has been collected for the user to analyze. Click the “Data Collection Tool” tab in the upper right hand corner, as shown in Figure 88, to access this tool.
Figure 88: Data Collection Tool Access Button
The “CERTS Data Collection Tool” panel will appear. The buttons in the upper left hand corner of the screen, as seen in Figure 89, provide data collection options.
Figure 89: Data Collection Tool Options
Parameter Dialog
Export to CSV File
Report Wizard
Generate Report

57 CONFIDENTIAL
©Electric Power Group, LLC. All rights reserved. No portion of this report may be reproduced in any form without prior written consent.
Parameter Dialog
The “Parameter Dialog” window, shown in Figure 90, enables viewing/downloading data for a specific date and time range. Clicking the down arrow adjacent to the “Start Date/Time” Text Box will provide a calendar. When a specific Start Date has been selected from this “Start Date” calendar, a corresponding default End Date appears in the “End Date/Time” text box. This default date will be the next calendar day. This date and time will be 24 hours from the start date. By using the down arrow on the “End Date/Time” window a different date can be chosen. The time can be adjusted by clicking the down arrow. This operation is the same as described before at Figure 17.
Figure 90: Data Collection Tool Parameter Dialog
There are two top level tabs “Resource Adequacy” and “Situational Awareness” with different set of variables matching the variables used in the corresponding displays. The default data variable resolution is “Minute”; use the drop-down list to select appropriate variable data resolution. The five Jurisdiction tabs below the Date/Time windows are the same as those from the Master Monitoring Display (Figure 9). After one of the five tabs is selected, choose the area(s) to be viewed from the “Unselected Areas” text box. Click on the desired area and that selection will be highlighted. Then the “>>” button must be clicked to move the selection to the “Selected Area” text box. Variables can then be selected from the “Unselected Variables” text box. These selected variables must be moved to the “Selected Variable” text box by clicking the “>>” button. Should one of the areas or variables selected not be needed, it can be returned to the Unselected Area or Unselected Variable text box by highlighting the undesired element and clicking the “<<” button. Once the selections are finalized, click “OK” to return to the “CERTS Data Collection Tool.”
The Report Wizard walks user through the process described above on a step by step basis: first it allows selection of the date/time range, then the jurisdictional level of the report and then it gives a list of available variables for the selected jurisdictional tab.
Warning: Both the Parameter Dialog and the Report Wizard allows downloading of flexible time periods. However, when selecting a large number of Balancing Authorities and short time resolution (1- minute or 10-minute data); it is recommended to set a time frame not to exceed 24 hours. When selecting hourly, daily or monthly variables, the time frame should not exceed 30 days. A shorter period of time should be considered if a slow connection to the internet is used. CERTS/EPG is working on adding these recommended restrictions as part of the application functionality. We are also reviewing alternative

58 CONFIDENTIAL
©Electric Power Group, LLC. All rights reserved. No portion of this report may be reproduced in any form without prior written consent.
methods of downloading large amounts of data from the data server without affecting the application performance and the servers and network availability.
In the “CERTS Data Collection Tool” window, the selected Areas and Variables appear on the left side of the screen. For the Scatter Chart option, only two of the three variables are shown in the Variable text window; the third variable has been placed in the X Axis text box. Clicking the down arrow of the “X Axis” opens the window to reveal the variables shown above. Clicking the down arrow for “Scatter Chart” allows the user to select a “Line Chart.” The data in tabular form appears in the bottom left corner. This is the data that will be used to construct the charts. To construct the charts highlight the area(s) that are to be charted. When more than one area is to be selected: highlight the first area. While holding down the “Ctrl” key, click on the other area to be viewed. Follow the same process for the “Variables”. Use the “Shift” key to select a continuous list of areas or variables. As each Area and Variable is selected, it will appear in the black chart area. With both areas and all three variables selected, the chart will be displayed as in Figure 91.
Figure 91: CERTS Data Collection Tool – Scatter Chart
The time graduation can be changed by highlighting the number in the “Number of minutes in a time period” as viewed in Figure 91. This tool can be minimized and placed on the taskbar for review later. This tool must be manually closed.
8.2. Data Unavailability Report Generator
The Data Unavailability Report Generator is a reporting tool intended for those interested in tracking the reliability of the ACE data sent from Balancing Authorities via the ICCP network. It is a web-based application that displays bar charts and tables representing the reliability of data from the Balancing Authority over a given period of time. The Data Unavailability Report displays the amount of time ACE data was not received for each Balancing Authority selected. The application can be launched from the Data Collection Tool clicking “Generate Report” button.
When the Report Generator is launched a “Report Dialog” is displayed which allows the user to set the criteria for generating a report (see Figure 92 below). Four parameters must be selected in order to properly generate a report.
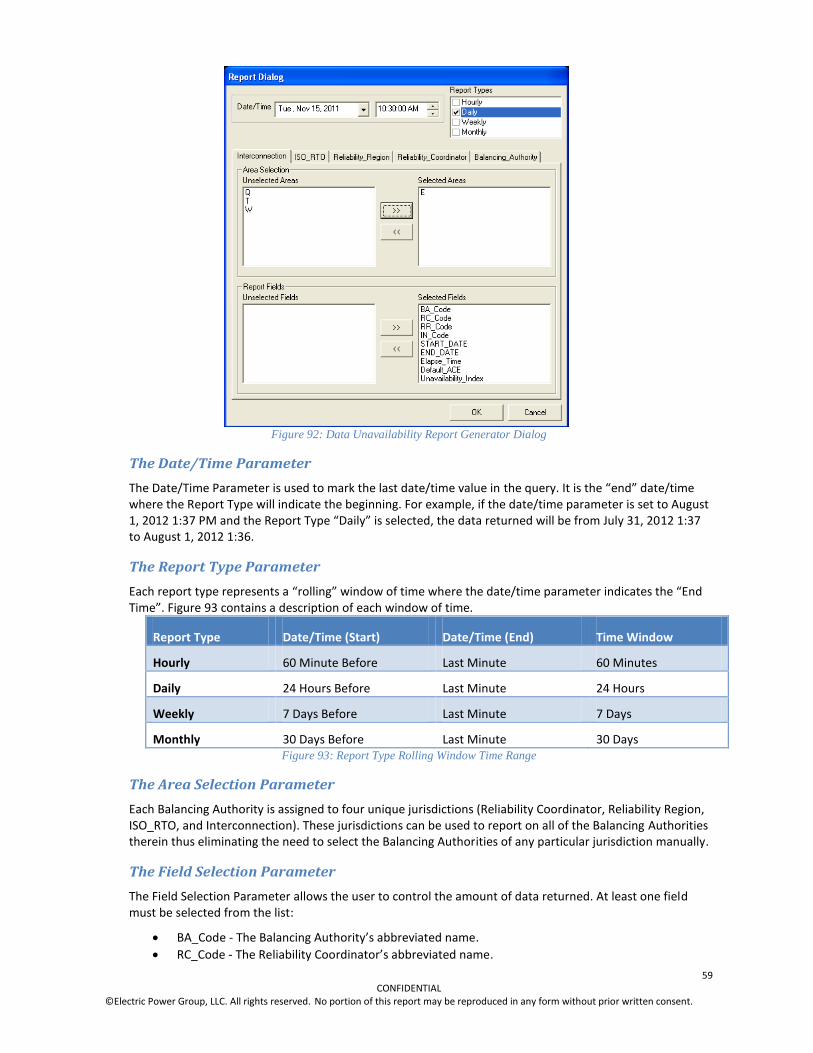
59 CONFIDENTIAL
©Electric Power Group, LLC. All rights reserved. No portion of this report may be reproduced in any form without prior written consent.
Figure 92: Data Unavailability Report Generator Dialog
The Date/Time Parameter
The Date/Time Parameter is used to mark the last date/time value in the query. It is the “end” date/time where the Report Type will indicate the beginning. For example, if the date/time parameter is set to August 1, 2012 1:37 PM and the Report Type “Daily” is selected, the data returned will be from July 31, 2012 1:37 to August 1, 2012 1:36.
The Report Type Parameter
Each report type represents a “rolling” window of time where the date/time parameter indicates the “End Time”. Figure 93 contains a description of each window of time.
Report Type Date/Time (Start) Date/Time (End) Time Window
Hourly 60 Minute Before Last Minute 60 Minutes
Daily 24 Hours Before Last Minute 24 Hours
Weekly 7 Days Before Last Minute 7 Days
Monthly 30 Days Before Last Minute 30 Days Figure 93: Report Type Rolling Window Time Range
The Area Selection Parameter
Each Balancing Authority is assigned to four unique jurisdictions (Reliability Coordinator, Reliability Region, ISO_RTO, and Interconnection). These jurisdictions can be used to report on all of the Balancing Authorities therein thus eliminating the need to select the Balancing Authorities of any particular jurisdiction manually.
The Field Selection Parameter
The Field Selection Parameter allows the user to control the amount of data returned. At least one field must be selected from the list:
BA_Code - The Balancing Authority’s abbreviated name.
RC_Code - The Reliability Coordinator’s abbreviated name.

60 CONFIDENTIAL
©Electric Power Group, LLC. All rights reserved. No portion of this report may be reproduced in any form without prior written consent.
RR_Code - The Reliability Region’s abbreviated name.
IN_Code - The Interconnection’s abbreviated name.
START_DATE - The beginning date/time of the report.
END_DATE - The ending date/time of the report.
Elapse_Time - The amount of time (in minutes) the Balancing Authority’s data was not available via the ICCP.
Default_ACE - The default ACE value used while no other data was available.
Unavailability_Index - The percentage of time the data was unavailable.
Sample Report
Embedded in this document is a sample of a report consisting of all the report types, all the report fields, and one Reliability Region, SERC (which contains 25 Balancing Authorities).
Bar Charts
A bar chart is created for each report type selected. The Balancing Authorities displayed within the bar charts are only those whose ACE data was not received by the ICCP for at least one minute of the requested time window (sample monthly report shown in figure 94). If more than one report type is requested then a summation bar chart appears at the bottom grouping all the reports into one bar chart (figure 95).
Figure 94: Sample Data Unavailability Monthly Report Bar-Chart
Figure 95: Sample Data Unavailability Summation Report Bar-Chart
Tabular Data
Below the bar chart section of the report is the actual data returned. Again, there is one table of data for each report type requested. Most of the report types will return one record of data for each Balancing Authority. The Hourly report type is the exception to this as it will report all of the time gaps in the data. For example, in the sample report below, SPC ACE data was not reported via ICCP during multiple instances in the desired reported hour. All those instance records are displayed in the Hourly table for SPC quantifying

61 CONFIDENTIAL
©Electric Power Group, LLC. All rights reserved. No portion of this report may be reproduced in any form without prior written consent.
the amount of time the ACE data was unavailable for SPC via the ICCP (Figure 96). All other Data Unavailability Reports (for example, the Monthly Data Unavailability Report in figure 97) show total number of minutes data was not available via ICCP in the selected time range.
Figure 96: Sample Hourly Data Unavailability Report
Figure 97: Sample Monthly Data Unavailability Report

62 CONFIDENTIAL
©Electric Power Group, LLC. All rights reserved. No portion of this report may be reproduced in any form without prior written consent.
9. Resource Adequacy Report Generator
Double-click on the bottom left yellow information window to launch the “Resource Adequacy Report Generator” dialog box (figure 98). From here the reports designed for various Resource Adequacy metrics and data quality statistics can be accessed on demand through the available user options.
The main window consists of seven (7) tabs, each containing report types corresponding to the different functional areas of the application:
1. Alarming and Monitoring 2. Analysis and Assessment 3. Situational Awareness 4. Intelligent Alarms 5. ACE-Frequency Correlations 6. NERC Data Quality 7. TEC (Time Error Correction)
The report generator dialog typically requires user input of desired time period, report type and the Jurisdiction(s) of interest. The report is generated in a specially formatted layout when user clicks the “Ok” button. Some report types allow export of the data in CSV format for further analysis. The dialog closes automatically after generating the requested report or the user can click “Cancel” to exit out of the dialog box without generating any report.
Figure 98: Resource Adequacy Report Generator User Options
9.1. Alarming and Monitoring Reports
Figure 98 shows user option required for generating the report. The Date Time can be entered either explicitly defining “Date Range” (Start Date/Time and End Date/Time) or using “Selection Type” which uses specified End Date/Time and Start Date/Time is calculated when user selects time period. Available time periods are Last Minute, Last Hour (default), Last 24 Hours and Last 7 Days. The available report types are:
Frequency Sources Data Quality – Data quality and availability report for the available frequency sources.
Unavailability Report – Data quality and unavailability report for BAs ACE data received via ICCP.
BA-ACE vs Interconnection Frequency – Report of BAs ACE that was not helping to bring frequency

63 CONFIDENTIAL
©Electric Power Group, LLC. All rights reserved. No portion of this report may be reproduced in any form without prior written consent.
to 60 Hz.
These report types are not available when “Last Minute” period is selected. The Last Minute report (figure 99) is a snapshot of all BAs that did not report their ACE values for last minute. This includes information about the corresponding Reliability Coordinator (RC), L10 Yearly, Calculated frequency component of ACE (MW), total minutes data is unavailable, and the contact information of the Dispatch Desk for the BA.
Figure 99: Last Minute Data Quality and Performance Report
This information can be used to explain the Missing ACE (difference between total ACE reported and ACE value calculated using frequency and frequency bias). Also information is provided to make decision regarding resolving any data availability issues.
Frequency Sources Data Quality Report
The need to monitor the data quality and availability of frequency sources used to report interconnection frequency is served by Frequency Sources Data Quality Report (figure 100). If any of the top 3 priority frequency sources are listed in this report then it is recommended to take appropriate actions to resolve the data quality issue or change priority of the sources.
The different available data statistics are:
Total Minutes Unavailable/Bad Quality at the Source – Sum of minutes containing bad quality data and missing data
Longest Period Unavailable/Bad Quality – Longest consecutive minutes data was not available or of bad quality
Number of Periods Unavailable/Bad Quality – Provides information regarding the nature of data quality/availability problem. Whether the data was missing for a large duration or multiple smaller periods.
Total Minutes Missing Data at NERC – Sum of minutes when ALL the frequency sources data were missing in the data stream from NERC for display. This indicates if the data quality problem is due to the source not sending data or if there was problem getting the data from NERC, further helping diagnose the data quality issue.

64 CONFIDENTIAL
©Electric Power Group, LLC. All rights reserved. No portion of this report may be reproduced in any form without prior written consent.
Figure 100: Last Hour Frequency Sources Data Quality Report
ACE Data Quality/Unavailability Report
The ACE data quality and unavailability report (figure 101) provides data quality statistics similar to the report for frequency data sources as described in last section. Additional information regarding Reliability Coordinator (RC) is provided to help resolve the data quality issue by contacting appropriate personnel.
Figure 101: Last Hour ACE Data Quality/Unavailability Report
BA-ACE vs. Interconnection Frequency Comparisons Report
The BA-ACE vs. Interconnection Frequency Comparisons Report (figure 102) lists BAs ACE that was not helping to bring frequency to 60 Hz. The report tracks total minutes interconnection frequency was > 60 Hz or < 60 Hz. It also tracks total minutes BAs ACE was positive or negative. This information is used to calculate total minutes ACE not helping frequency (ACE positive when frequency > 60 Hz and ACE negative when frequency < 60 Hz).
Figure 102: Last Hour BA-ACE vs. Interconnection Frequency Comparisons Report
65 CONFIDENTIAL
©Electric Power Group, LLC. All rights reserved. No portion of this report may be reproduced in any form without prior written consent.
9.2. Analysis and Assessment Reports
The user options dialog to access Analysis and Assessment reports is shown in Figure 103. The Date Time can be entered either explicitly defining “Date Range” (Start Date/Time and End Date/Time) or using “Selection Type” which uses specified End Date/Time and Start Date/Time is calculated when user selects time period. Available time periods are Last Hour (default), Last 24 Hours and Last 7 Days.
Figure 103: Analysis and Assessment Reports User Options
The only report available is “BA-ACE vs. BAAL Comparisons Report” (figure 104). The report is designed to help assess BAs ACE performance compared to its BAAL. Various statistics available for the report are:
Total number of minutes ACE exceeding BAAL
Number of consecutive (1-10, 11-20, 21-30) minute periods ACE exceeding BAAL
maximum consecutive minutes ACE exceeding BAAL
Frequency Bias and L10 of BA
Figure 104: Last Hour BA ACE vs. BAAL Comparisons Report

66 CONFIDENTIAL
©Electric Power Group, LLC. All rights reserved. No portion of this report may be reproduced in any form without prior written consent.
9.3. Situational Awareness Reports
The user options dialog to access Situational Awareness reports is shown in Figure 105. The End Date Time is entered by user and Start Date/Time is calculated when user selects “Report Types” time period. Available time periods are Last 30 Minutes (default), Last 30 Days, Last 60 Days and Last 90 Days. The report is only available at the Interconnection jurisdiction level.
Figure 105: Situational Awareness Reports User Options
The Situational Awareness Reports (figure 106) consists of two sections. The first section “S.A. Resource Adequacy Performance Summary” is a list of Situational Awareness alarms that were triggered in the selected time range. The alarms are grouped by selected Interconnections. The report lists Alarm Type, Alarm Duration (Minutes). The Actual Automatic Load Shed (GW) and the Load Shed Frequency are reported in case of Load Shed Alarms.
The second section “DOE-SA Application Availability” lists the alarms generated due to client visualization application itself becoming unavailable for use during the selected time range. The report lists the Alarm Type (reason for application unavailability), Alarm Date/Time and Alarm Duration (Minutes) indicating when the application became unavailable and the length of unavailability.
Figure 106: Last 90 Days Situational Awareness Reports

67 CONFIDENTIAL
©Electric Power Group, LLC. All rights reserved. No portion of this report may be reproduced in any form without prior written consent.
9.4. Intelligent Alarm Report
The user options dialog to access Intelligent Alarm reports is shown in Figure 107. The report is used to analyze any particular event by automatically generating ACE/Frequency chart (similar to the one described in figure 45). User enters “Event Date/Time” and number of minutes before and after the event. After user clicks “Ok” the application collects all ACE/Frequency data of the selected jurisdiction during the desired time range.
Figure 107: Intelligent Alarm Reports User Options
The report is presented in Microsoft Excel as a cumulative ACE bar chart along with frequency line chart (figure 108). The report requires Microsoft Excel application to be pre-installed and the Excel application should be enabled to allow Visual Basic “Macro” scripts to run and create the chart. The “Raw Data” is also available in a separate chart in the excel worksheet for further analysis.
Figure 108: Event ACE/Frequency Bar/Line Chart

68 CONFIDENTIAL
©Electric Power Group, LLC. All rights reserved. No portion of this report may be reproduced in any form without prior written consent.
9.5. ACE-Frequency Correlations Report
The user options dialog to access ACE-Frequency Correlations Reports is shown in Figure 109. The report is used to analyze the BAs ACE as correlated with Interconnection frequency during frequency alarms generated by the Abnormal Frequency Notification (AFN) system. The higher the correlation, the more the BA is not helping frequency during the Alarming conditions.
1. The user first selects the Start Date/Time and End Date/Time. 2. Select the desired Interconnection to query the alarms for report. 3. In the “Intelligent Alarms Type Options” there is a list of Alarm Types to choose from (each one has
its own frequency and persistence thresholds). Select the Alarm Types using check box. 4. After selecting the desired Alarm Types, click on the button “Show Alarms” to display all the alarms
that match the time duration, jurisdiction and Alarm type in the “Intelligent Alarms Selected” section.
5. From these listed available alarms, select the alarms to use for the report using the “>>” button. 6. Select the ACE Type to be used for the reports from the list 7. Edit any Correlation Parameters if desired or leave them at default settings.
a. Correlation threshold will highlight BAs ACE correlation with frequency greater than the number entered
b. Correlation Plus and Minus Minutes is the number of minutes Plus/Minus the Alarm Date/Time to be used for correlation analysis
c. Ranking decides the criteria to rank the BAs after correlation analysis 8. Click on “Correlations Report” to view the report.
Figure 109: ACE-Frequency Correlations Report User Options
Similar to the previous “Intelligent Alarm” Report, The ACE-Frequency correlations report (figure 110, figure 111, and figure 112) requires Microsoft Excel to be pre-installed and should be enabled to allow Visual Basic “Macro” scripts to run and create the report. There are three separate sections of the report:

69 CONFIDENTIAL
©Electric Power Group, LLC. All rights reserved. No portion of this report may be reproduced in any form without prior written consent.
Top-10 BAs ACE with Highest ACE-Frequency Correlation
The first section of the report lists the top-10 BAs with ACE having highly correlated with Frequency during the duration of time range defined around the selected Alarms. The correlation value is the average of all the ACE-Frequency correlation values as estimated for the selected alarm data. Other information reported is the BA’s RR and RC, its Frequency Bias and L10 values.
Figure 110: ACE-Frequency Correlations Report – Top 10 BAs
List of Alarms and Report Settings
The second section below is the list of alarms selected for the particular alarm type (In figure 111, it is the Short-Term Low Alarms). There is a separate worksheet in the same Excel file for each different alarm type as selected by the user. The information included is the alarm type, description of each alarm, start and end date time, number of alarms, correlation time-window and correlation rank limit.
Figure 111: ACE-Frequency Correlations Report – List of Alarms and Settings
ACE Frequency correlation for all BAs
The last section lists the ACE Frequency correlation numbers for all the BAs (sorted alphabetically) for each Alarm, the other information presented here is the Frequency Bias and the yearly L10. There is additional list on the right, which sorts and lists BAs according to the highest average ACE frequency correlation numbers. This section is generated for each alarm type in a separate worksheet.

70 CONFIDENTIAL
©Electric Power Group, LLC. All rights reserved. No portion of this report may be reproduced in any form without prior written consent.
Figure 112: ACE-Frequency Correlations Report – All BAs ACE Frequency Correlation
9.6. NERC Data Quality Report
The user options dialog to access NERC Data Quality Report is shown in Figure 113. The report is used to analyze and report the data quality and availability of Frequency and ACE data for top 12 BAs with data quality issues. First user selects the End Date/Time and the duration “Report Type” (Last Hour, Last 24 Hours, Last 7 Days, and Last 30 Days). The next section allows setting the upper limit and lower limit for data unavailability percentage. Select desired Interconnection and click “OK” to generate the report. The report can also be exported to Microsoft Excel file for archival, distribution and further analysis purposes.
Figure 113: NERC Data Quality Report User Options
The sample report in figure 114 is the Last 30 Days NERC Data Quality Report for Eastern Interconnection. The top section is the header consisting chart title, interconnection name and time range for the report. The first report is the “BA’s Frequency Data Quality report” which is a bar-chart with bars indicating the percentage of time the reported BAs were not reporting frequency data. The second report is for “BA’s ACE Data Quality” and similar to the frequency report.
The reports contain information regarding the Reliability Region and Reliability Coordinator for the BA and also contact information which can be used to take any corrective action for resolving the data quality issues. The color code “BA Side” in Red refers to the data unavailability percentage which was due to data not being available from BA and color code “NERC Side” in Orange refers to the data unavailability percentage which was due to data not being available from all the BAs (which can be attributed to a data communication problem at NERC). This will help further troubleshoot the data quality issues.

71 CONFIDENTIAL
©Electric Power Group, LLC. All rights reserved. No portion of this report may be reproduced in any form without prior written consent.
The section “Corrective Actions Taken” can be used in the Excel file to manually type any action that has been take to resolve the data quality issues (for archival and reporting purposes). The necessary confidentiality and disclaimer notes are included in the footer.
Figure 114: Last 30 Days NERC ACE-Frequency Data Quality Performance Report

72 CONFIDENTIAL
©Electric Power Group, LLC. All rights reserved. No portion of this report may be reproduced in any form without prior written consent.
9.7. Time Error Correction (TEC) Report
The user options dialog to access Time Error Correction (TEC) Report is shown in Figure 115. The report is used to list the number of times Time Error Correction (TEC) procedure was in effect in the selected date/time range. First user selects the End Date/Time and the duration “Report Type” (Last Hour, Last Day, Last Week (default), Last Month, and Last Year). Then select desired Interconnection and click “OK” to generate the report. The report can also be exported to CSV file format for archival and further analysis purposes.
Figure 115: Time Error Correction (TEC) Report User Options
The sample TEC report for Western Interconnection is shown in figure 116. The top header section contains report title with Interconnection name and report date/time range. The main report lists all the TEC events in the selected date/time range including TEC Start Date/Time, TEC End Date/Time and Scheduled Frequency (Hz).
Figure 116: Last 30 Days’ Time Error Correction (TEC) Report

73 CONFIDENTIAL
©Electric Power Group, LLC. All rights reserved. No portion of this report may be reproduced in any form without prior written consent.
10. Resource Adequacy Logon and Preferences
Click the “Logon & Preferences” tab and the window in Figure 117 appears. The default for “Preferences” is “Database Connectivity and Logon Info”. Clicking on the “Time Zone” drop-down arrow allows selection of time zone for the application. The application automatically converts the data date/time to the date/time for the defined time zone for display purposes. The “Website URL” link is for the data connectivity to the server at NERC which provides data for the application. “Time Offset” is the number of minutes the application data lags the current date/time. This is done to help buffering the data for smooth display. By default it is 2 minutes which has been proven to be ideal. The username and password is provided by NERC to be able to connect to their servers for data. Users should contact NERC for their Username and Password information.
Figure 117: Database Connectivity and Logon Information Menu
The other four available preferences available are to be entered by support team ONLY:
Frequency Threshold – Menu enables support team to change the frequency calculation method for each interconnection (using 1-Minute Min/Max or 1-Minute Average). The second option is to set alarm thresholds for automated alarm e-mail notifications.
Figure 118: Frequency Calculation and Threshold Settings
BAAL Alarm Threshold – This menu enables the support team to change alarm thresholds for frequency when it exceeds BAAL thresholds limits for “Alert”, “Emergency” and “Load Drop” system conditions.

74 CONFIDENTIAL
©Electric Power Group, LLC. All rights reserved. No portion of this report may be reproduced in any form without prior written consent.
Figure 119: BAAL Alarm Threshold Settings
Help File Settings – This option is used to set the website link to access the help files.
Figure 120: Help File Settings

75 CONFIDENTIAL
©Electric Power Group, LLC. All rights reserved. No portion of this report may be reproduced in any form without prior written consent.
11. Wide-Area Resource Adequacy Real-Time Monitoring Help
Clicking on the “Help” tab brings up the NERC Wide-Area Real Time Resource Adequacy Alarming, Monitoring, and Compliance Online Interactive Help page. Clicking on any yellow box with date will bring corresponding quick-help file in PDF format.
Figure 121: Resource Adequacy Application Online Interactive Help page

76 CONFIDENTIAL
©Electric Power Group, LLC. All rights reserved. No portion of this report may be reproduced in any form without prior written consent.
Appendix A: Terms and Definitions
ACTUAL INTERCHANGE: The metered interchange over a specific interconnection between two physically adjacent Balancing Authorities
ADJACENT BALANCING AUTHORITIES: Two Balancing Authorities those are interconnected:
Directly to each other, or
Via a multi-party agreement or transmission tariff. (Examples include Independent System Operator and Power Pool agreements.)
AREA CONTROL ERROR (ACE): The instantaneous difference between net actual and scheduled interchange, taking into account the effects of frequency bias including a correction for meter error.
AREA CONTROL ERROR/L10 (ACE/L10)
AREA INTERCHANGE ERROR: Area Interchange Error survey to determine the Balancing Authority’s Interchange Error(s) due to equipment failures or improper Scheduling operations or improper AGC performance.
AUTOMATIC GENERATION CONTROL (AGC): Equipment that automatically adjusts a Balancing Authority’s generation from a central location to maintain its interchange schedule plus frequency bias.
CLOCK HOUR: The 60-minute period ending at :00. All surveys, measurements, and reports are based on clock hour periods unless specifically noted.
COMMONLY OR JOINTLY OWNED UNITS (COU/JOU): These terms may be used interchangeably to refer to a unit in which two or more BALANCING AUTHORITIES share ownership.
CONTRACT INTERMEDIARY BALANCING AUTHORITY: A NERC Balancing Authority that has connecting facilities in the scheduling path between the “Sending Balancing Authority” and “Receiving Balancing Authorities” and operating agreements that establish the conditions for the use of such facilities.
BALANCING AUTHORITY: An electrical system bounded by interconnection (tie-line) metering and telemetry. It controls generation directly to maintain its Interchange Schedule with other Balancing Authorities and contributes to frequency regulation of the Interconnection.
BALANCING AUTHORITY FREQUENCY BIAS
(CPS): Control Performance Standard
CONTROL PERFORMANCE STANDARD (CPS2): The average ACE for each of the six ten-minute periods during the hour (i.e., for the ten-minute periods ending at 10, 20, 30, 40, 50, and 60 minutes past the hour) must be within specific limits, referred to as L10.
DISTURBANCE CONTROL STANDARD (DCS): The ACE must return either to zero or to its pre- disturbance level within 15 minutes following the start of the disturbance.
DISTURBANCE: 1. Any perturbation to the electric system. 2. The unexpected change in ACE that is caused by the sudden loss of generation or interruption of load.
EPSILON (ε): A constant derived from the targeted frequency found. It is the targeted Root Means Square (RMS) of one-minute average frequency error from a schedule based on frequency performance over a given year.
FREQUENCY BIAS SETTING: A value, in MW/0.1 Hz, set into a Balancing Authority’s AGC equipment to represent a BA’s response to a frequency deviation.
HOURLY VALUE: Data measured on a clock-hour basis.
INADVERTENT INTERCHANGE: The difference between the Balancing Authority’s Net Actual Interchange and Net Scheduled Interchange.

77 CONFIDENTIAL
©Electric Power Group, LLC. All rights reserved. No portion of this report may be reproduced in any form without prior written consent.
INTERCHANGE: Energy transfers that cross Balancing Authority Jurisdictions.
INTERCONNECTION: When capitalized, any one of the three bulk electric system networks in North America: Eastern, Western, and ERCOT. When not capitalized, the facilities that connect two systems or Balancing Authorities.
L10: See Control Performance Standard (CPS2)
OPERATING RESERVE: That capability above firm system demand required to provide for regulation; load-forecasting error, equipment forced and scheduled outages and local area protection. It consists of spinning and non-spinning reserve.
OPERATING SECURITY: The ability of a power system to withstand or limit the adverse effects of any credible contingency to the system including overloads beyond emergency ratings, excessive or inadequate voltage, loss of stability or abnormal frequency deviations.
OPERATING SECURITY LIMIT: The value of a system operating parameter (e.g. total power transfer across an interface) that satisfies the most limiting of prescribed pre- and post- contingency operating criteria as determined by equipment loading capability and acceptable stability and voltage conditions.
PHYSICALLY ADJACENT BALANCING AUTHORITIES: Two Balancing Authorities that are directly interconnected with each other.
REGION: One of the NERC Reliability Councils.
SCHEDULE (verb): To set up a plan or arrangement for an Interchange Transaction.
SCHEDULE (noun): An Interchange Schedule.
SCHEDULING PATH: The Transmission Service arrangements reserved by the Purchasing- Selling Entity for a Transaction.
SCHEDULED TOTAL INTERCHANGE: The net of all Interchange Schedules with all Adjacent Balancing Authorities. It is, in essence, the scheduled interchange with the Interconnection.
SECURITY AREA: The group of Balancing Authorities under the purview of a Reliability Coordinator.
RELIABILITY COORDINATOR: An entity that provides the security assessment and emergency operations coordination for a group of Balancing Authorities. Reliability Coordinators must not participate in the wholesale or retail merchant functions.
RELIABILITY COORDINATOR FUNCTION: The process of maintaining bulk transmission security for a Balancing Authority, group of Balancing Authorities, sub region, etc.
RELIABILITY COORDINATOR INFORMATION SYSTEM (SCIS): A generic reference to the communication system in the Eastern Interconnection, the WSCCnet (Western Interconnection), and the ERCOT Communication System as applicable.
SUPERVISORY CONTROL AND DATA ACQUISITION (SCADA): A system of remote control and telemetry used to monitor and control the transmission system.
SPINNING RESERVE: Unloaded generation that is synchronized and ready to serve additional demand.
TOTAL ACTUAL INTERCHANGE: The algebraic sum of all Interchange metered with all Physically Adjacent Balancing Authorities. It is, in essence, the actual interchange with the Interconnection.