User-Project : W2P TRL 5 validation Hybrid Floating …€¦ · User-Project: W2P TRL 5 validation...
23
Infrastructure Access ReportUEDIN Curved Wave Tank Infrastructure: UEDIN FloWave All-Waters Current and Wave Test Facility User-Project: W2P TRL 5 validation Hybrid Floating Platforms in Deep Waters (Phase IV) EnerOcean SL/ Pelagic Power AS Marine Renewables Infrastructure Network Status: Final Version: 03 Date: 29-Jul-2015 EC FP7 “Capacities” Specific Programme Research Infrastructure Action
Transcript of User-Project : W2P TRL 5 validation Hybrid Floating …€¦ · User-Project: W2P TRL 5 validation...

Infrastructure Access ReportUEDIN Curved Wave Tank
Infrastructure: UEDIN FloWave All-Waters Current and Wave Test Facility
User-Project: W2P TRL 5 validation
Hybrid Floating Platforms in Deep Waters (Phase IV)
EnerOcean SL/ Pelagic Power AS
Marine Renewables Infrastructure Network
Status: Final Version: 03 Date: 29-Jul-2015
EC FP7 “Capacities” Specific Programme
Research Infrastructure Action

Infrastructure Access Report: W2P TRL 5 validation
Rev. 02, 28-Jul-2015 Page 2 of 23
ABOUT MARINET MARINET (Marine Renewables Infrastructure Network for emerging Energy Technologies) is an EC-funded network of research centres and organisations that are working together to accelerate the development of marine renewable energy - wave, tidal & offshore-wind. The initiative is funded through the EC's Seventh Framework Programme (FP7) and runs for four years until 2015. The network of 29 partners with 42 specialist marine research facilities is spread across 11 EU countries and 1 International Cooperation Partner Country (Brazil). MARINET offers periods of free-of-charge access to test facilities at a range of world-class research centres. Companies and research groups can avail of this Transnational Access (TA) to test devices at any scale in areas such as wave energy, tidal energy, offshore-wind energy and environmental data or to conduct tests on cross-cutting areas such as power take-off systems, grid integration, materials or moorings. In total, over 700 weeks of access is available to an estimated 300 projects and 800 external users, with at least four calls for access applications over the 4-year initiative. MARINET partners are also working to implement common standards for testing in order to streamline the development process, conducting research to improve testing capabilities across the network, providing training at various facilities in the network in order to enhance personnel expertise and organising industry networking events in order to facilitate partnerships and knowledge exchange. The aim of the initiative is to streamline the capabilities of test infrastructures in order to enhance their impact and accelerate the commercialisation of marine renewable energy. See www.fp7-marinet.eu for more details.
Partners
Ireland
University College Cork, HMRC (UCC_HMRC) Coordinator
Sustainable Energy Authority of Ireland (SEAI_OEDU)
Denmark
Aalborg Universitet (AAU)
Danmarks Tekniske Universitet (RISOE)
France
Ecole Centrale de Nantes (ECN)
Institut Français de Recherche Pour l'Exploitation de la Mer (IFREMER)
United Kingdom
National Renewable Energy Centre Ltd. (NAREC)
The University of Exeter (UNEXE)
European Marine Energy Centre Ltd. (EMEC)
University of Strathclyde (UNI_STRATH)
The University of Edinburgh (UEDIN)
Queen’s University Belfast (QUB)
Plymouth University(PU)
Spain
Ente Vasco de la Energía (EVE)
Tecnalia Research & Innovation Foundation (TECNALIA)
Belgium
1-Tech (1_TECH)
Netherlands
Stichting Tidal Testing Centre (TTC)
Stichting Energieonderzoek Centrum Nederland (ECNeth)
Germany
Fraunhofer-Gesellschaft Zur Foerderung Der Angewandten Forschung E.V (Fh_IWES)
Gottfried Wilhelm Leibniz Universität Hannover (LUH)
Universitaet Stuttgart (USTUTT)
Portugal
Wave Energy Centre – Centro de Energia das Ondas (WavEC)
Italy
Università degli Studi di Firenze (UNIFI-CRIACIV)
Università degli Studi di Firenze (UNIFI-PIN)
Università degli Studi della Tuscia (UNI_TUS)
Consiglio Nazionale delle Ricerche (CNR-INSEAN)
Brazil
Instituto de Pesquisas Tecnológicas do Estado de São Paulo S.A. (IPT)
Norway
Sintef Energi AS (SINTEF)
Norges Teknisk-Naturvitenskapelige Universitet (NTNU)

Infrastructure Access Report: W2P TRL 5 validation
Rev. 02, 28-Jul-2015 Page 3 of 23
DOCUMENT INFORMATION Title Hybrid Floating Platforms in Deep Waters (Phase IV)
Distribution Public
Document Reference MARINET-TA1-W2P TRL 5 validation
User-Group Leader, Lead
Author
Pedro Mayorga EnerOcean SL
User-Group Members,
Contributing Authors
Reza Hezari Pelagic Power SA Miguel Ángel Jaime EnerOcean SL Javier Fernández EnerOcean SL
Infrastructure Accessed: UEDIN FloWave All-Waters Current and Wave Test Facility
Infrastructure Manager
(or Main Contact)
Thomas Davey
REVISION HISTORY Rev. Date Description Prepared by
(Name)
Approved By
Infrastructure
Manager
Status
(Draft/Final)
01 24/07/2015 First draft Javier Fernández Draft
02 28/07/2015 Second draft Javier Fernández
29/07/2015 Final draft

Infrastructure Access Report: W2P TRL 5 validation
Rev. 02, 28-Jul-2015 Page 4 of 23
ABOUT THIS REPORT One of the requirements of the EC in enabling a user group to benefit from free-of-charge access to an infrastructure is that the user group must be entitled to disseminate the foreground (information and results) that they have generated under the project in order to progress the state-of-the-art of the sector. Notwithstanding this, the EC also state that dissemination activities shall be compatible with the protection of intellectual property rights, confidentiality obligations and the legitimate interests of the owner(s) of the foreground. The aim of this report is therefore to meet the first requirement of publicly disseminating the knowledge generated through this MARINET infrastructure access project in an accessible format in order to:
• progress the state-of-the-art
• publicise resulting progress made for the technology/industry
• provide evidence of progress made along the Structured Development Plan
• provide due diligence material for potential future investment and financing
• share lessons learned
• avoid potential future replication by others
• provide opportunities for future collaboration
• etc. In some cases, the user group may wish to protect some of this information which they deem commercially sensitive, and so may choose to present results in a normalised (non-dimensional) format or withhold certain design data – this is acceptable and allowed for in the second requirement outlined above.
ACKNOWLEDGEMENT The work described in this publication has received support from MARINET, a European Community - Research Infrastructure Action under the FP7 “Capacities” Specific Programme.
LEGAL DISCLAIMER The views expressed, and responsibility for the content of this publication, lie solely with the authors. The European Commission is not liable for any use that may be made of the information contained herein. This work may rely on data from sources external to the MARINET project Consortium. Members of the Consortium do not accept liability for loss or damage suffered by any third party as a result of errors or inaccuracies in such data. The information in this document is provided “as is” and no guarantee or warranty is given that the information is fit for any particular purpose. The user thereof uses the information at its sole risk and neither the European Commission nor any member of the MARINET Consortium is liable for any use that may be made of the information.

Infrastructure Access Report: W2P TRL 5 validation
Rev. 02, 28-Jul-2015 Page 5 of 23
EXECUTIVE SUMMARY This was the fourth access granted to this User Group under Marinet program. After the concept validation at 1:100 scale achieved in the previous rounds of tests under Marinet program, the tests here focus on the same model but at higher scale (1:40) for initiate the design validation. The model, prepared in Málaga, includes the measurement of the effects of wind, wave and current. As a floating platform the mounting system is a mooring system, suitable for testing at different operative and survival configurations, moored at 80 meters depth (corresponding to 2 meters at 1:40 scale). The instrumentation used in addition to the motion capture system are: load cells in the mooring lines, acceleration sensor in the nacelles and parts of the structure. The present investigation can be divided in two parts: the first part includes the analysis of motion response of platform with wind effect and without WECs. The second includes the same tests with wind effect and WECs, a total of 10. It was possible to perform a high number of tests (regular, normal and extreme seas combined with wind effect simulation, wave direction angle and spreading, and current presence). The results were satisfactory and allow further improvements in the iterative design loop of the W2Power concept.

Infrastructure Access Report: W2P TRL 5 validation
Rev. 02, 28-Jul-2015 Page 6 of 23
CONTENTS
1 INTRODUCTION & BACKGROUND.................................................................................................................. 7
1.1 INTRODUCTION ....................................................................................................................................................7 1.2 DEVELOPMENT SO FAR..........................................................................................................................................7 1.2.1 Stage Gate Progress ....................................................................................................................................8 1.2.2 Plan For This Access..................................................................................................................................... 9
2 OUTLINE OF WORK CARRIED OUT.................................................................................................................10
2.1 SETUP...............................................................................................................................................................10 2.2 TESTS ...............................................................................................................................................................15 2.2.1 Test Plan ....................................................................................................................................................17
2.3 RESULTS............................................................................................................................................................18 2.4 ANALYSIS & CONCLUSIONS...................................................................................................................................21
3 MAIN LEARNING OUTCOMES .......................................................................................................................21
3.1 PROGRESS MADE ...............................................................................................................................................21 3.1.1 Progress Made: For This User-Group or Technology.................................................................................21 3.1.2 Progress Made: For Marine Renewable Energy Industry ..............................Error! Bookmark not defined.
3.2 KEY LESSONS LEARNED ........................................................................................................................................21
4 FURTHER INFORMATION..............................................................................................................................21
4.1 SCIENTIFIC PUBLICATIONS ....................................................................................................................................22 4.2 WEBSITE & SOCIAL MEDIA...................................................................................................................................22
5 REFERENCES ................................................................................................................................................22
6 APPENDICES ................................................................................................................................................22
6.1 STAGE DEVELOPMENT SUMMARY TABLE ................................................................................................................22 6.2 ANY OTHER APPENDICES ........................................................................................ERROR! BOOKMARK NOT DEFINED.

Infrastructure Access Report: W2P TRL 5 validation
Rev. 02, 28-Jul-2015 Page 7 of 23
1 INTRODUCTION & BACKGROUND
1.1 INTRODUCTION W2Power is a novel hybrid floating platform for wind and wave energy utilisation in deep water areas. It consists of a deckless, ultra-lightweight triangular semi-submersible platform carrying two standard offshore wind turbines and three linear arrays of wave energy converters. The development is led by SMEs – EnerOcean from Spain and Pelagic Power from Norway - and has benefited from additional predesign by Acciona Energia and NTNU in the MARINA Platform project as well as some additional work carried out inside TROPOS project, where the W2Power platform was selectd for study as an energy producing “satellite unit”. Mobilising wave energy resources in addition to the wind resources enables the delivery of renewable electricity also when the wind is low and provides better economics compared to adding more wind capacity, Aquaculture is a promising add-on. W2Power is anchored by a rotational mooring and slack moorings so that it always faces the wind (wind-vaning).
Figure 1 – W2Power model at 1/100 scale at the Curved Wave Tank, Edinburgh
1.2 DEVELOPMENT SO FAR After two test periods at 1:100 scale at the Curved Wave Tank in Edinburgh (November2012/Jan2013 and July 2013) and testing periods in April, June and August 2014 at Beaufort Research, UCC Cork, we have completed the following studies:
- Selection of the more stable platform to hold Wind and Wave converters.Nov 2012 to Jan 2013 - Selection of the more effective wave absorbers and configuration. Nov 2012 to Jan2013, validated July 2013 - Study of the influence of a large amount of wave energy capacity on normal and extreme operation of the
platform in three configurations: Working WECs, Fixed/survival mode and No WECs/base case. July 2013 - WECs control optimization, further study of moorings. August 2014

Infrastructure Access Report: W2P TRL 5 validation
Rev. 02, 28-Jul-2015 Page 8 of 23
1.2.1 Stage Gate Progress
Previously completed: � Planned for this project: �
STAGE GATE CRITERIA Status
Stage 1 – Concept Validation
• Linear monochromatic waves to validate or calibrate numerical models of the system (25 – 100 waves) �
• Finite monochromatic waves to include higher order effects (25 –100 waves)
• Hull(s) sea worthiness in real seas (scaled duration at 3 hours) �
• Restricted degrees of freedom (DofF) if required by the early mathematical models �
• Provide the empirical hydrodynamic co-efficient associated with the device (for mathematical modelling tuning)
�
• Investigate physical process governing device response. May not be well defined theoretically or numerically solvable
�
• Real seaway productivity (scaled duration at 20-30 minutes) �
• Initially 2-D (flume) test programme
• Short crested seas need only be run at this early stage if the devices anticipated performance would be significantly affected by them
�
• Evidence of the device seaworthiness �
• Initial indication of the full system load regimes
Stage 2 – Design Validation
• Accurately simulated PTO characteristics �
• Performance in real seaways (long and short crested) �
• Survival loading and extreme motion behaviour. �
• Active damping control (may be deferred to Stage 3) �
• Device design changes and modifications �
• Mooring arrangements and effects on motion �
• Data for proposed PTO design and bench testing (Stage 3)
• Engineering Design (Prototype), feasibility and costing �
• Site Review for Stage 3 and Stage 4 deployments
• Over topping rates
Stage 3 – Sub-Systems Validation
• To investigate physical properties not well scaled & validate performance figures �
• To employ a realistic/actual PTO and generating system & develop control strategies �
• To qualify environmental factors (i.e. the device on the environment and vice versa) e.g. marine growth, corrosion, windage and current drag
�
• To validate electrical supply quality and power electronic requirements.
• To quantify survival conditions, mooring behaviour and hull seaworthiness �
• Manufacturing, deployment, recovery and O&M (component reliability) �
• Project planning and management, including licensing, certification, insurance etc.
Stage 4 – Solo Device Validation
• Hull seaworthiness and survival strategies �
• Mooring and cable connection issues, including failure modes �

Infrastructure Access Report: W2P TRL 5 validation
Rev. 02, 28-Jul-2015 Page 9 of 23
STAGE GATE CRITERIA Status
• PTO performance and reliability
• Component and assembly longevity
• Electricity supply quality (absorbed/pneumatic power-converted/electrical power)
• Application in local wave climate conditions �
• Project management, manufacturing, deployment, recovery, etc
• Service, maintenance and operational experience [O&M]
• Accepted EIA
Stage 5 – Multi-Device Demonstration
• Economic Feasibility/Profitability
• Multiple units performance
• Device array interactions
• Power supply interaction & quality
• Environmental impact issues
• Full technical and economic due diligence
• Compliance of all operations with existing legal requirements
1.2.2 Plan For This Access
The model will be an evolution of the model tested in the previous test but at higher scale (1:40), built in a combination of materials, to be prepared in Malaga, disassembled and assemble. The model testing included the measurement of the effects of wind, wave and current. As a floating platform the mounting system will be mainly a mooring system, suitable for testing at different operative and survival configurations, of a platform moored at 80 meters depth ( 2 meters and at 1:40 scale). The mooring connection to the floating platform will be through a rotating connection. We have defined 4 configurations of the platform combining:
- Full platform without wind force nor WECs (wave energy converters) installed - Full platform with wind force represented (see 2.1.2.) - Full platform with WECs fixed in neutral buoyant position and max wind force - Full platform with WECs free to move with zero-damping PTO ) and max wind force
For each configuration a selection of 40 tests (regular, normal and extreme seas combined with wind effect simulation, wave direction angle and spreading, and current presence) were performed.

Infrastructure Access Report: W2P TRL 5 validation
Rev. 02, 28-Jul-2015 Page 10 of 23
2 OUTLINE OF WORK CARRIED OUT
2.1 SETUP
2.1.1 Physical model
The model of 1:40 scale was manufactured in Málaga, Spain, with PVC pipes of dimensions and thicknesses depending of equivalent scale weights in all its parts. The model of W2Power was fabricated with hydrodynamic damping structures (heave plates) and using variable mooring components thus allowing different combinations of these important elements. The Figure 2 shows some pictures of manufacturing and assembly the model by EnerOcean, Málaga. Also the EnerOcean tests tank has been used to verify sealing and balancing weights.
Figure 2 - Manufacturing and assembly of the W2power model in Málaga
2.1.2 Mooring & Wind
A preliminary catenary mooring design with 3 lines (3 lines around 8 meters long, 120 degrees between lines) was used. The three lines were connected to a swivel that was fixed to the front column. The platform is designed to be
wind-vanning so it rotates depending on the wind direction to orient the wind turbines in
Infrastructure Access Report: W2P TRL 5 validation
Rev. 02, 28-Jul-2015 Page 11 of 23
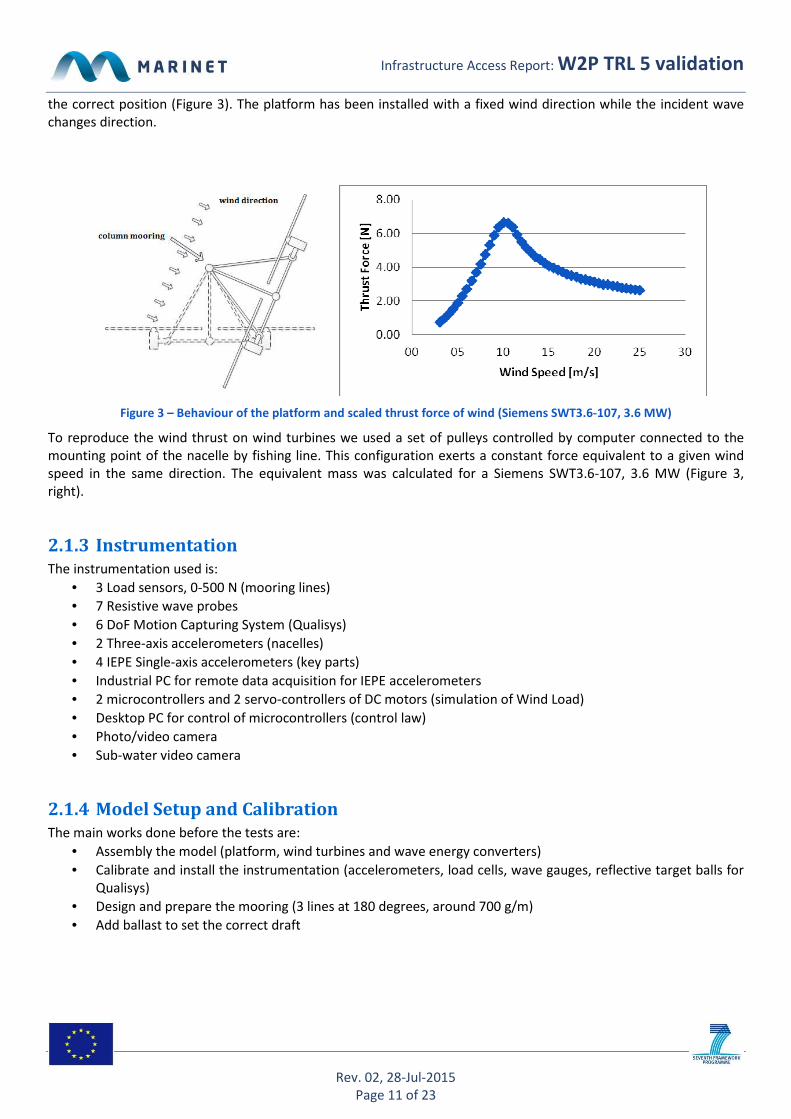
the correct position (Figure 3). The platform has been installed with a fixed wind direction while the incident wave changes direction.
Figure 3 – Behaviour of the platform and scaled thrust force of wind (Siemens SWT3.6-107, 3.6 MW)
To reproduce the wind thrust on wind turbines we used a set of pulleys controlled by computer connected to the mounting point of the nacelle by fishing line. This configuration exerts a constant force equivalent to a given wind speed in the same direction. The equivalent mass was calculated for a Siemens SWT3.6-107, 3.6 MW (Figure 3, right).
2.1.3 Instrumentation
The instrumentation used is:
• 3 Load sensors, 0-500 N (mooring lines)
• 7 Resistive wave probes
• 6 DoF Motion Capturing System (Qualisys)
• 2 Three-axis accelerometers (nacelles)
• 4 IEPE Single-axis accelerometers (key parts)
• Industrial PC for remote data acquisition for IEPE accelerometers
• 2 microcontrollers and 2 servo-controllers of DC motors (simulation of Wind Load)
• Desktop PC for control of microcontrollers (control law)
• Photo/video camera
• Sub-water video camera
2.1.4 Model Setup and Calibration
The main works done before the tests are:
• Assembly the model (platform, wind turbines and wave energy converters)
• Calibrate and install the instrumentation (accelerometers, load cells, wave gauges, reflective target balls for Qualisys)
• Design and prepare the mooring (3 lines at 180 degrees, around 700 g/m)
• Add ballast to set the correct draft

Infrastructure Access Report: W2P TRL 5 validation
Rev. 02, 28-Jul-2015 Page 12 of 23
Column Unit Value
A kg 6.52
B kg 6.62
C kg 6.68
Figure 4 – Total weight of ballast in columns
The Figure 5 shows subsystems of platform, sensors and motors for wind turbine and wind thrust.
Figure 5 – Details of sensors and subsystems of the W2Power model

Infrastructure Access Report: W2P TRL 5 validation
Rev. 02, 28-Jul-2015 Page 13 of 23
In the top left image it can be seen the transition piece of the angled tower addition to the heave plate in the column, and right, chains in the mooring point with load cells. In bottom left the system of rotation of the turbine along with a target ball for Qualisys. To the right is the wind simulation system running.

Infrastructure Access Report: W2P TRL 5 validation
Rev. 02, 28-Jul-2015 Page 14 of 23
The model, ready to be tested without wave converters, is shown in Figure 6. Behind the model is the absorption beach to reduce the reflected waves in the tank. Figure 7 shows the platform with WECs (free) during a extreme survival test.
Figure 6 – The W2Power model without WECs ready for testing at FloWave TT
Figure 7 – Sea state extreme survival with WECs (free)

Infrastructure Access Report: W2P TRL 5 validation
Rev. 02, 28-Jul-2015 Page 15 of 23
2.2 TESTS
2.2.1 Regular Seas
The sea states chosen for regular waves combine seven frequencies and three wave height. These are presented in Table 1.
Table 1 – Regular waves for W2Power
REGULAR SEAS REGULAR SEAS REGULAR SEAS Nº
T (s) H (m) T (s) H (mm) Nº
T (s) H (m) T (s) H (mm) Nº
T (s) H (m) T (s) H (mm)
1 18.0 6.0 2.8 150.0 8 18.0 4.0 2.8 100.0 15 18.0 2.0 2.8 50.0
2 16.0 6.0 2.5 150.0 9 16.0 4.0 2.5 100.0 16 16.0 2.0 2.5 50.0
3 14.0 6.0 2.2 150.0 10 14.0 4.0 2.2 100.0 17 14.0 2.0 2.2 50.0
4 12.0 6.0 1.9 150.0 11 12.0 4.0 1.9 100.0 18 12.0 2.0 1.9 50.0
5 10.0 6.0 1.6 150.0 12 10.0 4.0 1.6 100.0 19 10.0 2.0 1.6 50.0
6 8.0 6.0 1.3 150.0 13 8.0 4.0 1.3 100.0 20 8.0 2.0 1.3 50.0
7 6.5 6.0 1.0 150.0 14 6.5 4.0 1.0 100.0 21 6.5 2.0 1.0 50.0
2.2.2 Irregular Seas
The sea states chosen for irregular waves are the same of the previous set of tests conducted before in previous Marinet access, however the scales are different (1:40 instead of 1:100) and the three smaller normal sea states were abandoned due to the short testing time . These are presented in Table 2.
Table 2 – Sea states of JONSWAP spectrum for W2Power
NORMAL SEAS SURVIVAL SEAS State
Tp (s) Hs (m) Gamma Tp (s) Hs (mm) Tp (s) Hs (m) Gamma Tp (s) Hs (mm)
A 8.5 0.75 1 1.3 18.8 7 3 3.3 1.1 75.0
B 11.5 0.75 1 1.8 18.8 8 4.5 3.3 1.3 112.5
C 14.5 0.75 1 2.3 18.8 10 6.5 3.3 1.6 162.5
D 8.5 2.25 1 1.3 56.3 12.5 5.5 3.3 2.0 137.5
E 11.5 2.25 1 1.8 56.3 15 5 3.3 2.4 125.0
F 14.5 2.25 1 2.3 56.3 8 4.5 1 1.3 112.5
G 8.5 3.75 1 1.3 93.8 8 4.5 5 1.3 112.5
H 11.5 3.75 1 1.8 93.8 12.5 5.5 1 2.0 137.5
I 14.5 3.75 1 2.3 93.8 12.5 5.5 5 2.0 137.5
Irregular waves of survival with currents and extreme survival are presented in Table 3.
Table 3 – Sea states with currents or spreading
SURVIVAL SEAS WITH CURRENTS State
Vc (m/s) Tp (s) Hs (m) Gamma Vc (m/s) Tp (s) Hs (mm)
Cc 1 10 6.5 3.3 0.158 1.6 162.5
Dc 1 12.5 5.5 3.3 0.158 2.0 137.5
Ec 1 15 5 3.3 0.158 2.4 125.0

Infrastructure Access Report: W2P TRL 5 validation
Rev. 02, 28-Jul-2015 Page 16 of 23
EXTREME SURVIVAL SEAS WITH SPREADING State
Vc (m/s) Tp (s) Hs (m) Gamma Vc (m/s) Tp (s) Hs (mm)
EXT 0 14.0405128 12 3.3 0.000 2.2 300.0

Infrastructure Access Report: W2P TRL 5 validation
Rev. 02, 28-Jul-2015 Page 17 of 23
2.2.3 Test Plan
We have defined 4 configurations of the platform combining: - Full platform without wind force or WECs - Full platform with wind force - Full platform with WECs (fixed) and max wind force - Full platform with WECs (free) and max wind force
With a total of 20 hours of testing, 77 regular tests and 36 irregular tests (normal and survival).
Table 4 – Tests on W2Power model for different operating modes
0 degrees
30 degrees
Spreading seas
Reg
ula
r se
as
No
rmal
sea
s
Surv
ival
wit
ho
ut
curr
ents
Surv
ival
wit
h c
urr
ents
Reg
ula
r se
as
No
rmal
sea
s
Surv
ival
wit
ho
ut
curr
ents
Surv
ival
wit
h c
urr
ents
Extr
eme
surv
ival
Hours
Tuesday Basic Full platform without wind force or WECs 21 1 0 0 0 0 0 0 1.78
Wednesday Basic Wind Full platform with wind force 21 7 3 0 7 3 1 0 1 8.37
Thursday & Friday
Operational Wind&Wave
Full platform with WECs (fixed) and max wind force
21 7 3 1 7 3 1 0 1 8.99
Friday Operational Wind&Wave
Full platform with WECs (free) and max wind force
0 3 0 0 0 0 0 0 1 1.62

Infrastructure Access Report: W2P TRL 5 validation
Rev. 02, 28-Jul-2015 Page 18 of 23
2.3 RESULTS This section presents some preliminary results of platform motion and other interesting values like the calculated efficiency of WECs. Due to IP-sensitive information in this project, only a few data can be shown. As an example, the data for the motions of the body (referred to the center of gravity of the platform) without analysis are shown in Figure 8. Sea state is irregular without currents (Normal E, 1.8 s and 56.3 mm). The offset of surge and pitch is due to wind thrust, 170 mm and 4 degrees. However, in sway and yaw the difference is a deviation of the initial position. Heave is identical despite of offset.
Figure 8 - Behaviour of W2power in sea state Normal E between cases with and without wind

Infrastructure Access Report: W2P TRL 5 validation
Rev. 02, 28-Jul-2015 Page 19 of 23
In order to compare the influence of different configurations of the platform movements, the figures 9, 10 and 11 show RAO’s (relativised to the no-wind case) of heave, surge and pitch. From the collected data and for the wave conditions tested, the presence of the wind load seems not to have a significant influence on the movements of the platform compared to the case without it. However, the presence of fixed WECs, representing the maximum force that the WEC’s can transfer to the platform significantly affect heave motions, mainly due to the added buoyancy.
Figure 9 – Relative RAO for heave in different operating modes
The RAO for surge is seen to decrease consistently for periods between 6 and 10 seconds, probably as a consequence of the added inertia due to the converters.
Figure 10 - Relative RAO for heave in different operating modes
Finally, the RAO for pitch behaves similarly to that for surge. For periods between 6 and 16 sec, the mean amplitude is around 50 % compared to the case without wind thrust.

Infrastructure Access Report: W2P TRL 5 validation
Rev. 02, 28-Jul-2015 Page 20 of 23
Figure 11 – Relative RAO for Pitch in different operating modes
The normal operation tests were done using of long-crested waves. Table 5 defines the six sea states run.
Table 5 – Sea states for the normal operational tests
NORMAL SEAS
State Tp (s) Hs (m) Gamma
D 8.5 2.25 1
E 11.5 2.25 1
F 14.5 2.25 1
G 8.5 3.75 1
H 11.5 3.75 1
I 14.5 3.75 1
The maximum nacelle acceleration is a major design criterion. Fig. 12 shows maximum accelerations on nacelles for each DoF.Most values are 0.1 to 0.2 G, with the highest (possibly spurious) data point 3.06 m/s2, or about 0.31 G,.
Fig. 12 – Maximum accelerations on nacelles, A (starboard) and B (port) respectively

Infrastructure Access Report: W2P TRL 5 validation
Rev. 02, 28-Jul-2015 Page 21 of 23
2.4 ANALYSIS & CONCLUSIONS Analysis is still ongoing as of the date of preparation of this report. The main initial conclusions are:
• The mooring design was fully validated, both in movement’s restriction and in maximum loads in the mooring lines.
• The survival operation mode of the platform with WECs is better when converters are strapped down.
• When the wind blows in a different direction, than the wave attack angle, this does not affect significantly the production of wind turbines since the waves are only able to deflect the platform with respect to wind a few degrees.
• Limited currents (<1 m/s full scale) don`t affect significantly the general behaviour of platform.
• The maximum acceleration measured in normal and survival operations are in line with results of previous MARINET testing.
• Motion control to simulate wind effect with a set of pulleys and fishing line is a good system that can include thrust forces, inertias, thrust relative to movements and others.
• Our independent monitoring system to measure accelerations in the platform with industrial sensors and devices has worked as planned, validating the SEAMAR project results.
• RAOs are similar to results of previous of MARINET test ing on the, full platform at 1/100 scale, when including rotating inertia of wind turbines and wind thrust effects.
3 MAIN LEARNING OUTCOMES
3.1 PROGRESS MADE
3.1.1 Progress Made: For This User-Group or Technology
In the First series of MARINET testing, focus was in testing of two configurations of the original concepts mainly in global motion response and stability. In the Second and Third series of tests the focus was in performance and behaviour in energy production stages, and on WECs isolated and array performance. In this set of tests, focus in the validation at higher scale of the platform, establishing the operational limits and survival behaviour in real seas combining wind, wave and currents.. The analysed and interpreted tank test results will be fed forward into the interactive design loop and used to derive an optimised design suitable for scaling up the W2Power platform in further stages. During this new access, the objectives achieved are: - Validation of the operational limits (when to pass from operation mode to survival mode), validation of the whole platform including wind system, mooring design and wave converters in order to estimate more precisely power production from wind and wave converters for the full platform at higher scale. - To check the global operation of the platform in a combined Wind, Wave and Current scenario.
3.2 KEY LESSONS LEARNED • Manufacturing as a modular model greatly facilitates transport and allows check for leaks independently.
• Leak checking, balancing weights, installing wires and sensors prior to testing saves preparation time in tank.
• The use of a set of pulleys controlled by computer to simulate the effect of wind on a wind turbine is not very complex and allows better behaviour without significant added inertias and allows the possibility of changing the thrust in real time.
• The right survival mode selection can improve significantly the behaviour of the platform in extreme wave conditions (survival conditions).
• The number of tests performed at the end were less than programmed due to usual troubleshooting of a new model in a new tank.
4 FURTHER INFORMATION

Infrastructure Access Report: W2P TRL 5 validation
Rev. 02, 28-Jul-2015 Page 22 of 23
4.1 SCIENTIFIC PUBLICATIONS List of any scientific publications made (already or planned) as a result of this work:
• An overview paper with first summary of these results obtained here has been submitted to a selected international conference.
• A paper called “Design and Performance Validation of a Hybrid Offshore Renewable Energy Platform." has been submitted and will be presented to the IEEE EVER 2015 to be held in Monaco in April 2015.
• EnerOcean showed the testing plan and previous results of testing in previous phase in the MARINET users conference held in ROME MARINET USERWORKSHOP 6th of November 2013.
• Part of these results has been published in the Technical deliverables of Wp3 and Wp4 FP7 TROPOS project.
• A presentation in the Spanish APPA Marina session in Genera Energy conference held in Madrid in February 2015 shown part of the results.
4.2 WEBSITE & SOCIAL MEDIA Websites: www.pelagicpower.no www.enerocean.com www.w2power.com
5 REFERENCES Hanssen, J.; Margheritini, L.; O'Sullivan, K.; Mayorga, P.; Martinez, I.; Arriaga, A.; Agos, I.; Steynor, J.; Ingram, D.; Hezari, R.; Todalshaug, J.H., "Design and performance validation of a hybrid offshore renewable energy platform,"Ecological Vehicles and Renewable Energies
(EVER), 2015 Tenth International Conference on , vol., no., pp.1,8, March 31 2015-April 2 2015
6 APPENDICES
6.1 STAGE DEVELOPMENT SUMMARY TABLE The table following offers an overview of the test programmes recommended by IEA-OES for each Technology Readiness Level. This is only offered as a guide and is in no way extensive of the full test programme that should be committed to at each TRL.

Infrastructure Access Report: W2P TRL 5 validation
Rev. 02, 28-Jul-2015 Page 23 of 23