Usefulness of Comprehensive Income Reporting in Hong...
31
Usefulness of Comprehensive Income Reporting in Hong Kong BY Lau Ka Pik, Karrie 07016522 BBA/ACCT AND Lee Kam Ha, Alice 07009348 BBA/ACCT A Honours Degree Project Submitted to the School of Business in Partial Fulfilment Of the Graduation Requirement for the Degree of Bachelor of Business Administration (Honours) Hong Kong Baptist University Hong Kong April 2010
Transcript of Usefulness of Comprehensive Income Reporting in Hong...
Usefulness of Comprehensive Income Reporting in Hong Kong
BY
Lau Ka Pik, Karrie 07016522
BBA/ACCT
AND
Lee Kam Ha, Alice 07009348
BBA/ACCT
A Honours Degree Project Submitted to the School of Business in Partial Fulfilment
Of the Graduation Requirement for the Degree of Bachelor of Business Administration (Honours)
Hong Kong Baptist University Hong Kong
April 2010
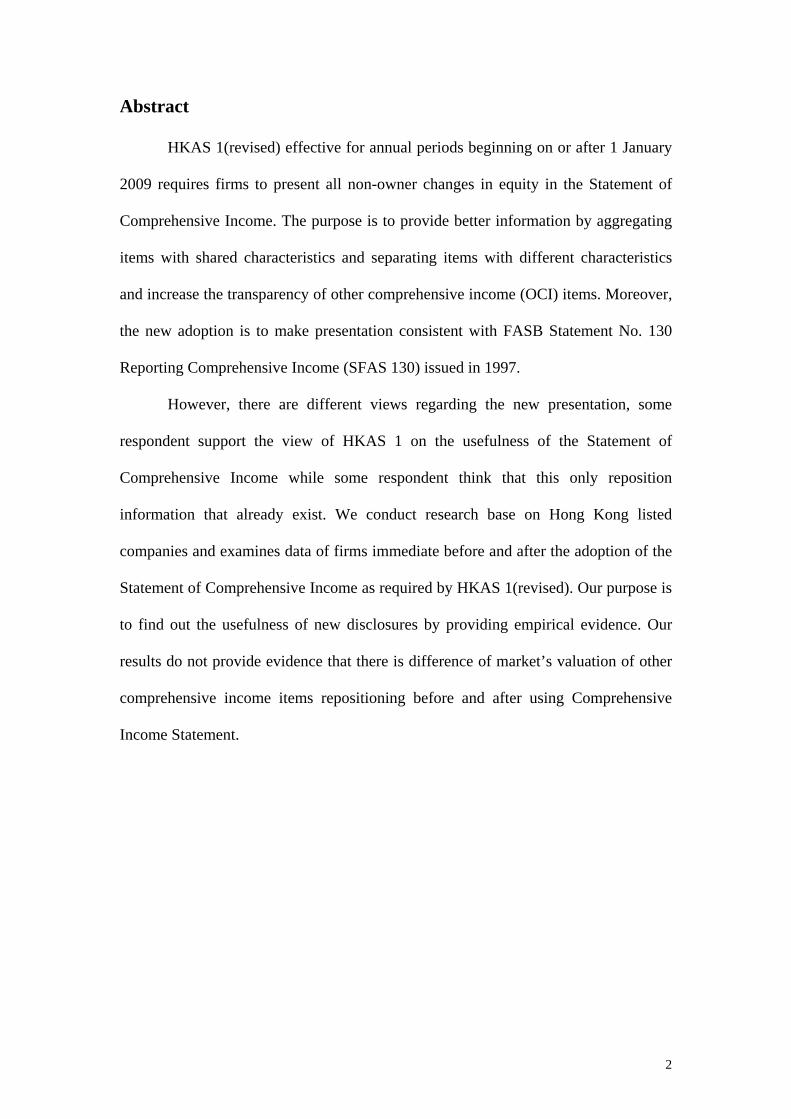
Abstract
HKAS 1(revised) effective for annual periods beginning on or after 1 January
2009 requires firms to present all non-owner changes in equity in the Statement of
Comprehensive Income. The purpose is to provide better information by aggregating
items with shared characteristics and separating items with different characteristics
and increase the transparency of other comprehensive income (OCI) items. Moreover,
the new adoption is to make presentation consistent with FASB Statement No. 130
Reporting Comprehensive Income (SFAS 130) issued in 1997.
However, there are different views regarding the new presentation, some
respondent support the view of HKAS 1 on the usefulness of the Statement of
Comprehensive Income while some respondent think that this only reposition
information that already exist. We conduct research base on Hong Kong listed
companies and examines data of firms immediate before and after the adoption of the
Statement of Comprehensive Income as required by HKAS 1(revised). Our purpose is
to find out the usefulness of new disclosures by providing empirical evidence. Our
results do not provide evidence that there is difference of market’s valuation of other
comprehensive income items repositioning before and after using Comprehensive
Income Statement.
2

Contents
Introduction ................................................................................................................4
Background ................................................................................................................5
Literature Review.......................................................................................................8
Methodology ............................................................................................................13
Empirical Analysis ...................................................................................................16
Implications of the results ........................................................................................24
Discussion and conclusion .......................................................................................26
References ................................................................................................................27
Appendix .................................................................................................................29
3

Introduction
This paper evaluates the usefulness of the newly adopted Statement of
Comprehensive Income as required under the HKAS 1 (Revised). Effective for
annual period beginning on or after 1 January 2009, all listed companies are required
to include the Statement of Comprehensive Income in their annual reports. Before
such revise, other comprehensive income (OCI) components such as gains and losses
arising from foreign currency translation, gains and losses on fair value change of
available-for-sale financial assets, etc. are disclosed in various parts of the financial
statement. Some firms disclose them in the Statement of Recognized Income and
Expense, the Statement of Changes in Equity and/or in notes to the financial statement.
According to Hong Kong Institute of Certified Public Accountants (HKICPA), the use
of the Statement of Comprehensive Income is in convergence to the international
accounting standards following the Statement of Financial Accounting Statement No.
130 (SFAS 130) issued in 1997.
The objective of the paper is to provide empirical evidence of the usefulness
of the Statement of Comprehensive Income by evaluating the effectiveness of
information disclosed in such income statement. We study whether the new disclosure
affects the way the market processes information and the location of OCI items affect
users’ valuation of firm performance.
This study bases on Hong Kong listed companies and examines data that
immediate before and after the use of the Statement of Comprehensive Income. We
regress comprehensive income items and other accounting variables on the returns of
the sample firms before and after the use of the Statement of Comprehensive Income
to measure whether this disclosure format would be valued by the market and
financial statement users.
4

Background
The Financial Accounting Standing Board (FASB) issued SFAS 130 in June
1997, which titled as “Reporting Comprehensive Income”. In SFAS 130,
comprehensive income is defined as the sum of net income and other comprehensive
income (OCI) (See Appendix 1). OCI shows the increase in net assets derived from
non-owner transactions.
According to HKAS 1 (2010 Revised), the revise is supported by HKICPA in
order to maintain international convergence arising from the revision of IAS 1
Presentation of Financial Statements by the International Accounting Standards Board
(IASB).1
“The main objective of the IASB in revising IAS 1 was to aggregate information
in the financial statements on the basis of shared characteristics…the IASB
considered it useful to separate changes in equity (net assets) of an entity during
a period arising from transactions with owners in their capacity as owners from
other changes in equity. Consequently, the IASB decided that all owner changes
in equity should be presented in the statement of changes in equity, separately
from non-owner changes in equity.”2
In revising IAS 1, the IASB also considered FASB Statement No. 130 Reporting
Comprehensive Income (SFAS 130) issued in 1997. In IAS 1, the presentation of the
Statement of Comprehensive Income is similar to those in SFAS 130 except that
SFAS 130 permits a choice of displaying comprehensive income and its components,
in one or two statements of financial performance or in a Statement of Changes in
Equity, while IAS 1 (as revised in 2007) does not permit display in a Statement of
Changes in Equity.
1 See HKAS (Revised) 2 See HKAS (Revised)
5

Also, SFAS 130 states clearly that the total of OCI is reported separately from
retained earnings and additional paid-in capital in a statement of financial position at
the end of the period. It should be titled as accumulated other comprehensive income
under the equity section. However, IAS 1 (as revised in 2007) does not clearly state
how should the total of accumulated other comprehensive income in the statement of
financial position be displayed.3
In HKAS 1, the components of OCI include five main categories, they are
changes in revaluation surplus4; actuarial gains and losses on defined benefit plans5;
gains and losses arising from translating the financial statements of a foreign
operation;6 gains and losses on remeasuring available-for-sale financial assets and the
effective portion of gains and losses on hedging instruments in a cash flow hedge7
Prior researches have studied how location of OCI components would affect
users’ or investors’ interpretation of firm performance (Lee, Petroni, and Shen, 2006)
and estimation of price (Hirst and Hopkins, 1998). HKAS 1 (Revised) is applicable
for annual periods beginning on or after 1 January 2009. This would affect the
location of OCI components; such change is expected to affect users’ interpretation of
firms’ performance.
Since proposal of the SFAS 130, diversified opinions on comprehensive income
reporting have aroused. Proponents of comprehensive income reporting believe that
comprehensive income reporting provides a more complete and transparent
framework for reporting on all changes in net assets arising from transactions from
non-owner sources. In addition, comprehensive income reporting can lead to a more
consistent basis for international comparisons of financial performance and addresses 3 See HKAS 1(revised) 4 See HKAS 16 Property, Plant and Equipment and HKAS 38 Intangible Assets 5 See HKAS 19 Employee Benefits 6 See HKAS 21 The Effects of Changes in Foreign Exchange Rates 7 See HKAS 39 Financial Instruments: Recognition and Measurement
6
concerns that an increasing number of items that meet the definition of comprehensive
income that previously bypasses reporting in a performance statement.
Comprehensive income reporting may provide a reporting solution for unrealized
gains and loses arising from certain transactions such as gains and losses on
remeasuring available-for-sale financial assets. 8
Furthermore, comprehensive income yields a clean articulation of financial
performance and the Statement of Financial Position. It is known that accounting is a
system that periodically updates the value of owner’s equity, closing all entries in the
accounting cycle through one comprehensive income number provides a clean
articulation of the income statement and the Statement of Financial Position. This
allows all sources of the change in owners' wealth (other than those owner related
transactions such as distribution of dividends) are identified in one number. This
articulation brings integrity to the accounting because the updating of owners' equity
is more explicit and disclosure is more transparent.9
However, opponents of comprehensive income reporting present a number of
arguments. Some argue that including OCI components in the comprehensive income
reporting is irrelevant in predicting future cash flow. This argument is mainly based
on Ohlson (1999)’s idea of transitory income. Ohlson (1999) defines transitory
earnings as processing three characteristics: (1) unpredictable, (2) forecast irrelevancy,
and (3) value irrelevancy. 10 In Smithson et al. ’ s (1995) study, OCI is related to
changes in interest rates, exchanges rate and other not predictable items. Thus they
believe that OCI is very likely that not predictable and does not possess forecast
relevancy. Also, analysts and investors believe that nonrecurring items just like the
8 A number of the arguments in the paragraph are presented in Linsmeier et al. (1997a) 9 A number of the arguments in the paragraph are presented in Linsmeier et al. (1997b) 10 The term “value relevant” was used by Ohlson to refer to items that would not affect abnormal earnings and thus not affecting goodwill.
7

OCI components impair the forecasting of future cash flow. It is further argued that
OCI disturb the reporting income and makes earnings even more difficult to forecast.
Moreover, since OCI components consist of unrealised gains and losses that are
driven by market factors which managers have no control and therefore, do not
provide a good indicator for evaluating managerial performance. Due to all these
reasons, opponents do not suggest the disclosure of OCI in comprehensive income.
Literature Review
It is always a concern for accounting policy makers and financial statement users
to measure the performance and financial position of a company and make relevant
economic decisions.
However, previous empirical studies on usefulness of comprehensive income
provide mixed results. Dhaliwal et al. (1999) find no clear evidence that
comprehensive income is superior to net income in terms of explanatory power and as
a measure of firm performance. The research is done through testing whether
comprehensive income or net income can better reflect firm performance in stock
returns. Dhaliwal et al. (1999) reject the assumption that comprehensive income has a
stronger association with the market value of equity and future operation cash flow
prediction.
It also measured the appropriateness of components in SFAS 130 whether they
improve income’s ability to summarize firm performance. Tests are carried using the
entire sample as well as within the financial sector. The finding indicated that except
for the marketable security adjustment, other components in OCI had insignificant
effects in improving the ability of comprehensive income to summarize firm
performance. However, the study finds that when available-for-sale securities
8

adjustment is the only OCI component, comprehensive income is priced higher than
net income.
Dennis R. Beresford et. al (1996) suggested in their article before the adoption of
mandated comprehensive income statement (SFAS 130) that, if more items are taken
directly to equity (as is likely without another means of reporting comprehensive
income), equity will become a dumpster for an amorphous and growing mass of
important information. Thus, the more different items there are in non-owner changes
to equity, the more important it becomes to have a statement that displays them in an
organized way. Reporting comprehensive income may help resolve some difficult and
challenging financial reporting issues, particularly in the area of financial instruments.
Findings in Biddle and Choi (2006) for income component sets reveal that, in
general, with the introduction of more components in income reporting can enhance
the usefulness of decision-making. While income reporting following the SFAS 130
exhibits the largest predictive ability of financial income statements. This study also
finds that comprehensive income dominates other measures of income in explaining
equity returns.
In working paper of Keiichi Kubota et. al., their incremental information content
test shows other comprehensive income items have significant information content.
They conclude other comprehensive income is useful information, while they are not
able to rank between comprehensive income and net income.
O’Hanlon and Pope (1999) find only weak evidence that a comprehensive
income measure is more strongly associated with stock market returns than the net
income number for data collected from UK companies. On the other hand, using
sample firms from New Zealand, Cahan et al. (2000) examines empirical data and
find that comprehensive income was more value relevant than net income. It also
9
finds that asset revaluation increments and foreign currency translation adjustments
don’t have incremental value relevance beyond comprehensive income. This implies
that investors value comprehensive income, but that there is no benefit in reporting
the separate components of comprehensive income (i.e., net income and other
comprehensive income items), at least for revaluations of fixed assets and foreign
currency translation adjustments. In addition, it is found no evidence to suggest that
the Statement of Changes in Equity provides additional information that is useful to
investors.
The two studies are different in the way that O’Hanlon and Pope (1999) test the
relationship between returns and individual items of other comprehensive income,
whereas Cahan et al. (2000) examines the value relevance of comprehensive income
items by using the price model.
Hirst and Hopkins (1998) and Maines and McDaniel (2000) examine the
usefulness of SFAS 130 in laboratory settings. Hirst and Hopkins (1998) compares
stock price judgment of financial analysts faced with financial statements before
SFAS 130 with those income statements after SFAS 130 was issued. Under a
controlled behavioral laboratory setting, Hirst and Hopkins (1998) find that with the
disclosure of comprehensive income components, ability of analysts in making stock
price judgment is enhanced.11
Maines and McDaniel (2000) obtain evidence on the potential usefulness of
comprehensive income disclosure by observing the responses of users to different
types of financial statement disclosures. It is found that financial statement format for
presenting comprehensive income does not significantly influence non-professional
11 In their further study, Hirst, Hopkins, and Wahlen (2004) find that differences in income measurement affect fundamental judgements of specialist analysts. This suggests that the choice of income number may make a difference in the valuation judgements of investors.
10
investors’ evaluation of information, but generally influence their information
weighting and resulting performance judgment.
Recent researches use experimental methodologies to examine the disclosure
location of OCI on the effect of usefulness information. Lee, Petroni, and Shen
(2006)’s study has shown that the choice of OCI reporting location has an effect on
managers. They examine the reporting choice in the property-liability industry. The
property industry is an industry that OCI is evenly reported between the choices of
reporting location, i.e. in comprehensive income statement and the statement of
changes in equity. They find that insurers who manage earnings through realised
security gains or have a reputation of poor financial performance are more likely to
report comprehensive income in the statement of changes in equity.
Thomas E. King et. al (1999) conduct interviews on financial statement users and
find that they thought that comprehensive income conveyed additional useful
information but was not one of the most important financial statement items for
assessing firm performance. They also find that the format of the presentation of
comprehensive income appears to impact the probability that users of the financial
statements use comprehensive income in computing traditional firm performance
measures.
Hirst and Hopkins (1998) find evidence that individual investors are able to
estimate price or financial performance better when OCI is reported in a format
required by SFAS 130 and the information is disclosed in a statement of financial
performance rather than in the statement of changes in equity. Maines and McDaniel
(2000) also report that the judgement of non professional investors about corporate
and management performance reflect the volatility in comprehensive income only
when it is presented in a statement of financial performance.
11

Chambers D. et al.’s (2007) findings are consistent with Hirst and Hopkins’
(1998) conclusion that investors pay greatest attention to items reported in the
expected location. Dehning and Ratliff (2004) in their study provide empirical
evidence of the usefulness of comprehensive income disclosures as required by SFAS
130. They examine data for firms in periods immediately before and after SFAS 130
take into effects. They find that there is no difference in the market’s valuation of
comprehensive income adjustments before and after the implementation of SFAS 130.
Prior search shows different results in measuring the usefulness of the statement
of comprehensive income. As there are diversified opinions, we are interested in
investigating the usefulness of the statement of comprehensive income to financial
statement users of Hong Kong listed companies. Our research is similar to Dehning
and Ratliff’s (2004) in the way that we examine the market’s valuation of
comprehensive income before and after HKAS1 (Revised) take effects in convergence
to the international accounting standards.
As Comprehensive Income items have previously been disclosed in various
parts of the financial statements, listing these items in statement form provides no
information that has not already been available. Therefore, if markets are efficient, the
disclosures required by HKAS 1 (revised) should not affect firm value. The purpose
of this paper is to provide empirical evidence of the usefulness of OCI disclosures as
required by HKAS 1 (revised). We contribute to the literature that we provide an
initial examination of the usefulness of comprehensive income statement to present
other comprehensive income items in Hong Kong. Our results do not support the
claim that disclosing other comprehensive income in a comprehensive income
statement is a better measure to statement users.
12
Methodology
Data Selection
Our sample consists of firms that are listed on the Hong Kong Stock Exchange
(HKEx). To be included in the sample, a firm must be listed on the Hong Kong Stock
Exchange Main Board or Growth Enterprise Market (GEM Board) and its annual
report must be available on the HKEx website or irasia.com. 1352 firms are extracted
from the DataStream. We have examined all the available annual reports of year
2006/07, 2007/08 and 2008/09 of these 1352 firms near the end of March. 61 firms
are found using the Statement of Comprehensive Income in 2008/09’s annual report.
These 61 firms become our sample firms. We collected data on stock price, number of
shares, total assets, growth, leverage of our sample firms and the Heng Seng
Composite Price Index (HKCPI) from the DataStream and all other accounting data
from company annual reports.
Research Design
Our research investigates how the market response to the change of disclosure
requirement of HKAS 1- changes in net income due to non- owner transactions i.e.
OCI components are required to be presented in one Statement of Comprehensive
Income or in two statements (a separate income statement and a Statement of
Comprehensive Income).12Components of comprehensive income are not permitted to
be presented in the statement of changes in equity. Previously, companies disclosed
the comprehensive income items in statement of changes in equity. Our research
investigates the usefulness of this change by comparing the effect of the change in
presentation requirement of HKAS 1.
12 See HKAS 1 (Revised)
13

In our samples, financial statements of 61 companies 2007/08 and 2008/09
were observed. In 2007/08 financial statements, all these companies disclosed other
comprehensive income items in statement of changes in equity while in 2009 these
companies presented comprehensive income items in one statement of comprehensive
income or in separate statements. To ensure that the market had access to the
information in the annual reports, we use the stock prices from 3, 5, 7 and 9 days
before and after the release date of the report as short window measure and price at
release date and 1 year before the release date as long window measure. All variables
are manually collected from the companies’ annual reports or in the DataStream and
are in Hong Kong currency. When firms disclose the information in RMB or US
dollars, we convert them into Hong Kong currency using the fiscal year end exchange
rate.
Our model consists of two parts, the first part tests how individual variables
response to the abnormal return in the in each fiscal year. The second part is to
compare regressions of the two fiscal years by adding an interaction variable.
Our first part uses the following model to examine the association between the
abnormal return, change in profits, change in total of other comprehensive income and
other accounting variables.
SARt = b0+b1Pf t + b2PfC t + b3OCI t + b4OCIC t + b5GROWTH t + b6TA t +
b7LEVERAGEt + H/Red (1)
SARt = Abnormal Return which equals to percentage change of stock price minus percentage change of Heng Seng Composite Price Index for the 3, 5, 7, 9 days short window period.
i.e. SARt = Pr+3 - Pr-3 __ HSCPIr+3 - HSCPIr-3 Pr-3 HSCPIr-3
(Where r represents the release date of the financial report P represents stock price HSCPI represents Heng Seng Composite Price Index)
Pft = Profit/Loss for the year end t under HKAS before other comprehensive income items
14
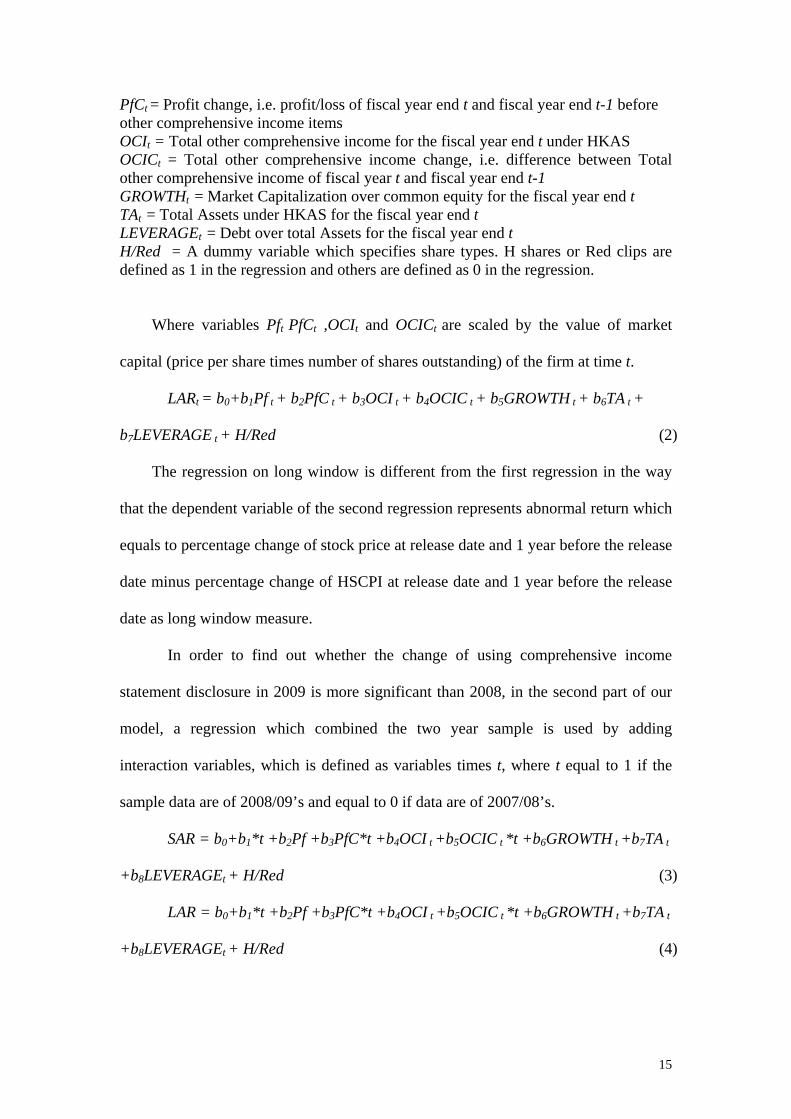
PfCt = Profit change, i.e. profit/loss of fiscal year end t and fiscal year end t-1 before other comprehensive income items OCIt = Total other comprehensive income for the fiscal year end t under HKAS OCICt = Total other comprehensive income change, i.e. difference between Total other comprehensive income of fiscal year t and fiscal year end t-1 GROWTHt = Market Capitalization over common equity for the fiscal year end t TAt = Total Assets under HKAS for the fiscal year end t LEVERAGEt = Debt over total Assets for the fiscal year end t H/Red = A dummy variable which specifies share types. H shares or Red clips are defined as 1 in the regression and others are defined as 0 in the regression.
Where variables Pft PfCt ,OCIt and OCICt are scaled by the value of market
capital (price per share times number of shares outstanding) of the firm at time t.
LARt = b0+b1Pf t + b2PfC t + b3OCI t + b4OCIC t + b5GROWTH t + b6TA t +
b7LEVERAGE t + H/Red (2)
The regression on long window is different from the first regression in the way
that the dependent variable of the second regression represents abnormal return which
equals to percentage change of stock price at release date and 1 year before the release
date minus percentage change of HSCPI at release date and 1 year before the release
date as long window measure.
In order to find out whether the change of using comprehensive income
statement disclosure in 2009 is more significant than 2008, in the second part of our
model, a regression which combined the two year sample is used by adding
interaction variables, which is defined as variables times t, where t equal to 1 if the
sample data are of 2008/09’s and equal to 0 if data are of 2007/08’s.
SAR = b0+b1*t +b2Pf +b3PfC*t +b4OCI t +b5OCIC t *t +b6GROWTH t +b7TA t
+b8LEVERAGEt + H/Red (3)
LAR = b0+b1*t +b2Pf +b3PfC*t +b4OCI t +b5OCIC t *t +b6GROWTH t +b7TA t
+b8LEVERAGEt + H/Red (4)
15

If the Statement of Comprehensive Income is useful to users and more
relevant for users to anticipate the market value of firms, the coefficient b3 should be
significant and have a positive coefficient.
Empirical Analysis
Descriptive Statistics
Table 1 provides descriptive statistics for the variables used in the first part of
our research model. Variables for profit, profit change, total other comprehensive
income and the change of total other comprehensive income are all scaled by value of
market capital of the firm at time at that fiscal year. We removed observations that
the growth, leverage and total assets are missing from the DataStream. Table 1
indicates a final 60 plus 1 i.e. 61 firms are selected as our sample firms. The mean of
abnormal return in 3 days window is –0.119 and 0.009 respectively in 2007/08 and
2008/09.
Table 1 Descriptive Statistics
YR N Mean Std. Deviation 0 YR 60 .00 .000 H_red 60 .28 .454 Pf 60 .016280 .230710 PfC 60 -.075496 .220825 OCI 60 .006068 .032990 OCIC 60 -.012246 .038012 TA 60 15.25022 2.439138 Growth 60 6.21111 32.754430 Leverage 60 .200435 .151395 ARHS_3 60 -.011949 .139584 ARHS_long 60 .080619 .878658 Valid N (listwise) 60 1 YR 60 1.00 .000 H_red 60 .28 .454 Pf 60 .139314 .467723 PfC 60 .155028 .320750 OCI 60 .009715 .052870 OCIC 60 -.000260 .102526 TA 60 15.492888 2.419072
16

Growth 60 9.178993 48.463420 Leverage 60 .178829 .145357 ARHS_3 60 .008863 .080675 ARHS_long 60 .604625 1.295045 Valid N (listwise) 60
YR is the fiscal year of the financial report, YR=0 is fiscal year 2007/08, YR=1 is fiscal year 2008/09 H_red is dummy variable that specifies share types, H shares or Red clips are defined as 1 in the regression and others are defined as 0 in the regression Pf is the profit/loss for the fiscal year end t defined under HKAS before OCI items PfC is the profit change, i.e. profit/loss of fiscal year end t and fiscal year end t-1 before OCI items OCI is total other comprehensive income for the fiscal year end t under HKAS OCIC is total other comprehensive income change, i.e. difference between total other comprehensive income of fiscal year t and fiscal year end t-1 TA is total assets under HKAS for the fiscal year end t Growth is the market capitalization over common equity for the fiscal year end t Leverage is the percentage of debt over total assets for the fiscal year end t ARHS_3 is the abnormal return that equals to percentage change of stock price minus percentage change of Heng Seng Composite Price Index for 3 days short window period ARHS_long is abnormal return that equals to percentage change of stock price minus percentage change of Heng Seng Composite Price Index for 12 months long window period
Results
Table 2 shows the result of regression (1), the short window measuring
abnormal return based on the percentage change of stock price and HSCPI 3 days
before and after the release date of the financial reports. Though we have done a 5-
day, 7-day and 9-day short window regression, the 3-day regression model shows a
highest adjusted R2, indicating the usefulness of the regression model. As shown in
Table 2, in both year 2007/08 and 2008/09, only Pf and PfC are significant. OCI and
OCIC are not significantly different from zero. The results of the two fiscal years are
quite similar. This result can be well explained by using the efficient markets
hypothesis13 as employed in Dehning and Ratliff (2004). 14 The result shows no
change in the way the market values the information solely due to the change of the
disclosure of information.
13 See Konte. M (2010) Behavioral Finance and Efficient Markets: Is the Joint Hypothesis Really The Problem 14 Dehning and Ratliff (2004) estimate their model and find that the comprehensive income adjustments are not significant. They relate such result with the efficient markets hypothesis in that information available prior to FAS 130 is not valued differently simply because it is being disclosed in another format.
17
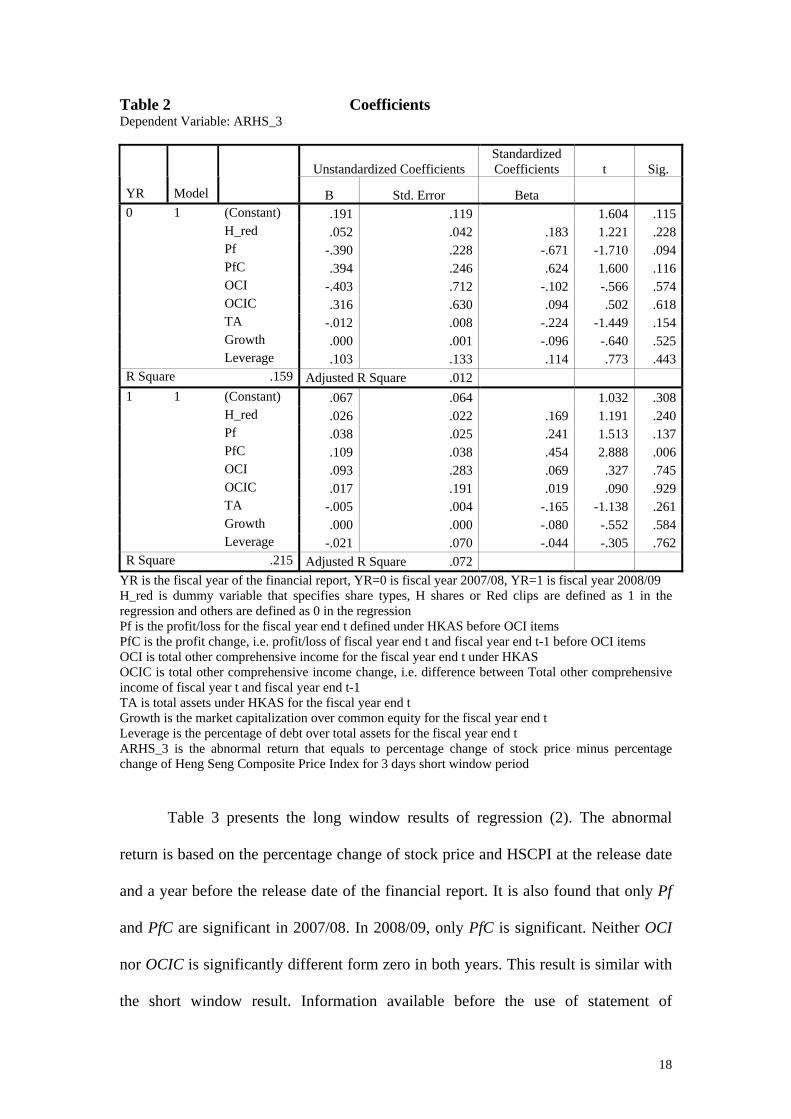
Table 2 Coefficients Dependent Variable: ARHS_3
Unstandardized Coefficients Standardized Coefficients t Sig.
YR Model B Std. Error Beta
0 1 (Constant) .191 .119 1.604 .115 H_red .052 .042 .183 1.221 .228 Pf -.390 .228 -.671 -1.710 .094 PfC .394 .246 .624 1.600 .116 OCI -.403 .712 -.102 -.566 .574 OCIC .316 .630 .094 .502 .618 TA -.012 .008 -.224 -1.449 .154 Growth .000 .001 -.096 -.640 .525 Leverage .103 .133 .114 .773 .443R Square .159 Adjusted R Square .012 1 1 (Constant) .067 .064 1.032 .308 H_red .026 .022 .169 1.191 .240 Pf .038 .025 .241 1.513 .137 PfC .109 .038 .454 2.888 .006 OCI .093 .283 .069 .327 .745 OCIC .017 .191 .019 .090 .929 TA -.005 .004 -.165 -1.138 .261 Growth .000 .000 -.080 -.552 .584 Leverage -.021 .070 -.044 -.305 .762R Square .215 Adjusted R Square .072
YR is the fiscal year of the financial report, YR=0 is fiscal year 2007/08, YR=1 is fiscal year 2008/09 H_red is dummy variable that specifies share types, H shares or Red clips are defined as 1 in the regression and others are defined as 0 in the regression Pf is the profit/loss for the fiscal year end t defined under HKAS before OCI items PfC is the profit change, i.e. profit/loss of fiscal year end t and fiscal year end t-1 before OCI items OCI is total other comprehensive income for the fiscal year end t under HKAS OCIC is total other comprehensive income change, i.e. difference between Total other comprehensive income of fiscal year t and fiscal year end t-1 TA is total assets under HKAS for the fiscal year end t Growth is the market capitalization over common equity for the fiscal year end t Leverage is the percentage of debt over total assets for the fiscal year end t ARHS_3 is the abnormal return that equals to percentage change of stock price minus percentage change of Heng Seng Composite Price Index for 3 days short window period
Table 3 presents the long window results of regression (2). The abnormal
return is based on the percentage change of stock price and HSCPI at the release date
and a year before the release date of the financial report. It is also found that only Pf
and PfC are significant in 2007/08. In 2008/09, only PfC is significant. Neither OCI
nor OCIC is significantly different form zero in both years. This result is similar with
the short window result. Information available before the use of statement of
18
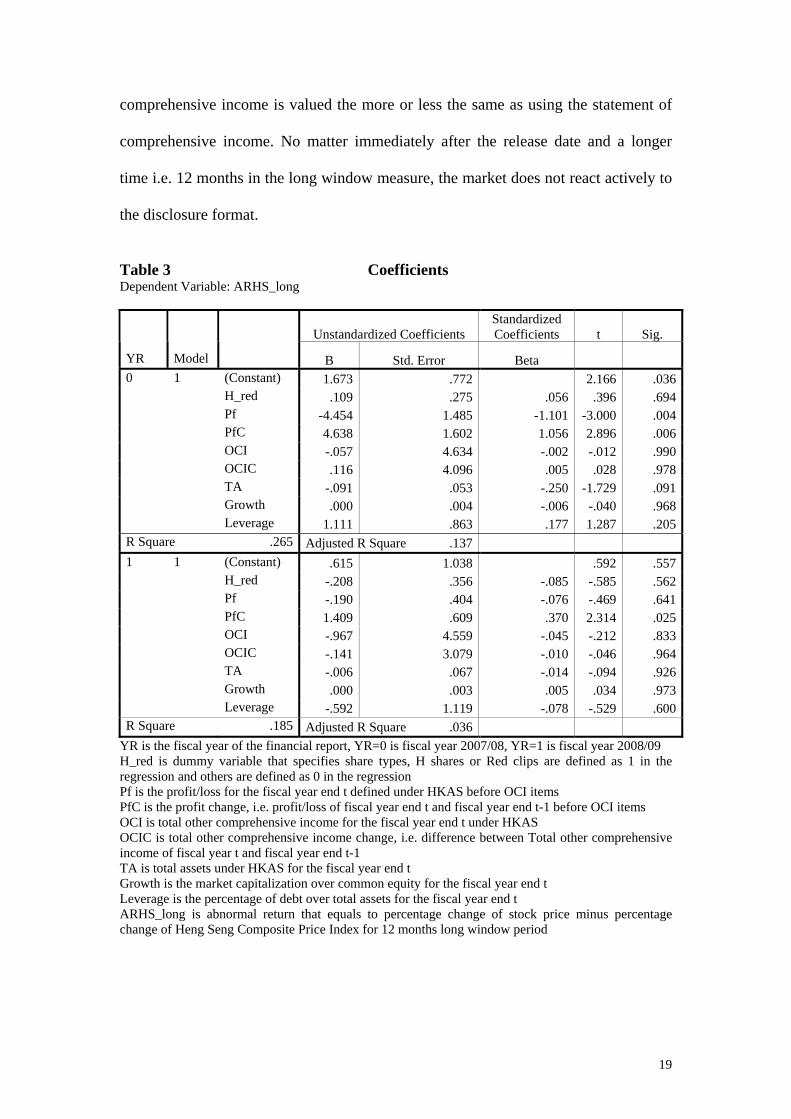
comprehensive income is valued the more or less the same as using the statement of
comprehensive income. No matter immediately after the release date and a longer
time i.e. 12 months in the long window measure, the market does not react actively to
the disclosure format.
Table 3 Coefficients Dependent Variable: ARHS_long
Unstandardized Coefficients Standardized Coefficients t Sig.
YR Model B Std. Error Beta
0 1 (Constant) 1.673 .772 2.166 .036 H_red .109 .275 .056 .396 .694 Pf -4.454 1.485 -1.101 -3.000 .004 PfC 4.638 1.602 1.056 2.896 .006 OCI -.057 4.634 -.002 -.012 .990 OCIC .116 4.096 .005 .028 .978 TA -.091 .053 -.250 -1.729 .091 Growth .000 .004 -.006 -.040 .968 Leverage 1.111 .863 .177 1.287 .205R Square .265 Adjusted R Square .137 1 1 (Constant) .615 1.038 .592 .557 H_red -.208 .356 -.085 -.585 .562 Pf -.190 .404 -.076 -.469 .641 PfC 1.409 .609 .370 2.314 .025 OCI -.967 4.559 -.045 -.212 .833 OCIC -.141 3.079 -.010 -.046 .964 TA -.006 .067 -.014 -.094 .926 Growth .000 .003 .005 .034 .973 Leverage -.592 1.119 -.078 -.529 .600R Square .185 Adjusted R Square .036
YR is the fiscal year of the financial report, YR=0 is fiscal year 2007/08, YR=1 is fiscal year 2008/09 H_red is dummy variable that specifies share types, H shares or Red clips are defined as 1 in the regression and others are defined as 0 in the regression Pf is the profit/loss for the fiscal year end t defined under HKAS before OCI items PfC is the profit change, i.e. profit/loss of fiscal year end t and fiscal year end t-1 before OCI items OCI is total other comprehensive income for the fiscal year end t under HKAS OCIC is total other comprehensive income change, i.e. difference between Total other comprehensive income of fiscal year t and fiscal year end t-1 TA is total assets under HKAS for the fiscal year end t Growth is the market capitalization over common equity for the fiscal year end t Leverage is the percentage of debt over total assets for the fiscal year end t ARHS_long is abnormal return that equals to percentage change of stock price minus percentage change of Heng Seng Composite Price Index for 12 months long window period
19
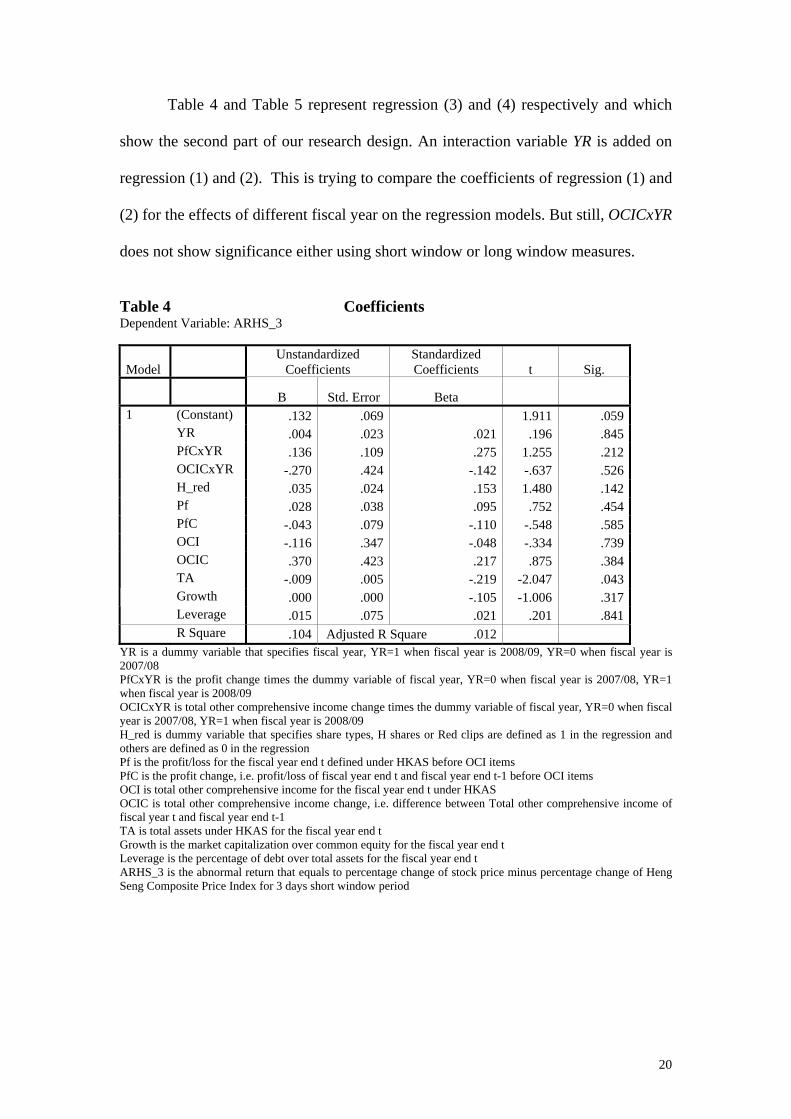
Table 4 and Table 5 represent regression (3) and (4) respectively and which
show the second part of our research design. An interaction variable YR is added on
regression (1) and (2). This is trying to compare the coefficients of regression (1) and
(2) for the effects of different fiscal year on the regression models. But still, OCICxYR
does not show significance either using short window or long window measures.
Table 4 Coefficients Dependent Variable: ARHS_3
Model Unstandardized
Coefficients Standardized Coefficients t Sig.
B Std. Error Beta 1 (Constant) .132 .069 1.911 .059 YR .004 .023 .021 .196 .845 PfCxYR .136 .109 .275 1.255 .212 OCICxYR -.270 .424 -.142 -.637 .526 H_red .035 .024 .153 1.480 .142 Pf .028 .038 .095 .752 .454 PfC -.043 .079 -.110 -.548 .585 OCI -.116 .347 -.048 -.334 .739 OCIC .370 .423 .217 .875 .384 TA -.009 .005 -.219 -2.047 .043
Growth .000 .000 -.105 -1.006 .317 Leverage .015 .075 .021 .201 .841
R Square .104 Adjusted R Square .012 YR is a dummy variable that specifies fiscal year, YR=1 when fiscal year is 2008/09, YR=0 when fiscal year is 2007/08 PfCxYR is the profit change times the dummy variable of fiscal year, YR=0 when fiscal year is 2007/08, YR=1 when fiscal year is 2008/09 OCICxYR is total other comprehensive income change times the dummy variable of fiscal year, YR=0 when fiscal year is 2007/08, YR=1 when fiscal year is 2008/09 H_red is dummy variable that specifies share types, H shares or Red clips are defined as 1 in the regression and others are defined as 0 in the regression Pf is the profit/loss for the fiscal year end t defined under HKAS before OCI items PfC is the profit change, i.e. profit/loss of fiscal year end t and fiscal year end t-1 before OCI items OCI is total other comprehensive income for the fiscal year end t under HKAS OCIC is total other comprehensive income change, i.e. difference between Total other comprehensive income of fiscal year t and fiscal year end t-1 TA is total assets under HKAS for the fiscal year end t Growth is the market capitalization over common equity for the fiscal year end t Leverage is the percentage of debt over total assets for the fiscal year end t ARHS_3 is the abnormal return that equals to percentage change of stock price minus percentage change of Heng Seng Composite Price Index for 3 days short window period
20

Table 5 Coefficients Dependent Variable: ARHS_long
Model Unstandardized
Coefficients Standardized Coefficients t Sig.
B Std. Error Beta 1 (Constant) 1.057 .648 1.632 .106 YR .238 .212 .115 1.123 .264 PfCxYR .940 1.019 .194 .923 .358 OCICxYR -3.379 3.978 -.182 -.849 .398 H_red -.104 .224 -.046 -.462 .645 Pf -.303 .353 -.104 -.860 .392 PfC .300 .743 .078 .404 .687 OCI -.997 3.260 -.042 -.306 .760 OCIC 2.931 3.969 .175 .739 .462 TA -.057 .043 -.137 -1.335 .185
Growth -.001 .002 -.030 -.297 .767 Leverage .037 .704 .005 .053 .958
R Square .166 Adjusted R Square .080 YR is a dummy variable that specifies fiscal year, YR=1 when fiscal year is 2008/09, YR=0 when fiscal year is 2007/08 PfCxYR is the profit change times the dummy variable of fiscal year, YR=0 when fiscal year is 2007/08, YR=1 when fiscal year is 2008/09 OCICxYR is total other comprehensive income change times the dummy variable of fiscal year, YR=0 when fiscal year is 2007/08, YR=1 when fiscal year is 2008/09 H_red is dummy variable that specifies share types, H shares or Red clips are defined as 1 in the regression and others are defined as 0 in the regression Pf is the profit/loss for the fiscal year end t defined under HKAS before OCI items PfC is the profit change, i.e. profit/loss of fiscal year end t and fiscal year end t-1 before OCI items OCI is total other comprehensive income for the fiscal year end t under HKAS OCIC is total other comprehensive income change, i.e. difference between Total other comprehensive income of fiscal year t and fiscal year end t-1 TA is total assets under HKAS for the fiscal year end t Growth is the market capitalization over common equity for the fiscal year end t Leverage is the percentage of debt over total assets for the fiscal year end t ARHS_long is abnormal return that equals to percentage change of stock price minus percentage change of Heng Seng Composite Price Index for 12 months long window period
In our samples, there are firms that present income statements with poor
disclosure (See Appendix 3). Before the statement of comprehensive income is used,
some firms disclose OCI items in the statement of changes in equity without
separating them form items arising from owner transactions, such as declared
dividends and issue of shares, etc. The total amount of OCI is not shown. We suspect
that the insignificant result of response by user in our last regression models may be
due to reason that many firms in our sample are firms already using clear groupings in
pre-HKAS (revised) period (See Appendix 3). Therefore, in this regression model we
21

are investigating users’ response to grouping effect of OCI items. It may be possible
that firms with poor presentation of OCI will improve its market valuation when the
statement of comprehensive income is used. To test this, the regression is again run
with some modifications. A dummy variable G_B is used to classify firms with proper
presentation of OCI in the statement of changes in equity and firms with poor
presentation. The short window regression and the long window regression are as
follows:
SAR = b0+b1*G_B +b2Pf +b3PfC*G_B +b4OCI t +b5OCIC t *G_B
+b6GROWTH t +b7TA t +b8LEVERAGEt + H/Red (5)
LAR = b0+b1*G_B +b2Pf +b3PfC*G_B +b4OCI t +b5OCIC t *G_B
+b6GROWTH t +b7TA t +b8LEVERAGEt + H/Red (6)
G_B = 1 when firms with poor presentation of OCI, G_B = 0 when firms with
proper presentation of OCI.
Table 6 and 7 present the results of the above regressions. Variables of
PfCxG_B and OCICxG_B are not significantly different from zero in both short
window and long window measures. The group of “poorer presentation of OCI items”
does not present a more significant result than the other group. That means users do
not response significantly even for firms that present a clearer format of OCI items
than before.
22
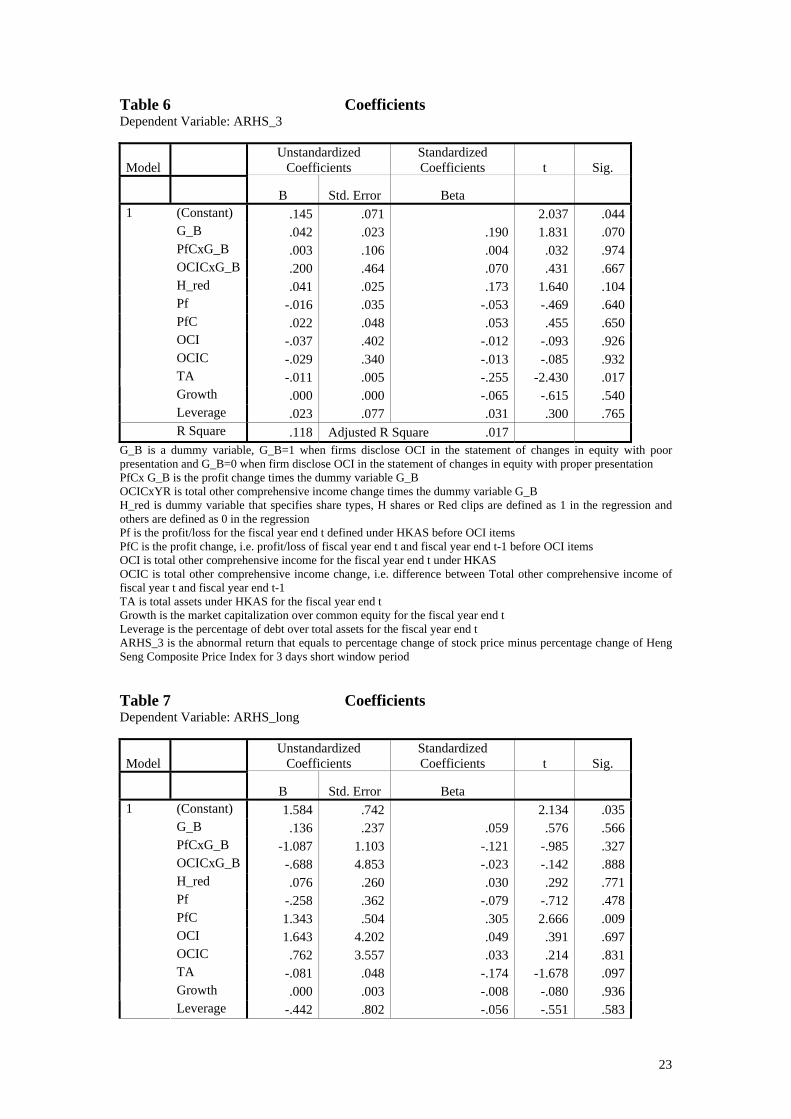
Table 6 Coefficients Dependent Variable: ARHS_3
Model Unstandardized
Coefficients Standardized Coefficients t Sig.
B Std. Error Beta 1 (Constant) .145 .071 2.037 .044 G_B .042 .023 .190 1.831 .070 PfCxG_B .003 .106 .004 .032 .974 OCICxG_B .200 .464 .070 .431 .667 H_red .041 .025 .173 1.640 .104 Pf -.016 .035 -.053 -.469 .640 PfC .022 .048 .053 .455 .650 OCI -.037 .402 -.012 -.093 .926 OCIC -.029 .340 -.013 -.085 .932
TA -.011 .005 -.255 -2.430 .017 Growth .000 .000 -.065 -.615 .540
Leverage .023 .077 .031 .300 .765 R Square .118 Adjusted R Square .017
G_B is a dummy variable, G_B=1 when firms disclose OCI in the statement of changes in equity with poor presentation and G_B=0 when firm disclose OCI in the statement of changes in equity with proper presentation PfCx G_B is the profit change times the dummy variable G_B OCICxYR is total other comprehensive income change times the dummy variable G_B H_red is dummy variable that specifies share types, H shares or Red clips are defined as 1 in the regression and others are defined as 0 in the regression Pf is the profit/loss for the fiscal year end t defined under HKAS before OCI items PfC is the profit change, i.e. profit/loss of fiscal year end t and fiscal year end t-1 before OCI items OCI is total other comprehensive income for the fiscal year end t under HKAS OCIC is total other comprehensive income change, i.e. difference between Total other comprehensive income of fiscal year t and fiscal year end t-1 TA is total assets under HKAS for the fiscal year end t Growth is the market capitalization over common equity for the fiscal year end t Leverage is the percentage of debt over total assets for the fiscal year end t ARHS_3 is the abnormal return that equals to percentage change of stock price minus percentage change of Heng Seng Composite Price Index for 3 days short window period Table 7 Coefficients Dependent Variable: ARHS_long
Model Unstandardized
Coefficients Standardized Coefficients t Sig.
B Std. Error Beta 1 (Constant) 1.584 .742 2.134 .035 G_B .136 .237 .059 .576 .566 PfCxG_B -1.087 1.103 -.121 -.985 .327 OCICxG_B -.688 4.853 -.023 -.142 .888 H_red .076 .260 .030 .292 .771 Pf -.258 .362 -.079 -.712 .478 PfC 1.343 .504 .305 2.666 .009 OCI 1.643 4.202 .049 .391 .697 OCIC .762 3.557 .033 .214 .831 TA -.081 .048 -.174 -1.678 .097
Growth .000 .003 -.008 -.080 .936 Leverage -.442 .802 -.056 -.551 .583
23

R Square .135 Adjusted R Square .036 G_B is a dummy variable, G_B=1 when firms disclose OCI in the statement of changes in equity with poor presentation and G_B=0 when firm disclose OCI in the statement of changes in equity with proper presentation PfCx G_B is the profit change times the dummy variable G_B OCICxYR is total other comprehensive income change times the dummy variable G_B H_red is dummy variable that specifies share types, H shares or Red clips are defined as 1 in the regression and others are defined as 0 in the regression Pf is the profit/loss for the fiscal year end t defined under HKAS before OCI items PfC is the profit change, i.e. profit/loss of fiscal year end t and fiscal year end t-1 before OCI items OCI is total other comprehensive income for the fiscal year end t under HKAS OCIC is total other comprehensive income change, i.e. difference between Total other comprehensive income of fiscal year t and fiscal year end t-1 TA is total assets under HKAS for the fiscal year end t Growth is the market capitalization over common equity for the fiscal year end t Leverage is the percentage of debt over total assets for the fiscal year end t ARHS_long is abnormal return that equals to percentage change of stock price minus percentage change of Heng Seng Composite Price Index for 12 months long window period
Implications of the results
HKAS 1 required firms to clearly disclose unrealized gains and losses on other
comprehensive items, making this information more easily accessible. In this study,
we examined data for firms in periods immediately before and after enactment of
HKAS 1 (revised) to see whether market response significantly to the change of
disclosure and find out the usefulness of comprehensive income statement. We find
that there is no difference in the market response to comprehensive income
adjustments between the periods, that is, the coefficient relating to OCIC is not
significance in either period. This is consistent with the efficient markets hypothesis
in that there is no change in the way the market values the information due solely to
the placement of the disclosure.
Further, we also divided samples of firms to groups of “better presentation of
OCI items” and “poorer presentation of OCI items” in the pre-HKAS 1 (revised)
period (i.e. in 07/08 reports) to see whether significantly change in groupings of other
comprehensive income items from pre and post period would affect users perception
and response. However, we find that neither group of firms gives significant results.
The group of “poorer presentation of OCI items” does not present a more significant
24

result than the other group. That means users do not response significantly even for
firms that present a clearer format of OCI items than before. Users may not percept
OCI items as relevant information for their evaluation of firm performance.
There are explanations by prior research to why OCI items are not valued at
all by the market. Dee’s [2000] claim that OCI is made up of transitory items which
tend to be mean-reverting, yielding no sustainable change in the value of the firm.
Dhaliwal et al. (1999) found no evidence that comprehensive income is more strongly
associated with returns/market value than net income. Louis [2003] provides evidence
that one component of comprehensive income, the foreign translation adjustment,
performs contrary to popular expectations. He demonstrates how a positive translation
adjustment, which is comprehensive income increasing, is on average associated with
a loss of value. This result is largely attributable to labor-intensive firms. If one factor
of CI is simultaneously income increasing a value decreasing, it may offset any results
due to the other components. In working paper of Keiichi Kubota et. al., they find that
stock market reactions to other comprehensive income items depend on the degree of
firms’ foreign dependency for foreign currency translation adjustments OCI item, and
on the magnitude of the ratio of available-for-sale securities to equity for unrealized
gains and losses from securities available-for-sale OCI item. In our sample data most
firms’ other comprehensive income composed mainly by foreign translation
adjustment, therefore showing a negative result for changes among year changes.
Unless other benefits of the required disclosure can be shown, this statement
appears to require additional information without a commensurate payback. There
may also be a learning-curve and our research is done too soon after HKAS 1 (revised)
for the market to have taken full advantage of the additional information. But more
than likely, there are no significant responses because the OCI items information was
25

always available, no matter disclose in the statement of changes in equity or in the
statement of comprehensive income, users do not think that it makes a difference.
Discussion and conclusion
There are some inherent limitation of our sample data of firms - we examine
firm reports near March end, however, most listed firms have not yet release their
08/09 annual reports until April. Due to time limitation of our research we are unable
to wait till that time. Thus, limited sample size may affect the regression results.
Secondly, as the OCI amount was small compared with the profit amount,
therefore the significance of the effect of OCIC may be absorbed by the effect of
changes in profit for the year.
Moreover, Dhaliwal et al. (1999) found that the only component of
comprehensive income that improves the association between income and returns is
the marketable securities adjustment, which mostly found in the financial sector firms.
In our sample there is only one firm which belongs to the financial sector, this may
explain the insignificant results of our research. Since our sample data mainly
compose of non-financial industries, the result of OCIC was not significantly
associated with abnormal return. Such result was consistent with Dhaliwal et al.’s
(1999) explanation. Furthermore, our model does not provide a test on the forecast
ability of the firm performance. To do so, future research may change the dependent
variable of abnormal return by using data one year after the adoption of the Statement
of Comprehensive Income i.e. fiscal year 2009/10. Similar research could be
conducted again several years after the implementation of Statement of
Comprehensive Income when sample size is extended. Moreover, industry of firms
could also be taken into consideration when developing research models.
26
References
Bandyopadhyay S. P., Hanna J.D and Richardson G. 1994. Capital Market Effects of US- Canada GAAP differences. Journal of Accounting Research 32: 262-277
Beresford D. Johnson T. and ReitherC. 1996. Is a Second Income Statement Needed? Journal of Accountancy. Retrieved from: http://www.questia.com/googleScholar.qst?docId=5000338656
Biddle G.C. and Choi J.H. 2006. Is Comprehensive Income Useful? Journal of Contemporary Accounting and Economics 2: 1-23
Cahan S.F., Courtenay S.M, Gronewaller P.L. and Upton D.R. 2000. Value Relevance of Mandated Comprehensive Income Disclosures. Journal of Business Finance and Accounting 27: 1233-1265
Chambers D., Linsmeier T. J. and Shakespeare C. 2007. An evaluation of SFAS No. 130 comprehensive income disclosures. Review of Accounting Studies 12: 557-593
Dehning B. and Ratliff P. 2004. Comprehensive Income: Evidence on the Effectiveness of FAS 130. The Journal of American Academy of Business 4: 228-232
Dhaliwal D.,Subramanyam K.R. and Trezevant R. 1999. Is comprehensive income superior to net income as a measure of firm performance? Journal of Accounting and Economics 26: 43-67
Financial Accounting Standard Board (FASB). Statement of Financial Accounting Standards 130. Reporting Comprehensive Income. 1997
Hirst D. and Hopkins P. 1998. Comprehensive Income Reporting and Analysts’ Valuation Judgements. Journal of Accounting Research 36: 47-74
Hirst D. and Hopkins P. and Wahlen J. 2004. Fair values, income measurement, and bank analysts’ risk and valuation judgements. The Accounting Review
Hong Kong Accounting Standard Board. Hong Kong Accounting Standard 1 (Revised). Presentation of Financial Statements. 2009
Kanagaretnam K., Mathieu R. and Shehata M. 2009. Usefulness of Comprehensive Income in Canada. Journal of Account and Public Policy 28: 349-365
King T. Ortegren A. and Reed B. (1999). An Analysis of the Impact of Alternative Financial Statement Presentations of Comprehensive Income. Academy of Accounting and Financial Studies Journal 3:61-71
Konte. M (2010) Behavioral Finance and Efficient Markets: Is the Joint Hypothesis Really The Problem. The ICFAI Journal of Behavioral Finance 7:P.20-29
Kubota K. Suda Ka and Takehara H. 2009 Information Content of Other Comprehensive Income and Net Income: Evidence for Japanese Firms. Retrieved from: http://papers.ssrn.com/sol3/papers.cfm?abstract_id=1393746
Lee Y., Petroni K. and Shen M. 2006. Cherry picking, financial reporting quality, and comprehensive income reporting choice: The case of property-liability insurers. Contemporary Accounting Research 23(3): 665-700
Linsmeier T. Gribble J. Jennings R. Lang M. Penman S. Petroni K. Shores D. Smith J. and Warfield T. 1997a. Response to FASB exposure draft: Proposed statement of financial accounting standards- reporting comprehensive income. Accounting Horizons 11: 117-119
Linsmeier T. Gribble J. Jennings R. Lang M. Penman S. Petroni K. Shores D. Smith J. and Warfield T. 1997b. An issues paper on comprehensive income. Accounting Horizons 11: 120-126
27

Maines L. and L. McDaniel. 2000. Effects of comprehensive-income characteristics on nonprofessional investors’ Judgements: The Role of Financial Statement Presentation Format. The Accounting Review 75: 179-207
O’Hanlon J. 2000. Discussion of Value Relevance of Mandated Comprehensive Income Disclosure. Journal of Business, Finance and Accounting 27: 1303-1309
Smithson C. Smith C. and Wilford D. 1995. Managing financial risk: A guide to derivative products, financial engineering and value maximization. New York: Irwin Professional Publishing.
28

29
Appendix 1
Statement of Comprehensive Income For the year ended 31 December 2009
2009 2008 HK$ HK$ Profit for the year XXX XXX Other comprehensive income:
Gain on cash flow hedges XXX XXX Fair value gain on available-for-sale investment XXX XXX
Exchange differences arising on translation to presentation currency XXX XXX
Actuarial gains on defined benefit plans XXX XXX
Other comprehensive income for the year XXX XXX
Total comprehensive income for the year XXX XXX
Sample format of the Statement of Comprehensive Income- two statements of financial performance format

Appendix 2
Statement of Changes in Equity
For the year ended 31 December 2008 Attributable to Equity Holders of the Company Share Share Translation Hedging Fair Value Retained Total Minority Total
Capital
Premium
Reserve
Reserve
Reserve
Earnings
Interest
Equity HK$ HK$ HK$ HK$ HK$ HK$ HK$ HK$ HK$Balance at 1 January 2008 XX XX XX XX XX XX XX XX XXXGain on cash flow hedges XX XX XXX Fair value gain on available-for-sale investment
XX XX XXXExchange differences arising on translation to presentation currency XX XX XXXNet income recognised directly in equity XX XX XX XX XX XX XX XX XXX
Profit for the year XX XX XX XXXTotal recognised income and expense for the year XX XX XX XX XX XX XX XX XXX
Acquisition of subsidiaries (XX) (XXX)Dividend paid to minority shareholders (XX)
(XXX)
Final dividend paid for the year 31 December 2007 (XX) (XX) (XXX)Interim dividend paid for the year 31 December 2008
(XX) (XX) (XXX)XX XX XX XX XX XX XX XXX
Balance at 1 December 2008 XX XX XX XX XX XX XX XXXSample of the Statement of Changes in Equity – with proper presentation format
XX XX

Appendix 3
Sample of the Statement of Changes in Equity – with poor presentation format
Statement of Changes in Equity
For the year ended 31 December 2008 Attributable to Equity Holders of the Company Share Share Translation Hedging Fair Value Retained Total Minority Total
Capital
Premium
Reserve
Reserve
Reserve
Earnings
Interest
Equity HK$ HK$ HK$ HK$ HK$ HK$ HK$ HK$ HK$Balance at 1 January 2008 XX XX XX XX XX XX XX XX XXXAcquisition of subsidiaries
(XX) (XXX)Gain on cash flow hedges XX XX XXX Fair value gain on available-for-sale investment XX XX XXXExchange differences arising on translation to presentation currency XX XX XXXDividend paid to minority shareholders (XX)
(XXX)
Final dividend paid for the year 31 December 2007 (XX) (XX) (XXX)Interim dividend paid for the year 31 December 2008 (XX) (XX) (XXX)Profit for the year
XX XX XX XXXXX XX XX XX XX XX XX XX XXX
Balance at 1 December 2008 XX XX XX XX XX XX XX XX XXX
31