Use of kirlian photography in fatigue assessment
59
U -•ftuber ITC-02-06-76-403 4 USE OF KIRLIAN PHOTOGRAPHY IN FATIGUE ASSESSMENT. ' C. Thomas(Reeves.- saty En1neeiing Graduate Program USAMC Intern Training Center Red River Army Depot z Texarkana, 'xas /5501 . ,DeceI• 75 Final /epwrt ./$ APPROVED FOR PUBLIC RELEASE: DISTRIBUTION UNLIMITED Prepared for SAFETY ENGINEERING GRADUATE PROGRAM AND TEXAS A&M UNIVERSITY GRADUATE CENTER USAMC Intern Training Center - USALMC Red River A-my Depot, Texarkana, Texas 75501 • , * * , S-/ / .o'
-
Upload
clifford-stone -
Category
Documents
-
view
119 -
download
2
Transcript of Use of kirlian photography in fatigue assessment

U -•ftuber ITC-02-06-76-403
4
USE OF KIRLIAN PHOTOGRAPHY IN FATIGUE ASSESSMENT.
' C. Thomas(Reeves.-saty En1neeiing Graduate ProgramUSAMC Intern Training CenterRed River Army Depot
z Texarkana, 'xas /5501
. ,DeceI• 75
Final /epwrt ./$
APPROVED FOR PUBLIC RELEASE: DISTRIBUTION UNLIMITED
Prepared for
SAFETY ENGINEERING GRADUATE PROGRAMAND TEXAS A&M UNIVERSITY GRADUATE CENTERUSAMC Intern Training Center - USALMCRed River A-my Depot, Texarkana, Texas 75501
• , * * ,S-/ / .o'

It__AI _C_ -A ';t I ' I ffrdS51CU,41TY'-•-A"*,, I &?I't•) 0 H= luI% &A F v•Wlh•,• Ieee P~n•P.pd)
REPORT DOCUMENTATION PAGE _ _ AD __N:_TRU("r__N_sivr FoRv, cmij.Ii..-TiNo t,',w)M
-'.' 04 tPO0 R T P4 t~o-,.T ri C" VI ACC LSS11.1N NO. 0 . A CI P. 1 ' . C. IALC, NUME*A.
4. TITL t (and A,•bhe*.) TTP r rE'PC" P[nlOO COVENED
USE OF KIRLAN PHOTOGRAPHY IN FATIGUE ASSESSMENT FinalS. PrMtrOptMING ODR. REPOR? NUMNEr
".AUTH40N.) S, CONT ACT OR GRANT NUMBER(@)
C. Thomas ReevesS. PENPOMWING ORtGANZAI1ON NAME AND AfLAILSI t0. PROGRAM El EMNT. PROJECT. TASK
Safety Engineering Department ARFAI 014K UNIT NUMBERS
Intern Training CenterRed Rlv'.r Army Depot, Texarkana, Texas 75501
I11 CONTROLLING OFFICE NAME AND ADORESS It. REPORT DATE
Safety Engineering Department and Texas A&M i NUME OF r
University, Red River Army Depot, Texarkana, 57T XI4. I•r•• Ar CY N AME S AOORESS(II differnmt from Control5ling Office) iS. SECURITY CLASS, (of Whi report)
Unclassified1So. DECLASSIFICATION'/OWNGRAOING
SCHEDULE
1. DISTRIBUTION STATEMENT tot Weh. Report)
Approved for Public Release: Distribution Unlimited
17. DISTRIBUTION STATE=MENT (*of /the botroct enteredl in Block 20, it --lo- ýM` • • "•
U0. SUPPLEVENTARY U~oTrs -•-•
This work was performed by C. Thomas Reeves under the supervision of Dr.Ronald S. Morris
1S. Kuf WOpoS (CWtinle on i evotaa odd IS noceo.ary and Identify by block niwmbor)
Kirlian Photography; Fatigue; Stress
*Ilk ABSTRACT (Continue an ,vr"a •ide It necessary Identity 5, black numbWr)
In this research, assessment of fatigue by using Kirlian photography was in-vestigated. Both mental and physical fatigue were included in the study. Themental stressor used was engineering graduate school class lectures; the phy',cal stressor was softball games pla.ed under hot, humid atmospheric conditi,The photograph parameter used to indicate fatigue was the fingertip's coronadiameter. A Wilcoxon signed rank test at the 0.99 level of significance "deter-mined statistically significant corona diameter changes did occur in both cases.
The diameter significantly increased after applying the .hvsical streorDD 1473 EDIoOn or I MOV 6S IS OBSOLETE
.JECUmiTY CLASSIFICATION or THIS PAGE (Who* "ea •EIteer

hECUmI?, CLASSIVICAVION OF THIS PASI(Wbm D*.b ft
'Aecre3sed after applying the mental stressor.
SUCURgyV CLASSIFICATION or THIS PAOIECWhen0. DatIe Ue

FOR EWORD
The research discussed in this report was accomplished as part ofthe Safety Engineering Graduate Program conducted jointly by the USAMCIntern Training Center and Texas A&M University. As such, the ideas,concepts and results herein presentel are those of the author and donot necessarily reflect approval or acceptance by the Army.
This report has been reviewed and is approved for release. Forfujrther information on this project contact Dr. George D.C. Chiang,Chief of Safety Engineering, Red River Amy Depot, Texarkana, Texas.
Approved:
Dr. George EY.C. Chiang. ChiefSafety Engineering i
For the Commnander
/Jme LZt netDirector, ITC

ABSTRACT
Research Performed by C. Thomas Reeves
Under the Supervision of Dr. Ronald S. Morris
In this research, assessment of fatigue by using Kirlian photography
was investigated. Both mental and physical fatigue were included in the
study. The mental stressor used was engineering graduate school class
lectures; the physical stressor was softball games played under hot, humid
atmospheric conditions. The photograph parameter used to indicate fatigus
was the finertip's corona diameter. A Wilcoxon signed rank test at the
0.99 level of significance determined statistically significant corona
diameter changes did occur in both cases. The diameter significantly
increased after applying the physical stressor and decreased after apply-
ing the mental stressor.
e-1 ii 7A

AC KNO WLEDGMENTS
This author thanks Dr. Ronald S. Morri: for his assistance and
guidance throughout this research and for serving as my committee chair-
man. For serving as members of my committee. I wish to thank Dr. John
M. CoVan and Dr. S. Bart Childs. Gratitude is also extended to the mem-
bers of Safety Class VI for donating their time as subj'icts in this
experiment.
During the course of this work, the author was employed by the
United States Army as a career intern in +-I,^ Army Materiel Command Safety
Engineering Gradu~te Program. He is grateful to the United States Army
for the opportunity to participate in this program.
The ideas, concepts and results presented herein are those of theauthor and do not necessarily reflect approval or acceptancei by theDepartment of the Army.
iv

CONTENTS
Chapter Page
I INTRODUCTION . . . . . . . . . . . . . . . . . . .* . 1
I I BACKGROUND . . . . . . . . . . . . . . . . . . . . . 3
Kirlian Photography ....... . . . . 3
Fatigue . . . . . . . . . . . . . . . . .. . . . . . 8
III EXPERIMENTAL DESIGN . .. . 6... .
General Considerations . . . . . . . . . . . . . . . . 16
Procedure Descriptions. .. . . .. 16
Design Parameters . . . .. .. . ... .. . .. . .17
Correlation Questionnaire . . . . . . . . . . . . . . 31
Invoking Fatigue .. ... . . . .. *.. . 36IV ANALYSIS OFDATA . .. .. .. .. .. .. .. .. . .38
Data Elimination . . . . . ~. . . . . . . . . . . . . . 38
Statistical Signfcnifc n e........39
Phenomenon Analysis . ... .. .. . .. .. .. . .43
V CONCLUSION . . . . . . . . 48
REFERENCES . . . . . . . . . . . . . . . . . . . . . .51
1v

LIST OF FIGURES
Figure Po
1 TYPICAL SIMPLE KIRLIAN DEVICE . . . . . .. . . .. 4
2 SCHFMATIC DIAGRAM OF THE R-F DEVICE . . . . . ... e . 9
3 EQUIPMENT SET-UP . . . . . . . . . . . .., . .. 10
4 FINGER BRACE DEVICE . . . . . .., .. ., * * , , , , ,18
5 ELECT¶.ODE AND FILM GUIDE APPARATUS . . . . . . . . . . 19
6 SUBJECTS' KIRLIAN PHOTOGRAPHS BEFORE WASHING WITHISOPRCOPYL ALCOHOL . . . . . . . . * o e o s 21
7 SUBJECTS' KIRLIAN PHOTOGRAPHS AFTER WASHING WITHISOPROPYL ALCOHOL . . . . . . . ... .. .. .2
8 FOUR TYPES OF KODAK PHOTOGRAPHIC PAPER EXPOSEDFOR 25 SECONDS . . . . . . . . . . . .. . 24
9 FOUR TYPES OF KODAK PHOTOGRAPHIC PAPER EXPOSEDFOR 15 SECONDS . . . . . . .. . . . .. . 25
10 THREE 'BASELINE' PHOTOGRAPHS ........... .. 27
11 PHOTOGRAPHS SHOWING THE FOGGING EFFECT ........ 28
12 ILLUýbTRA`TiON OF DIAI4ETFR MEASUREMENTS . . . .. . . . . 2913 KIRLIAN PHOTOGRAPH SHOWING DIAMETER MEASURING
POINTS 30
14 PHOTOGRAPHS SHOWIN•G SEVERAL POSSIBLE START AND "NDPOINrS FOR DIAMETER MEASUREMENTS .... , 32
15 PHOTOGRAPH SHOWING NO DEFINITE START AND ENDPOINTS . e e a s a v e s . . .s o 33
16A& B DAILY QUESTIONNAIRE . . . . . . . . . . . . . . . . . .34&35
17 PHOTOGRAPHS SHOWING TYPI(AL CORONA DIAMETERDECREASE AFTER APPLYING MENTAL STRESSOR . . 44
18 PHOTOGRAPHS SHOWING TYPICAL CORONA DIAMETERICREASE AFTER APPLYING PHYSICAL STRESSOR . 45
viL _ _ _ _"

LIST OF TABLES
Table Page
1 MENTAL STftESSOR DATA ...... 40p PHYSICAL STRSSOR DATA . . ....... * 41
3 WILCOXCN SIGNED RANK TEST DATA FOR MENTAL ANDPHYSICAL STRESSORS . . . . . . ,,, *to -42
vii
vii
CHAPTER I
INTRODUCTION
In recorded and prerecorded history of the world, there are fout,4
numarous references to the existence of an invisible energy or fluid
which Interpenetrates the universe. This energy has been given various
names by various cultures: the Chinese called it "ch'1", the Hindus
and Yogis "prana", the ancient Egyptians "ka", the Hawaiians "mana", etc.
This energy has traditionally been associated with life forces.
In 1944 Grischenko suggested the possibility of the existence of a
fourth state of matter in living beings. He introduced the concept of
biological plasma. Bioenergetics aims at studying both energies of pro-
cesses which take place internally and radiation of energy into the soace
which surrounds the organism.
If-there is, indeed, a state of matter which surrounds the human
body, it is reasonable to hypothesize that it would vary directly with
the physical state of the body. For example, if the human body is func-
tioning properly with no indication of physical or mental decrement or
disease, the biological plasma should reach a stable state with ao sign of
deterioration or distortion. However, if the body should suffer an all-
ment, this hMological plasmna should also be affec'bed.
In 1970 Kirlian photography (also knowm as radiation field photo-
graphy) bas introduced to the United States through a book: Psychic
Discoveries Behind the Iron Curtain. (11)* Using ordinary photographic
*Numbers in parentheses refer to numbered references in the List ofReferences.
1i

2
film, Kirlian photography couples a high voltage, hinh frequency AC po.
tential with a living organism and results in the production of a photo-
graph of pulsating, multicolored lights streaming from the organism. A
wide range of scientists, based on repeated experiments, suqgest that
these light eamnatiors vary with the mental and physiological state of the
person being photographed. If a method of relating these biological and
mental states to the Kirlian photograph is developed, Kirlian photography
offers a revolutionary new tool for viewing and investiqatinq bioloalcal
plasma or bioenergy of organisms. All biological sciences, as well as
agriculture, criminology, etc., might benefit from its application. In
modern industry, the employee, as well as the employer, may find an apl!-
cation for Kirlian photography in relaXtion to fatigue measurement and
control.
Fatigue is a deceptive term and will be considered at length in the
succeeding chapter. Environmental stresses such as heat, excessive noise,
intense light, and human interactions can all lead to a condition of
fatigue which in turn can lead to output degradation. *Deterioration of
performance is accompanied by a decline in output quality a•nd quantity,
while a deter; -stion of alertness can lead to c~relessness which may pro-
duce severe safety hazards." (1) To date, a method of fatigue measurement
has not been developed with any degree of success. The direct effort of
this research is to investigate the use and potential application of Kir-
l!an photography as a predictor of physical and mental fatigue. This
research will investigate its statistical significance as a method for
predicting physical and mental fatigue by correlation of a photographic
phenomenon, i.e. the change in corona diameter.

CHAPTEI. 11-
J, tI' a
BACKGROUND - - ..
Kirl an Photography
In 1925, A.E. Powell published a monograph entitl1d "The Etheric
Double". In it, he statts that every solid, liquid, and gaseous per-
ticle of the physical oody is surrounded with an etheric envelop...
In sizes It projects about one ,Ourth of an inch beyond the skin...
In appearance, the etheric double is a pale violet-grey or blue-grey,
faintly luminous and coarse or fine in texture, according as the dense
physical body is coarie or fine... Persons who have lost a limb by
mputation sometimes c€plain that they feel pain at the extremity...
this Is due to the fact that the etheric portion of the limb is not
removed with the dense physica, portion. (10)
Sovet: experimenters, Semyon and Valentin& Kirlian, have developed
a method of photographing the electrical state of various objects In
high frequency electric discharge. The descriptior of the Kirlian
photograph is almost idertical to Powell's etheric double description.
Although radiation field photography dates prior to the Kirlians' acci-
dental rediscovery of the process, they were the first to consider the
light patterns as representation of biological "life activities".
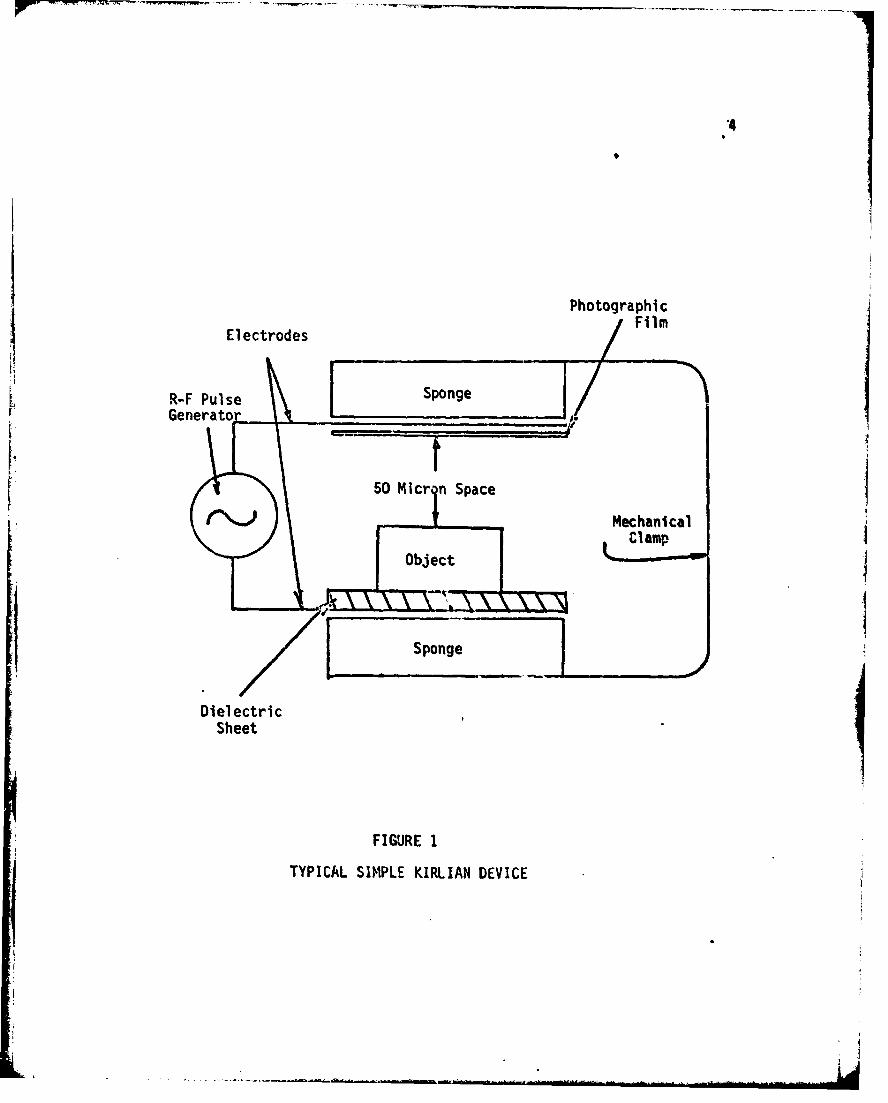
A typical simple Kirlian device is shown in Figure 1. (12) The
object to be photographed is placed on a film sheet (emulsion side
toward the object) between two metal plates to which a voltage is
applied. When a part of the human body is photographed, only one elec-
trode Is required s.nce the body effectively acts as a ground.
3 1
".4
Photographic
Electrodes
R-F Pul se SogGenerato
S•50 Mic n Space
MechanicalClamp
Sponge
DielectricSheet
FIGURE 1
TYPICAL SIMPLE KIRLIAN DEVICE
. j

5
By ising a high voltage, high frequency AC potential coupled with
a living organism, the Kirlians obtained a picture of the surface of
the organism in contact with a film sheet and a halo of high frequency
discharge surrounding the organism. The electrode and the human sub-
ject are separated by a dielectric capable of withstanding the applied
voltage and the film sheet in contact with the body. The Soviets
indicate that a certain crittcal spbcing be maintained between the
object and the unexposed film. (2) Excellent results have been obtained
in the U.S. using direct contact of subject and film. A high frequency
current, oscillating at 75,000 to 200,000 times a second, flows pri-
marily on the surface rather than through the body of the subject (the
skin effect), thus minimizing any physiological effect. (5)
In this system, i.e. a flat capacitor formed by the object observed
and the metallic dielectric-coated electrode, the high frequency plas-
mic micro-channels interconnect every pair of dipole molecules lying
opposite to each othebr. Moving along the micro-channels are electrons
and ions carrying information about the object under consideration. The
current of autoelectron emission depends on two variables: electric
field intensity and work function of the electron escaping from the
object. Electric field intensity depends on the object geometry, while
the work function of the electron is dependent on numerous physico-
chemical factors which account for a variation of the energy levels in
the electron. Taking place continuously in the living organism are
physico-chemical reactions bringing about changes in the electric parame-
ters of the cells, as well as in the work functions of the electrons.
These variatwut are observed in the brightness, color, and dynamics of the

6
micro-channels. (1) The electrons and ions of the discharge act upon
the photographic emulsion in a manner analogous to light rays. Most of
the applied power dissipates in the corona. The discharge contains
waves ranging in the spectrum from ultra-violet, visible, infra-red, to
portions of the electro-magnetic spectrum.
The foremost researchers of Kirlian photography in America, Týelm4
Moss and Kendall Johnson, have tried to correlate various observations
found in their photographs to various physiological parameters. Specifi-
cally, color film generally reveals a blue-white corona sprinkled with
"bubbles" (high intensity discharge points which appear as white dots in
the photograph) if the person is in a calm, relaxed state. When the
person becomes anxious, nervouss or emotionally aroused, his corona
may omit the bubbles and usually contain a red blotch. Attempts to corre-
late this dramatic change with such physiological parameters as vasocon-
striction, temperature, galvanic skin resistance, and sweat secretion has
resulted in poor correlation. (10)
Skin is the first barrier to be overcome by the electromagnetic
waves. A detailed study has revealed that electrical conductivity
varies solely at nigh conductivity points rather than throughout the
integument. The cause of variation was fnund to be emotional reactions
and oxygen consumption. In the case of emotional excitation, the p^'nts
vary in diameter and there is a possibility of the points overlapping one
another to form high conductivity spots. It is important to note that
measurements are correct on dry skin alone. (1) Could this account
for the "bubbles" that Moss and Johnson described? In a condition of
relaxation, a state of comparatively low arousal exists. Nerves are
being impulsed at a relatively slow rate and nerve fibers below the

skin are more accessible to electrical Interaction. Consider an analooy
using the sense of smell. Upon first contact with a pungent odor, an
acute awareness is sensed. After a few minutes, the nerve pathways are
exhuasted and the odor sensation decreases significantly. This is called
a threshold shift. If the nerves lying beneath the finger pad, as well
as nerves in the rest of the body are being impulsed more frequently due
to an emotional stimulus, analogous to the odor, they become less sen-
sitive to succeeding impulses. This would reduce their availability
to electrical interactions possibly causing ',he "bubbles" to disappear.
"The Kirlian method can be used for an objective appraisal of the
state of living orgarisms and how they are affected by various environ-
mental factors". (1) This statement is the consensus deduced from the
general literature review done to date. The lithrature does not reveal
how the Kirlian photograph miqht correlate to the state of living organisms
or to environmental factors producing such a state.
Generally stated in the literature are inconsistencies from indivi-
dual to individual as regards the variables of a Kirlian photograph
(i.e., color, size, etc.). Wright, in attempts to monitor fatigue using
Kirlian photography, observed that in some cases, "thfrre were either no
changes or changes contradictory to previously observed phenomena". (13)
He also states (as other experimenters such as Moss and Johnson have
suggested) that physical and mental activity increases the diameter of
the corona of some subjects while decreasing that of others. This
suggests that there may be a polarity relating to the electrical charac-
teristics of living organisms.
Varying the frequency at which the photograph is taken will cause

an "object's (such as a leaf or finger pad) corot~a to appear with
brilliant detail at one frequency. change its shape at a higher frequency,
only to reapiear again with ijrilliant detail at still a higher frequency.
It is our (Moss and Johnson.) belief that some law of harmonics is respon-
sible for this capricious appearance and disappearance of the object
being photographed." (6) This indicates thait each individual may have
an optimum frequency or frequency range at which he photographs best.
In my experiment, a one plate electrode device manufactured by
Edmund Scientific Company is used. A schematic diagram of the compo-
nents is shown in Figure 2. An equipment diagram is shown in Figure 3.
An important difference in this set-up and those reviewed in the litera-
ture is the light-tight "box" built around the device. This enables the
experimenter and subject to sit in a lighted room while the photograph
is being taken. These devices reviewed in the literature, where infor-
mation was available, indicated that their photographs were taken in a
darkened room with perhaps a safelight on if photographic paper (A~s
opposed to photogrdphic film) was used. Where film was used the room
had to be completely dark. A darkened room is an environmental stimulus
likely to have more of an effect on a "novice" subject than a lighted
room and thus could possibly affect his photograph. In attempting to
develop a method of fatigue measurement applicable to industry, theI industrial environment must be kept in mind.
Fatigue
Fatigue is an elusive term. It. has become somewhat of a garbage
dump in that when a general feeling of tiredness or weariness occurs
caused by any of a multitude of factors, the term fatigue is applied.

9
117 V AC 60 HZ 3-6 VOLTS(FROM LINE) 60 HZ
(FROM VARIABLE VOLTAGETRANSFORMER)
"HIGH VOLTAGE
VARIABLE j HGH FRE-VOLTAGE TRANSFORMER OUENCYUTPUT
HIGHFREQUENCY INDUCTION COIL
,FIGURE 2
SCHEMATIC DIAGRAM OF THE R-F DEVICE
"Li

1]0
F G
FIGURE 3
EQUIPMENT SETUP (NOT TO SCALE)SEE TABLE A FOR LETTER/COMPONENT SCHEME

1.1
TABLE A: LETTER/COMPONENT SCHEME FOR FIGURE 3
LETTER CORRESPONDING COMPONENT
A High Voltage Stepdown Transformer
6 Twin Power Leads
C High Frequency Induction Coil
D High Voltage Lead To Capacitor Plate
E Plastic Finger Brace Box
F Unexposed Photographic Film
G Capacitor Plate Covered With Glass Dielectric
H Timer anJ Starter Button
I Lead From Timer To Transformer
3 A.C. Power Plug
K Operator's Light Protective Sleeve
L Light-Tight Box
N Photographic Film Storage Shelf
N Subject's Light Protective Sleeve
0 Support Stand
-1
• • , ,, . . . . . .. . .-.

.12
From the numerous definitions of fatigue it is possible to discern
some common features. Time is the most prominent of these. Fatigue
may be a short term effect which may be compensated for by relatively
short periods of rest or it may be cumulative over long periods of time:
from a day or two to several years. The classical work of Bartlett
(1943) and Drew (1940), as well as the more recent studies of Jackson
(1958) and Chiles (1955), considered fatigue effects over periods of
several hours, whereas it has now become clear that the fatigue problem
is embedded in the whole life patterns of those who suffer from it. (3)
Performance in experimental fatigue studies has shown only slight de-
crement. This small decrement has generally been attributed to the
ability of the subjects to overcome fatigue effects by consciously in-
creasing work quality or quantity (i.e.,, due to motivational factors).
This statement of slight decrement in output must be viewed carefully.
It does not seem to hold in an industrial situation when the subject is
unaware of any test situation. The emphasis on time differs substantially
from author to author but seems to be an essential ingredient of any
definition of fatigue.
A second feature in the definitions to be found in the literature
is the role of some activity in which one must engage. (3) This implies
that an activity must be an integral part of the cause of fatigue.
Reactive inhibition,, as used by behavior theorists, seems adequate to
describe decrement which occurs as a result of continued engagement in
a particular activity and at the same time does not utilize the more
complex concept of fatigue.
A third aspect of the definition of fatigue is that there must be
a link between the time and the activity. This seems reasonable upon

13
first ,nspection. It implies, however, that a difficult activity engagedin for a short period of time should result in a degree of fatiqgu. com-parable to that resulting from engagement in a simpler task for a longer
period of time. Thti appears to be an oversimplification of the concept
of the fatigue mechanism.
Evidence suggests that fatigue is a gtneralized response to stress
over a period of time. These effects may be acute or chronic depending
on the ability of the Individual to cope with the stressor. The type
of fatigue caused by hard muscular work is best identified as acute. It
results in temporary output decrement which Is relieved by rest. Chronic
fatigue Is not relieved by ordinary periods of rest or sleep and is
cumulative in its effects. It is iargely a psychological or psychiatric
probleat characterized by boredom, loss of initiative and progressive
anxiety. (8)
Stress is the body's physical, mental, and chemical react¢ons to
circumstances thik. frgghttn, excite, confuse, endanger or irritate. (8)
The cause o,1 Atress is called the stressor. A stvess reaction may have
ummediate, obvious symptoms: sweaty palms, loss of sppetite, heavy
boathihg, an increased heart rate, qtc. The reaction may also be subdued
with no outuarc indicati•,.
Stressors commctly- arising in the home, on the job, or from an indi-
vidual's invironment at large may cause acute or chronic fatigue. Any-
thing can be stressful if it is strong enough, lasts too long, or Is
repeated too often. It is also of interest to note that different age
groups, affiliatior~s, sects, educational groups, etc., have stressors"
associated with their particular category. For example, adolescence
has many charactsristie stressors as does old age.- - - -

14
The normal processes of rest, recreation and sleep usually alle-
viate conditions of fatigue. Only when the Individual is unable to
obtain recovery through there prrocesses 1Q fatigue likely to bc identi-
fled as a problem. Chronic fatigue can contribute to mental illness,
peptic ulcers, and certain aspects of heart diNease such as high blood
pressure. (8)
Fatigue Is by no means a simple physiological condition resulting
from sustained activity. It may be brought on by any one of a number of
causes or any combination of these. Thus, fatigue is a c€mlex, biolo-
gical phenomenon involving a combination of physical and mental processes.
Wright indicated that the main causes of daily fatigue are: 1) psychic
factors such as responsibility; 2) intensity and length of manual and
mental work; 3) illness and pain; 4) eating and sleeping habits; and
5) monotony. (13) He also lists several methods of attempting to measure
fatigue.. Generally mployed are performance decrement measures; the theory
behind them being that fatiguing conditions specified in terms of elapsed
time and activity will correlate to some degree of work decriment with
the passage of time. However, Cameron points out that, "performance
measures are erratic and unreliable indicators of fatigue". (3)
Thus, fatigue measurement is as elusive as the term itself. The
ability of the individual to compensate for fatigued effects during
experimentation leads to large, unavoidable variance of results. Mea-
suring physiological parmeters. such as urinary metabolites or 17-OHCS
production, seems to be a more feasible approach, but has not proved
reliable.
The important requisites in considering a method of fatigue measure-
ment are ease, rapidity, and accuracy. (4) If Kirlian photography proves

16
to be an accurate indication of fatigue. it may have wide spred use as afatigue monitor.
I

CHAPTER III
EXPERIMENTAL DESIGN
General Considerations
The work in this research utilizes equipment manufactured by the
Edmund Scientific Company which was a sembled by Wright and used for
his experimentation. For further details on this apparatus, see Refer-
ence 13. Some changes were made to Wright's setup to more adequately
control the experiment. These will be discussed subsequently.
Procedure Description
Before proceeding. a qualitative description of the procedure used
in making a Kirlan photograph will be presented. This will benefit
the reader by giving a more vivid image of what actually takes place
in such an experiment. Reference to Figure 2 and 3 on pages 9 and 10
will be helpful.
The subject enters the room and seats himself beside the equipmentl
he is facing the equipment operator. The subject cleans his right,
index finger using a paper towel soaked with isopropyl alcohol which
evaporates in seconds.
While the subject is cleaning his finger, the equipment ooerator
Inserts a piece of photographic film between the finger guide and capaci-
tor plate housed in the light-tight box. This is done through an open-
Ing on the operator's end of the box which Is protected from light entry
by a black plastic sleeve.
The subject then inserts his right hand into the black plastic
sleeve on the side of the equipment facing him. The sleeve covers his
16

arm to the shoulder level. The subject's hand and wrist are inside the
light-tight box. The subject inserts his right, index finger into the
finger guide. He is asked to close his eyes and relax.
The operator depresses a timer switch and the exposure is made. The
subject feels no shock sensation. The subject removes his arm and leaves
the laboratory. The operator removes the photoqraphic paper and places
it in a light-tig,.t envelope for subsequent chemical development.
Datign Parameters
Wright discusses several design parameters and his attempts to
control them. (13) Those which he found to be significant are common to
Kirlian photography. Several improvements have been implemerted into
the equipment that he assembled to further control these d-Agn parameters.
Wright found that finger angle and finger movement both had major
influences on the photograph produced. 14e controlled both by using a
plastic box with a hole in the top in which the subject could insert his
finger. The subjectks right, index finger was inserted to the second
knuckle.
Experimentation Indicated a large variation in fiter angle was
still possible. Finger movement was greatly hampered but further con-
trol seemed necessary. To control both finger movement and angle more
adequately, a second brace was fused into Wright's finger guide. See
Figure 4 and S. This device now contacts the finger in the first and
second knuckle areas and greatly reduces the possibility of finger move-
ment while providing a more stable finger angle from photograph to
photograph.
As previously mentioned* it is necessary to set up Kirlian devices
S ;• : ,• _ • •.. ,. . . .. . . .. ... _*' J~ w nil m nL ' I] • • .. . • • • " I .q II I -- I. _' .,rlm . . ... ...

18
FigerPrimary
inger BracetDevice
SecondFinger--Brace
*A
Stability Notch
FIGURE 4
FINGER BRACE DEVICE
1

19
Finger BraceStability Notches
-Film
•-Dielectric
• , "-'-Capacitor Plate
irr•tlm Guide
FIGURE 5
ELECTR3DE AND FILM GUIDE APPARATUS

20
in dark rooms to avoid fogging the film with light. Wright's equipment
was set up and used in a dark room. Humans have a general fear of the
dark due to their extreme dependency on eyesight as their main sense organ.
Conducting experiments in a dark laboratory would intuitively influence
the results of an experiment of this nature; especially for novice sub-
jects. Based on this reasoning, a light-tight box was built to house the
capacitor plate,, finger guide, and photographic paper.
Consideration was given for the needs of the operator and the sub-
ject in the box construction. The operator's access opening was made
large enough to acconmmodate working with both hands inserted in the box
up to his elbows. A shelf is provided for storing boxes of photographic
paper. both exposed and unexposed. The subject's entry opening is
,sufficiently large and acts as an arm brace which facilitates steadying
the finger to be exposed.
Wright complained of an e.dge effect (a yellow blotch) and attributed
it to positioning the finger too close to the edge of the capacitor
plate. The plate he used was composed of a 4 x 5 inch aluminum plate
supplied with the equipment and a piece of aluminum wrap (about 5 x 6
inches) which he placed on top of the plate. These were replaced with
a 5 x 6 inch piece of aluminum firewall (the type used in fireplace
construction). No 'edge effects' were observed using this type of plate.
The skin effect was mentioned in the previous chapter. Anything
that is on the skin (the first protective barrier of the body) could
possibly influence the photograph by changing the conducting paths of
the micro-channels involved. To minimize such effects, isopropyl alcqhol
(99% vol.) is used to remove contaminants. Figures 6 and 7 show the same
subjects' photographed before and after washing their fingers with

21
SUBJECT X SUBJECT Y
FIGURE 6
SUBJECTS' KIRLIAN PHOTOGRAPHS BEFOREWASHING WITH ISOPROPYL ALCOHOL
l • , r"

22
SUBJECT X SUBJECT Y
I
FIGURE 7
SUBJECTS' KIRLIMtI PHOTOGRAPHS AFTERWASHING WITH ISOPROPYL ALCOLOL

23
isopropyl alcohol. This is an Important consideration in Kirlian photo-
graphy experiments as a contaminated finger may have tremendous effects
on the results.
Virtually any type of photographic film or paper may be used in
Kirlian photography. Several types of film and paper were sampled. Fi-
gure 8 shows four types of Kodak photographic paper. They were all ex-
posed within seconds of each other, are of the same subject, have an
exposure time of 25 seconds, and were processed in the same bath solu-
tions. The variations in the corona produced are obviously apparent.
In view of the parameter desired, i.e. the corona diameter, the distinct
beginning and end points and the relatively large size of the corona
produced by Kodak Polycontrast Rapid RC paper are the reasons for using
this paper for this experiment.
The main inadequacy of using photographic paper as opposed to film
is Its inability to produce copies by simple procedures. It does have
the advantages of producing a direct positive image, being easily pro-
cessed, being less expensive overall and being easy to manipulate.
The exposure time for polycontrast photographic paper was determined
to be most adequate at 25 seconds. Figure 9 shows the effect of a
shorter exposure time for the four types of photographic paper shown in
Figure 8. The exposure time for the photographs in Figure 9 is 15 seconds.
Notice the distinct change in the corona in all of the photos except that
of the polycontrast type paper. Thus, slight variations in exposure
length caused by the timer are minimal with polycontrast paper.
A 25 second exposure produces good quantitative results with respect
to corona size. Also, as noted by Wright, the type of data desired mustI
be considered. For this research, it is desired to obtain a steady state
M

24
A BPOLYCONTRAST MEDALISTRAPID RC F-3
C DVelox VeloxF-3 F-2
FIGURE 8
-FOUR TYPES OF KODAK PHOTOGRAPHIC PAPEREXPOSED FOR 25 SECONDS

25
A BPOLYCONTRAST MEDALISTRAPID RC F-3
!4
c DVelox VeloxF.3 F-2
FIGURE 9
FOUR TYPES OF KODAK PHOTOGRAPHIC PAPEREXPOSED FOR 15 SECONDS
1I

26
appraisal of the subject's condition at the time of the photograph. Thus,
arelatively long exposure time is desired.IBefore any meaningful measurement of increase or decrease in corona
diameter can be made, a repeatable base level must be substantiated. To
do this, three photographs were taken of the first five subjects before
any stressor was applied. Figure 10 shows a typical result. Notice
that even the streamer regions are quite similar as regards length and
density. Notice, also, the consiste-icy of the shape of the perimeter
from one photograph to the next.
One problem encountered in using polycontrast papers but not the
others, was fogging. Figure 11 shows two typically fogged phoLographs.
The fog was not consistent from photograph to photograph and did not
always appear. Even with extra precautions taken to avoid fogging the
I paper with light during all of the operations, the fog would sometimes
appear. The fog hampers the extraction of the desired data only in the
most severe cases. Notice that on both of these photographs, the corona
diameter may be distinctly measured. This phenomenon has not been explain-
ed.
The temperature varied from 770F to 79OF measured inside the light-
tight box and from 76OF to 78OF in the open room. Humidity remained
constant in the air-conditioned laboratory.
Difficulty in measuring the corona diameter was encountered. The
finger pad and coront are, in general, elliptical rather than circularin shape. For this reason two diameters are measured as illustrated in
Figure 12.
Another problem in diameter measurement is encountered in determin-
ing exactly where the measurement begins and ends. Figure 13 shows a

27
A B• C
FIGURE 10
THREE 'BASELINE' PHOTOGRAPHS
j

26
II
%tow
FIGURE 11
PMOTORAPHS SHOWING THE FOGGING EFFECTS

29
D•Ii
°/ ..
FIGURE 12
ILLUSTRATION OF DIAMETER MEASUREMENTS
t4

i p
~30
FIGURE 13
KIRLIAN PHOTOGRAPH SHOWING DIAMETER MEASURING POINTS
' l I
L1• . . .. . .. . ... _' -2 U 2 .. . .. . . .-.. ... .-... ..-

31
typical Kirlian photograph and its diameter measurement points. Notice
that streamers extend beyond the diameter end points. The diameter
measures the most dense area of the corona omitting the hairline stream-
ers and the fray area surrounding it. This diameter was chosen becaute
of its relative ease in determining start and end points. It should
be emphasized that even usinq this measuremente some photographs are
difficult to interpret. Notice how Figure 14 has several locations
where start and end points could be chosen ,h1e Figure 15 shows no
definite start or end points. A general rule of thumb followed in this
research is to choose start and end points that include al1 but the
hairline streamers on the extremities.
Correlation Questionnaire
A questionnaie was given to each subject or, each day that he par-ticipated in the experiment to help assess his physical and mental condi-
tions at the time of the experiment. Figures 16-A and 16-B show the con-
tents of the questionnaire.
As mentioned previously, no clear cut method has been developed to
measure fatigue. Several relationships seem to give some indication
of fatigue or even contribute to it (as in the case of sleep deprivation).
The questions in the questionnaire are based on general considerations
relating wo fatigue studies found in the literature. Some of the questions
are based on the following factors.
"It seems clear that performance effects reported in studies in
fatigue are of the kind found in studies of sleep deprivation and attri-
buted to high rather than low arousal". (3) Thus, sleep quantity as
well as quality san to be directly involved in fatigue effects.

32
FIUR 14
PHOTOGRAPHS SHOWING SEVERAL POSSIBLE START AND ENDPOINTS FOR DIAMETER MEASUREMENTS

33
FIGURE 15
PHOTOGRAPH SHOWING NO DEFINITE START AND ENUPOINTS FOR DIAMETER MEASUREMENTS

34
IDENTIFICATION DATE C.L TYPE
I. In the past 24 hours, how many hours have you spent engaged In:
1. SLEEP (INCLUDING NAPS): HOURS
2. QUALITY OF SLEEP 1 2 3 4 5very very
restFULL restLESS
3. MANUAL WORK: . HOURS
4. INTENSITY OF NO. 3: 1 2 3 4 ,very veryeasy hard
5. MENTAL WORK: HOURS
6. INTENSITY OF NO. 5: 1 2 3 4 5very veryeasy hard
7. EXERCISE: HOURS8. INTENSITY OF NO. 7: 1 2 3 4 5
very veryeasy hard
FIGURE 16-A DAILY QUESTIONNAIRE
-N~i z r tf C - _ _ _ _ _ _ _ _ _ _ _ _ _ _ _ _ _ _ _ _ _ _ _ _ _ _ _ _ _

35
II. Did you eat breakfast? YES ____ NO ____
III. Have you had any injury or contracted any illness in the
past 24 h~urs? YES ____ NO ____
IV. Have you had any alarming news in the past 24 hours?
YES - NO ____
V. How much tim~e were you mentally involved in the class or
engaged in taking notes? _____MINUTES
VI. How stimulating and interesting was the lecture today?
1 2 3 4 5put me fascinated
to sleep
VII. How much sucrose (sugar) have you had this morning? tsp.
I'1 ~COM4MENTS
FIGURE 16-B DAILY QUESTIONNAIRE

36
Acute fatigue is the type generally considered produced by hard
physical labor. If it is not alleviated by sufficient, restful sleep
or rest, it may compound an individual's subsequent ability to cope
with fatigue the following day, thus possibly affecting the corona. There
is a similar analogy as regards mental fatigue and exercise. The infor-
mation obtained by Questions 11 through IV are self-explanatory: any one
of these areas may influence the corona.
When a stressor acts on a human, the stress response may involve
whole systems of biological emergency mechanisms. This implies that an
abnormal demand on energy sources would accompany such a response and
thus. be fatiguing. Keep in mind that the same stressor may evoke en-
tirely different responses in different people and is very qualitative
in basis. "Thus, the duration of the stress response, not necessarilyIthe duration of the stressful conditions, is the critical variable". (11)
This is the reasoning behind Questions V and VI. The length of the
stressful event is recorded at the top of the questionnaire under the
heading C.L.IMcFarland reports that "it is hard to explain how sugar might coun-
teract the effects of fatigue in mental performance, since it is known
that the metabolic cost of mental work is very slight indeed". (7) It
can be theorized that increased oxygen consumption is due to increased
muscular tension associated with ;ustained attention. Thus, it is
hypothesized that consumption of sugar should help nullify any diameter
changes due to either mental or physical fatigue.
Invoking Fatigue Loads
Since a stressor may not produce the same amount of fatigue from

37
Individual to Individual, a standard amount of fatigue cannot be qenerated
for each sub.iect involved. By choosing the test subjects from similar
backgrounds, educational groupings, Job groupings, age brackets and sex;
exposing them as a group, 'to the same mental and physical stressors,
similar fatigue effects may be evaluated.
The subjects in this research have the following similarities:
age range - 22 to 29; occupation - graduate student; educational back-
ground - engineering graduates; sex - male; marital status - half the
subjects are married and half are single.
The mental stressor used for these subjects is graduate school
class lectures. Two of the classes are qualitative type courses totaling
2 hours of lecture, three times a week. One of the classes is a quan-
titative course lasting 1' hours, two times a week. The physical stressor
used for this research is softball games lasting about 1½ hours.
A Kirlian photograph is taken before and after the stressor is
applied. The photograph is developed in a darkroom, and the diameter
mieasurements are taken and recorded.

CHAPTER IV
ANALYSIS OF DATA Ct.*
Data Elimination
Three major pieces of data were collected about each subject:
1) a medical history report, 2) a daily test questionnaire,) and 3) theI
Kirlian photographs. Each was analyzed to determine whether or not
specific data o r data sets should be eliminated from analysis.
The medical history report form used in this study is the standard"tReport of Medical History" form used by enrolling students at Texas A&M
University. Copies of this form were obtained from Texas A&M Univer-
sity. These forms were reviewed to determine if' the subjects had anyserious physical problem which might lead to an unusual corona. Specd-
fically, sugar in the urine, fainting, high or low blood pressure, fre-
quent anxiety or depression, indication of emotional problems, and the
need to restrict physical activity in the past five years were viewed
most critically. It was arbitrarily chosen that if a problem existed
in any combination of three of the above categories, the subject would
not be used in the experiment. No subject was dismissed on these grounds.
Next the daily test questionnaires were compared to the daily photo-
graphs. Each photograph was considered on a qualitative basis in view of
what the weekly trend of the corona si;.e appeared to be. If any distinct
variation, either a larger or smaller corona, was noticed, the daily Ji
questionnaires for the week were compared. Very few photographs were
eliminated due to questionnaire abnormelities. One elimination occurred
when one subject's corona on a Monday morning was unusually dispersed
38

39
with no distinct central corona. It was determined from his questionnaire
that he had had an inusually low amount of sleep and an unusually high
amount of exercise over the preceding 24 hours; Sunday, he had taken his
family to an amusement park by car some 200 miles away. Thus, this data
point was eliminated.
Next, the photographs themselves were qualitatively evaluated. As
mentioned earlier, a fogging effect made data extraction very difficult
in certain cases. Also, as mentioned in the preceding chapter, some
photographs did not lend themselves to distinct diameter measurements.
When no reasonable beginning or end points could be determined, the
photograph was eliminated.
Following the above data elimination procedures, two to five data
points were obtained for each subject and for each stressor. The dia-
meters were averaged and rounded to the nearest millimeter. Tables 1 and
Spresent the mental and physical stressor data, respectively. A Wilcoxon
, !VineJ r,;., test was performed on each averaged diameter, i.e. DL and 0ws
-eir each stressor. Table 3 presents this data.
Statistical Significance
For the mental stressor (graduate school classes) no consideration
was given to the 1lrvgth or quality of the class. That is. the fact that
the cla,. laste<J Pg hours or 2 hours was not 'weighted' in any way.
Likewise, whether or not the class was a qualitative or quantitative type
lecture was not coi ''ired. Again, let it be mentioned that the same
stressor may initt)..e entirely different stress reactions in different
individuals. It is desired to determine whether or not these mental
stressors significantly affected corona diameters; the degree to which
they affect the corona will be left for future research.

40
TABLE 1: MENTAL STRESSOR DATA
Subject Before After Difference* Signed RankOIL DW D DL Dw DL D Dw
TR 27 24 25 21 2 3 10.5 12.5
JR 30 23 26 21 4 2 16 7
G6 28 22 26 23 2 -1 10.5 -3.5
3M 26 23 25 22 1 1 5 3.5
BD 29 24 25 21 4 3 16 12.5
C8 30 24 27 21 3 3 13.5 12.5
RP 23 21 22 19 1 2 5 7
RK 28 24 24 21 4 3 16 12.5
LW 28 28 23 21 5 7 18.5 19.5
HY 31 26 25 20 6 6 20 18
CM. 24 22 23 20 1 2 5 7
TB 23 21 21 18 2 3 10.5 12.5
BT 24 22 23 19 1 3 5 12.5
21 19 20 15 1 4 5 16.5
KH 23 22 23 20 0 2 1 7
TP 19 16 17 14 2 2 10.5 7
Pi 19 15 18 15 1 0 5 1.5
RP 27 26 22 19 5 7 18.5 19.5
BB 25 19 22 19 3 0 13.5 1.5
HT .... 23 21 24 25 -1 -4 -5 -16.5
• 7m A2.4! 2.90*Difference DL- DL
BEFORE AFTER ,a.
0r W- Du.5 20"BEFORE 20

41
TABLE 2: PHYSICAL STRESSOR DATA
Subject Before After Difference* Signed RankDL Dw DL DW DL Dw DL DW
Cm 29 27 39 28 10 1 12 3
LW 28.5 24.5 31.5 27.5 3 3 8 8.5
CB 30.5 25 34 25 3.5 0 9 1
RP 27.5 25 31.5 28 4 3 10 r..5
GJ 25.5 23 26.5 25.5 1 2.5 2 6.5
KKH 33 27 34 29 1 2 2 5
TR 23.5 24 25.5 23 2 -1 5 -3
KKP 28.5 27 30.5 29.5 2 2.5 5 6.5
PH 29 21 31.5 26 2.5 5 7 12
HY 32 25.5 34 30 2 4.5 5 11
JR 25 20 31.5 24 6.5 4 11 10
KW 20 17 21 18 1 1 2 3
u - 3.20 2.46
a * 2.66 1.54-T 0 3
* Difference -L - DLE or DO A -
AFTE BEFREWAFTR BEORE

42
TABLE 3: WILCOXON SIGNED RANK TEST DATA FORMENTAL AND PHYSICAL STRESSORS
MENTAL STRESSOR; a-O.01
"H0 : Ul 02
"H1: ii1 0~12
TDL" 5 <v 37 - TTABLES ; Reject Ho
T -*20 < 37 TTABLES ; Reject H.
PHYSICAL STRESSOR; a-O.01
HO: 0 : 1*2
HI: v, v2i*
T 0 < a3U TTABLES ; Reject Ho
TD4- 3 < 3- TTABLES Reject H,

43
For the 20 subjects included in the experiment, a Wilcoxon signed
rank test was used to test the hypothesis:
Ho: 01 " 12 Equation 1
where
"U* average corona diameter before applying stressor
"u2 * average corona diameter after applying stressor
At the 0.99 level of significance, the above hypothesis may be rejected.
There is, therefore, a significant change in corona diameter after apply-
ing the mental stressor. (This test was performed for both diameters,
0L and D0. The above conclusion holds for both diameter measurements.)
Figure 17 shows typical results.
For the physical stressor (softball games) twelve test subjects were
included in the experiment. The field positions played were different
and in two cases, the test subject did not play in the actual game. They
did participate in warm-ups and they did stay to watch for the entire
game. The games lasted for approximately 1% hours. The temperature at
the time of the three games was 850 F or above. The relative humidity was
72% or above. Two data points were obtained for each test subject and
the data point diameters were averaged for each subject.
The hypo..hesis, i.e. equation 1, was tested using a Wilcoxon signed
rank test at the 0.99 level of significance. The hypothesis was rejected.
There is a significant change in corona diameter after applying the phy-
sical stressor. Figure 18 shows typical results.
Phenomenon Analysis
The average change in corona diameter for the mental stressor was
Si

44
SUBJECT A
BEFORE MENTAL STRESSOR AFTER MENTAL STRESSv.R
SUBJECT B
FIGURE 17
PHOTOGRAPHS SHOWING TYPICAL CORONA DIAMETERDECREASE AND CONCENTRATION AFTER APPLYING MENTAL STRESSOR
S.i .4

45
0,SUIJECT C
BEFORE PHYSICAL STRESSOR AFTER PHYSICAL STRESSOR
rC
SUBJECT D
FIGURE 18
PHOTOGRAPHS SHOWING TYPICAL CORONA DIAMETERINCREASE AFTER APPLYING PHYSICAL STRESSOR

46
2.4 mm. This represents a decrease in corona size. This decrease ranges
from -4 mm (an increase in diameter) to 7 mm. The average variance is
3.4 mam.
The average change in corona diameter for the physical stressor was
2.9 mm. This represents an increase in corona size. The increase ranqes
from -1 nin (a decrease in diameter) to 10 mm. The average variance is
4.7 nmm. This large variance, as well as the large variance calculated
for the mental stressor, provide further evidence of the wide variation
of stress responses among individuals. In other words, this large
variance may be expected when performing experiments of this nature.
The question which natur3lly arises is that of why an increase in
corona size when a physical stressor is applied and a decrease when a
mental stressor is applied. At this time, it is impossible to make any
definite statements regarding this phenomenon. Perhaps the mental stressor
sufficiently 'mentally drains' the subject, thereby reducing his body's
energy field.
The subject's body movement is quite restricted during the lecture
periods and his metabolism is in a low state. This does not seem to be
a reasonable explanation. The pre-lecture photograph is taken shortly
after the subject has been sleeping for several hours, a state of low
metabolism.
The increase in corona diameter with the physical stressor seems more
explainable but no substantiated statement can be made regarding the phy-
sical cause of the phenomenon. The softball games, while tiresome, are
not physically exhausting such as would be a mile run against the clock
or a basketball game. The softball games tend more toward being a phy-
sical stimulation, analogous to a brisk walk, than a stressful tiredness.
- ...

47
Perhaps the effect of stimulating the body's circulatory system atod
'burning' more energy also stimulates and enhances the body's electrical
field or bio-plasma. Also,, the emotional excitement caused by the game
way be an underlying factor to be considered.
One final point should be mentioned. Notice the streamer regions
in Figure 17. Compare this to the streamer regions of Figure 18.
Although the subject is not the same in both cases,, the comparison is
typical. The dark, flare region in Figure 18 extends-almost to the end
of the streamer region whereas they are more distinct areas in Figure 17.
The significance of this observation is difficult to assess. Perhaps
valuable information may be, obtained from this region if the means to
interpret this effect was available.

CHAPTER V
CONCLUSION : ,.
The purpose of this research was to determine whether or not Kirlian
photography is a statistically significant method of assessing mental or
physical fatigue. Kirlian photography seems to have this potential.
As may be seen in Chapter IV, a statistically significant change is
observed for both the mental and physical stressors applied. A decrease
in corona diameter was observed after applying the mental stressor. An
increase in corona diameter was observed after applying the physical
stressor. The importance of the level of significance (0.99) should
not be taken lightly.
In applying Kirlian photography to fatigue assessment, the vari-
ability in making the photographs must be considered. As shown or
mentioned previously in this report, variations in the equipment, materi-
als and test subjects themselves may lead to contradictory or misleading
results. For example, in testing for mental fatigue, what is being
measured? Is it boredom, exhaustive thinking or simply the lack of
body activity associated with sitting at a desk for several hours? When
the 'after' photograph is taken, did the subject just complete a brisk
walk? If so, this may Iend to camouflage the mental fatigue effect of
a decreased corona diameter, i.e. physical fatigue or stimtlation would
tend to increase the corona diameter.
Kirlian photography is a fascinating phenomenon. The photographs
produced are static representation of the pulsating life associated with
'living' matter. The research performed for this report and its
statistical significance is additional positive evidence that these
48

49
photographs are reflections of the body's physical and mental condition.
Further research is needed. Isolation of exactly what factors or
combination of factors cause the observed corona changes is probably in
the distant future. Future research efforts might consider mental or
physical fatigue separately. Assessing one or the other over an eight
hour working day ma~y present some interesting findings. For example, is
there a steady decrease in corona size over the working day of a 14esk'
employee? Does this employee's corona increase after a break for lunch
or coffee? Does a construction worker's corona increase in diameter as
he nears the end of the day? And, most importantly, are these changesI
predictable?
4I
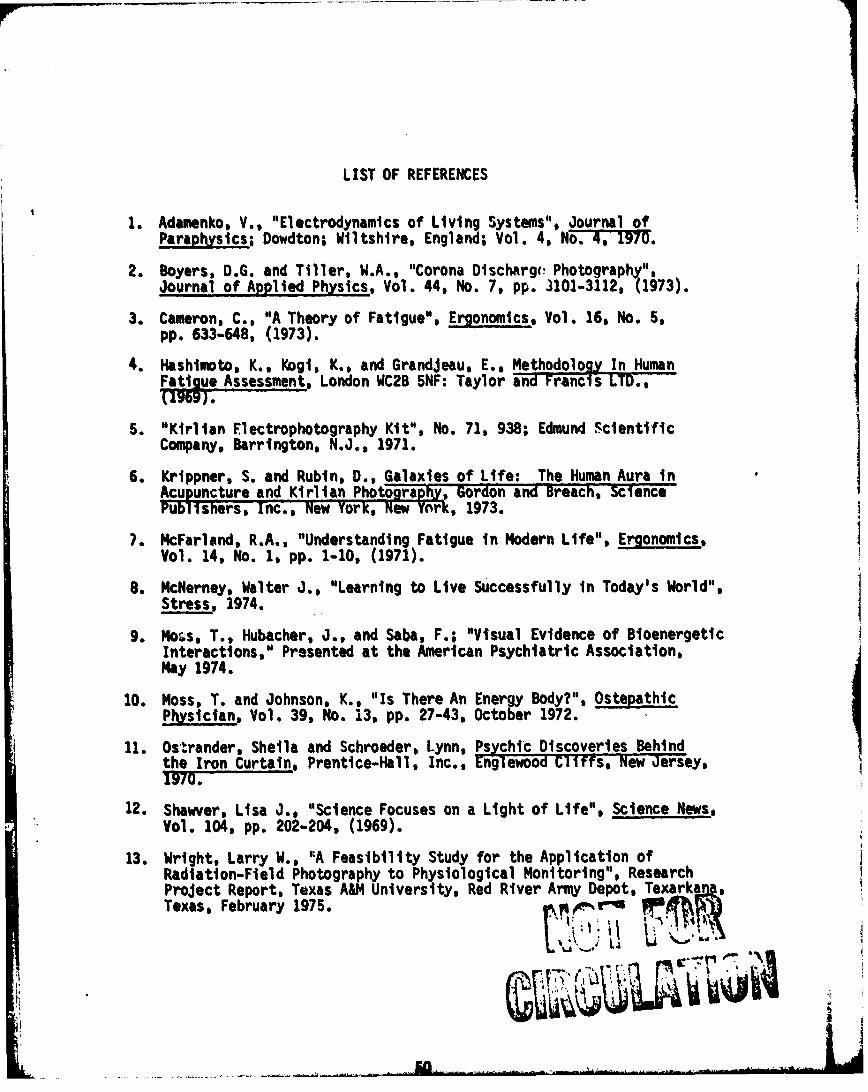
LIST OF REFERENCES
1. Adamenko, V., "Electrodynamics of Living Systems", Journal ofParaphysics; Dowdton; Wiltshire, England; Vol. 4, No.--•.T1•7.
2. Boyers, D.G. and Tiller, W.A., "Corona Discharg(: Photography",Journal of Applied Physics, Vol. 44, No. 7, pp. 3101-3112, (1973).
3. Cameron, C., "A Theory of Fatigue", Ergonomics, Vol. 16, No. 5,pp. 633-648, (1973).
4. Hashimoto, K., Kogi, K., and GrandJeau, E., Methodology In HumanFatigue Assessment, London WC2B 5NF: Taylor and Francis LTD.,(1959).
5. "Kirlian Flectrophotography Kit", No. 71, 938; Edmund ScientificCompany, Barrington, N.J., 1971.
6. Krippner, S. and Rubin, D., Galaxies of Life: The Human Aura inAcupuncture and Kirlian Photography, Gordon and Breach, S ncePub lshers, Inc., New York, New Ynrk, 1973.
7. McFarland, R.A., "Understanding Fatigue in Modern Life", Ergonomics,Vol. 14, No. 1, pp. 1-10, (1971).
8. McNerney, Walter J., "Learning to Live Successfully in Today's World",Stress, 1974.
9. Rots, T., Hubacher, J., and Saba, F.; "Visual Evidence of BioenergeticInteractions," Presented at the American Psychiatric Association,May 1974.
10. Moss, T. and Johnson, K., "Is There An Energy Body?", OstepathicPhysician, Vol. 39, No. 13, pp. 27-43, October 1972.
11. Ostrander, Sheila and Schroeder, Lynn, Psychic Discoveries Behindthe Iron Curtain, Prentice-Hall, Inc., Englewood Cliffs, New Jersey,1970.
12. Shawver, Lisa J., "Science Focuses on a Light of Life", Science News,Vol. 104, pp. 202-204, (1969).
13. Wright, Larry W., "A Feasibility Study for the Application ofRadiation-Field Photography to Physiological Monitoring", ResearchProject Report, Texas A&1 University, Red River Army Depot, TexarkanagTexas, February 1975. Te-a-km .
i:
Sr ..... U..... .......... .