USDA’s Coronavirus Food Assistance Program: Round Two (CFAP-2)
30
USDA’s Coronavirus Food Assistance Program: Round Two (CFAP-2) December 21, 2020 Congressional Research Service https://crsreports.congress.gov R46645
Transcript of USDA’s Coronavirus Food Assistance Program: Round Two (CFAP-2)

USDA’s Coronavirus Food Assistance
Program: Round Two (CFAP-2)
December 21, 2020
Congressional Research Service
https://crsreports.congress.gov
R46645

Congressional Research Service
SUMMARY
USDA’s Coronavirus Food Assistance Program: Round Two (CFAP-2) On September 18, 2020, the U.S. Department of Agriculture (USDA) announced a second round of Coronavirus Food Assistance Program (CFAP-2) payments valued at up to $14 billion. CFAP-2 focuses on losses or additional marketing costs as a result of the Coronavirus Disease 2019
(COVID-19) pandemic that were incurred during the second through fourth quarters of 2020. CFAP-2 follows a first round of payments (CFAP-1) that USDA announced at $16 billion in
April 2020 for losses in the first quarter of 2020 and from which USDA had paid $10.5 billion as of December 5, 2020.
The funding and general authority to undertake the second round of CFAP payments derive from two sources: (1) the broad
authority provided to USDA under the Commodity Credit Corporation (CCC) Charter Act of 1948 (P.L. 80-806; 15 U.S.C. 714 et seq.) and (2) the specific authority that Congress granted to USDA in the Coronavirus Aid, Relief, and Economic Security Act (CARES Act; P.L. 116-136). The CARES Act (signed into law on March 27, 2020) provided $9.5 billion that
was used to develop CFAP-1 and replenished $14 billion of funding availability for the CCC, which together are being used for CFAP-2. According to USDA, CCC funds are being used to partially compensate producers for the continued market
disruptions from the COVID-19 pandemic and to assist with the transition to a more orderly marketing system. USDA expanded the CFAP-1 eligibility criteria in an effort to include more nontraditional commodities in CFAP-2’s payment distribution. Under CFAP-1, USDA required recipients to provide demonstrable economic damage from either a price
decline (mid-January to mid-April) or unexpected additional marketing costs related to COVID-19 food supply chain disruptions. In contrast, under CFAP-2, USDA assumed economic damage for nearly all commodities.
To achieve greater inclusion under CFAP-2, USDA is to use three separate payment categories—price trigger, flat rate, and
sales—based on the nature of available data. Price trigger commodities are commodities that experienced a 5% or greater price decline between January 13-17, 2020, and July 27-31, 2020, and include row crops and livestock. Payments are based
on 2020 planted acres for row crops, 2019 production for broilers and eggs, 2020 milk production for dairy, and 2020 inventories for beef cattle and hogs and pigs. Flat-rate commodities are row crops that failed to meet the 5% price-decline criteria but had available data on eligible acres of the crop planted in 2020. A flat-rate payment would be made on the eligible
acres. Sales commodities are those commodities that lacked sufficient price and acreage data and for which data exist on a producer’s 2019 sales value of the commodity. A payment would then be available based on the sales value.
In general, CFAP-2 payments are subject to a per person and per legal-entity payment limitation of $250,000. The CFAP-2
payment limitation applies to the total amount of CFAP-2 payments made with respect to all eligible commodities of an individual or entity. However, it excludes payments made under CFAP-1 and other USDA Farm Service Agency (FSA) farm
programs. As of December 5, 2020, USDA had approved 759,089 applications and made $11.6 billion in outlays under CFAP-2, with cattle and corn producers receiving the most money. The current CFAP-2 payment distribution pattern is similar to CFAP-1’s distribution—that is, payments are concentrated in the Corn Belt, Texas, and California. Producers could
submit applications for CFAP-2 payments through December 11, 2020.
Policy questions about the implementation of CFAP-2 payments include the following:
Have CFAP-2 payments successfully compensated (at least partially) all producers who have experienced unexpected economic costs due to COVID-19 during the second through fourth quarters of 2020?
Have CFAP-2 funds been distributed in a fair manner to every producer and for every commodity sector that has experienced COVID-19-related costs?
What is the potential for duplication of payments under existing farm programs?
What is the role for congressional monitoring and oversight of the large sums of taxpayer money that are being spent under a nontraditional authority?
Will additional assistance be needed later this year or early in 2021?
Will use of this nontraditional authority for such large sums of taxpayer money serve as a recurring template for future USDA payment interventions?
R46645
December 21, 2020
Randy Schnepf Specialist in Agricultural
Policy

USDA’s Coronavirus Food Assistance Program: Round Two (CFAP-2)
Congressional Research Service
Contents
Introduction ................................................................................................................... 1
Report Overview ....................................................................................................... 2
Details on Program Implementation ................................................................................... 2
Program Authority ..................................................................................................... 2 Funding Sources........................................................................................................ 3 Implementing Agency and Timeline ............................................................................. 4
Eligibility Criteria for Commodities ................................................................................... 4
Three Categories of Eligible Commodities .................................................................... 5 Price Trigger Commodities .................................................................................... 5 Flat-Rate Crops .................................................................................................... 7 Sales Commodities ............................................................................................... 7
Ineligible Commodities .............................................................................................. 7
Payment Formulas Vary by Commodity Category ................................................................ 9
Price Trigger Commodities ......................................................................................... 9 Flat-Rate Crops ....................................................................................................... 12 Sales Commodities .................................................................................................. 12
Eligibility Criteria for Producers...................................................................................... 14
Producer Data Subject to Verification .................................................................... 15
Payment Limits............................................................................................................. 15
Program Outlays: Projected Versus Actual ........................................................................ 16
Issues for Congress ....................................................................................................... 18
Figures
Figure 1. Commodity Price Indexes, January 13-17=100, through July 31, 2020 ....................... 6
Figure 2. CFAP-2 Payments by Commodity Category: Projected and Actual .......................... 17
Figure 3. CFAP-2 Payments by State, as of December 13, 2020 ........................................... 18
Figure 4. Average Output Value and CFAP-2 Payments by Commodity Category.................... 21
Figure 5. Commodity Price Indexes, July 27-31=100, Through December 4, 2020 .................. 22
Figure 6. Commodity Price Indexes, January 13-17=100, Through December 4, 2020 ............. 23
Tables
Table 1. Funding Sources for CFAP-1 and CFAP-2 .............................................................. 4
Table 2. CFAP-2: Eligible Commodities by Category ........................................................... 8
Table 3. CFAP-2 Payment Formula for Price Trigger Commodities ....................................... 11
Table 4. CFAP-2 Payment Rate for Sales Commodities by Sales Range ................................. 13
Table 5. CFAP-2 Calculations for Five Hypothetical Sales Commodity Producers ................... 13
Table A-1. Price Changes from Mid-January to Late-July 2020 for Price Trigger
Commodities ............................................................................................................. 24

USDA’s Coronavirus Food Assistance Program: Round Two (CFAP-2)
Congressional Research Service
Appendixes
Appendix. Supplementary Tables..................................................................................... 24
Contacts
Author Information ....................................................................................................... 25

USDA’s Coronavirus Food Assistance Program: Round Two (CFAP-2)
Congressional Research Service 1
Introduction On April 17, 2020, Secretary of Agriculture Sonny Perdue announced that the U.S. Department of
Agriculture (USDA) would initiate what would be the first round of direct payments under the Coronavirus Food Assistance Program (CFAP-1), valued at $16 billion, to provide immediate
financial relief to farmers, ranchers, and consumers affected by the Coronavirus Disease 2019
(COVID-19) pandemic.1 On September 18, 2020, USDA announced a second round of CFAP direct payments (CFAP-2), valued at up to an additional $14 billion.2
Both CFAP-1 and CFAP-2 have the same eligibility criteria and the same application process for
participating producers. In addition, CFAP-1 and CFAP-2 have similar policy goals—that is,
responding to the unexpected financial costs incurred by the U.S. agricultural sector due to the COVID-19 pandemic.
The two programs also differ in many ways. CFAP-2 expands the list of commodities previously
eligible for payment under CFAP-1. Whereas CFAP-1 focused on providing assistance in
response to damages incurred during the first quarter of 2020 on unsold production from 2019,3 CFAP-2, according to USDA, focuses on losses or additional marketing costs incurred during the
second through fourth quarters of 2020.4 CFAP-2 uses a different pool of funding and a different
methodology for determining eligibility for affected commodities, for calculating each
commodity’s payment rate, and for calculating the total payments to eligible producers. In
addition, the two programs have separate (albeit identical) payment limits that are independent of, and separate from, payments under other USDA farm programs.
This report describes the details of CFAP-2 direct payments to the U.S. agricultural sector in
response to the COVID-19 pandemic. It describes the program’s funding source and authority; how the program is administered, including specific details on the calculation and implementation of payments; and the status of program outlays by commodity and by state.
Three earlier CRS reports provide information on the COVID-19 pandemic’s impact on producers and consumers of U.S. agricultural products and the federal response.
1. CRS Report R46347, COVID-19, U.S. Agriculture, and USDA’s Coronavirus Food Assistance Program (CFAP), describes how the COVID-19 pandemic
affected the U.S. food supply chain, including its deleterious impact on
agricultural producers, which precipitated congressional and USDA responses.
1 The initial Coronavirus Food Assistance Program (CFAP -1) also included the Farmers to Families Food Box
program, valued at an additional $3 billion. U.S. Department of Agriculture (USDA), “USDA Announces Coronavirus
Food Assistance Program,” press release, April 17, 2020. For more information, see CRS Report R46347, COVID-19,
U.S. Agriculture, and USDA’s Coronavirus Food Assistance Program (CFAP) .
2 USDA, “USDA to Provide Additional Direct Assistance to Farmers and Ranchers Impacted by the Coronavirus,”
press release, September 18, 2020. 3 An exception is CFAP-1 payments for cattle, hogs and pigs, dairy, and lambs and sheep that used Commodity Credit
Corporation (CCC) funding. Such payments were based on spring inventories (April 16, 2020, to May 14, 2020) and
largely reflected second quarter damages.
4 As stated in USDA, Coronavirus Food Assistance Program 2: Cost-Benefit Analysis, September 15, 2020, p. 1.
However, for row crops, the CFAP-2 damage period is more ambiguous than under CFAP-1. This is because CFAP-2
payments for row crops are based on their 2020 planted acres, whereas most row crops are not harvested until the third
or fourth quarter of 2020. Thus, USDA appears to be declaring that price declines on unharvested crops represent
“damages” or “ losses.” The apparent flaw in this logic has been magnified by large increases to above-pre-COVID-19
levels for most row crop prices since July (as discussed in the “Issues for Congress” section of this report).
USDA’s Coronavirus Food Assistance Program: Round Two (CFAP-2)
Congressional Research Service 2
2. CRS Report R46395, USDA’s Coronavirus Food Assistance Program: Round
One (CFAP-1), describes CFAP-1 payments and the methodology used to
calculate those payments.
3. CRS Report R46432, Food Banks and Other Emergency Feeding Organizations: Federal Aid and the Response to COVID-19, provides general information on
CFAP food purchase and distribution initiatives—the Farmers to Families Food
Box program and other nutrition-related relief programs that responded to the
COVID-19 pandemic.
Congress is considering providing additional support for the agricultural sector beyond CFAP-1
and CFAP-2.5 These potential additional efforts are not discussed in this report. However, a brief
discussion related to the likelihood of, or need for, a third round of CFAP payments is provided in the “Issues for Congress” section.
Report Overview
This report begins with a brief overview of CFAP-2, including its authority, funding sources, implementing agency, and the program’s timeline. The next section describes the details of
CFAP-2, including eligibility requirements for both producers and commodities and the payment
calculations for each type of eligible commodity category. The report then reviews current data on
CFAP-2 payments. It ends with a brief discussion on issues of potential interest to Congress. The
report’s Appendix includes a supplementary table, which provides details on USDA’s derivation of the payment rates for commodities affected by price declines.
Details on Program Implementation On September 22, 2020, USDA released a final rule to implement the second round of CFAP
direct payments (referred to as CFAP-2), including the program authority and funding sources, as
well as the application procedures and timeline.6 These aspects of CFAP-2 are described in this
section. The eligibility requirements for commodities and producers and the payment calculations for each type of commodity category are described in the following three sections.
Program Authority
The general authority to undertake both the CFAP-1 and CFAP-2 derives from two sources. First,
USDA interprets the Commodity Credit Corporation (CCC) Charter Act of 1948 (P.L. 80-806; 15
U.S.C. 714 et seq.) as providing broad authority to use CCC funds to support the orderly
production and marketing of agricultural commodities via normal marketing channels that have been disrupted by the COVID-19 pandemic.7
Second, Congress granted specific authority to USDA under the Coronavirus Aid, Relief, and
Economic Security Act (CARES Act; P.L. 116-136) to develop and administer a support program
5 See Ben Nuelle, “Bipartisan COVID relief proposal allocates $13B in ag aid,” AgriPulse, December 9, 2020.
6 USDA, Office of the Secretary, “Coronavirus Food Assistance Program ,” Final Rule, 85 Federal Register 59380,
September 22, 2020.
7 For a discussion of the CCC and USDA’s authority under the CCC Charter Act, see CRS Report R44606, The
Commodity Credit Corporation: In Brief.

USDA’s Coronavirus Food Assistance Program: Round Two (CFAP-2)
Congressional Research Service 3
in response to the COVID-19 pandemic.8 In particular, USDA was to “prevent, prepare for, and
respond to coronavirus by providing support to agricultural producers impacted by coronavirus,
including producers of specialty crops, producers that supply local food systems, including
farmers’ markets, restaurants, and schools, and livestock producers, including dairy producers.”9
This approach provided funding to the Secretary of Agriculture with general authority to respond
to a crisis (similarly to Congress’s direction to USDA to develop a payment program from a general appropriation in response to emergency appropriations for wildfires and hurricanes in 2018 and 2019).10 Based on these two broad authorities, USDA developed CFAP-1 and CFAP-2.
Funding Sources
On September 18, 2020, USDA announced that the CCC would provide up to $14 billion to make
CFAP-2 direct payments to eligible producers to provide them with financial assistance to help
absorb the continuing higher marketing costs associated with the COVID-19 pandemic. Under
this attribution, USDA deems that the use of CCC funds is appropriate for all eligible commodities. As CCC funds are prohibited from being used to provide assistance to tobacco,11
CFAP-2 payments to tobacco producers are to be funded from the remaining portion of the $9.5
billion in CARES Act funding that was originally provided to USDA as part of CFAP-1 direct payments.12 Total CFAP-2 tobacco payments are not to exceed $100 million.
The CCC operates with a $30 billion line of credit with the U.S. Treasury, a portion of which was
used in FY2020 to fund a variety of activities authorized under the 2018 farm bill, prior farm
bills, and other enacted legislation.13 USDA also tapped CCC funding to provide trade mitigation
assistance to agricultural producers in FY2020 through the Market Facilitation Program.14 Obligating CCC funds for these activities would normally have left insufficient funding available
in CCC’s line of credit for CFAP-2 obligations. However, when the CARES Act was signed into
law on March 27, 2020, it authorized an early replenishment in FY2020 of up to $14 billion of
borrowing authority for the CCC, with the understanding that the replenishment monies would
not be available to Secretary Perdue until later in the year.15 The $14 billion from the CARES Act was not new spending; rather, it reimbursed the CCC for past spending. After the funds were
8 The Coronavirus Aid, Relief, and Economic Security Act (CARES Act; P.L. 116-136), Title I of Division B—
Emergency Appropriations For Coronavirus Health Response And Agency Operations.
9 USDA, “USDA Announces Coronavirus Food Assistance Program,” press release, April 17, 2020. Published in
USDA, Office of the Secretary, “Coronavirus Food Assistance Program,” 85 Federal Register 30825, May 21, 2020.
10 For example, see CRS In Focus IF11245, FY2019 Supplemental Appropriations for Agriculture. 11 USDA support for tobacco programs was terminated at the end of crop year 2004, following USDA’s buyout of the
U.S. tobacco quota system under the Fair and Equitable Tobacco Reform Act of 2004 (P.L. 108-357). In addition,
USDA is prohibited by language in annual appropriations law from spending funds to help promote tobacco exports
and conduct research relating to the production, processing, or marketing of tobacco and tobacco products. See CRS
Report 97-417 ENR, Tobacco-Related Programs and Activities of the U.S. Department of Agriculture: Operation and
Cost, available to congressional clients upon request; and Government Accountability Office (GAO), USDA’s Foreign
Agricultural Service Lacks Specific Guidance for Congressional Restrictions on Promoting Tobacco , GAO-03-618,
May 2003. 12 As of November 15, 2020, USDA had made CFAP -1 payments of $10.42 billion, thus leaving unspent a substantial
portion of the $16 billion in funding provided by the CARES Act.
13 By law, the CCC receives an annual appropriation equal to the amount of the previous year ’s net realized loss. This
replenishes its borrowing authority from Treasury and allows it to cover authorized expenditures that will not be
recovered. See CRS Insight IN10941, Commodity Credit Corporation: Q&A.
14 See CRS Report R45865, Farm Policy: USDA’s 2019 Trade Aid Package. 15 CARES Act (P.L. 116-136), T itle I, §11002 of Division B—Emergency Appropriations For Coronavirus Health
Response And Agency Operations.

USDA’s Coronavirus Food Assistance Program: Round Two (CFAP-2)
Congressional Research Service 4
transferred, which required waiting for a June 2020 financial statement, the CCC had renewed access to more funding for future obligations, including CFAP-2.
Table 1. Funding Sources for CFAP-1 and CFAP-2
$ billion
CFAP-1 CFAP-2 Total
CCC Charter Acta 6.5 14.0 20.5
CARES Actb 9.4 0.1 9.5
Total 15.9 14.1 30.0
Sources: CRS Report R46395, USDA’s Coronavirus Food Assistance Program: Round One (CFAP-1); and U.S.
Department of Agriculture (USDA), “USDA to Provide Additional Direct Assistance to Farmers and Ranchers
Impacted by the Coronavirus,” press release, September 18, 2020.
Notes: All funds shown in this table were obligated in FY2020.
a. The Commodity Credit Corporation (CCC) operates with a $30 billion line of credit with the U.S.
Treasury, which is used to implement USDA farm programs with mandatory funding.
b. The Coronavirus Aid, Relief, and Economic Security Act (CARES Act; P.L. 116-136) authorized $9.5 billion
in support of the first round of direct payments under the Coronavirus Food Assistance Program (CFAP-
1). Unspent funds from CFAP-1’s $9.5 billion are to be carried forward to the second round of CFAP
direct payments (CFAP-2) and used for tobacco payments. The CARES Act also authorized an early
replenishment in FY2020 of up to $14 billion of borrowing authority for the CCC, with the understanding
that the replenishment monies would not be available to USDA until after June 2020.
Implementing Agency and Timeline
As with CFAP-1, USDA’s Farm Service Agency (FSA) is the principal agency charged with implementing CFAP-2’s direct payment program. In its September 22 final rule, USDA stated
that the FSA would accept applications—beginning on September 21, 2020, and ending
December 11, 2020—from “producers of agricultural commodities who face continuing market disruptions, low farm-level prices, and significant marketing costs.”16
Eligibility Criteria for Commodities CFAP-2 expands the list of commodities eligible for payment under CFAP-1. USDA determined eligibility criteria for CFAP-2 in a similar manner to that of CFAP-1, but with some differences.
During the first round of payments (CFAP-1), eligible commodities had to have incurred at least a 5% or greater price decline between January 13-17, 2020, and April 6-9, 2020, as an indicator of
COVID-19-related sales losses,17 or unexpectedly higher marketing costs, including possible
spoilage on lost sales due to COVID-19-related supply chain disruptions.18 For some
commodities, USDA determined the extent of marketing costs and spoilage losses based on its
review of applicant submissions data. USDA received comments on a range of commodities—
16 USDA, Office of the Secretary, “ Coronavirus Food Assistance Program,” Final Rule, 85 Federal Register 59380,
September 22, 2020. For up-to-date program information on CFAP-2, including application forms, assistance with
applying, and payment processing information, visit USDA’s Farm Service Agency (FSA) web portal for CFAP at
https://www.farmers.gov/cfap.
17 The mid-January period is reflective of pre-COVID-19 market conditions. The price decline from mid-January to
early April is a measure of the COVID-19-related first quarter price impact.
18 For details, see CRS Report R46395, USDA’s Coronavirus Food Assistance Program: Round One (CFAP -1).

USDA’s Coronavirus Food Assistance Program: Round Two (CFAP-2)
Congressional Research Service 5
many without sufficient data to determine if these crops suffered eligible losses due to the effects of COVID-19.
After the first round of payments were made, several commodity groups criticized USDA. According to these groups, the criteria had been applied too strictly, such that several
commodities (primarily specialty crops) that had suffered COVID-19-related economic injury had
been excluded from eligibility for CFAP-1 payments.19 Many specialty crops are grown under
contract or are targeted to local markets or end users, such that data are not readily available
regarding prices and marketing costs.20 As a result, many specialty crops were deemed ineligible for CFAP-1 payments. Also, several commodity groups that had been deemed eligible for
payments by USDA contended that they did not receive sufficient or meaningful payments
because the formula used by USDA to calculate sales losses or COVID-19-related marketing costs did not fully reflect the additional costs incurred due to the COVID-19 pandemic.21
USDA responded to these criticisms by applying a more expansive interpretation of payment
eligibility under CFAP-2 than had been applied under CFAP-1, and implementing a simpler methodology for calculating the CFAP-2 payments for specialty crops.
Three Categories of Eligible Commodities
Under CFAP-2, eligible commodities are broadly identified as those commodities that faced
continuing market disruptions, low farm-level prices, and significant market costs due to the COVID-19 pandemic. USDA stated that significant marketing costs could be associated with
declines in demand, surplus production, or disruptions to shipping patterns and the orderly
marketing of commodities.22 Under this guidance, and to facilitate the development of inclusive
payment formulas, USDA established three commodity payment categories—price-trigger
commodities, flat-rate commodities, and sales commodities—each with its own eligibility criteria and payment formula.23
Price Trigger Commodities
For commodities for which price data were available, USDA assessed whether at least a 5% or
greater price decline had occurred between January 13-17, 2020, and July 27-31, 2020.24
Commodities that met the 5% price reduction criteria of CFAP-2 tended to be major program crops and livestock products for which national price data were readily available.25 These
qualifying commodities were identified as “price trigger commodities” and include barley, corn,
19 In particular, small farmers, processed food commodities (e.g., raisins), and aquaculture were noticeably underserved
by CFAP-1. See the discussion in the “Issues for Congress” section in CRS Report R46359, COVID-19 and Private
Health Insurance Coverage: Frequently Asked Questions; Brad Hooker, “Smaller Farmers Are ‘Left Out’ of Aid
Programs,” AgriPulse, June 6, 2020 (hereinafter Hooker, “Smaller Farmers Are ‘Left Out,’” 2020) ; and Letter from
House Agriculture Chairman Collin Peterson to USDA Secretary Sonny Perdue, June 9, 2020. 20 Hooker, “Smaller Farmers Are ‘Left Out,’” 2020.
21 Hooker, “Smaller Farmers Are ‘Left Out,’” 2020.
22 USDA, “Coronavirus Food Assistance Program ,” Final Rule, 85 Federal Register 59380, September 22, 2020. 23 See Table 2 for a list of eligible commodities under each payment category.
24 The mid-January period is reflective of pre-COVID-19 market conditions. The price decline from mid-January to late
July is a measure of the COVID-19-related price impact through the second quarter of 2020.
25 The CFAP-2 payment calculation for price-trigger commodities is described in Table 3.

USDA’s Coronavirus Food Assistance Program: Round Two (CFAP-2)
Congressional Research Service 6
sorghum, soybeans, sunflowers, upland cotton, wheat (all classes), broilers, eggs, beef cattle, dairy, hogs and pigs, and lambs and sheep.
CFAP-2 payments for these price-trigger commodities would then be based on 2020 planted acres for row crops; 2019 production for broilers and eggs; 2020 inventories for beef cattle and hogs
and pigs; and milk production during selected periods in 2020 (described below) for dairy. This is
in contrast to CFAP-1 price-loss payments, which were based on first-quarter sales or unpriced
inventories of 2019 production. Also, the mid-January to late-July period used to evaluate CFAP-
2 price declines represents a longer price-evaluation period than was used under CFAP-1 and reflects an attempt to quantify the second quarter effects of prolonged lower prices (Figure 1).26
However, as with CFAP-1, this is a relatively short time frame for assessing loss due to price
declines. Losses defined under this time frame may be relevant for perishable crops or livestock
inventories that require substantial maintenance costs when markets are unexpectedly blocked.
This time frame is possibly more questionable for row crops that had yet to be harvested—and
thus have not yet incurred any loss—and that can be stored for years without losing market value.27
Figure 1. Commodity Price Indexes, January 13-17=100, through July 31, 2020
Sources: Compiled by CRS using futures contract closing prices from the Chicago Mercantile Exchange
(CME)—the November 2020 contract was used for feeder cattle, rough rice, and soybeans, and the December
26 Figure 1 uses indexes based on futures contract prices as an indicator of the commodity price declines that occurred
during the CFAP-2 evaluation period from mid-January to late July. USDA based the actual CFAP -2 price decline
calculations on national farm prices, not on futures price indexes. These price indexes are included here as a visual aid
for the reader to understand the general commodity price movements that have occurred during 2020.
27 T raditional farm programs—such as Price Loss Coverage (PLC) and Agricultural Risk Coverage (ARC)—use an average price calculated for the entire marketing year and compare it against a reference price (PLC) or a historical
moving average (ARC); in contrast, the Market Facilitation Program (MFP) used a statistical model to evaluate the
trade damage resulting from retaliatory tariffs. See CRS Report R45730, Farm Commodity Provisions in the 2018
Farm Bill (P.L. 115-334); and CRS Report R45310, Farm Policy: USDA’s 2018 Trade Aid Package.

USDA’s Coronavirus Food Assistance Program: Round Two (CFAP-2)
Congressional Research Service 7
contract was used for lean hogs, Class III Milk, corn, and wheat (Soft Red Wheat, Chicago). For Upland Cotton
(#2), the December contract from the New York Mercantile Exchange (NYMEX) was used.
Notes: The price index differences, displayed as percentages in the chart, compare the difference between the
January 13-17, 2020, average price index and the July 27-31, 2020, average price index. The price indexes are not
adjusted for seasonality.
For all other commodities that did not meet the 5%-price decline criteria, or did not have data
available to calculate a price change, USDA relied on producer or industry submissions to
determine eligibility and calculate the relevant payment rate—such commodities are eligible for CFAP-2 payments under two alternate payment categories: flat-rate crops and sales commodities.
Flat-Rate Crops
For field or row crops with available data, a flat-rate payment was available based on eligible
acres of the crop planted in 2020.28 Eligible flat-rate crops include alfalfa, Extra Long Staple
(ELS) cotton, oats, peanuts, and rice, as well as some crops with relatively small acreage—such as amaranth grain, buckwheat, canola, crambe (colwort), einkorn, emmer, flax, guar, hemp,
indigo, industrial rice, kenaf, Khorasan, millet, mustard, oats, peanuts, quinoa, rice, sweet rice, wild rye, safflower, sesame, speltz, sugar beets, sugarcane, teff, triticale, and rapeseed.
Sales Commodities
For those commodities that lacked both price and acreage data, a final payment category was available based on a producer’s 2019 sales value of the commodities. Sales commodities include
fruits and vegetables; aquaculture grown in a controlled environment; nursery crops and
floriculture; other livestock (excluding breeding stock) not included under the price trigger
category that were grown for food, fiber, fur (but not pelts), or feathers; tobacco; goat milk; mink (including pelts); mohair; wool; horticulture commodities; tree nuts; honey; and maple sap.29
Special Consideration for New or Beginning Farmers and Ranchers
Payments cannot be calculated using the methods described above for producers of broilers, eggs,
and sales commodities by producers who began farming in 2020 and had no 2019 production or
sales. Payments for such producers will be based on the producer’s actual 2020 production or sales as of the date the producer submits an application for payment.
Ineligible Commodities
Only commercially produced commodities are eligible for CFAP payments. Hay, except alfalfa, and any crops that were intended for grazing are excluded from eligibility for CFAP. Similarly,
birdsfoot and trefoil, clover, cover crop, fallow, forage soybeans, forage sorghum, gardens
(commercial and home), grass, kochia (prostrata), lespedeza, milkweed, mixed forage, pelts
(excluding mink), perennial peanuts, pollinators, sunn hemp, vetch, and seed of ineligible crops
are ineligible for CFAP-2 payments. All equine, breeding stock, companion or comfort animals, pets, and animals raised for hunting or game purposes are excluded from eligibility.
28 Eligible acres include the producer’s share of acres (as determined or reported via form FSA-578, Report of Acreage)
of the crop planted in 2020, excluding prevented planted and experimental acres. 29 For a complete list of eligible sales commodities, see Table 2.

USDA’s Coronavirus Food Assistance Program: Round Two (CFAP-2)
Congressional Research Service 8
Table 2. CFAP-2: Eligible Commodities by Category
Category Commoditiesa
Price-Trigger Commodities
Commodities where at least a 5% or greater price decline occurred between January 13-17, 2020, and
July 27-31, 2020. Qualifying price-trigger commodities include the following:
Crops: barley, corn, sorghum, soybeans, sunflowers, upland cotton, and wheat (all classes)
Broilers: any chicken that has been commercially produced for meat purposes that has left the farm for
slaughter and was not used for laying or breeding purposes
Eggs: dried, frozen, liquid, and shell eggs
Dairy: cow’s milk
Livestock: beef cattle, hogs and pigs, and lambs and sheep
Flat-Rate Crops
For field or row crops with available data, a flat-rate payment was available based on eligible acres of the
crop planted in 2020. Qualifying flat-rate commodities include the following:
Crops with relatively large acreage: Alfalfa, canola, oats, peanuts, rice, sugar beets, and sugarcane
Crops with relatively small acreage: amaranth grain, buckwheat, crambe (colwort), einkorn,
emmer, Extra Long Staple (ELS) cotton, flax, guar, hemp, indigo, industrial rice, kenaf, Khorasan, millet,
mustard, quinoa, sweet rice, wild rye, safflower, sesame, speltz, teff, triticale, and rapeseed
Sales Commodities
For those commodities that lacked both price and acreage data, a final payment category was available
based on a producer’s 2019 sales value of the commodity. Qualifying sales commodities include the
following:
Aquaculture: any species of aquatic organisms grown as food for human consumption; fish raised as
feed for fish that are consumed by humans; and ornamental fish propagated and reared in an aquatic
medium. Eligible aquaculture species must be raised by a commercial operator and in water in a
controlled environment.b
Nursery crops: decorative or nondecorative plants grown in a container or controlled environment
for commercial sale, including cactus and Christmas trees
Floriculture: cut flowers and cut greenery from annual and perennial flowering plants grown in a
container or controlled environment for commercial sale
Horticulture: anise, basil, cassava, chervil (fresh parsley), chia, chicory (radicchio), cilantro, cinnamon,
curry leaves, galanga, ginger, ginseng, guayule, herbs, hops, lotus root, marjoram, meadowfoam, mint,
moringa, niger seed, oregano, parsley, pennycress, peppermint, pohole, psyllium, rosemary, sage, savory,
shrubs (forbs), sorrel, spearmint, tangos, tea, thyme, turmeric, vanilla, wasabi, water cress, and yu cha
Tree nuts: almonds, avocados, carob, cashew, chestnuts, coffee, hazel nuts, jojoba, macadamia nuts,
noni, olives, pecans, persimmons, pine nuts, pistachios, quinces, and walnuts
Fruit: abiu, acerola (Barbados cherry), achachairu, antidesma, apples, apricots, aronia (chokeberry),
atemoya (custard apple), bananas, blueberries, breadfruit, cacao, caimito, calabaza melon, canary melon,
canary seed, caneberries, canistel, cantaloupes, carambola (star fruit), casaba melon, cherimoya (sugar
apple), cherries, Chinese bitter melon, citron, citron melon, coconuts, cranberries, crenshaw melon,
dates, donaqua (winter melon), durian, elderberries, figs, genip, gooseberries, grapefruit, grapes, ground
cherry, guamabana (soursop), guava, guavaberry, honeyberries, honeydew, huckleberries, Israel melons,
jack fruit, jujube, juneberries, kiwiberry, kiwifruit, Korean golden melon, kumquats, langsat, lemons,
limequats, limes, longan, loquats, lychee, mangos, mangosteen, mayhaw berries, mesple, mulberries,
nectarines, oranges, papaya, passion fruits, pawpaw, peaches, pears, pineapple, pitaya (dragon fruit),
plantain, plumcots, plums, pomegranates, prunes, pummelo, raisins, rambutan, sapodilla, sapote,
schizandra berries, sprite melon, star gooseberry, strawberries, tangelos, tangerines, tangors, wampee,
watermelon, wax jamboo fruit, and wolfberry (goji)

USDA’s Coronavirus Food Assistance Program: Round Two (CFAP-2)
Congressional Research Service 9
Category Commoditiesa
Vegetables: alfalfa sprouts, aloe vera, artichokes, arugula (greens), asparagus, bamboo shoots, batatas,
bean sprouts, beans (including dry edible), beets, bok choy, broccoflower, broccoli, broccolini, broccolo-
cavalo, Brussel sprouts, cabbage, calaloo, carrots, cauliflower, celeriac, celery, chickpea (see beans,
garbanzo), chives, collard greens, coriander, corn, sweet, cucumbers, daikon, dandelion greens, dasheen
(taro root, malanga), dill, eggplant, endive, escarole, frisee, gailon (gai lein, Chinese broccoli), garlic,
gourds, greens, horseradish, Jerusalem artichokes (sunchoke), kale, kohlrabi, leeks, lentils, lettuce,
melongene, mesculin mix, microgreens, mushrooms, okra, onions, parsn ip, peas (including dry edible),
pejibaye (heart of palm), peppers, potatoes, sweet potatoes, pumpkins, radicchio, radishes, rhubarb,
rutabaga, salsify (oyster plant), scallions, seed-vegetable, shallots, spinach, squash, swiss chard, tannier,
taro, tomatillos, tomatoes, truffles, turnip top (greens), turnips, yam, and yautia (malanga)
Other livestock: animals (excluding breeding stock) not included under the price trigger category that
were commercially raised for food, fur, fiber, or feathers, including alpacas, bison, buffalo, beefalo, deer,
ducks, elk, emus, geese, goats, guinea pigs, llamas, mink, ostrich, pheasants, quail, rabbits, reindeer, and
turkey
Other: tobacco, goat milk, mink (including pelts), mohair, wool, and honey and maple sap
Ineligible Commodities
Hay, except alfalfa, and any crops that were intended for grazing
Birdsfoot and trefoil, clover, cover crop, fallow, forage soybeans, forage sorghum, gardens (commercial
and home), grass, kochia (prostrata), lespedeza, milkweed, mixed forage, pelts (excluding mink),
perennial peanuts, pollinators, sunn hemp, vetch, and seed of ineligible crops
All equine, breeding stock, companion or comfort animals, pets, and animals raised for hunting or game
purposes
Sources: USDA, Office of the Secretary, “Coronavirus Food Assistance Program,” Final Rule, 85 Federal Register
59380, September 22, 2020. See also USDA, Farm Service Agency (FSA), “Coronavirus Food Assistance Program 2,”
fact sheet, October 1, 2020.
Notes:
a. Only commercially produced commodities are eligible. Furthermore, only commodities produced in the
United States are eligible for payments. Commodities other than livestock that are imported into the
United States may not be used to determine any payment made under CFAP. For livestock, “produced in
the United States” means physically located in the United States (7 C.F.R. Part 9, §9.1(a)).
b. This includes molluscan shellfish and seaweed, which were previously covered under the U.S. Department
of Commerce program.
Payment Formulas Vary by Commodity Category According to USDA, CCC funds are to be used to partially compensate producers for the
continued market disruptions from the COVID-19 pandemic and to assist with the transition to a
more orderly marketing system.30 To accomplish this goal, USDA developed separate payment formulas for each of the three payment categories—price trigger, flat-rate, and sales.
Price Trigger Commodities
A common feature for all of the price trigger commodities is that each commodity experienced at
least a 5% or greater price decline from mid-January to late July (Table A-1). USDA then calculated each commodity’s payment rate as 80% of the calculated price decline.31 However, the
subsequent CFAP-2 payment formula for eligible price trigger commodities is tailored to the
30 With the exception of tobacco, for which USDA will use CARES Act funds, not to exceed $100 million. 31 The 80% coverage factor, not mentioned in USDA’s September 22 f inal rule, is discussed in the CFAP-2 Cost-
Benefit Analysis. USDA has provided no explanation for the 80% coverage factor.

USDA’s Coronavirus Food Assistance Program: Round Two (CFAP-2)
Congressional Research Service 10
nature of the commodity, with separate formulas for crops, broilers and eggs, dairy (cow’s milk), and livestock (beef cattle, hogs and pigs, and lambs and sheep).
Price Trigger Crops
For price trigger crops (see Table 2), the payment rate is to be applied to 2020 planted acres of
the crop, excluding prevented planting and experimental acres, to determine a potential payment.
USDA included a payment floor of $15 per acre as part of the payment formula for price trigger
crop producers. Thus, the CFAP-2 payment for a price trigger crop would be the greater of either
the eligible acres multiplied by a payment rate of $15 per acre or the eligible acres (Table 3,
column B) multiplied by both a nationwide crop marketing percentage (Table 3, column C)32 and
a crop-specific payment rate (Table 3, column D), and then multiplied by the producer’s approximated crop yield for 2020 (Table 3, column E).33
In contrast, under CFAP-1, both the price-loss and market-cost payment rates for row crops were
applied to the unpriced inventory from 2019 production as of January 15, 2020.34 Again, this contrast is significant in that 2020 crops receiving CFAP-2 payments were still unharvested
during the price-loss period of January 13-17 and July 27-31, thus, they had not yet incurred any
losses. Furthermore, subsequent changes in market conditions since mid-August have contributed
to farm prices moving substantially higher through the end of 2020, thus offsetting much, if not
all, of the price declines of the first half of the year (discussed in the “Will the Agricultural Sector Need Additional Assistance?” section).
Other Price Trigger Commodities
For broilers and eggs, payments are to be based on 75% of the producers’ 2019 production multiplied by a per-unit payment rate (Table 3).35
CFAP-2 dairy payments are to be based on the payment rate of $1.20 per hundredweight (cwt)
multiplied by the sum of the farm operation’s milk production during two periods: (1) April 1,
2020, to August 31, 2020, and (2) September 1, 2020, to December 31, 2020.36 Since the second
period extends beyond the CFAP-2 application deadline of December 11, 2020, USDA’s FSA will estimate milk production for the second period by multiplying the producer’s daily average
milk production during the first period by the number of days the dairy operation expects to commercially market milk during the second period.
Eligible beef cattle, hogs and pigs, and lambs and sheep CFAP-2 payments are to be based on the
maximum owned inventory of eligible livestock—but subject to a maximum number of head and
excluding breeding stock—on a date selected by the producer between April 16, 2020, and
August 31, 2020, times a per-head payment rate (Table 3). The limitation on CFAP-2 payments for livestock by capping the number of eligible animals did not exist under CFAP-1.
32 The national average share of the crop marketed from the start of the 2020/21 marketing year through the end of
calendar year 2020. The marketing year begins June 1 for barley and wheat; August 1 for upland cotton and
sunflowers; and September 1 for corn, sorghum, and soybeans. 33 See table note “b” in Table 3 for details on deriving the applicable crop yield.
34 CRS Report R46395, USDA’s Coronavirus Food Assistance Program: Round One (CFAP -1).
35 Broilers and eggs in the shell were not eligible for CFAP-1 payments. Liquid and frozen eggs were eligible for
CFAP-1 payments based on their first quarter 2020 production. 36 CFAP-1 price-loss payments for dairy producers were based on first quarter 2020 milk production.
USDA’s Coronavirus Food Assistance Program: Round Two (CFAP-2)
Congressional Research Service 11
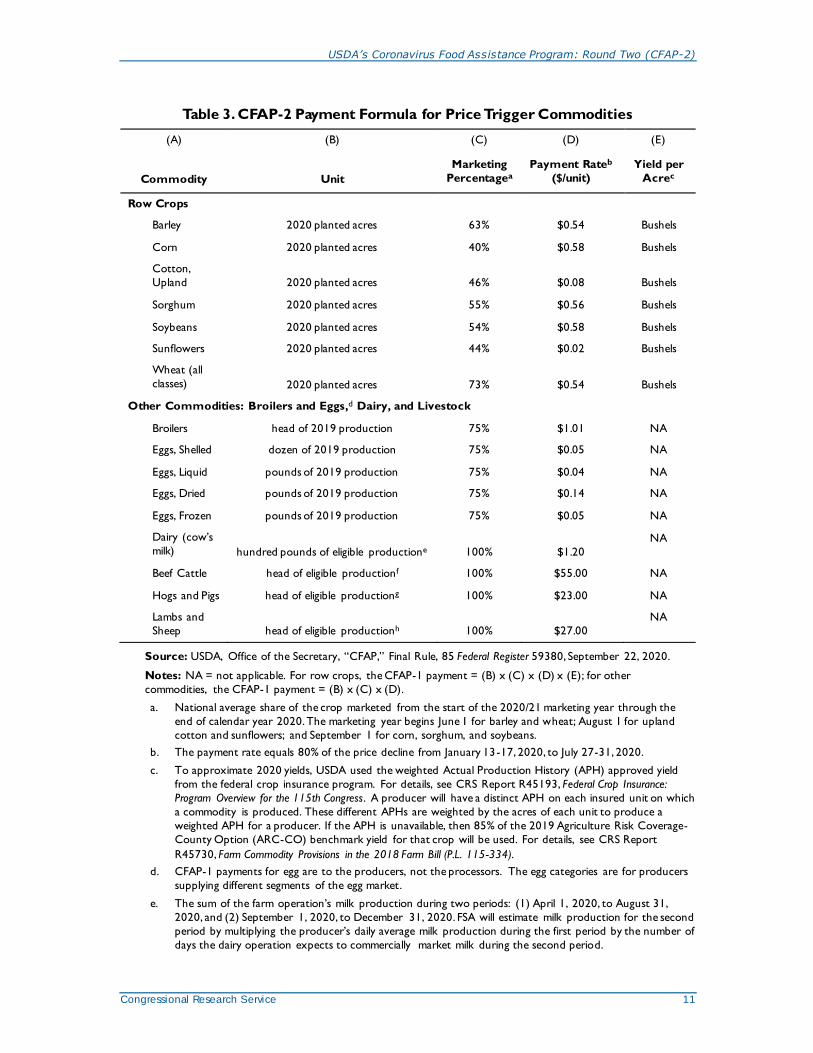
Table 3. CFAP-2 Payment Formula for Price Trigger Commodities
(A) (B) (C) (D) (E)
Commodity Unit
Marketing
Percentagea
Payment Rateb
($/unit)
Yield per
Acrec
Row Crops
Barley 2020 planted acres 63% $0.54 Bushels
Corn 2020 planted acres 40% $0.58 Bushels
Cotton,
Upland 2020 planted acres 46% $0.08 Bushels
Sorghum 2020 planted acres 55% $0.56 Bushels
Soybeans 2020 planted acres 54% $0.58 Bushels
Sunflowers 2020 planted acres 44% $0.02 Bushels
Wheat (all
classes) 2020 planted acres 73% $0.54 Bushels
Other Commodities: Broilers and Eggs,d Dairy, and Livestock
Broilers head of 2019 production 75% $1.01 NA
Eggs, Shelled dozen of 2019 production 75% $0.05 NA
Eggs, Liquid pounds of 2019 production 75% $0.04 NA
Eggs, Dried pounds of 2019 production 75% $0.14 NA
Eggs, Frozen pounds of 2019 production 75% $0.05 NA
Dairy (cow’s
milk) hundred pounds of eligible productione 100% $1.20
NA
Beef Cattle head of eligible productionf 100% $55.00 NA
Hogs and Pigs head of eligible productiong 100% $23.00 NA
Lambs and
Sheep head of eligible productionh 100% $27.00
NA
Source: USDA, Office of the Secretary, “CFAP,” Final Rule, 85 Federal Register 59380, September 22, 2020.
Notes: NA = not applicable. For row crops, the CFAP-1 payment = (B) x (C) x (D) x (E); for other
commodities, the CFAP-1 payment = (B) x (C) x (D).
a. National average share of the crop marketed from the start of the 2020/21 marketing year through the
end of calendar year 2020. The marketing year begins June 1 for barley and wheat; August 1 for upland
cotton and sunflowers; and September 1 for corn, sorghum, and soybeans.
b. The payment rate equals 80% of the price decline from January 13-17, 2020, to July 27-31, 2020.
c. To approximate 2020 yields, USDA used the weighted Actual Production History (APH) approved yield
from the federal crop insurance program. For details, see CRS Report R45193, Federal Crop Insurance:
Program Overview for the 115th Congress. A producer will have a distinct APH on each insured unit on which
a commodity is produced. These different APHs are weighted by the acres of each unit to produce a
weighted APH for a producer. If the APH is unavailable, then 85% of the 2019 Agriculture Risk Coverage-
County Option (ARC-CO) benchmark yield for that crop will be used. For details, see CRS Report
R45730, Farm Commodity Provisions in the 2018 Farm Bill (P.L. 115-334).
d. CFAP-1 payments for egg are to the producers, not the processors. The egg categories are for producers
supplying different segments of the egg market.
e. The sum of the farm operation’s milk production during two periods: (1) April 1, 2020, to August 31,
2020, and (2) September 1, 2020, to December 31, 2020. FSA will estimate milk production for the second
period by multiplying the producer’s daily average milk production during the first period by the number of
days the dairy operation expects to commercially market milk during the second period.

USDA’s Coronavirus Food Assistance Program: Round Two (CFAP-2)
Congressional Research Service 12
f. The lower of (1) maximum owned inventory of eligible beef cattle, excluding breeding stock, on a date
selected by the producer between April 16, 2020, and August 31, 2020; or (2) 4,546 head.
g. The lower of (1) maximum owned inventory of eligible hogs and pigs, excluding breeding stock, on a date
selected by the producer between April 16, 2020, and August 31, 2020; or (2) 10,870 head.
h. The highest owned inventory of eligible lambs and sheep, excluding breeding stock, on a date selected by
the producer between April 16, 2020, and August 31, 2020.
In contrast to CFAP-2, CFAP-1 used both inventories and sales to calculate payments to livestock
producers. Price-loss payments were based on the quantity sold during the first quarter of 2020 (as approximated by using data for the January 15, 2020, to April 15, 2020, period), and market-
cost payments were based on their maximum unpriced inventory during the April 16, 2020, to
May 14, 2020, period. CFAP-2 payments are based uniquely on inventories, not sales, and the
inventory period overlaps with the CFAP-1 inventory period. As a result, some livestock inventories could be paid twice for the same price decline.
Flat-Rate Crops
Commodities that did not experience a 5% or greater price decline but continue to experience COVID-19-related marketing costs and are able to provide information on 2020 planted acres
may be eligible for a flat-rate payment.37 Such commodities are referred to as flat-rate crops. For
flat-rate crops, USDA calculates the CFAP-2 payment as $15 per acre for a producer’s eligible
acres.38 The choice of $15 per acre reflects the continuation of the flat rate of $15 per acre that
USDA used as a floor payment rate for price trigger crops (as described earlier) and for major crops (corn, upland cotton, sorghum, soybeans, and wheat) under the 2019 Market Facilitation Program.39
Sales Commodities
Producers of commodities that did not have a 5% or greater price decline, and who do not have
data on 2020 planted acres, are eligible for payments based on the value of their 2019 sales (used
as a proxy for 2020 sales) for an extensive list of USDA-designated eligible commodities. For
such sales commodities, payments are to be calculated using a percentage of 2019 farm sales of the commodity based on five payment gradations (Table 4).
Producers compare their total sales of eligible commodities from 2019 against the payment
ranges in Table 4: the first $49,999 of sales receives a payment of 10.6%; the next $50,000 in sales (from $50,000 to $99,999) receives a payment of 9.9%, etc. Table 5 provides five examples of CFAP-2 sales commodity payment calculations under increasing sales values.
Many specialty crops are expected to receive CFAP-2 payments under the sales commodity
method. Under CFAP-1, specialty crop producers could receive payments under three different
methods: (1) a price-loss payment based on the quantity sold during the first quarter of 2020;40 (2)
37 USDA has deemed the announced commodities listed in Table 2 as being eligible under one of the three payment
methods. Producers do not have to document any loss; instead, they must document planted acres or 2019 sales per the
relevant payment method. 38 Eligible acres included the producer’s share of acres (as determined or reported via form FSA-578, Report of
Acreage) of the crop planted in 2020, excluding prevented planted and experimental acres.
39 CRS Report R45865, Farm Policy: USDA’s 2019 Trade Aid Package. USDA also contends that $15 per acre
generally falls along the lower end of the distribution for CFAP-2 price triggered crops. USDA, Coronavirus Food
Assistance Program 2: Cost-Benefit Analysis, September 15, 2020.
40 The first quarter was approximated by using data for the January 15, 2020, to April 15, 2020, period.

USDA’s Coronavirus Food Assistance Program: Round Two (CFAP-2)
Congressional Research Service 13
a market-cost payment based on the unpriced inventory on the farm (including unharvested
commodities); and (3) a spoilage payment based on shipped quantity that spoiled before the purchase contract’s completion and subsequently received no payment.41
Table 4. CFAP-2 Payment Rate for Sales Commodities by Sales Range
2019 Sales Range Percent Payment Factor
Up to $49,999
10.6%
$50,000 to $99,999
9.9%
$100,000 to $499,999
9.7%
$500,000 to $999,999
9.0%
All sales over $1 million
8.8%
Source: USDA, Office of the Secretary, “CFAP,” Final Rule, 85 Federal Register 59380, September 22, 2020.
Notes: Producers are to self-certify their 2019 commodity sales to their local FSA office. Eligible sales include
only sales of raw commodities grown by the producer. The portions of sales derived from adding value to the
commodity, such as processing and packaging, and from sales of products purchased for resale are not included
in the payment calculation unless determined eligible by the Secretary. The percent payment factors are based
on regression analysis estimating variable crop expenses as a proportion of fruit, vegetable, and nut sales, using
data from USDA’s 2018 Agricultural Resource Management Survey. For details, see the discussion in USDA,
Coronavirus Food Assistance Program 2: Cost-Benefit Analysis, September 15, 2020, pp. 20-21 and p. 21, footnote 8.
Table 5. CFAP-2 Calculations for Five Hypothetical Sales Commodity Producers
assuming different levels of 2019 sales of eligible commodities
Scen-
ario
2019
Sales
Sales Tranches and Payment Rates
Total
Gross
Paymenta
Effective
Rateb
Sales
<$50K
(10.6%)
$50K to
$99,999
(9.9%)
$100K to
$499,999
(9.7%)
$500K to
$999,999
(9.0%)
Sales
$1M or
more
(8.8%)
(A) (B)c (C)d (D)e (E)f (F)g (G) (H)
1 $8,265 $876 — — — — $876 10.6%
2 $66,187 $5,300 $1,603 — — — $6,903 10.4%
3 $220,737 $5,300 $4,950 $11,712 — — $21,962 9.9%
4 $686,650 $5,300 $4,950 $38,800 $16,798 — $65,848 9.6%
5 $3,978,421 $5,300 $4,950 $38,800 $45,000 $262,101 $356,151 6.3%
Source: Reproduced from Table 11 in USDA, Office of the Secretary, “CFAP,” Final Rule, 85 Federal Register
59380, September 22, 2020.
Notes: K = thousands; M = millions.
a. Total gross payments (G) equals the sum of payments by tranche, that is (B)+(C)+(D)+(E)+(F).
41 CRS Report R46395, USDA’s Coronavirus Food Assistance Program: Round One (CFAP -1).

USDA’s Coronavirus Food Assistance Program: Round Two (CFAP-2)
Congressional Research Service 14
b. Total gross payments (G) as a share of 2019 sales value (A), that is (G)/(A).
c. Under Tranche 1 (sales< $50,000), that is column (B): scenario 1 is ($8,265 x 10.6%) = $876; scenarios 2-5
are ($49,999 x 10.6%) = $5,300).
d. Under Tranche 2 ($50,000 to $99,999), that is column (C): scenario 1 is empty; scenario 2 is ($16,188 x
9.9%) = $1,603; scenarios 3-5 are ($49,999 x 9.9%) = $4,950.
e. Under Tranche 3 ($100,000 to $499,999), that is column (D): scenarios 1-2 are empty; scenario 3 is
($120,738 x 9.7%) = $11,712; scenarios 4-5 are ($399,999 x 9.7%) = $38,800.
f. Under Tranche 4 ($500,000 to $999,999), that is column (E): scenarios 1 -3 are empty; scenario 4 is
($186,651 x 9.0%) = $16,798; scenario 5 is ($499,999 x 9.0%) = $45,000.
g. Under Tranche 5 ($1 million or greater), that is column (F): scenarios 1-4 are empty; scenario 5 is
($2,978,422 x 8.8%) = $262,101.
Eligibility Criteria for Producers According to USDA rules, to qualify for a CFAP-2 payment, an eligible individual or legal entity must meet the below criteria.42 CFAP payments are not to be made until all eligibility documentation has been received.
Each producer or legal entity of qualifying commodities must complete a CFAP-
2 application form and provide any required documentation.43
A producer must share in the risk of producing a qualifying crop or livestock. 44 A
contract grower who does not own the livestock is to be considered a producer if
the contract allows the grower to have risk in the livestock.
A producer must be in the business of farming at the time of the application.
A producer must be in compliance with conservation provisions—including highly erodible land conservation (Sodbuster) and wetland conservation
(Swampbuster) provisions.45
A producer must be either a U.S. citizen or a resident alien; however, a foreign
person may qualify if that person provides sufficient land, capital, and active personal labor to the farming operation. USDA has established that 400 hours of
active personal labor or active personal management meet this standard.46
There is no requirement to have crop insurance coverage or coverage under the
Noninsured Crop Disaster Assistance Program.
42 These criteria apply equally to both CFAP-1 and CFAP-2 payments but with references to different periods—first
quarter 2020 for CFAP-1 versus second through fourth quarter 2020 for CFAP-2. The criteria are restated here with
reference to CFAP-2.
43 The required USDA application forms are available at USDA, CFAP -2, “Assistance with Applying,” at
https://www.farmers.gov/cfap. The application forms also are described in Appendix Table A.5 in CRS Report
R46395, USDA’s Coronavirus Food Assistance Program: Round One (CFAP -1).
44 In addition, a producer applying for CFAP-2 assistance for a crop under either the price trigger or flat -rate categories
must file a report of all acreage of the crop on FSA-578, Report of Acreage. 45 See CRS Report R42459, Conservation Compliance and U.S. Farm Policy.
46 Under traditional farm support programs, payment recipients must meet different eligibility requirements, including
the following: for active personal labor—the smaller of at least 1,000 hours per calendar year or 50% of the total hours
needed to run the farm operation; for active personal management—at least (a) 25% of total management hours of the
operation; or (b) at least 500 hours of management annually; or (c) a combination of labor and management hours as
defined by a USDA schedule. See CRS Report R46248, U.S. Farm Programs: Eligibility and Payment Limits.

USDA’s Coronavirus Food Assistance Program: Round Two (CFAP-2)
Congressional Research Service 15
A person or legal entity, other than a joint venture or general partnership,47 is
ineligible for payments if the person’s or legal entity’s average adjusted gross
income (AGI)—using the average of the AGIs for the 2016, 2017, and 2018 tax
years—is more than $900,000, unless at least 75% of that person’s or legal
entity’s average AGI is derived from farming, ranching, or forestry-related
activities.
A producer must not have a controlled substance violation.
Producer Data Subject to Verification
As with CFAP-1, producers are expected to self-certify their sales and inventories that are used to calculate CFAP-2 payments.48 Producers who are approved for participation in CFAP-2 are
required to retain documentation in support of their application for three years after the date of
approval. This includes records and paperwork to demonstrate losses, especially for producers
who have destroyed their product (e.g., dumping of milk or plowing under specialty crops).
Participants receiving CFAP payments, or any other person who furnishes such information to
USDA, must permit authorized representatives of USDA or the Government Accountability Office (GAO) to enter, during regular business hours, the agricultural operation and to inspect,
examine, and make copies of books, records, or other items for the purpose of confirming the accuracy of the information provided by the participant.
Payment Limits CFAP-2 payment limits are identical to those of CFAP-1; however, they are separate from and independent of both CFAP-1 payment limits and other farm program payment limits. In general,
CFAP-2 payments are subject to a per-person and per-legal-entity payment limitation of
$250,000,49 which is expected to result in some eligible commodity producers not receiving the
entire calculated CFAP-2 payment. For example, USDA projects that based on its CFAP-2
payment formula without payment limits, $18.6 billion in CFAP-2 payments would be made.50 However, after applying the CFAP payment limit criteria, USDA projects that a net of $13.2 billion in CFAP-2 payments would be made.
Unlike payment limits for other FSA programs where corporate entities are limited to a single payment limit,51 USDA has elected to apply special payment limitation rules to CFAP-1 and
CFAP-2 participants that are corporations, limited liability companies, and limited partnerships.
In the case of CFAP-2 payments, under the special payment limitation rules, corporate entities
may receive payments up to $750,000 if three or more different individual owners or shareholders
of the legal entity each contributed at least 400 hours of active personal labor or active personal management (or combination thereof) with respect to the production of either 2019 or 2020 commodities—the relevant year varies with different commodities, as described above.52
47 With respect to joint ventures and general partnerships, this adjusted gross income (AGI) provision would be applied
to each member of the joint venture and general partnership.
48 USDA, FSA, “Coronavirus Food Assistance Program,” Final Rule, 85 Federal Register 59380, September 22, 2020.
49 This compares with a payment limit of $125,000 per individual under traditional farm programs from Title I of the
2018 farm bill (P.L. 115-334). See CRS Report R46248, U.S. Farm Programs: Eligibility and Payment Limits. 50 Table 15 in USDA, Coronavirus Food Assistance Program 2: Cost-Benefit Analysis, September 15, 2020, p. 28.
51 CRS Report R46248, U.S. Farm Programs: Eligibility and Payment Limits.
52 7 C.F.R. Part 9, §9.2(e)(2).

USDA’s Coronavirus Food Assistance Program: Round Two (CFAP-2)
Congressional Research Service 16
Under normal USDA rules governing recordkeeping requirements in regard to meeting the
“actively engaged in farming” criteria, all persons who provide any management to the farming
operation and seek to qualify as a farm manager—eligible for payments up to the individual
payment limit—are required to maintain contemporaneous records or activity logs of their management activities.53
For a corporate entity,54
in general, the payment limit for the entity is $250,000;
the payment limit for the entity is $500,000 if two different individual owners or
shareholders of the legal entity each contributed at least 400 hours of active
personal labor or active personal management (or combination thereof) with respect to the production of commodities for which an application or applications
are made; and
the limit is $750,000 if three or more different individual owners or shareholders
of the legal entity each contributed at least 400 hours of active personal labor or active personal management (or combination thereof) with respect to the
production of commodities for which an application or applications are made.
Neither the CARES Act nor the underlying CCC authority requires payment limits. Payment
limits were applied at USDA’s discretion—similarly to when it established the Market
Facilitation Program payments and the Wildfire and Hurricane Indemnity Program, which were
also undertaken at the Secretary’s discretion.55 Benefits received under traditional farm support
programs, such as the Acreage Risk Coverage (ARC) and Price Loss Coverage (PLC) programs, are not to be added to either CFAP-1 or CFAP-2 payments—and CFAP-1 payments are not to be
added to CFAP-2 payments—when evaluating payment limits.56 In other words, payment limits
for CFAP-2 are independent of other farm program benefits received by a farm, including CFAP-1 payments.
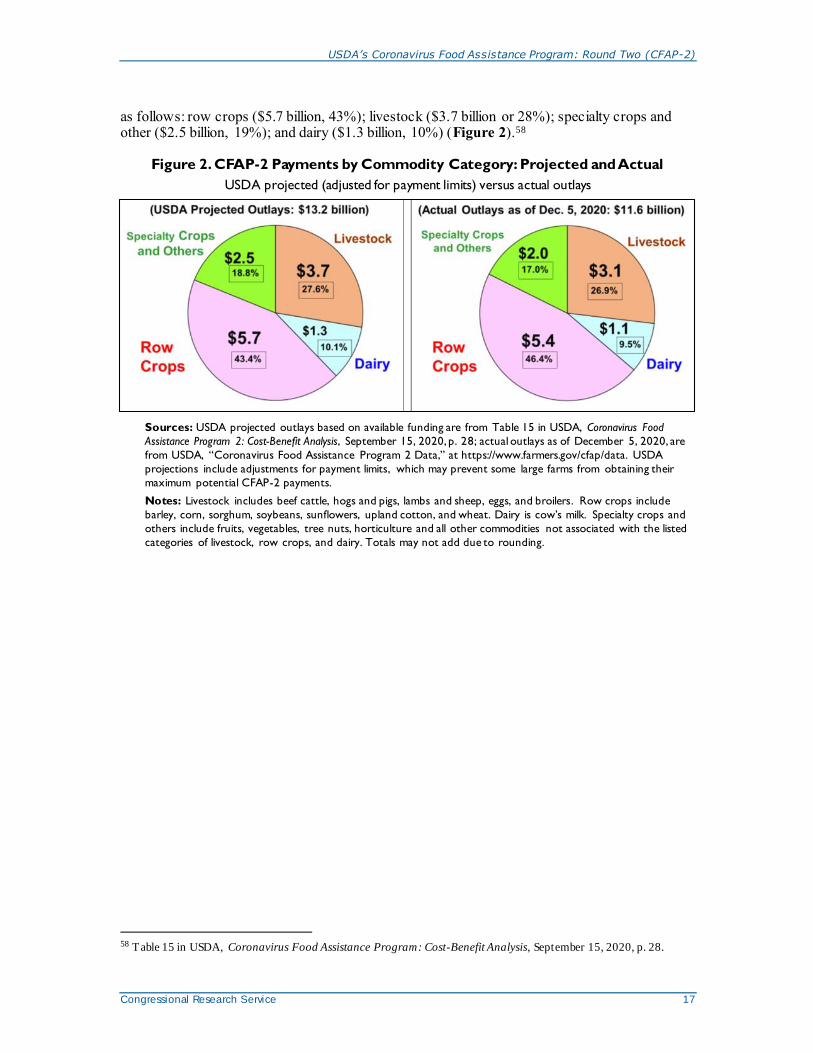
Program Outlays: Projected Versus Actual As of December 5, 2020, USDA had approved 759,089 applications and made $11.614 billion in outlays under CFAP-2 (Figure 2), with cattle and corn producers receiving the largest amounts.57
The current CFAP-2 payment geographic distribution pattern is similar to CFAP-1’s—that is,
payments are concentrated in the Corn Belt, Texas, and California (Figure 3). Producers could submit applications for CFAP-2 payments through December 11, 2020.
USDA projects that once adjustments have been made to account for payment limits, a total of
$13.2 billion in CFAP-2 funding will be allocated across the four different commodity groupings
53 See CRS Report R46248, U.S. Farm Programs: Eligibility and Payment Limits.
54 The CFAP-2 final rule (85 Federal Register 59380, September 22, 2020) extended the special payment limitation
provisions for corporate entities to trusts and estates for both CFAP-1 and CFAP-2. It also changed the method by
which payments under the special payment limitation provisions are attributed to individuals and legal entities for both
CFAP-1 and CFAP-2. The change was undertaken to avoid inequities attributed to ownership shares. 55 See CRS Report R45310, Farm Policy: USDA’s 2018 Trade Aid Package; CRS Report R45865, Farm Policy:
USDA’s 2019 Trade Aid Package; and CRS In Focus IF11539, Wildfires and Hurricanes Indemnity Program (WHIP) .
56 USDA, CFAP-2 Final Rule, 85 Federal Register 59380, September 22, 2020.
57 USDA, “Coronavirus Food Assistance Program 2 Data,” as of December 5, 2020, at https://www.farmers.gov/cfap/
data.
USDA’s Coronavirus Food Assistance Program: Round Two (CFAP-2)
Congressional Research Service 17
as follows: row crops ($5.7 billion, 43%); livestock ($3.7 billion or 28%); specialty crops and other ($2.5 billion, 19%); and dairy ($1.3 billion, 10%) (Figure 2).58
Figure 2. CFAP-2 Payments by Commodity Category: Projected and Actual
USDA projected (adjusted for payment limits) versus actual outlays
Sources: USDA projected outlays based on available funding are from Table 15 in USDA, Coronavirus Food
Assistance Program 2: Cost-Benefit Analysis, September 15, 2020, p. 28; actual outlays as of December 5, 2020, are
from USDA, “Coronavirus Food Assistance Program 2 Data,” at https://www.farmers.gov/cfap/data. USDA
projections include adjustments for payment limits, which may prevent some large farms from obtaining their
maximum potential CFAP-2 payments.
Notes: Livestock includes beef cattle, hogs and pigs, lambs and sheep, eggs, and broilers. Row crops include
barley, corn, sorghum, soybeans, sunflowers, upland cotton, and wheat. Dairy is cow’s milk. Specialty crops and
others include fruits, vegetables, tree nuts, horticulture and all other commodities not associated with the listed
categories of livestock, row crops, and dairy. Totals may not add due to rounding.
58 Table 15 in USDA, Coronavirus Food Assistance Program: Cost-Benefit Analysis, September 15, 2020, p. 28.

USDA’s Coronavirus Food Assistance Program: Round Two (CFAP-2)
Congressional Research Service 18
Figure 3. CFAP-2 Payments by State, as of December 13, 2020
state abbreviation: $ millions
Source: USDA, Coronavirus Food Assistance Program 2 data, as of December 15, 2020.
Notes: Total CFAP-2 outlays were $12.473 billion as of December 15, 2020.
Prior to adjusting for payment limits, USDA projects that corn producers would be eligible to
receive the largest outlay—$3.5 billion—from among the many eligible commodities (Table 2),
followed by cattle ($2.8 billion), dairy ($2.0 billion), hogs and pigs ($1.7 billion), and soybeans ($1.4 billion).59
Issues for Congress Three policy questions about the implementation of CFAP-2 payments are as follows:
1. Have CFAP-2 payments provided at least partial compensation to all producers
that have experienced unexpected economic costs due to COVID-19 during the
second through fourth quarters of 2020?
2. Have CFAP-2 funds been distributed in a fair manner to every producer and for
every commodity sector that has experienced COVID-19-related costs?
3. Have CFAP-2 payments overcompensated any producers for losses incurred from
COVID-19-related market disruptions?60
In addition to these questions, some have expressed additional policy concerns related to the
potential for duplication of loss coverage under existing farm programs; the limited role for
59 See footnote 58. 60 CFAP-2 payments are nominally supposed to correspond to a measure of losses incurred during the second to fourth
quarters of 2020. USDA’s various methods of estimating losses incurred under both CFAP-1 and CFAP-2 appear to
have lit t le relationship to actual losses incurred for many of the eligible commodities, as discussed earlier in the report .

USDA’s Coronavirus Food Assistance Program: Round Two (CFAP-2)
Congressional Research Service 19
congressional monitoring and oversight of the large sums of taxpayer money that are being spent
under a nontraditional authority; the potential need for additional assistance in 2021; and the
potential for this nontraditional authority to serve as a recurring template for future USDA payment interventions.
To address these questions, Congress could consider requesting that a study be conducted by an
independent, objective institution to review the evidence and empirically address many of these
questions, particularly if CFAP is to serve as a template for future large-scale emergency interventions in the agricultural sector. Several of these policy issues are discussed briefly below.
Congressional Monitoring and Oversight of CFAP-2 Outlays
Congress retains its traditional monitoring and oversight responsibilities for all USDA activities,
including the CFAPs. Total combined funding allocations to the two rounds of CFAP direct
payment programs are up to $30 billion—including up to $16 billion under CFAP-1 and up to $14
billion under CFAP-2. USDA has developed special websites for both rounds of CFAP spending that provide links to all official documentation, as well as weekly updates of payment data by
commodity and state.61 However, the time frame for implementation of these programs in
response to the pandemic leaves little time for congressional intervention at any level, were it to
be deemed necessary. Some additional topics Congress may consider exploring could include the
following: whether implementation of CFAP-2 created a burden for certain types of producers in
applying for program benefits; if USDA’s procedures for auditing self-certified records are likely to impose a burden on certain types of producers; whether payment rates are biased against
suppliers of higher-value crops (e.g., organic crops or crops targeting local markets); and whether
payments based on projected dairy production after September introduced moral hazard into dairy markets.62
Have CFAP-2 Payments Alleviated COVID-19-Related Costs?
There is no widely agreed-upon metric for assessing the extent of costs to the U.S. agricultural
sector associated with COVID-19-related low prices and market disruptions during the second to
fourth quarters of 2020. As a result, it is difficult to conclusively assess the extent to which
CFAP-2 payments are alleviating COVID-19-related costs—particularly while the program is
ongoing. For example, which is a better method of approximating losses—basing payments on sales or on inventories? Should USDA have considered estimating losses on eligible commodities
with actual sales separately from the loss calculations of commodities not yet harvested or sold?
Should USDA have adjusted for commodities that depend more heavily on farm production and
marketing costs that actually decreased during this period (e.g., fuel for drying and transporting grain)?
As CFAP-2 winds down and more stakeholder feedback becomes available, Congress may
evaluate whether it would serve as a useful template for future disaster response programs and
what changes might be necessary or useful in designing any future program. In addition, future studies may help to address the lack of information about the efficacy of the CFAP.
61 CFAP-2 program information is available at https://www.farmers.gov/cfap; CFAP-1 program information is
available at https://www.farmers.gov/cfap1.
62 The moral hazard would be that after receiving a payment for projected milk production during the September 1,
2020, to December 31, 2020, period, a producer might elect to produce less than was projected, thus garnering savings
from avoiding the production expenses associated with that production while capturing the CFAP -2 payments on the
projected production.

USDA’s Coronavirus Food Assistance Program: Round Two (CFAP-2)
Congressional Research Service 20
Will CFAP-2 Payments Duplicate Payments Under Traditional Farm Programs?
CFAP-2 payments to major program crops—such as corn, soybeans, and wheat—are to occur
primarily under the row-crop, price-trigger category and are to be based on 2020 planted acres.
The row-crop category is projected to be the largest recipient of CFAP-2 payments (Figure 2).
Row crops were a major recipient of CFAP-1 payments. In addition, most of these acres also participate in either the ARC or PLC programs,63 as well as in the federally subsidized crop
insurance program.64 If payments also were triggered under ARC and PLC during 2020, then it is
likely that a large portion (perhaps a majority) of those same farm acres would receive payments under multiple programs, including the CFAPs.
Have CFAP-2 Payments Been Distributed Fairly?
After CFAP-1, several program watchers asserted that the payment program’s implementation
methodology failed to incentivize participation by all affected agricultural sectors and all injured
producers in those sectors—in particular, small farmers, processed food commodities (e.g.,
raisins), and aquaculture.65 This concern has carried over to CFAP-2, and USDA made an effort to
expand CFAP-2 program inclusivity. The application period for CFAP-2 was open until
December 11, 2020. As a result, the question of its efficacy in responding to COVID-19-related costs cannot yet be fully answered. However, preliminary payment data may be used to make an
early assessment. Under the assumption that the COVID-19 pandemic affected all regions and
commodity sectors relatively equally, then a simple approach to evaluating the CFAP-2’s efficacy
would be to compare the distribution of CFAP-2 payments by commodity category with each category’s share of national output value (Figure 4).
Such a comparison would reveal that row crops—which are the primary beneficiary of traditional
farm support programs—have received the largest share (46.4%) of CFAP-2 payments, a share
that exceeds their share of average national output value (28.1%). In contrast, the specialty crops’ and livestock sector’s CFAP-2 payment shares are substantially lower than their national output
value shares—25.3% national output share versus 17.0% share of CFAP-2 payments for specialty
crops, and 36.3% versus 26.9% for livestock. The dairy sector’s share of national output value is nearly equal to its share of CFAP-2 payments—10.3% versus 9.5%.
If USDA’s projected outlays (Figure 2) are a good estimate of final CFAP-2 payments, then
dairy’s $1.3 billion (9.8%) and livestock’s $3.7 billion (28.0%) payment shares would align with
their national output shares. However, the row crops category’s projected $5.7 billion (43.2%) would be substantially larger than its national output value share of 28.1%, and the specialty
crops catetory would receive a smaller share of payments (18.9%) than its share of national
output (25.3%). However, this relatively simple comparison does not evaluate the extent to which
CFAP-2 payments have mitigated actual production and marketing losses sustained by each
commodity sector—the stated objective of the CFAP payments. Furthermore, future analysis based on these criteria may paint a different picture of sectoral benefits.
63 For a description of losses under the ARC and PLC programs, see CRS Report R45730, Farm Commodity Provisions
in the 2018 Farm Bill (P.L. 115-334).
64 The federal government subsidizes the cost of crop insurance regardless of market prices for insured crops. For a
description of losses under the federal crop insurance program, see CRS Report R45193, Federal Crop Insurance:
Program Overview for the 115th Congress. 65 See Hooker, “Smaller Farmers Are ‘Left Out ,’” 2020; and Letter from House Agriculture Chairman Collin Peterson
to USDA Secretary Perdue, June 9, 2020.

USDA’s Coronavirus Food Assistance Program: Round Two (CFAP-2)
Congressional Research Service 21
Figure 4. Average Output Value and CFAP-2 Payments by Commodity Category
Average farm value of output (2016-2020) versus current CFAP-2 outlays
Sources: Compiled by CRS from USDA, Economic Research Service, “U.S. and State-Level Farm Income and
Wealth Statistics: Annual Cash Receipts by Commodity,” September 2, 2020. CFAP-2 outlays as of December 5,
2020, are from USDA, “Coronavirus Food Assistance Program 2 Data,” at https://www.farmers.gov/cfap/data.
Notes: *Average production values are for 2016 through 2020. Livestock includes beef cattle, hogs and pigs,
lambs and sheep, eggs, and broilers. Row crops include barley, corn, sorghum, soybeans, sunflowers, upland
cotton, and wheat. Dairy is cow’s milk. Specialty crops and others include fruits, vegetables, tree nuts,
horticulture, and all other commodities not associated with the listed categories of livestock, row crops, and
dairy. Totals may not add due to rounding.
Will the Agricultural Sector Need Additional Assistance?
The question of whether additional assistance would be needed in response to the continuing effects of the COVID-19 pandemic will depend primarily on the duration of COVID-19 effects
on market conditions. Because CFAP payments are intended to offset both sales losses due to
price declines and higher marketing costs due to supply chain disruptions, a return to normalcy
for these two criteria (market prices and supply chain activity) would likely signal an end to the
need for federal assistance. However, these potential criteria engender several related questions. What would be a signal of a return to normalcy? Should USDA have the authority to determine
what constitutes a return to normalcy, or should Congress make this determination? Is it sufficient
if prices return to pre-COVID-19 levels or exceed historical averages? If producers reduce
livestock inventories to adjust to current COVID-19-suppressed demand conditions, is that a
return to normalcy, or is that a situation that requires compensation because demand is not what it would typically be—similar to the justification for the Market Facilitation Program payments?66
With respect to COVID-19-related sales losses from price declines, payments were based on a
commodity having experienced at least a 5% decline in prices from pre-COVID-19 average prices based on the January 13-17 period to the mid-April period for CFAP-1 and to late July for
CFAP-2 (Figure 1). Livestock and row crop commodities, which are price-trigger commodities,
received over 73% of CFAP-2 payments through December 5, 2020 (Figure 4). Since late July,
most of the major crop and livestock commodities (dairy and beef cattle being notable
exceptions) have seen their prices increase substantially under improving market conditions, which include tighter supplies and increasing international demand (Figure 5).67
66 See CRS Report R45310, Farm Policy: USDA’s 2018 Trade Aid Package; and CRS Report R45865, Farm Policy:
USDA’s 2019 Trade Aid Package. 67 USDA, World Agricultural Supply and Demand Estimates, November 11, 2020.
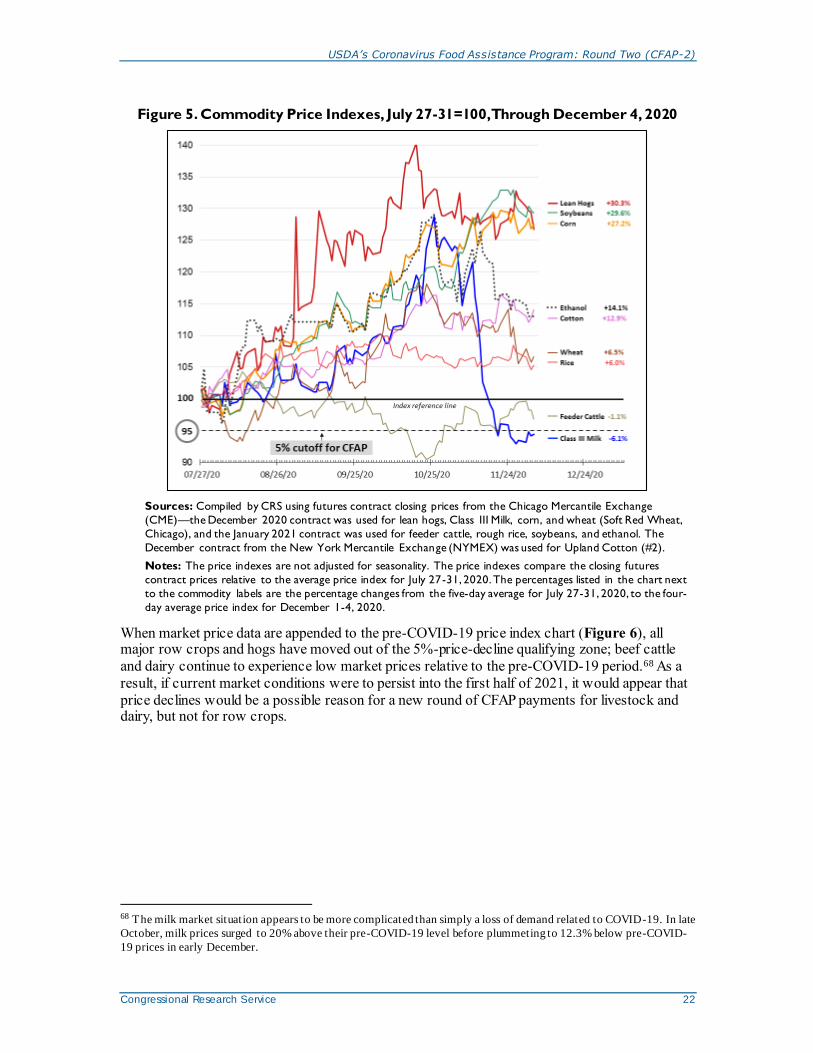
USDA’s Coronavirus Food Assistance Program: Round Two (CFAP-2)
Congressional Research Service 22
Figure 5. Commodity Price Indexes, July 27-31=100, Through December 4, 2020
Sources: Compiled by CRS using futures contract closing prices from the Chicago Mercantile Exchange
(CME)—the December 2020 contract was used for lean hogs, Class III Milk, corn, and wheat (Soft Red Wheat,
Chicago), and the January 2021 contract was used for feeder cattle, rough rice, soybeans, and ethanol. The
December contract from the New York Mercantile Exchange (NYMEX) was used for Upland Cotton (#2).
Notes: The price indexes are not adjusted for seasonality. The price indexes compare the closing futures
contract prices relative to the average price index for July 27-31, 2020. The percentages listed in the chart next
to the commodity labels are the percentage changes from the five-day average for July 27-31, 2020, to the four-
day average price index for December 1-4, 2020.
When market price data are appended to the pre-COVID-19 price index chart (Figure 6), all major row crops and hogs have moved out of the 5%-price-decline qualifying zone; beef cattle
and dairy continue to experience low market prices relative to the pre-COVID-19 period.68 As a
result, if current market conditions were to persist into the first half of 2021, it would appear that
price declines would be a possible reason for a new round of CFAP payments for livestock and dairy, but not for row crops.
68 The milk market situation appears to be more complicated than simply a loss of demand related to COVID-19. In late
October, milk prices surged to 20% above their pre-COVID-19 level before plummeting to 12.3% below pre-COVID-
19 prices in early December.

USDA’s Coronavirus Food Assistance Program: Round Two (CFAP-2)
Congressional Research Service 23
Figure 6. Commodity Price Indexes, January 13-17=100, Through December 4, 2020
Source: Compiled by CRS using futures contract closing prices from the CME—the December 2020 contract
was used for lean hogs, Class III Milk, corn, and wheat (Soft Red Wheat, Chicago) , and the January 2021 contract
was used for feeder cattle, rough rice, soybeans, and ethanol. The December contract from the NYMEX was
used for Upland Cotton (#2).
Notes: The price indexes are not adjusted for seasonality. The price indexes compare the closing futures
contract prices relative to the average price index for January 13-17, 2020. The percentages listed in the chart
next to the commodity labels are the percentage changes from the 5-day average for January 13-17, 2020, to the
4-day average price index for December 1-4, 2020.
The CFAP-2 payment rate calculation was less transparent for many specialty crops. Such specialty crop payment rates were based largely on the addition of unexpected marketing costs
related to supply chain disruptions due to widespread shutdowns (with only a partial reopening)
of all but essential businesses; uncertainty about the availability of labor for the food distribution
network; and a large-scale reorientation of food product demand away from the bulk form
targeting institutional purchasers (including restaurants, hotels, schools, and entertainment venues) and toward smaller packaging or consumer-ready items for sale at retail outlets.
Much of the transformation refocusing food product delivery to retail outlets is now happening or
has occurred. Similarly, food processors have implemented slower line operating speeds and new safety standards to ensure worker safety than before the COVID-19 pandemic. These
transformations have likely raised costs from the pre-COVID-19 period, but those costs are
becoming more stable, thus aiding greater confidence in the supply chain. However, the COVID-
19 pandemic continues unabated, and most parts of the country continue to implement partial or
full shutdowns of restaurants and schools, as well as sports and entertainment venues. Whether this continuation of at least a partial shutdown of institutional buyers constitutes grounds for another round of CFAP payments remains an open question.

USDA’s Coronavirus Food Assistance Program: Round Two (CFAP-2)
Congressional Research Service 24
Appendix. Supplementary Tables
Table A-1. Price Changes from Mid-January to Late-July 2020 for Price Trigger Commodities
Commodity Unit
Avg. Price:
Jan. 13-17
Avg. Price:
July 27-31
Price
Declinea
Percent
Decline
($/unit) ($/unit) ($/unit) (%)
Cropsb
Barley bushel $4.27 $3.60 $0.67 16%
Corn bushel $4.02 $3.29 $0.73 18%
Cotton, Upland pound $0.72 $0.62 $0.10 14%
Sorghum bushel $3.82 $3.12 $0.70 18%
Soybeans bushel $9.63 $8.91 $0.72 7%
Sunflowers pound $0.18 $0.16 $0.02 11%
Wheat (all classes) bushel $5.57 $4.89 $0.68 12%
Dairy
Cow’s milkc cwt $17.73 $15.60 $2.13 12%
Livestock
Fed cattled head $1,706 $1,537 $169 10%
Feeder cattle (< 600 pounds)e head $861 $791 $70 8%
Feeder cattle (>600 pounds) f head $1,174 $1,078 $96 8%
Hogs and pigsg head $148 $109 $39 26%
Lambs and sheeph head $200 $149 $51 26%
Broilers and Eggs
Broilersi pound $0.9096 $0.6489 $0.26 29%
Shell eggsj dozen $0.46 $0.40 $0.06 13%
Liquid eggsk pound na na $0.06 na
Dried eggsl pound $2.15 $1.98 $0.17 8%
Frozen eggsl pound $0.53 $0.45 $0.08 15%
Source: USDA, Coronavirus Food Assistance Program 2: Cost-Benefit Analysis, September 15, 2020.
Notes: Average prices are rounded to two decimal places. cwt = hundredweight; lbs. = pounds.
a. The price decline is the difference between the weekly average of the futures contract prices (or weekly
average of the cash prices if the futures prices are unavailable) for the weeks of January 13 -17, 2020, and
July 27-31, 2020.
b. Wheat prices are based on a production-weighted composite of hard red spring (HRS), hard red winter
(HRW), and soft red winter (SRW) futures. For crops with futures market data, December contracts are
from the Chicago Mercantile Exchange (CME) for most crops other than soybeans (November contract).
HRS wheat uses the December contract quoted on the Minneapolis Grain Exchange, and upland cotton
uses the December contract quoted on the Intercontinental Exchange (ICE). For nonspecialty crops
without futures contracts, Risk Management Agency (RMA) conversion factors utilizing futures contracts
are employed when relevant and available. The price for sorghum is calculated as 95% of the corn futures
price, which is consistent with the multiplicative factor used by RMA under the Commodity Exchange
Price Provisions (CEPP). The price of sunflowers is the soybean oil price divided by 2, plus 1 cent, which is

USDA’s Coronavirus Food Assistance Program: Round Two (CFAP-2)
Congressional Research Service 25
consistent with the CEPP for oil-type sunflowers. AMS data is used for other crops where futures
contracts are not traded.
c. Milk prices are calculated as the average of Class III (60% weight) and Class IV (40% weight) futures prices.
Although the all-milk price by construction always will be above the Class III and Class IV prices, the all-
milk price generally follows the trend of the weighted average of 60% of the Class III price and 40% of the
Class IV price.
d. Fed cattle are cattle that are market-ready (with a weight of 1,200 lbs. or more) and intended for
slaughter. The price decline per head of fed cattle is approximated by first calculating the difference
between the weekly average prices for January 13-17, 2020, and July 27-31, 2020. These values are
multiplied by 14 (assuming an average weight of 1,400 lbs. or 14 cwt) to approximate the equivalent per-
head values for fed cattle.
e. Feeder cattle are young cattle that are taken off pasture and brought to a feedlot for finishing weight gain
to achieve market-ready status prior to slaughter. The under 600-pound category price per head is the
feeder cattle November 2020 futures contract price ($/cwt) multiplied by 5.5 cwt, the typical weight of a
weaned calf.
f. The feeder cattle over 600-pound category price per head is the feeder cattle November 2020 futures
contract price multiplied by 7.5 cwt, the typical weight of feeder cattle when placed on feed.
g. Hogs are any swine that weigh more than 120 lbs. Pigs means any swine weighing less than 120 lbs. Lean
hog December 2020 futures contract prices are converted to a per-head basis using a 215 pound-per-head
conversion factor.
h. Lambs and yearlings are all sheep less than two years of age. All sheep are greater than two years of age.
The AMS provided price data.
i. Broiler prices are the National Composite Weighted Average from the AMS Broiler Market News Report.
To obtain the per-bird payment rate of Table 3, the price decline is converted from a per-pound basis to
a per-bird basis, which uses the average live weight of young chickens from January 2020 to June 2020 (as
reported in the NASS July 2020 Poultry Slaughter report) and a dressed percentage of 76% from the AMS
Broiler Market News Report to give a dressed weight of 4.86 lbs. per bird.
j. The shell egg price is the National Shell Egg Index Price for large eggs from the National Shell Egg Index Price
Report.
k. Liquid egg price data are not shown by USDA to maintain confidentiality of proprietary data.
l. Prices are from the AMS Processed Eggs: Weekly National Egg Product report, using the midpoints for
“Whole” eggs of the “Mostly” columns.
Author Information
Randy Schnepf
Specialist in Agricultural Policy

USDA’s Coronavirus Food Assistance Program: Round Two (CFAP-2)
Congressional Research Service R46645 · VERSION 6 · NEW 26
Disclaimer
This document was prepared by the Congressional Research Service (CRS). CRS serves as nonpartisan shared staff to congressional committees and Members of Congress. It operates solely at the behest of and
under the direction of Congress. Information in a CRS Report should not be relied upon for purposes other than public understanding of information that has been provided by CRS to Members of Congress in
connection with CRS’s institutional role. CRS Reports, as a work of the United States Government, are not subject to copyright protection in the United States. Any CRS Report may be reproduced and distributed in its entirety without permission from CRS. However, as a CRS Report may include copyrighted images or
material from a third party, you may need to obtain the permission of the copyright holder if you wish to copy or otherwise use copyrighted material.