
USAID VIETNAM LOW EMISSION ENERGY PROGRAM (V-LEEP) …
58
DISCLAIMER: This report is made possible by the support of the American people through the United States Agency for International Development (USAID). The contents are the sole responsibility of Deloitte Consulting LLP and its partners and do not necessarily reflect the views of USAID or the United States Government USAID VIETNAM LOW EMISSION ENERGY PROGRAM (V-LEEP) Report: Assessment of COVID-19 Impacts on Vietnam Power Sector and Recommendations April 12, 2021 PHOTO CREDIT: ILO IN ASIA AND THE PACIFIC
Transcript of USAID VIETNAM LOW EMISSION ENERGY PROGRAM (V-LEEP) …

DISCLAIMER: This report is made possible by the support of the American people through the United States Agency for International Development (USAID). The contents are the sole responsibility of Deloitte Consulting LLP and its partners and do not necessarily reflect the views of USAID or the United States Government
USAID VIETNAM LOW EMISSION ENERGY PROGRAM (V-LEEP)
Report: Assessment of COVID-19 Impacts on Vietnam Power Sector and Recommendations
April 12, 2021
PHOTO CREDIT: ILO IN ASIA AND THE PACIFIC


USAID VIETNAM LOW EMISSION ENERGY PROGRAM (V-LEEP)
Report: Assessment of COVID-19 Impacts on Vietnam Power Sector and Recommendations
Prepared for: Department of Planning, EREA, Ministry of Industry and Trade Prepared by:
Contract No. AID-440-TO-15-00003

TABLE OF CONTENTS
ACKNOWLEDGEMENT...................................................................................................................................................1ACRONYMSANDABBREVIATIONS............................................................................................................................2LISTOFFIGURES.............................................................................................................................................................3LISTOFTABLES...............................................................................................................................................................4V-LEEPOVERVIEW..........................................................................................................................................................5EXECUTIVESUMMARY..................................................................................................................................................6PART1: INTRODUCTIONANDRESEARCHMETHODOLOGY...........................................................................71.1 INTRODUCTION.................................................................................................................................................................71.2 HIGHLIGHTSOFTHEGLOBALSITUATIONANALYSIS......................................................................................91.3 RESEARCHMETHODOLOGY......................................................................................................................................101.4 DATACOLLECTIONMETHOD..............................................................................................................................................11
PART2: VIETNAMRESPONSETOTHEIMPACTSOFCOVID-19IN2020...................................................132.1 OVERVIEWOFCOVID-19SITUATIONINVIETNAM........................................................................................132.2 RESPONSESTOCOVID-19NATIONWIDEANDWITHINMINISTRYOFINDUSTRYANDTRADE...............................152.3 ASSESSMENTOFCOVID-19IMPACTSINVIETNAM........................................................................................18
PART3: ASSESSMENTOFCOVID-19IMPACTSONVIETNAMELECTRICITYSYSTEM...........................203.1 IMPACTSONSTATEMANAGEMENTAGENCIES...............................................................................................203.2 IMPACTONPOWERCORPORATIONSANDPOWERCOMPANIES..............................................................203.3 IMPACTSONOPERATIONOFGENERATORS.....................................................................................................263.4 IMPACTONTHEOPERATIONOFPOWERTRANSMISSIONUNITS...........................................................293.5 IMPACTONPROJECTCONSTRUCTIONACTIVITIES..............................................................................................30
PART4: VIETNAMPOWERSECTOR’SRESPONSETOCOVID-19..................................................................344.1 WORKFORCE....................................................................................................................................................................344.2 SERVICECONTINUITY..........................................................................................................................................................414.3 BUSINESSANDPRODUCTIONCONTINUITY.......................................................................................................................444.4 SUPPLYCHAIN................................................................................................................................................................454.5 CUSTOMERCARE..................................................................................................................................................................464.6 GENERALASSESSMENT..............................................................................................................................................47
PART5: KEYFINDINGSANDRECOMMENDATIONS.........................................................................................505.1 KEYFINDINGS......................................................................................................................................................................505.2 RECOMMENDATIONS...........................................................................................................................................................50
REFERENCES...................................................................................................................................................................54

1 | USAID V-LEEP COVID-19 IMPACT REPORT USAID.GOV
ACKNOWLEDGEMENT The V-LEEP team acknowledges the strong support that Dr. Nguyen Tuan Anh (Deputy Director General of EREA), and Mr. Nguyen Tuyen Tam and Mr. Nguyen Hoang Linh from the Department of Plans and Planning at EREA provided for this work.
We express our appreciation to Mr. Vo Quang Lam (Vice President of EVN) and Mr. Tran Duc Minh (International Relation Department of EVN) for helping us to schedule the meetings with other Departments of EVN.
We would like to thank the representatives of many EVN departments including: Human Resource Department; Business Department; Communication Department; Construction Management Department; National Load Dispatch Center; National Power Transmission Corporation; The Power Corporations of Hanoi City, Ho Chi Minh City, North, Central, Southern; GENCO 1,2,3; and other departments for their support, coordination, and for sharing information to develop this report.
Additionally, the team expresses thanks to Vinacomin-Power Holding Corp, PV Power, Mong Duong 2 Thermal Power Plant, Phu Lac Wind Power Joint Stock Company, and Phuoc Huu Solar Power Company for supporting us during the research process.
Finally, we are thankful to Olga Mandrugina, Julia De La Cruz and Merril Stypula of Deloitte for their in-kind contributions during the development of this report and for sharing experiences in responding to COVID-19 of power companies across the world, as a foundation for building the data collection framework for this research.

USAID.GOV USAID V-LEEP COVID-19 IMPACT REPORT | 2
ACRONYMS AND ABBREVIATIONS EE Energy Efficiency EES Electricity and electronic services Entity Power sector operating company or unit ERAV Electricity Regulatory Authority of Vietnam EREA Electricity and Renewable Energy Agency EVN Electricity of Vietnam F0 COVID-19 infected person F1 Person who has had close contact with F0 F2 Person who has had close contact with F1 GVN Government of Vietnam HCMC Ho Chi Minh City HHU Handheld Unit HR Human Resource IT Information Technology Ltd. Limited Liability MOIT Ministry of Industry and Trade MTV Single-member company NLDC National Load Dispatch Center NPS National public service NPT National Power Transmission O&M Operations and Maintenance PDP Power Development Plan PPA Power purchase agreement RE Renewable Energy SOP Standard Operating Procedures USAID US Agency for International Development V-LEEP Vietnam Low Emission Energy Program

3 | USAID V-LEEP COVID-19 IMPACT REPORT USAID.GOV
LIST OF FIGURES Figure 1: Report Research Process ...................................................................................... 12Figure 2: Regulations on immigration procedure for foreign experts ..................................... 16Figure 3: MOIT Decision on temporary working conditions under Directive 16/CT-TTg ....... 17Figure 4: GDP growth in the first 9 months of every year 2011 – 2020 ................................. 18Figure 5: Proportion of enterprises affected by COVID - 19 .................................................. 19Figure 6: Impact of COVID-19 on power demand of different customer groups .................... 21Figure 7: COVID-19 caused a reduction in commercial electricity output compared to the plan ........................................................................................................................................ 22Figure 8: Change in electricity consumption by types of consumer in some selected entities ............................................................................................................................................... 24Figure 9: The consumption shift among consumer categories .............................................. 24Figure 10: Impact of the pandemic on projects under construction ....................................... 30Figure 11: Delay period of projects under construction ......................................................... 31Figure 12: Reasons for the project delay ............................................................................... 31Figure 13: Reasons for material and equipment supply delay ............................................... 32Figure 14: Request for entities’ COVID-19 prevention and control measures ....................... 34Figure 15: Implementation of criteria to maintain the sufficient workforce ............................. 35Figure 16: Measures to meet the distancing requirements .................................................... 36Figure 17: MOIT’s Action plan for responding to COVID-19 .................................................. 37Figure 18: Pandemic progress update frequency .................................................................. 38Figure 19: Source of information for the pandemic update .................................................... 38Figure 20: Content of the collected information ..................................................................... 39Figure 21: Pre-processing data before dissemination ........................................................... 39Figure 22: Updated information on COVID-19 spread ........................................................... 40Figure 23: Information update frequency after the peak period of COVID–19 ...................... 40Figure 24: Reporting and monitoring of adjustments of entities during COVID–19 ............... 41

USAID.GOV USAID V-LEEP COVID-19 IMPACT REPORT | 4
LIST OF TABLES Table 1: Commercial electricity in the first 6 months of 2019 and 2020 ................................ 21Table 2: Change in commercial electricity output during COVID 19 ...................................... 22Table 3: Shift in electricity consumption among consumers during COVID-19 period .......... 23Table 4: Distribution grid loss ................................................................................................ 24Table 5: Distribution grid indicators ....................................................................................... 25Table 6: Revenue of the distribution entities .......................................................................... 26Table 7: Impact of COVID–19 on revenue of distribution entities .......................................... 26Table 8: Actual 2020 power production of power generation entities .................................... 28Table 9: Factors impacting the production output of generators ........................................... 28Table 10: Self-consumption rate of power generation entities ............................................... 29Table 11: Emergency plan development indicators ............................................................... 37Table 12: Roadmap for e-meter installation ........................................................................... 42Table 13: Proportion of e-processing for request for services ............................................... 43Table 14: Material and equipment supply indicators ............................................................. 46

5 | USAID V-LEEP COVID-19 IMPACT REPORT USAID.GOV
V-LEEP OVERVIEW The United States Agency for International Development (USAID) Vietnam Low Emission Energy Program (V-LEEP) helps the Government of Vietnam (GVN) establish an effective policy, regulatory, and incentive environment for low-emission growth in the energy sector, while simultaneously attracting public-sector and private-sector investment in renewable energy (RE) development and energy efficiency (EE). V-LEEP promotes the development of critical building blocks to scale up clean energy, such as accessible smart incentives for clean energy and EE investments, enabling a competitive environment for RE generation, enhancing renewable power grid integration, and ensuring locational concentration of clean energy generation facilities. Three components form V-LEEP’s core tasks: Component 1: Low Emission Strategy Development for the Energy Sector Task 1.1: Enhance GVN capacity to analyze and develop clean energy strategies and evaluate emission mitigation options for decision-making. Component 2: Enhance Capacity and Improve Enabling Environment for Renewable Energy (RE) Development Task 2.1: Enhance capacity of Vietnamese government institutions to improve the enabling environment for RE development. Task 2.2: Enhance capacity of RE developers and the private sector in large-scale RE development. Component 3: Increase Energy Efficiency Adoption and Compliance Task 3.1: Enhance government capacity to strengthen energy efficiency policy implementation. The V-LEEP implementation team for this study was led by Dr. Ananth Chikkatur, with support from Ha Dang Son, Nguyen Trong Nghia, Nguyen Hoang Lan, Dinh Thanh Minh, Nguyen Duc Hanh, and An Thi Hong Nhung.

USAID.GOV USAID V-LEEP COVID-19 IMPACT REPORT | 6
EXECUTIVE SUMMARY
COVID-19 is a global pandemic that has dramatically impacted socio-economic activities worldwide. All economic sectors in Vietnam have been impacted by this pandemic, at least to some extent. This study was conducted to provide an overall review of impacts of COVID-19 on Vietnam’s electricity industry as well as the responses of the sector to the crisis---including mitigating actions taken to address COVID-19 impacts by Government of Vietnam (GVN) in general, and by the Ministry of Industry and Trade (MOIT) in particular.
The data for the report was based on responses to questionnaires, group discussions, as well as primary and secondary data collection from Vietnam power entities. About 30 organizations participated in the survey, including state management agencies and energy entities (Electricity of Vietnam (EVN), power generation, transmission, distribution). Together, they provided a comprehensive overview of Vietnam’s electricity sector during the COVID-19 pandemic.
The analysis revealed that COVID-19 during 2020 mainly impacted the operating processes and personnel issues within state management agencies. For the generation, transmission, and distribution entities, the key impacts were due to changes in electricity demand. Power demand during the first six months of 2020 decreased as compared to the 2020 plan (developed at the end of 2019), but still increased when compared with the same period in 2019. Revenues of all power sector organizations were lower compared to the plan due to the lower than planned power production. For the distribution entities, in addition to the reduction in power production, GVN’s policy to reduce the electricity bills of consumers who were strongly affected by COVID-19 also impacted revenues.
In order to ensure stable, safe operation and adequate power supply for customers, the Vietnamese power sector entities developed and implemented response plans for different scenarios of the pandemic’s evolution. The solutions in all scenarios focused on ensuring the: (1) safety of human resources; (2) availability of a full range of materials and equipment for the replacement, maintenance, and installation for new projects; and (3) service continuity. The emergency response plan interventions are based on the information collected during the COVID-19 impact period, including guidance documents from GVN authorities and the Steering Committee on COVID-19 Prevention and Control.
Based on the analysis of impacts and response actions taken by the power sector in 2020, and evolution of the COVID-19 virus and its global impacts through the first quarter of 2021, the report makes general recommendations for Vietnam’s power sector as well as specific recommendations for power entities to cope with future waves of the pandemic and similar events in the future. These recommendations include:
• Staying alert to changes in COVID-19 response and recovery situation globally • Providing additional equipment and increased training on the application of information
technology • Continuing to focus on safety of operations and scheduling of teamwork • Enhancing online implementation of public services • Developing adequate and secure supply chain for transmission maintenance is key for
safe and stable operations • Considering options to increase local technical support to replace foreign experts • Flexibly adjusting plans for maintenance and replacement of equipment

7 | USAID V-LEEP COVID-19 IMPACT REPORT USAID.GOV
PART 1: INTRODUCTION AND RESEARCH METHODOLOGY
1.1 INTRODUCTION COVID-19 is a global pandemic that has dramatically impacted socioeconomic activities worldwide. Although Vietnam has been praised for having one of the most successful initial containment strategies, the pandemic’s impact will continue to be felt on the country’s economic, production, business activity, and social development due to COVID-19’s global economic impact.
In the first quarter of 2020, GDP growth was only 3.82 percent, the lowest level in the past decade. Tourism has been one of the most affected sectors due to the decline in the number of international visitors. Other related sectors, such as air transport, accommodation, food and beverage services, have also been impacted. The labor force participation rate has fallen with the number of workers (aged 15 and over) falling 144,200 compared to the same period in 2019.
The power sector is one of the sectors that provides input energy to other production and service industries. As a result, it has indirectly felt the impacts of the pandemic. Due to the decline in production and service industries, national electricity demand grew less than expected, especially for the industrial components – construction and service loads.
The global impact of COVID-19 also has the potential to impact Vietnam’s coal supply to coal-fired power plants due to the business shut down of several coal suppliers, supply of spare parts and materials, and the operating forces of utilities. Additionally, COVID-19 can have great impact on the repair and maintenance plans of the operating units as well as the progress of generation projects under construction due to the inability to mobilize human resources (border closures), procurement, and transport of materials.
How does COVID-19 affect Vietnam’s economy?
COVID-19 has had several impacts on Vietnam’s economy, including:
• Growth in the first quarter of 2020 was the lowest in 10 years, reaching only 3.82 percent. • The balance of the State budget revenue in four months was down by 5.9 percent compared
to the same period in 2019. • The labor force participation rate was a record low at 75.4 percent, down 1.3 percentage
points, the lowest in 10 years. • In Q1, the number of workers over 15 years old decreased by 144,200 compared with the
same period in 2019.
Source: Nguyen Vu (2020), How does Covid-19 impact Vietnam's economy. <https://baodautu.vn/covid-19-tac-dong-den-kinh-te-viet-nam-the-nao-d121405.html>

USAID.GOV USAID V-LEEP COVID-19 IMPACT REPORT | 8
The Electricity and Renewable Energy Agency (EREA), in collaboration with V-LEEP, conducted primary and secondary research to better understand COVID-19’s impact on Vietnam’s power sector, evaluate the response, and provide recommendations for future response efforts. This report also draws on the previous analysis of COVID-19 response efforts in other countries from March through July 2020. The report on international responses to COVID-19 introduced several recommendations relevant to Vietnam’s COVID-19 context. This report provides recommendations for impact minimization and ways to improve emergency responses in other similar emergency situations in the future.
This report reviews the Vietnam power sector’s initial and subsequent responses to COVID-19 through November 2020 and proposes appropriate measures to improve proactiveness and reduce the impact of future epidemics.
The contents of this report include the following:
• Part 1: Introduction and research methodology • Part 2: Vietnam’s response to the COVID-19 impacts in 2020 • Part 3: Assessment of the impact of COVID-19 on Vietnam electricity system • Part 4: Vietnam power sector’s response to COVID-19 • Part 5: Recommendations
How will COVID-19 affect electricity supply in the summer of 2021?
COVID-19 has affected EVN’s production and business performance, significantly affecting the coal supply to thermal power plants. Furthermore, domestic coal production has been affected due to the shortage of spare parts and materials as well as operating staff. For imported coal, there has been a risk of temporary suspension of coal supply markets, including South Africa. The pandemic has had a major impact on the existing infrastructure maintenance schedules. Some hydropower plants, such as Se San 3A, Song Tranh 2, A Vuong, Hoa Binh, and Son La, had to postpone their normal dry season maintenance plans because they could not import materials and equipment for replacement. This delay in planned maintenance increases the risk of equipment fault in the late dry season and flood season when units would be operating beyond their normal maintenance cycle time limits. The schedule of startup and operations for new power sources has also been impacted. For example, the Hai Duong BOT thermal power plant is three to four months behind schedule. This means the plant will be unlikely to supply the initially planned 680 million kWh in the upcoming dry season. Source: Xuan Tien (2020) How does COVID-19 affect the electricity supply in the coming hot season? <https://www.evn.com.vn/d6/news/Dich-COVID-19-anh-huong-the-nao-toi-tinh-hinh-cung-cap-dien-mua-nang-nong-sap-den-6-12-25448.aspx>

9 | USAID V-LEEP COVID-19 IMPACT REPORT USAID.GOV
1.2 HIGHLIGHTS OF THE GLOBAL SITUATION ANALYSIS In July 2020, V-LEEP prepared a Global COVID-19 Impact Assessment Report on Power Sector and International Best Practices to Mitigate Impacts (Global Impact Assessment Report). The Report reviewed relevant COVID-19 experiences of various electric utilities and national power sector stakeholders from around the world, e.g., Italy, Spain, Germany, USA, Singapore, Thailand, Philippines, South Korea, and Malaysia, and provided an initial set of recommendations and lessons-learned that could be applied to future national health emergencies in Vietnam. It also outlined relevant best practices in the pandemic response phase in terms of disease identification and analysis, emergency planning, service continuity, operational continuity, human resources, supply of raw materials and equipment, and customer support services.
The Global Impact Assessment Report divided the overall process of addressing the COVID-19 into three distinct phases:
1. RESPOND covers the period from when the pandemic was first identified and actions were taken to mitigate its impact
2. RECOVER starts when conditions have stabilized and begin “returning to normal” and ends when the situation is mostly back to normal or to a new stable state (when a vaccine is widely available)
3. THRIVE commences when a stable situation is reached, and corrective actions and new plans can be implemented to mitigate future challenges
The Global Impact Assessment Report shows that during the COVID-19 RESPOND phase, there has been inconsistency in the response, reflected in energy entities’ Standard Operating Procedures (SOP). Some entities were more aware of the risk of infection and activated their emergency plans earlier than others. These facilities substantially prevented the spread of COVID-19 in their facilities, reduced/prevented the infection of key staff, and avoided facility shutdowns. This shows the importance of situational analysis and SOP development to adapt and address unique issues caused by a pandemic. Inconsistency across agencies in situational awareness and emergency planning could be addressed if coordinated by a properly empowered, overarching third party.
COVID-19 has had a significant impact on how energy entities define an emergency. In the past, emergencies were often of a regional or local nature leading to short-term lockdowns or shutdowns. These types of event can be effectively handled by using support agreements or stand-by support contracts. The COVID-19 pandemic caused the shutdown of many business that were seen as non-essential, but were still energy consumers and employed energy consumers. Furthermore, domestic and international travel restrictions impacted tourism and construction labor. The result globally and locally has been a general economic slowdown, which generally leads to a decrease in electricity demand (amount of decrease per entity varied by load profile and the type (supply, transmission, distribution) of energy entity. The pandemic also affected the domestic and global supply chains, greatly affecting the supply of raw materials, including fuels.
Globally, governments, power sector agencies, and health organizations have not drawn sufficient lessons from previous infectious outbreaks (e.g., SARS, MERS, EBOLA, Spanish Flu) for timely adjustments in pre-COVID-19 procedures, orders, emergency supplies inventory, communication, and testing modes. Governments may need to formally set up an assessment body to designate changes to modes of operation and emergency plans, similar

USAID.GOV USAID V-LEEP COVID-19 IMPACT REPORT | 10
to the measures applied for global financial institutions after the financial crisis in 2008. Energy entities, agencies, and stakeholders should actively participate in such assessments to identify and prioritize changes to be made in the energy sector and develop response plans to ensure the timely recovery and business continuity in case of a prolonged and multi-wave pandemic. In order to respond more quickly and efficiently to a pandemic, energy entities and agencies need to collect more accurate information on infection status. Delays in closing essential areas/facilities could lead to the spread of COVID-19 in certain areas or the infection of critical personnel. As a result, some critical operations and maintenance personnel may need to be quarantined and will be unable to carry out their normal tasks, potentially causing facility outages, which, in turn, could result in an energy entity not being able to ensure the safe, stable, and efficient power generation, transmission and distribution.
In the early days of the pandemic, when a lockdown was applied, many government agencies and companies were unable to switch to remote work or work-from-home mode for essential work processes. In addition, most energy entities and agencies did not have systems in place to enable the automation or remote operation of all the workflows required to perform in the proper monitoring and operation of essential equipment. Energy entities and agencies, therefore, need to evaluate their workflows to eliminate unnecessary direct interactions in essential business activities. This includes the adoption and implementation of contactless technologies, modification of payment services, collection, meter reading, communication with customers, on-demand load control, and automation control for remote operations.
The evolving situation with the virus globally connected to ongoing infection cycles that are continuing into 2021 indicate that attention to the emergence of virus variants will continue. Thus it will be necessary to continue enhanced vigilance by Vietnam energy entities during 2021.
1.3 RESEARCH METHODOLOGY
1.3.1 ANALYSIS METHOD The method used in the research for this report was to synthesize and analyze collected information, including primary and secondary data. Relevant statistical data, assessments, and statements on the impacts of COVID-19 on the power sector in Vietnam as well as how global utilities respond to the impact caused by COVID-19 are provided. Assessments form the basis for statements and recommendations for the sector to cope with similar events in the future.
1.3.2 DATA FOR ANALYSIS Data comes from both primary and secondary sources, including:
• Commercial electricity, loss, and revenue data • Reports, regulations, and documents issued by GVN entities and agencies during
COVID-19 • Impacts of COVID-19 on GVN entities and agencies • GVN agencies’ and power sector entities’ responses to COVID-19
Primary data was collected through interviews with various stakeholders, including state management agencies, EVN and its member units, and non-EVN power generators.

11 | USAID V-LEEP COVID-19 IMPACT REPORT USAID.GOV
1.4 DATA COLLECTION METHOD During the survey, the team used a mix of qualitative and quantitative research methods. The main qualitative research method used was in-depth interviews. With the quantitative research, the team utilized questionnaires.
The design of the questionnaire was based on research done on countries around the world for the Global Impact Assessment Report and further adapted to the specific context of Vietnam. The questionnaire was prepared specifically for the target groups (state management agencies and power entities (generators, transmission and distribution units, etc.) to gather general information and specific relevant details for each surveyed entity. The general information section explores COVID-19 difficulties and measures taken, preparation plans, disease information, situation analysis, report monitoring, document review, emergency planning and implementation, project implementation, delays, if any, and human resource related issues. Based on the characteristics of different interviewees, the questions also covered continuity of operations and services.
For government agencies, questions were related to operational continuity of agency functions. To assess electricity production and supply units (transmission and distribution), there were questions related to revenue and supply of materials and equipment. For power generation, service continuity was reflected in the electricity output and characteristics related to the plant's operation, such as the average power factor of the generating units, maximum power, and self-consumption rate. For power transmission, questions were related to service continuity, including the assurance of transmission lines (maintenance, equipment replacement), operation staff, and transmission losses. For distribution specific audiences, questions were related to service continuity, including the modernization and digitalization of the service registration, adequate power supply for special consumers, distribution grid stability and reliability, changes in commercial electricity output, and shifts in power demand between consumers.

USAID.GOV USAID V-LEEP COVID-19 IMPACT REPORT | 12
Figure 1: Report Research Process
1.4.1 ANALYSIS OF THE INTERVIEWEES V-LEEP selected 30 interviewees from various organizations for the evaluation and recommendation activity. These included three state management agencies and energy entities, including: EVN, 13 power generation actors, four transmission actors, and nine distribution actors spread geographically across the country. In power generation, the selected plants included coal-fired, gas-fired, hydropower plants, wind power plants, and solar power plants (including floating solar power). Owners included units under EVN, Petroleum of Vietnam Corporation, Vinacomin, as well as independent and foreign invested power generators.
The diversity of the research target groups aims to be representative of the entire power sector and present all potential aspects and problems that may exist due to COVID-19.
Global situation overview analysis Provided recommendations on aspects relevant to Vietnam
Suggested target research groups
Development of the questionnaire Based on the findings of the global situation overview analysis,
develop the questionnaire for selected target groups
Data collection Conduct interviews to collect data
Data processing Process data to be used as the input for the analysis
Data analysis Based on the processed data, analyze different aspects to identify COVID-19 power
sector responses and impact
Recommendations Based on the analysis, synthesize and recommend measures
for efficient future response efforts

13 | USAID V-LEEP COVID-19 IMPACT REPORT USAID.GOV
PART 2: VIETNAM RESPONSE TO THE IMPACTS OF COVID-19 IN 2020
2.1 OVERVIEW OF COVID-19 SITUATION IN VIETNAM The first case of SARS-CoV-2 (COVID-19) virus infection in Vietnam was confirmed on January 23, 2020. As of November 6, 2020, Vietnam had experienced 1,203 infections, of which 1,069 were cured and 35 died. Throughout 2020, there were three distinct waves of COVID-19, as described below:1
Wave 1: January 3, 2020 – February 25, 2020. As soon as Vietnam began to record the first positive cases, the Government and Ministry of Health requested the preparation and implementation of response planning. With the first two confirmed positive cases at Cho Ray Hospital (HCMC), Vietnam officially began its fight against COVID-19. These first two patients were a Chinese father and son from Wuhan. Soon after, 14 more cases were confirmed with all having a history of traveling through China.
On January 17, eight workers, including seven from Vinh Phuc (specifically the Vinh Phuc-based Nihon Plast Company), returned from Wuhan after training. On January 30, the first person of this group tested positive. In the following days, there were several additional cases associated with this group of workers. Therefore, on February 12, 2020, Vinh Phuc isolated the entire Son Loi commune. This quarantine decision was later removed on February 26.
On February 1, 2020, the Ministry of Health announced a positive case in Khanh Hoa province. This patient had close contact with two Chinese patients infected with COVID-19 and treated in Vietnam.
Wave 2: March 6, 2020 - April 21, 2020: In Wave 2, cases began to spread among the community. The origin of the infection was not fully traced so the government implemented a national social distancing order, considerably influencing wide range of social and economic activities. On March 6, 2020, Hanoi announced its first case, representing Vietnam’s 17th case. On March 10, 2020, Binh Thuan detected a “super-spreader,” a patient who infected 11 other people after returning to Vietnam from the US via Tan Son Nhat airport and then back to Phan Thiet. This was Patient #34. On March 19, 2020, Ho Chi Minh City detected an outbreak at Buddha Bar, spread by an English pilot who resides in District 2, HCMC. This outbreak was strictly monitored for 20 days; 13 positive cases with COVID-19 were recorded. On March 20, 2020, the Ministry of Health announced that two nurses from the Tropical Diseases Center, Bach Mai Hospital, had become the 86th and 87th patients in Vietnam, respectively.
Wave 3: July 25, 2020 – December 12, 2020: On July 25, 2020, the Ministry of Health announced case #416, discovered in Da Nang, but could not trace the source of infection. This Da Nang outbreak marked the beginning of the third wave. Prime Minister implemented a social isolation order for Da Nang city starting on July 27; other localities were not affected. On July 31, 2020, Vietnam recorded its first death. By the end of 2020, Vietnam recorded 35
1 Source: Mistry of Health, Dashboard for COVID-19 statistics

USAID.GOV USAID V-LEEP COVID-19 IMPACT REPORT | 14
COVID-19 related deaths. All deaths were due to severe chronic underlying medical conditions. On September 5, Da Nang officially removed the social distancing order.
On November 28, 2020, Vietnam recorded case #1347 in HCMC. This patient, a flight attendant, did not follow quarantine rules and came into contact with others causing community transmission to two other patients. However, due to early detection and control, social isolation was not implemented.
On December 28, 2020, Vietnam confirmed cases #1450 and 1451in HCMC. These patients were from Myanmar, had illegally entered Vietnam on December 24, 2020, and had complicated travel routes.
Wave 4: January 27, 2021 to March 27, 2021: The initial source of the Wave 4 outbreak remains uncertain, but it is suspected that illegal immigrants or foreign experts brough COVID-19 back into Vietnam. This included new virus strains as well. Outbreaks appeared in places with high concentrations of people, including in industrial parks and airports. Although the Stage 4 outbreaks were more complicated and severe than the previous ones, the effective zoning regulations and ability to control the epidemic meant that social isolation measures only had to be introduced in areas with large outbreaks.
The first case in Wave 4 was identified on January 27 – a security officer at Van Don International Airport in Quang Ninh province. This was independent of the Hai Duong outbreak and is suspected to have resulted from illegal travelers. Quang Ninh province implemented social isolation measures in some areas starting on January 29, 2021. However, the province was able to curb and control the disease’s spread within a week, ending social isolation measures by February 9.
On January 27, Hai Duong recorded its first case of Wave 4 – a permanent resident in Hung Dao commune, Chi Linh city. The epidemic quickly spread to all 12 districts, towns and cities of the Hai Duong province with approximately 700 cases, as per the Vietnam Ministry of Health. Technically, there were five major outbreaks in Chi Linh city, Cam Giang, Kinh Mon, Nam Sach and Hai Duong districts, in the Cong Hoa industrial park. To control the outbreaks, Hai Duong implemented province-wide social isolation from February 16 to March 3.
Additionally, the Hai Duong outbreak spread to 12 additional provinces and cities, including: Ho Chi Minh City, Hanoi, Hai Phong City, and the provinces of Quang Ninh, Giai Lai, Binh Duong, Bac Ninh, Dien Bien, Hung Yen, Hoa Binh, Bac Giang, and Ha Giang. The total number of positive cases in the Wave 4 (including all provinces) is about 1000.

15 | USAID V-LEEP COVID-19 IMPACT REPORT USAID.GOV
2.2 RESPONSES TO COVID-19 NATIONWIDE AND WITHIN MINISTRY OF INDUSTRY AND TRADE
2.2.1 RESPONSE TO COVID-19 IN VIETNAM Vietnam’s COVID-19 response was strictly directed and regulated at the central, national level through the Prime Minister’s Directives and guidance from the Ministry of Health.2 On January 20, the Ministry of Health issued Decision No.156/QD-BYT declaring a response plan for acute pneumonia due to new strains of coronavirus (COVID-19). The plan defined three specific response scenarios:
• Scenario 1: No confirmed case identified • Scenario 2: Confirmed cases detected; zone fencing applied to promptly handle the
pandemic in order to minimize the spread to the community. • Scenario 3: Community spread. It is necessary to quickly respond, apply zone fencing,
and thoroughly work to limit the spread in the community.
The three scenarios, characterized by their flexible response options, outlined in Decision No.156/QD-BYT served as the basis for other agencies to develop their respective COVID-19 Response Plans.
Other important and relevant national directives influencing social and economic activities include:
• Directive 15/CT-TTg (March 27, 2020) required the: (1) suspension of all meetings and events with more than 20 people in a room; (2) maintenance of a minimum distance of 2m between people in a public place; (3) suspension of non-essential service, except for those selling food and essential goods; and (4) limiting of passengers taking public transportation. This directive stayed in effect through April 15, 2020.
• Directive 16/CT-TTg (March 31, 2020) enforced social distancing throughout Vietnam. Those working at factories were required to keep a distance of at least 2 meters, wear a mask, and sterilize the working conditions. The regulations ordered people to stay at home unless they have essential business, including shopping for food, medicine, emergency circumstances, or going to work at factories and essential business. This directive stayed in effect through April 1, 2020.
Figure 2 outlines the evolution of regulations affecting commercial flights for immigration and foreign workers in Vietnam.
2 Source: Mistry of Health, Dashboard for COVID-19 statistics

USAID.GOV USAID V-LEEP COVID-19 IMPACT REPORT | 16
Figure 2: Regulations on immigration procedure for foreign experts
Source: Ministry of Health (https://COVID-19.moh.gov.vn/)
The Ministry of Health also issued a Manual on Prevention and Response to COVID-19 Pandemic in Communities under New Normal Situation on 8 September 2020,3 which provides detailed guidance for households, social communities and businesses to follow.
2.2.2 RESPONSE TO COVID-19 IN THE MINISTRY OF INDUSTRY AND TRADE In order to implement the Prime Minister’s Directive 16/CT-TTg, MOIT issued its own guidance documents, including:4
• Decision No 435/QĐ-BCT (February 2, 2020) established the Steering Committee for Disease Control and Prevention COVID-19
• Directive No 04/CT-BCT outlined enhanced response solutions to disease caused by a new coronavirus of industry and trade sector
• Directive No 05/CT-BCT (February 26, 2020) implemented measures to promote import and export during COVID-19
• Decision No 481/QĐ-BCT outlined an action plan to enable the industry and trade sectors to respond to COVID-19
3 Decision No. 3888/QĐ-BYT dated 08/9/2020. See also https://moh.gov.vn/documents/176127/0/08.9.2020+Sổ+tay+COVID-19.pdf 4 Ministry of Industry and Trade - MOIT (2020), Dashboard for COVID-19 statistics. Retrieved in December 2020 from https:// hanhdong.moit.gov.vn
March 18Suspended
visas for foreigners
April 22Granted special
case entry permits for foreigners
May 29Began allowing
foreigners to submit
applications for working permits
Aug. 31Issued health regulations for foreign experts
working in Vietnam for
under 14 days
Sept. 15Resumed
international flights with 6
countries
Sept. 20Issued guidence
for temporary supervision of
foreigners entering Vietnam

17 | USAID V-LEEP COVID-19 IMPACT REPORT USAID.GOV
• Directive No 06/CT-BCT (March 11, 2020) outlined implementation measures to prevent and control the pandemic and remove difficulties for business activities in the industry and trade sectors amid the COVID-19 pandemic.
MOIT directed meetings to shift from onsite to virtual, instituting a work-from-home policy for all nonessential positions. Managers were assigned to work onsite to handle work like signing and approving documents. For important positions, the agency applied a rotating schedule to ensure at least one leader was present at the agency at all times. If needed, leaders were allowed to deputize and authorize another person. Interactions with other entities under its authority have been carried out online as much as possible (email, post, etc.) to limit direct contact. MOIT maintained maximum safety conditions for employees, including requisite temperature checks for people entering and leaving agency offices (including employees), hand washing and disinfection, mask wearing, and medical reports in accordance with the instructions of the Ministry of Health.
MOIT also introduced a number of measures to reduce contact including: rearranging workstations to ensure sufficient distance; assigning schedules to minimize the number of people working at the office at one time; increasing online work and email communication; limiting in-person exposure; wearing a mask in offices and meeting rooms; and providing hand sanitizer. Employees were required to apply for approval for their travel schedules and business trips.
Despite the challenges of the pandemic, information exchange among state management agencies, especially those within the same building, has greatly improved.
Figure 3: MOIT Decision on temporary working conditions under Directive 16/CT-TTg

USAID.GOV USAID V-LEEP COVID-19 IMPACT REPORT | 18
2.3 ASSESSMENT OF COVID-19 IMPACTS IN VIETNAM Although lower than in previous years, in contrast with the rest of the world, Vietnam continued to achieve positive economic growth. In the first nine months of 2020, GDP increased by an average of 2.12 percent (Q1 – 3.68 percent; Q2 – 0.39 percent; Q3 – 2.62 percent).5
Figure 4: GDP growth in the first 9 months of every year 2011 – 2020
Source: GSO
The agriculture, forestry, and fishery sectors became the drivers of Vietnam’s economy in this difficult period. Agriculture increased by 1.65 percent, contributing 0.19 percentage points to the increase in the total value of the economy. The forestry sector increased by 2.02 percent but accounted for a lower proportion of the total economy growth (0.01 percentage points). Fishery grew by 2.44 percent, contributing 0.08 percentage points to total economic growth.
Many of the technology and construction sub-sectors also grew, albeit at a much lower rate than in the preceding decade. Manufacturing continued to grow, increasing by 4.6 percent and contributing 1.02 percentage points towards Vietnam’s total economic growth.
In the services sector, several subsectors performed well during the first nine months of 2020. Wholesale and retail increased by 4.98 percent compared to 2019 (contributing 0.54 percentage points to total economic growth). Finance, banking and insurance grew by 6.68 percent (contributing 0.4 percentage points). However, transportation and warehousing fell by 4 percent (dropping total economic growth by 0.14 percentage points); accommodation and F&B services decreased by 17.03 percent (down by 0.76 percentage points).
Although in September 2020, trade and service activities showed signs of rebound, the first 9 months of 2020 recorded the lowest growth rate of total retail sales of goods and services. However, domestic exports maintained a high growth rate throughout 2020.
5 Data from General Statistics Office of Vietnam

19 | USAID V-LEEP COVID-19 IMPACT REPORT USAID.GOV
COVID-19 also had a profound impact on the labor market. As of September 2020, 31.8 million people aged 15+ had been negatively affected by COVID-19. This included people who lost jobs, had to take leave, or had reduced income. In 2020 Q3, there were 54.6 million workers aged 15+, an increase of 1.4 million from Q2, but still 1.1 million lower than the same period in 2019. After a record decline in 2020 Q2, the labor market is showing signs of recovery, but still has not recovered to 2019 levels. Income levels of workers in the third quarter also improved, but in general, income of the informal labor sector was 1.5 times lower than the average monthly income of the formal workers in the first three quarters of 2020. It is expected that laborers will continue to be affected by COVID-19 in the foreseeable future.
According to a survey by GSO, up to 85.7 percent of enterprises nationwide have been negatively affected by the COVID-19.6 In general, the larger firms have been affected to a greater degree than smaller firms. About 93% of large enterprises (currently accounting for 2.8% of the total number of enterprises) were affected by COVID, whereas 91% of medium enterprises, 90% of small enterprises, and 82% of microenterprises reported negative impacts (see Figure 5).
Figure 5: Proportion of enterprises affected by COVID - 19
Source: GSO
The COVID-19 pandemic has caused many difficulties for Vietnamese enterprises, including smaller consumption market, limitations in input materials, and reduced capital for production. Businesses must bear large burdens, such as premise rent, loan interest, labor cost, and other regular costs, while production and business activities are delayed. To cope with the impact of the pandemic, businesses applied many solutions, such as human resource adjustments, operating cost reductions, as well as changes to business and production strategies.
6 GSO (2020), Survey results on assessing the impact of Covid-19 to production and business activities of Vietnamese enterprises
Micro enterprises
Small enterprises
Medium enterprises
Large enterprises
SOEs Non-SOEs FDIs
Agriculture-forestry-fishery
Industry - Construction
Services
PROPORTION OF ENTERPRISES AFFECTED BY
COVID-19

USAID.GOV USAID V-LEEP COVID-19 IMPACT REPORT | 20
PART 3: ASSESSMENT OF COVID-19 IMPACTS ON VIETNAM ELECTRICITY SYSTEM
3.1 IMPACTS ON STATE MANAGEMENT AGENCIES In the context of this report, Vietnam’s state management agencies include: (1) agencies with the task of directing, inspecting, and urging the implementation of investment in power sources and grid development as outlined in the Power Development Plan approved by the Prime Minister; (2) agencies with the function of regulating electricity operations and electricity markets; (3) agencies in charge of state management of the electricity industry; and (4) agencies that manage and implement public service activities.
COVID-19 mainly affected the operational processes and personnel of state management agencies. These agencies systematically collected information on the pandemic, in accordance with the general regulations from the central agency, including information related to GVN regulations, disease warnings, pandemic areas, number of COVID-19 infections (in treatment, recovered, deaths), locations where COVID-19 infected people visited, etc. During the peak of the pandemic, this information was updated daily through Ministry of Health channels and the GVN web portal. Based on collected data, state management agencies developed plans to effectively respond to the pandemic to ensure smooth daily operations.
The state management agencies faced several difficulties during the early stages of the COVID-19 pandemic, such as: human resources staff being unfamiliar with online technology, new working procedures needed, and lack of equipment (laptops, printers, scanners, etc.) for teleworking and digitization of the workforce. After the first and second waves of the COVID-19 outbreak, personnel safety measures became part of normal working procedures, including temperature checks, hand washing, medical reports, and using face masks.
In general, state management agencies have appropriately adapted to their COVID-19 challenges. The most common challenge of agencies was adapting to online work and the shortage of equipment to be able to work effectively from home. However, all agencies have since applied measures to address these issues and those measures have been used effectively to ensure safety for their employees.
3.2 IMPACT ON POWER CORPORATIONS AND POWER COMPANIES Despite the unpredictability of COVID-19, the National Electricity System was able to continue operating safely, continuously and stably, including during holidays, Tet, and important economic, political, and socio-cultural events. Due to the impact of the COVID-19 pandemic, national electricity demand growth was lower than expected. In the first eight months of 2020, total electricity production of the whole system reached 163.4 billion kWh, an increase of 1.6 percent over the same period in 2019. Electricity supply to the industry and construction sectors only increased by 0.72 percent compared to the same period in 2019 while electricity supply to the commerce and service sectors fell by 11.75 percent compared to 2019. However, electricity for administration and residential customers increased by 6.54 percent over the same period in 2019 largely due to a prolonged large scale heat wave.
3.2.1 COMMERCIAL ELECTRICITY During the first half of 2020, commercial electricity demand increased by 2.24 percent over the same period in 2019. However, demand varied by user type. Hotel and restaurant demand fell by 11.98 percent as social distancing and immigration restrictions largely reduced business

21 | USAID V-LEEP COVID-19 IMPACT REPORT USAID.GOV
and travel activities. Meanwhile, administration and residential user demand increased by 6.44 percent and agriculture increased by 14 percent.
Table 1: Commercial electricity in the first 6 months of 2019 and 2020
SECTOR THE FIRST SIX
MONTHS OF 2019 (KWH)
THE FIRST SIX MONTHS OF 2020
(KWH) 2020 VS. 2019
(%)
Agriculture, forestry and aquaculture
3,327.37 3,789.75 13.90
Construction - industry 54,160.07 54,748.43 1.09
Commercial - hotel 5,596.57 4,925.99 -11.98
Administration and residential 32,982.59 35,105.69 6.44
Other 4,798.29 4,556.88 -5.03
SUM 100,864.89 103,126.75 2.24
Source: Vietnam Electricity (EVN)
Figure 6: Impact of COVID-19 on power demand of different customer groups
Source: Vietnam Electricity (EVN)
Commercial electricity is an important indicator in evaluating business performance of distribution units (power corporations and power companies). Given that COVID-19 directly impacted electricity consumers, 89 percent of surveyed entities said distribution units were also affected by a drop in total commercial output compared to the same period in 2019 (see Figure 7). Some distribution units that reported increases in commercial electricity use were located in zones with large-scale lockdowns or in areas where field hospitals were constructed to prepare for large-scale outbreaks. The distribution units with reduced commercial electricity demand were often those with a high proportion of industry, construction, commerce, hotels and restaurants (accounting for 46 – 70 percent of the total commercial electricity of the whole unit).
0
10.000
20.000
30.000
40.000
50.000
60.000
Agriculture, forestryand aquaculture
Construction -industry
Commercial- hotels Administration andresidential
Other
kWh
The first 6 months of 2019 The first 6 months of 2020

USAID.GOV USAID V-LEEP COVID-19 IMPACT REPORT | 22
Figure 7: COVID-19 caused a reduction in commercial electricity output compared to the plan
Source: Survey data
Table 2: Change in commercial electricity output during COVID 19
No. Entity Impact on Commercial Electricity Demand (2020 vs. 2019) 1 DISCO1 According to the 2020 plan, commercial electricity was predicted to
increase by 8.5 percent compared to 2019. However, by the end of 2020, the increase is expected to be only 1.93 percent.
2 DISCO2 In the first seven months of the year, commercial electricity output of DISCO2 reached 41.8 billion kWh, up 5.56 percent compared to the same period in 2019, reaching 54.29 percent of the plan assigned by EVN. In July alone, DISCO2's commercial electricity output reached 7,276 billion kWh, an increase of 9.01 percent compared to July 2019.
3 DISCO3 In the first half of 2020, commercial output reached 36,398 million kWh, an increase of 2.4 percent over the same period in 2019.
4 DISCO4 In the first seven months of 2020, commercial electricity output was 14,800.33 million kWh, a decrease of 1.68 percent compared to the same period in 2019.
5 DISCO5 In the first seven months of 2020, DISCO5’s total commercial electricity output reached 11,096 billion kWh, a decrease of 0.4 percent compared to the same period in 2019 (11,144 billion kWh).
6 DISCO2.1 In the first seven months of 2020, commercial output reached 1,761.33 million kWh, up 1.13 percent over the same period in 2019 (1,741.59 million kWh).
7 DISCO3.1 In the first half of 2020, electricity output decreased by 2.24 percent compared to the same period in 2019, a decrease of 151.2 million kWh.
8 DISCO4.1 In the first seven months of the year, the actual commercial output was 1,019.92 million kWh, 3.61 percent higher than the same period in 2019 (984.33 million kWh), reaching 53.18 percent of the annual plan in 2020 (1,918 million kWh).
9 DISCO5.1 Commercial electricity in the first six months of 2020 was 1,101,064 million kWh, down 8.11 percent compared to the same period in 2019 (1,198,294 million kWh).
Source: Survey data
89%
0%
11%
Yes
No
No response

23 | USAID V-LEEP COVID-19 IMPACT REPORT USAID.GOV
3.2.2 POWER CONSUMPTION For the majority of distribution units, electricity consumption from the commercial sector decreased, except for lighting and public administration. Electricity consumption from the construction industry also decreased. However, residential consumption generally increased. This represents a shift among different types of consumers, from the industrial and service sectors to the residential sector.
Table 3: Shift in electricity consumption among consumers during COVID-19 period
No. Entity Impact on Consumption Structure (2020 vs. 2019) 1 DISCO1 Electricity consumption for services, business, and production purposes
decreased, leading to a decrease in electricity consumption.
2 DISCO2 N/A
3 DISCO3 Consumption by industry and construction fell by 193 million kWh (1.46 percent drop). Commerce and hotel consumption fell by 86 million kWh (5.71 percent drop). Residential consumption grew by 965 million kWh (8.71 percent growth).
4 DISCO4 Consumption by industry and construction fell by 4.64 percent; commercial and hotel consumption decreased by 11.67 percent. Administration and residential consumption increased by 4.24 percent; agriculture forestry and aquaculture consumption increased by 18.72 percent.
5 DISCO5 In the first seven months of 2020, DISCO5 reported a decrease in commerce, services, and industry consumption and an increased in administration and residential consumption.
6 DISCO2.1 In the first seven months of 2020, industry and construction consumption dropped by 2.54 percent compared to the same period in 2019. Commerce and services consumption fell by 3.82 percent while administration and residential consumption increased by 8.68 percent.
7 DISCO3.1 Industry and construction consumption accounted for 70.1 percent of the total commercial output, a decrease of 3.14 percent compared to 2019. Agriculture, forestry, and aquaculture consumption increased by 0.65 percent. Commerce and hotel consumption increased by 0.12 percent. Administration and residential consumption increased by 2.35 percent while other activities increased by 0.02 percent.
8 DISCO4.1 As of July 2020, the actual commercial electricity output was lower than the target. A number of major energy consumers (textile, spinning, wood for export, etc.) in the area suspended their production or reduced the electricity need for production for many consecutive months.
9 DISCO5.1 Compared to the same period in 2019, in the first half of 2020, there was decreasing consumption in the commerce, services, and industry sectors, but an increase in consumption from administration and residential consumers.
Source: Survey data

USAID.GOV USAID V-LEEP COVID-19 IMPACT REPORT | 24
Figure 8: Change in electricity consumption by types of consumer in some selected entities
Source: Survey data
Given the shift in electricity consumption from production and business consumers to residential consumers, some distribution units have recorded a shift in time of maximum power consumption (45% of respondents of V-LEEP surveys – see Figure 9). Maximum power consumption was later, tending to shift to evening peak hours when residential consumers hit peak demand.
Figure 9: The consumption shift among consumer categories
Source: Survey data
3.2.3 DISTRIBUTION GRID LOSS Distribution unit reported grid loss rates ranged from 4 to 6.43 percent. Some units reported reduced loss compared to the same period in 2019, while others had increased loss.
Table 4: Distribution grid loss
NO. ENTITY LOSS IN 2020 1 DISCO1 6.43 percent
2 DISCO2 Power loss in July 2020 of the whole DISCO2 was 5.34 percent, down by 0.31 percent over the same period in 2019. On average in 2020, grid loss reached 4.99 percent, down by 0.33 percent over the same period in 2019.
45%
33%
22%
Yes
No
No response

25 | USAID V-LEEP COVID-19 IMPACT REPORT USAID.GOV
NO. ENTITY LOSS IN 2020 3 DISCO3 4.7 percent
4 DISCO4 4.30 percent
5 DISCO5 Power loss in the first seven months of 2020 reached 6.46 percent, down by 0.34 percent over the same period in 2019.
6 DISCO2.1 Accumulated loss in the first seven months of 2020 was 5.14 percent, up 0.94 percent compared to the same period in 2019 (4.2 percent).
7 DISCO3.1 During COVID-19, a number of major electricity consumers stopped production, causing a decrease in consumption. In addition, low voltage public electricity and an increase in household consumption caused some impacts, such as: transformer overload and wire overload of some public substations, which resulted in power loss.
8 DISCO4.1 In the first seven months of 2020, the actual loss rate was 4.13 percent, 0.49 percent higher than the same period in 2019 and 1.17 percent higher than the target assigned for the year 2020.
9 DISCO5.1 Accumulated power loss in the first half of 2020 was 4.00 percent, down by 0.29 percent over the same period in 2019.
Source: Survey data
The nine distribution units were surveyed on seven various distribution grid issues (Table 5). Only one distribution unit had problems with voltage stability and short-circuit current generation. Thus, it seems entities were largely able to ensure the quality of electricity and smooth operation of the distribution grid and targets of the distribution grid were basically unaffected by COVID-19.
Table 5: Distribution grid indicators
NO ITEM AFFECTED NOT AFFECTED
NO RESPONSE
1 General issue 1/9 7/9 1/9
2 Frequency stability 0/9 7/9 2/9
3 Voltage stability 1/9 7/9 1/9
4 SAIDI, SAIFI reliability 0/9 7/9 2/9
5 Short-circuit current occurrence 1/9 7/9 1/9
6 Harmonics occurrence 0/9 8/9 1/9
7 Electricity system safety, fault occurrence
0/9 8/9 1/9
Source: Survey data
3.2.4 REVENUE IMPACTS The revenue of distribution units was affected (see Table 6). Revenue was impacted by changes in electricity demand, demand shifts among consumer groups, and late payment of consumers’ electricity bills.

USAID.GOV USAID V-LEEP COVID-19 IMPACT REPORT | 26
Table 6: Revenue of the distribution entities
CATEGORY FIRST SIX MONTHS OF 2019
FIRST SIX MONTHS OF 2020 2020 VS. 2019
UNIT MILLION VND MILLION VND %
Agriculture, forestry and aquaculture
5,496,101.14 6,278,512.68 14.24
Construction-industry 88,189,927.43 88,069,554.05 -0.14
Commercial- hotels 14,869,664.97 12,966,865.98 -12.80
Administration - residential 40,542,288.49 69,867,023.05 72.33
Other 33,885,464.81 9,364,692.67 -72.36
Total 182,983,446.84 186,546,648.43 1.95
Source: Survey data
Official Letter 2698/BCT-DTDL issued by MOIT implemented a support policy for electricity tariffs and electricity bill reductions for consumers affected by COVID-19. This new policy has had significant impact on utility revenues. The policy was financed by utilities and deducted from individual electricity bills. Furthermore, utilities also spent additional resources to ensure proper and sufficient support throughout the pandemic. This also impacted bottom line revenues.
Table 7: Impact of COVID–19 on revenue of distribution entities
NO. ITEM YES NO NO RESPONSE
1 Is revenue affected by the drop in total electricity demand during COVID-19?
8/9 0/9 1/9
2 Is revenue affected by the shift in electricity demand among consumer categories?
7/9 2/9 0/9
3 Is revenue affected because consumers do not pay their bills?
6/9 3/8 0/9
Source: Survey data
3.2.5 SUMMARY OF COVID-19 IMPACT ON POWER COMPANIES AND CORPORATIONS The shifting in electricity demand from production and businesses to residential sector is the main impact of COVID-19 on Vietnam’s power sector. Unlike many other countries in the world, Vietnam experienced an increase in electricity demand during COVID-19. In general, commercial electricity consumption has increased compared to 2019, but not as much as expected. For distribution units, revenue was the main thing affected by the pandemic. Like other countries, Vietnam also offered a policy to support electricity consumers from April to June 2020 (funded by EVN). This policy supported eligible consumers by reducing the electricity tariff, but negatively impacted utility revenues.
3.3 IMPACTS ON OPERATION OF GENERATORS
3.3.1 GENERATION OUTPUT AND REVENUE Unlike most countries around the world, in the first three quarters of 2020, Vietnam’s total electricity production increased slightly over the same period in 2019. Electricity production

27 | USAID V-LEEP COVID-19 IMPACT REPORT USAID.GOV
and import of the whole system reached 185.37 billion kWh, an increase of 2.68 percent. In particular:
• Hydropower generation reached 48.38 billion kWh; 91.36 percent of the plan; down by 6.93 percent over the same period in 2019;
• Gas thermal power generation reached 27.42 billion kWh; down by 16.56 percent over the same period in 2019;
• Coal thermal power generation reached 97.29 billion kWh; up by 10.5 percent over the same period in 2019;
• Oil thermal power generation reached 1.04 billion kWh; up by 33.02 percent over the same period in 2019; and
• Renewable energy generation reached 8.16 billion kWh, of which solar power reached 7.23 billion kWh.
In general, thermal power generators increased output compared to 2019 while hydropower plants had signficantly reduced output. This is largely because water inflow to hydropower reserves decreased compared with previous years
Gas thermal power also decreased in 2020 due to a lack of gas supply. To compensate for the lower output of hydro and gas, coal thermal power was increasingly mobilized.
Despite the slight increase in total power generation, the actual amount generated in the first half of 2020 was lower than originally planned. This is true for every power generation entity. This may indicate that the impact of COVID-19 has affected manufacturing industries, resulting
Drought affects the amount of water flowing to hydropower reservoirs
In June 2020, the drought continued to occur across all regions of Vietnam. Even at the beginning of flood season, the Northern region water inflows were still 25-70 percent lower than historical average. In particular, the Da River basin was 41 percent lower than the average level. Harsh drought continued throughout the Central Highlands and South-Central Coast resulting in a water inflow deficit of 40-70 percent when compared with historical average levels.
Source: Water management Department, MONRE (2020), Forecasted that there will floods and rains but the amount of water flowing to hydropower reservoir is still very low.
Gas resources for thermal power plants
Vietnam’s gas-fired power plants now use domestic gas resources. However, the reserves of these gas fields are beginning to decline, and new sources must be found. In the revised Power Development Plan 7, LNG imports have been added as a potential supply source for Southern projects, including Nhon Trach, Son My, etc. Gas thermal projects often have higher electricity prices. For example, projects with domestic gas sources (Block B, Blue wave) have average electricity prices about 2.300 – 2.500 VND/kWh. The current price for projects with LNG imports is about US$0.10/kWh (although depending on international price of LNG).
Source: MOIT (2020), Minister of MOIT’s respond to Deputy Phan Thi Bich Thuan of HCMC Delegation.
USAID.GOV USAID V-LEEP COVID-19 IMPACT REPORT | 28
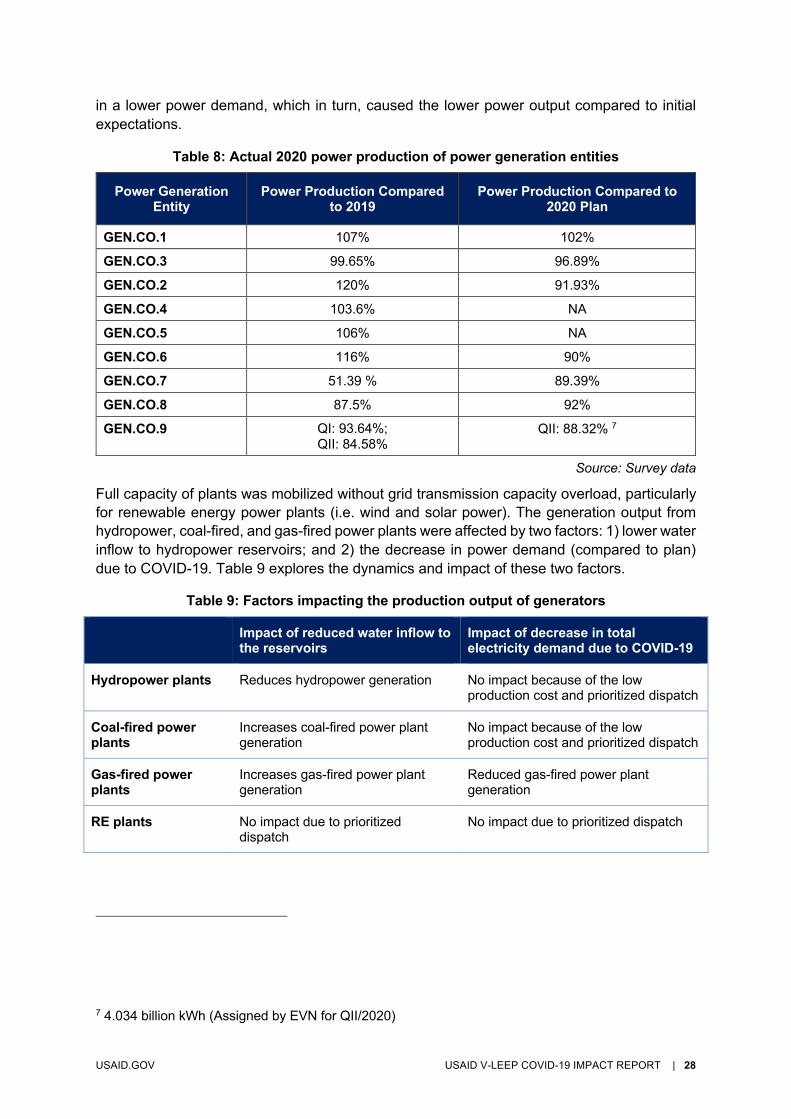
in a lower power demand, which in turn, caused the lower power output compared to initial expectations.
Table 8: Actual 2020 power production of power generation entities
Power Generation Entity
Power Production Compared to 2019
Power Production Compared to 2020 Plan
GEN.CO.1 107% 102%
GEN.CO.3 99.65% 96.89%
GEN.CO.2 120% 91.93%
GEN.CO.4 103.6% NA
GEN.CO.5 106% NA
GEN.CO.6 116% 90%
GEN.CO.7 51.39 % 89.39%
GEN.CO.8 87.5% 92%
GEN.CO.9 QI: 93.64%; QII: 84.58%
QII: 88.32% 7
Source: Survey data
Full capacity of plants was mobilized without grid transmission capacity overload, particularly for renewable energy power plants (i.e. wind and solar power). The generation output from hydropower, coal-fired, and gas-fired power plants were affected by two factors: 1) lower water inflow to hydropower reservoirs; and 2) the decrease in power demand (compared to plan) due to COVID-19. Table 9 explores the dynamics and impact of these two factors.
Table 9: Factors impacting the production output of generators
Impact of reduced water inflow to the reservoirs
Impact of decrease in total electricity demand due to COVID-19
Hydropower plants Reduces hydropower generation No impact because of the low production cost and prioritized dispatch
Coal-fired power plants
Increases coal-fired power plant generation
No impact because of the low production cost and prioritized dispatch
Gas-fired power plants
Increases gas-fired power plant generation
Reduced gas-fired power plant generation
RE plants No impact due to prioritized dispatch
No impact due to prioritized dispatch
7 4.034 billion kWh (Assigned by EVN for QII/2020)

29 | USAID V-LEEP COVID-19 IMPACT REPORT USAID.GOV
Based on our interviews, the change in generation output during COVID-19 had an impact on revenue for four entities.
3.3.2 IMPACT ON SELF-CONSUMPTION RATE COMPARED TO 2019 In some entities, the self-consumption rate changed in 2020 compared to 2019. In general, the trend of self-consumption reflects the opposite trend of changing generation. For example, hydropower plants’ electricity output fell, but the amount of electricity used for plant operations remained unchanged, leading to an increase in the self-consumption rate compared to 2019. In contrast, the generation output of thermal power plants, although lower than planned, was still higher than the same period in 2019 so the self-consumption rate decreased. At the unit level, the self-consumption rate of thermal power units increased because of low unit mobilization due to a scheduled maintenance plan.
Table 10: Self-consumption rate of power generation entities Generation Entity
Self-Consumption Rate Change
GEN.CO.1 In 2020, hydropower’s self-consumption rate was 0.75 percent compared to 0.64 percent in 2019 while thermal’s 2020 rate was 7.76 percent compared to 7.86 percent in 2019.
GEN.CO.3 Due to low load mobilization, many generating sets stopped the contingency resulting in increased self-consumption. In addition, the method of self-consumption calculation in 2020 changed from the method in 2016-2019. This led to a higher rate, especially for gas turbines.
GEN.CO.2 The self-consumption rate was 0.99 percent. It was higher in 2019 due to increased generation output. In 2020, the self-consumption rate for was 0.825 percent for hydropower (0.725 percent in 2019), 9.19 percent for coal power (9.36 percent in 2019), and 4.6 percent for oil power (5.36 percent in 2019).
GEN.CO.4 Self-consumption rate nearly unchanged.
GEN.CO.5 The self-consumption rate fell by 0.5 percent compared to the same period in 2019.
GEN.CO.6 The self-consumption rate fell by 16.47 percent compared to the same period in 2019.
GEN.CO.7 In the first half of 2020, the self-consumption rate of the plant was 0.489 percent, up 212.6 percent over the same period in 2019.
GEN.CO.8 Self-consumption rate was 0.99 percent. The rate was higher in 2019 due to increased generation output.
GEN.CO.9 Self-consumption rate increased.
Source: Survey data
3.4 IMPACT ON THE OPERATION OF POWER TRANSMISSION UNITS As the nature of the transmission activities is directly related to electricity system safety, the transmission network operators have detailed standard operating procedures (SOPs) to ensure emergency response. Therefore, the impact of COVID-19 on the transmission sector has been relatively insignificant. The equipment of the transmission network operators is modern and advanced and fully meet the needs of remote and online working modes. The human resources of these units are also fully trained to meet this need. As a result, the

USAID.GOV USAID V-LEEP COVID-19 IMPACT REPORT | 30
transmission network operators all responded well and did not encounter many difficulties during COVID-19.
The only impact was in terms of revenue. Due to the reduced demand for electricity, the amount of transmitted electricity on the transmission and distribution grids decreased. This resulted in decreased revenues compared to the amount initially planned for 2020. Nevertheless, the technical transmission network loss in the first six months of 2020 also fell compared to the same period in 2019.
3.5 IMPACT ON PROJECT CONSTRUCTION ACTIVITIES COVID-19 also impacted the implementation of projects under construction due to disrupted and indirect communication channels between the field and units. There was a lack of optimal measures to address these issues. Units also had to postpone work requiring field trips or working time shifting. Approximately, 70 percent of survey respondents (entities and agencies) said that the COVID-19 pandemic delayed the progress of projects under construction and 23 percent said that they were not affected (see Figure 10). None of the projects were canceled due to the pandemic. The delays of the units varied. For generators, the delay time ranged from 1.5 to 2 months, for distribution units, it varied from one to six months.
Figure 10: Impact of the pandemic on projects under construction
Source: Survey data
23%
70%
0%
7%
Not affected
Delayed
Postponed/Cancelled
N/A

31 | USAID V-LEEP COVID-19 IMPACT REPORT USAID.GOV
Figure 11: Delay period of projects under construction
Source: Survey data
There were many reasons for delays, but the most commonly cited one was related to the local governments’ inability to facilitate project site clearance. In some areas, due to social distancing, some projects were required to suspend construction. Other delays had to do with the lack of construction equipment and the inability of foreign experts to enter Vietnam during the pandemic.
Figure 12: Reasons for the project delay
Source: Survey data
DistributionLess than 2
months
From
2
mon
ths
N/A
Generation
Less
than
2
mon
ths
No impact
N/A
Transmission
From 2
months
No im
pact
N/A
56% 50%33% 28%
Local government couldnot facilitate the site
clearance for the projectbecause it had to prioritizethe pandemic prevention
and control
Local governmentrequested for the
suspension of constructionin several areas due to the
social distancingrequirement
Lack of materials andequipment for electric
work construction
Foreigncontractors/experts couldnot access to the site for
timely processing
Yes No

USAID.GOV USAID V-LEEP COVID-19 IMPACT REPORT | 32
For equipment and materials, delivery delays ranged from one to 24 weeks. This is due to: logistics, border closure problems, or supplier’s factor issues.
Figure 13: Reasons for material and equipment supply delay
Source: Survey data
3.5.1 IMPACT OF DELAYS
Delays due to COVID-19 impacted several aspects of the power supply chain:
Power Generation Projects. The delay in the commercial operation of power generation projects resulted in increased implementation costs and increased bank interest expenses of project investment. Furthermore, delays meant that new generation did not contribute to the supply of electricity to the national system. Transmission. The slow progress of transmission grid investment projects affected the progress of handling grid overload, increased the loss rate, and affected the reliability of power supply on the grid. Distribution. The delay of distribution grid investment projects affected power supply to some consumers and delayed the progress against the committed start, completion and settlement dates of the electric works. Equipment Installation. The COVID-19 pandemic also affected foreign consultants and staff because they were unable to enter Vietnam (due to flight restrictions, immigration permits, and quarantine processes) or they had to return to their home countries. This delayed installation of important materials and equipment.
Construction. Construction activity was delayed as contractors had difficulty in sending staff and foreign experts to supervise plant construction. Appropriate mitigation measures were taken, such as: conducting online trainings/discussions with foreign partners, applying remote video surveillance, online surveillance, providing instructions via IT means, engaging experts from countries with good pandemic control and complying with Vietnamese regulation on quarantine (14-day quarantine), and transferring experts from other projects who are in Vietnam. These measures partly addressed construction issues, but delays still occurred.
8
9
12
3
10
9
6
15
8
8
8
8
0% 20% 40% 60% 80% 100%
Border closure
Logisctic issue
Due to the supplier's factory
Other
Yes No No response

33 | USAID V-LEEP COVID-19 IMPACT REPORT USAID.GOV
Thus, in terms of power projects, Vietnam was also affected by COVID-19, similar to other countries where projects were delayed due to the impact of supply disruption and shortage of experts. Online discussions with experts and remote consultations were somewhat useful, but did not have the efficiency of onsite discussions.

USAID.GOV USAID V-LEEP COVID-19 IMPACT REPORT | 34
PART 4: VIETNAM POWER SECTOR’S RESPONSE TO COVID-19 The Vietnam power sector is a component of the national economy, under the management of the Government and the Ministry of Industry and Trade. The entities of Vietnam power sector also fall under the management of the People's Committee of the province/city where they are located. Therefore, the preparation and implementation of COVID-19 response activities in each sector entity is done based on the direction and guidance of the power sector and the local government.
Figure 14: Request for entities’ COVID-19 prevention and control measures
Source: V-LEEP project
4.1 WORKFORCE COVID-19 directly impacted the people who are essential for the operations of the electricity system. Therefore, it’s critical to have relevant response methods to protect these resources to ensure power system operations. This should be prioritized by the entities in the sector. The next section analyzes the response of the Vietnam power sector to the challenges and impacts of COVID-19.
Figure 15 displays some of the most important criteria related to maintaining human resources safety during a pandemic or other similar emergency, including:
• Identifying critical positions that must be prioritized for protection; • Personnel planning for these positions; • Ensuring the infrastructure for working online; and • Planning for foreign personnel.

35 | USAID V-LEEP COVID-19 IMPACT REPORT USAID.GOV
Most entities and agencies across Vietnam’s power sector fully implemented these criteria to ensure the sufficient human resources to cope with different scenarios in the context of COVID-19.
Figure 15: Implementation of criteria to maintain the sufficient workforce
Source: Survey data
Power entities and agencies set regulations on working procedures during COVID-19. They prepared a weekly work assignment schedule and set up appropriate document signing procedures. Leaders of functional departments typically assigned two key positions to separate working groups with leaders taking turns handling the work. Entities and agencies applied a rotational work schedule, enhanced their online working processes, and minimized the number of people working on-site.
For the operations team, on-site quarantine was required. That is, staff did not move from one place to another. Technology was applied for the shifts and direct contact was limited; unnecessary fieldtrips were limited as well. A department was in charge of rearranging the working regime for the operation team. The operations organization changed from 3 shifts/5 teams to 3 shifts/3 teams. The maintenance team worked in separate groups to ensure there were back-up personnel available in case one group had to be completely isolated. When there was not enough personnel to maintain safe and continuous production, appropriate staff would be transferred and assigned from other divisions.
All entities had on-site quarantine plans and implemented protective measures so that in the event of any infected case, back-up staff were available to operate the plant. Reasonable arrangements of staff schedules were applied for dispatch, operation of the telecommunications system, IT system, substations, regular maintenance, and fault recovery. If necessary, staff were provided with accommodation near the workplace. Teams were
50%
85%
100%
75%
83%
50%
85%
100% 100%
87%
75%
92%
100% 100%
93%
100%
92%
100% 100%97%
50%
62%
22%
75%
50%
Transmission Generation Distribution State managementagency
Total
Prepare a list of key/neccessary positions to be prioritized for protection during COVID-19
Prepare a HR plan for these positions in the event of impacts by COVID-19
Has an IT system in place to ensure the remote working mode for non-essential positions
Familiar with high-tech application for communication (virtual meeting/working/home-based/remote workingsoftwaresHave (or will have in the near future) foreign staff/experts

USAID.GOV USAID V-LEEP COVID-19 IMPACT REPORT | 36
separated in different accommodation areas to ensure their availability for back-up, replacement, and support among other teams.
Power entities and agencies deployed remote information system technology and infrastructure to enable remote work through the use of virtual meeting software, such as MS Team and Zoom. Entities and agencies also utilized internal networks and communication lines among member units, E-offices, and personal computers. This revamped IT system and relevant processes ensured that non-essential activities could be deployed online without affecting the general operation of the entities.
At the beginning of the pandemic when the online work modes were first introduced, many employees were unfamiliar with the technology. Therefore, entities actively provided trainings and issued instructions on the use of online systems. This training not only supported entities in the response period, but also improved the capacity of staff in order to apply technology to their work in the future.
Power entities and agencies also instituted distancing requirements, such as: re-arrangement of the working area and alternate working schedules to reduce the number of office users. Most of the entities and agencies interviewed said they had implemented alternate working schedules, some of them implemented both solutions simultaneously to increase flexibility in order to minimize impact on system performance.
Figure 16: Measures to meet the distancing requirements
Source: Survey data
4.1.1 EMERGENCY PLAN Developing tailored, scenario-based emergency plans for each entity to respond to COVID-19 brings many benefits, especially proactive and flexible implementation during different scenarios. Many power sector entities and agencies paid full attention to their initial COVID-19 emergency plans while also systematically and concurrently adapting them. The emergency plans were typically developed and deployed at the highest entity levels. Each subordinate unit was responsible for adjusting it to be relevant to its actual situation. Work regulations under COVID-19 were also developed and issued to ensure a safe, convenient and smooth working process during the pandemic.
9
22
2
Re-arrangement of the workspace Alternate on-site working mode No response

37 | USAID V-LEEP COVID-19 IMPACT REPORT USAID.GOV
Table 11: Emergency plan development indicators
NO. ITEM YES NO N/A
1 Develop an emergency plan for the entity/agency 27/30 2/30 1/30
2 The emergency plan is developed at the higher-level 25/30 3/30 2/30
3 The entity or its subordinate adjust the working regulations to be relevant with COVID 19 progress
24/30 4/30 2/30
Source: Survey data
Emergency plans are activated under specific conditions provided in the plan. These conditions can include: (i) as requested by superiors (GVN, line ministry, locality), (ii) in the event of infected persons, (iii) COVID-19 exposure, and community infections. The plan activation process depends on the characteristics of each entity/agency. For high-level entities, this process is proposed and activated by the COVID – 19 Steering Committee. Subordinate/member units then follow the procedure set out by their superiors.
Entities and agencies also instituted updated working regulations. Specifically, all units had to introduce disinfection, hand washing, body temperature check, and mask wearing procedures; regulations on office and work-from-home to ensure the isolation and/or distancing requirements; and regulations on fieldwork (such as restriction on business trips in pandemic areas).
Entities and agencies also developed detailed policies for confirmed and exposure cases. Based on survey data, 28 out of 30 entities and agencies had a policy of requiring F1 cases to actively seek a COVID-19 test. Entities and agencies have strictly followed the instructions of the Ministry of Health in the quarantine and reporting procedure for F0, F1, F2 cases:
• Notify health authorities and provide a list of exposed and potentially infected people;
• Follow quarantine and distancing regulations for infected people;
• Monitor exposed people and report to the medical authorities; and
• Carry out disinfection, if necessary, while still maintaining the production and business of the entity.
4.1.2 COVID-19 STATUS UPDATE Agencies and entities largely used the same methods of COVID-19 information collection and analysis in terms of information sources and the frequency of updates. Based on survey data, 19 out of 30 interviewees updated information daily and 11 entities updated information as soon as there were updates.
Figure 17: MOIT’s Action plan for responding to COVID-19

USAID.GOV USAID V-LEEP COVID-19 IMPACT REPORT | 38
Figure 18: Pandemic progress update frequency
Source: Survey data
Figure 19: Source of information for the pandemic update
Source: Survey data
The majority of entities and agencies interviewed (90 percent) received warnings about the disease; 83 percent monitored government regulations and the number of cases of infection, treatment, and cure; and 93 percent watched pandemic areas (Figure 20). The information was used to support activity planning and identify suitable solutions for each situation.
19
11
Daily Right after the new information isavailable
20
29
15
25
Government's e-Portal MOH's website WHO's website Direct guidance/directiveof the superior level in thedispatch communication
channel

39 | USAID V-LEEP COVID-19 IMPACT REPORT USAID.GOV
Figure 20: Content of the collected information
Source: Survey data
A majority of entities interviewed (93 percent) reported that they processed COVID-19 information before disseminated internally (Figure 21). Information was processed, summarized into diagrams for easy communication, and posted on media channels.
Figure 21: Pre-processing data before dissemination
Source: Survey data
Entities and agencies internally disseminated COVID-19 data through weekly and irregular meetings (in case of COVID-19 escalation) through the official information system
90,00
93,33
83,33
76,67
83,33
13,33
Warnings about thepandemic progress, areas
with infected cases,general regulations, etc.
Areas with infected cases,
Government's generalregulations
Number of infected cases,number of cases undertreatment, number of
recovered cases
Locations where infectedcases visited
Other
93%
4%
3%
Yes
No
No response

USAID.GOV USAID V-LEEP COVID-19 IMPACT REPORT | 40
(documents, website of the entity, email, SMS). Banners, bulletins, social networks, group chats were also used.
Figure 22: Updated information on COVID-19 spread
After the first wave of the COVID-19, entities and agencies continued to collect information about COVID-19, but at a reduced frequency. Only 55 percent of entities and agencies continued to update information daily; 39 percent of entities and agencies switched to weekly information updates.
Figure 23: Information update frequency after the peak period of COVID–19
Source: Survey data
4.1.3 IMPLEMENTATION MONITORING AND REPORTING Most of the entities and agencies supervised the implementation of COVID-19 response measures of subordinate units (86 percent) and reported to the superior entity on the implementation of COVID-19 response measures (89 percent). Some entities required immediate reporting of infected cases (F0) and periodic (daily) reporting of exposure cases (F1, F2).
The review and adjustment of documents issued before COVID-19 was only performed by 50 percent of the entities and agencies. Some agencies and entities issued new documents to be relevant to the actual situation without changing and adjusting the existing documents. Adjustments to documents were typically related to meter reading; inspection of the metering system; periodic replacement of metering equipment; revision of plans to be consistent with
55%39%
3%
3%
Daily
Weekly
Twice a week
Right after the newinformation is available

41 | USAID V-LEEP COVID-19 IMPACT REPORT USAID.GOV
disease prevention and control measures; modifications to service contracts (hiring experts, repairs, and supplies); and major repair plan adjustments. Additional documents were related to the strengthening of pandemic prevention and control, reviewing and supplementing plans and scenarios according to updated situations, and investigations into causes related to infected cases and people returning from the infected areas.
Figure 24: Reporting and monitoring of adjustments of entities during COVID–19
Source: Survey data
4.1.4 REPORTING MODE (STATE MANAGEMENT AGENCIES) Based on survey data, half of entities and agencies had assessed the impact of COVID-19 on the implementation of policies issued before the pandemic. All respondents said they had reported to GVN during COVID-19.
In general, the response of Vietnam power sector was quite similar to that of other countries. Vietnam’s experience further highlighted the important role of planning responses to external impacts, in general, and the impacts of COVID-19, in particular. Overall, Vietnam’s power sector entities and agencies performed this task well. They had appropriate implementation plans, especially in human resources, business continuity, and remote work. Using a modern IT infrastructure system, they have appropriately arranged personnel shifts and teams to reduce exposure and protect key staff (dispatchers and operators). Sector entities provided updated information in a systematic manner on the status of COVID-19 for the smooth information dissemination from the top-level down.
4.2 SERVICE CONTINUITY In addition to having suitable plans for production, transmission, and distribution of power, maintenance is also an important component for service continuity. This is applicable for generation units, line operation for transmission units, increased online activities, and reduced on-site activities of distribution units.
Maintenance is crucial for the efficiency of generator sets, and it is usually planned one year in advance. However, due to COVID-19, a number of generators (five out of 13 entities) had to adjust their maintenance plans due to delay in material supply, inability of experts to come
86% 89%
50%
4%
39%
11% 11% 11%
Monitor the subordinates'implementation of COVID-19
response measures
Report to the superiors on theimplementation of COVID-19
response measures
Review and revise documentsissued before COVID-19
Yes No No response

USAID.GOV USAID V-LEEP COVID-19 IMPACT REPORT | 42
to Vietnam as planned, and the quarantine period of 15 days for experts who travel to Vietnam. Some entities reported no change (seven out of 13). Some entities also made a list of essential generator sets (8 out of 13) and made maintenance a priority.
To maintain continuity in power transmission, transmission units always maintain staff on duty. This process continued during COVID-19. Specifically, units developed scenarios for each condition: (i) isolating the operation team at 500kV, 220kV substations during social distancing to ensure the health and safety of the direct workforce as well as safe, stable, and continuous operations of the power transmission system; and (ii) preparing a back-up team with members from the company's technical departments as well as at other power transmission stations that have not yet been isolated to maintain a sufficient team in case of emergency or infection.
For distribution units, increasing online operation is important given the regular and direct contact with large numbers of customers. To enable online activities, entities have deployed electronic meter installation and online service applications for the following services:
• New power supply from low voltage grid; • New power supply from the medium voltage grid; • Electricity bill payment; • Change in consumption power/change of one-phase/three-phase meter; • Change in the location of metering equipment, • Change in electricity use purposes; • Change in electricity use benchmark; • Change in power purchase agreement subject; • Change in registered information; • Change in electricity bill payment method; • Extension of power purchase agreement; and • Termination of power purchase agreement.
Although these activities had been initiated prior to the COVID-19 pandemic, they have been accelerated to strengthen the infrastructure system for contactless services.
Table 12: Roadmap for e-meter installation
No. Entity Roadmap for E-meter Installation 1 DISCO1 E-meters have been installed for 90 percent of the total number of
customers. This is expected to reach 100 percent by June 2021.
2 DISCO2 Develop e-meters according to the pre-COVID-19 plan.
3 DISCO3 From 2016-2020, e-meters made up 45 percent of the total number of e-meters (equivalent to 8.7 million meters). Plan for 100 percent in 2021-2025 with 10.4 million e-meters.
4 DISCO4 1,002,643 remote data collection e-meters have been installed, accounting for 38.96 percent of the total number of customers. This will reach 100 percent by 2021.
5 DISCO5 DISCO5 has installed 4,004,485 e-meters, accounting for 91.7 percent of the total number of customers; remote-metering rate accounted for 82 percent% of the total number of customers. Plan to deploy remote-reading collection system and technology including: RF Spider telemetry system, 3G/GPRS telemetry system, DSPM telemetry by industrial computer at 110 kV substation, and semi-automatic telemetry with HHU (Hand-held Unit) integrated with RF transmitter module.

43 | USAID V-LEEP COVID-19 IMPACT REPORT USAID.GOV
No. Entity Roadmap for E-meter Installation 6 DISCO2.1 Installed e-meters since 2013 according to the roadmap: first, e-meters shall
be installed in cities, towns and townships. So far, the total number of existing e-meters is about 135,000, accounting for 60 percent of the total meters (about 225,000 units).
7 DISCO3.1 Focus on successive e-meter installation in combination with COVID-19 prevention in areas at risk of impacts.
8 DISCO4.1 At the start of 2020, the Company began e-meter installation through 178 heads of hamlets and sent a notice to the local authority.
9 DISCO5.1 Focus on successive installation of e-meters in combination with COVID-19 prevention and control.
Source: Survey data
Table 13: Proportion of e-processing for request for services
No. Entity Content 1 DISCO1 Did not collect electricity bills by the traditional method. Electricity bill payment
was done via internet banking, or supermarket-counter.
2 DISCO2 Over 94 percent of customer submitted their requests through online channels.
3 DISCO3 Approximately 61.1 percent of the requests were received online via Customer Care Center (Web, Hotline, App, etc.) and 44.11 percent of services were provided electronically.
4 DISCO4 1,162,475 out of 1,162,502 requests from customers were received online; 11.6 percent of requests were received via the National Service Portal and 70.0 percent requests received via e-channels.
5 DISCO5 During the first seven months of 2020, the rate of e-processing for electricity service reached 78.33 percent and service requests on the national portal reached 39.13 percent.
6 DISCO2.1 During the first seven months of 2020, the Company provided electricity services through the national public service portal to 578 customers and by electronic means to 5,758 customers, accounting for 91 percent of total customer requests.
7 DISCO3.1 14,808 requests for service in areas managed by the unit were received online (41.6 percent).
8 DISCO4.1 As of July 2020, the online transaction rate was 99.99 percent.
9 DISCO5.1 By the end of June 2020, the rate of electronic transactions reached 76.87 percent; the rate of electricity services provided through the National Public Service Portal was 54.99 percent; the rate of electricity services performed through the Customer Care Center, the public service portal, was 98.23% percent; the rate of customers using electricity supply services via website/email/App/Zalo of the Customer Care Center reached 81.91 percent; and the rate of customers using online electricity service at level 4 reached 92.02 percent.
Source: Survey data
Based on survey data, eight of nine entities made a list of special consumption areas and households that needed to maintain electricity supply during COVID-19. These special consumers included hospitals, medical facilities, units producing basic necessities and materials for treatment (antibacterial mask-making facilities, etc.), centralized isolation areas, and field hospitals.

USAID.GOV USAID V-LEEP COVID-19 IMPACT REPORT | 44
For localities with centralized isolation areas or field hospitals, the power sector developed options for timely and sufficient power supply during COVID-19. Electricity was supplied through specialized stations or attached to the network with electrometers. The capacity of electrometers was increased in accordance with the load upon request by the local People's Committee, or the competent authority in charge of COVID-19 prevention. Backup generators were installed, and capacity of substation’s outgoing feeders were increased. Regional power grid operations were strengthened through increased inspection and supervision.
To best support the operation of the internal electricity systems of isolation areas and field hospitals the distribution companies prioritized issuing of spare parts and materials, means of transport, protective equipment and allocation of manpower to respond as expediently as possible to the events that may occur on the grid during an emergency. The application of the electricity tariff and the change in the purpose of electricity use in isolation areas and field hospitals have complied with state regulations.
The global experience shows that to provide electricity service continuity, it is necessary to pay attention to:
• People. Appropriate staffing for all operation scenarios • Infrastructure. Sufficient working and living conditions for essential teams and
adequate protective equipment • Information technology application. Enhancement of on-line interactions and
reduction of face-to-face activities.
Vietnam’s power sector has developed appropriate plans to fully meet these requirements. Therefore, during COVID-19, the Vietnamese power sector performed well in providing continuous electricity services to all customers, and in supporting the Government of Vietnam’s COVID-19 response and recovery.
4.3 BUSINESS AND PRODUCTION CONTINUITY
4.3.1 GENERAL ACTIVITIES Power sector entities require significant capital. Many of these entities have loans, including foreign currency loans. Exchange rate fluctuations during COVID-19, therefore, can have major implications. Of the 26 questioned entities, 11 said they had to pay interest on foreign currency loans and were affected by exchange rate fluctuations. To address this issue, entities often maintain reserve funds, attempt to reduce foreign currency loans, and estimate exchange rate fluctuations and impact from the start. Two out of 26 surveyed entities applied for incentives, tax payment extensions, and late payment interest exemptions under Official Letter 897/TCT-QLN.
4.3.2 PROJECT RELATED ACTIVITIES To address the delay of projects, entities have implemented a number of solutions, including:
Site Clearance. Hosting discussions with provincial authorities to improve flexibility in handling siting challenges. In provinces without infections, site clearance has been handled as usual. However, in provinces with infections, online meetings and reporting helped overcome these difficulties. Construction. After the pandemic became more contained, projects used overtime and increased personnel resources to accelerate construction progress. In locations

45 | USAID V-LEEP COVID-19 IMPACT REPORT USAID.GOV
where social distancing was required limiting the ability to work, equipment and human resources support were on standby for the work to be able to continue after social distancing had been terminated.
Materials and Equipment. Entities searched for other supply sources, replaced or temporarily borrowed from other entities as needed. They also transferred inventory among projects.
Foreign Experts: Entities increased online work or searched for local resources to replace foreign experts. Entities also changed method of goods acceptance testing for vendors in the North and Central regions to enable contactless delivery. Vendors shared documents and videos of testing prior to delivery. Once the vendor delivered the goods to the destination, acceptance testing could be conducted to shorten the process of goods verification and acceptance.
COVID-19 revealed numerous useful lessons for future projects when dealing with an emergency, such as a pandemic:
• Incorporate the pandemic considerations into project progress; • Provide internet access for online meetings with foreign experts in case of entry
restrictions; • Plan for specific scenarios to minimize the impact on project progress and quality; • Negotiate with investors to extend the schedule of electricity supply; • Negotiate with banks to reduce interest expenses in the event of natural disasters and
pandemics and incorporate disease risk into the contract; • Strengthen IT infrastructure for robust online connection with local authorities,
construction entities, and other related units; • Strengthen monitoring of contractor personnel to timely identify infections and avoid
unnecessary pandemic spread among staff and the community; • Develop a plan for material and equipment sourcing alternatives to minimize the
pandemic’s impact; and • Request that construction contractors implement pandemic prevention and control
measures to strictly comply with regulations and instructions of local authorities to ensure health safety in construction.
4.4 SUPPLY CHAIN Global coal markets were immediately impacted by COVID-19 given the unpredictable and global nature of the pandemic. Major coal suppliers, such as Australia, Russia, and South Africa, were significantly impacted, resulting in import restrictions and mixed coal supply. However, Vietnam was largely able maintain sufficient supply for thermal power plants under their contracts. Additionally, power sector entities developed plans to ensure other fuel supply sources. Other fuels, such as oil and gas, remained unaffected by COVID-19.
In order to be proactive in having sufficient supplies available for both for construction and O&M, entities often have a long-term plan for procurement. These forward-looking plans provide for an adequate supply of common types of equipment and materials. For special materials and equipment, such as control systems, entities faced more difficulties, but many were able to find alternative sources and solutions.
For consumable materials and new equipment for construction and investment, 80 percent of surveyed entities reported facing supply challenges. To overcome this problem, they urged the material supplier to speed up production and supply, especially for imported goods.

USAID.GOV USAID V-LEEP COVID-19 IMPACT REPORT | 46
Investors and suppliers also negotiated and agreed to extend the delivery schedule to account for the pandemic.
In general, contingency procurement plans during COVID-19 did not differ from previous procurement plans as these plans are normally developed at least one year in advance. Most entities maintain a list of essential materials that are prioritized for procurement according to the approved norms and budget. For example, wind turbines are essential items for wind power plants. Conventional materials and equipment that have many suppliers are procured through competitive bidding processes. Specialized equipment, such as turbines, is usually provided by only one supplier. Newly purchased spare parts and accessories must synchronize with the existing plant equipment.
Most of these materials and equipment can be supplied by domestic suppliers, but some of the equipment and components are subject to international bidding, such as electricity insulation equipment, transformers, capacitors, resistors, generators, relays, steam generator tubes, specific equipment of turbines, boilers, breakers, isolators, current transformers, voltage transformers, and insulators for 220kV and 500 kV transmission lines.
Table 14: Material and equipment supply indicators
No. Item Yes No N/A
1 Does the entity have a list of essential materials that are prioritized for procurement?
13/26 12/26 1/26
2 Is the procurement plan for contingency supplies for COVID-19 different than in normal circumstances?
3/26 18/26 5/26
3 Does the entity intend to establish alternative suppliers? 6/26 16/26 4/26
4 Does the supply problem affect the ability to ensure future electricity supply during COVID-19?
8/26 18/26 2/26
5 Has the inventory of consumable materials been depleted during COVID-19 causing a negative impact on the continuity of production and business?
2/26 24/26 2/26
Source: Survey data
4.5 CUSTOMER CARE Entities implemented electricity tariff reductions and electricity bill reductions for customers in accordance with instructions outlined in MOIT’s Official Letter No. 2698/BCT-DTĐL dated April 16, 2020. This letter reduced the electricity tariff bills for consumers affected by COVID-19, including manufacturing and business industries, residential consumers, tourist accommodation establishments, rural electricity wholesalers, electricity wholesalers of collective and residential areas, wholesalers of shopping-service-residential complexes, industrial zone electricity wholesalers, and wholesalers of electricity for the market. Utilities also reduced the pre-tax electricity bills directly for facilities serving COVID-19 pandemic prevention and control. Entities prioritized power supply for hospitals and COVID-19 medical isolation facilities. Entities maintained stable power supply and availability of staff for 24/7 operations.
During social distancing, communication and information dissemination were conducted in a timely manner. Entities promoted the use of online electricity services requests, so consumers did not need to leave their homes to receive needed electricity services. Electricity bill payment

47 | USAID V-LEEP COVID-19 IMPACT REPORT USAID.GOV
was re-scheduled and extended. Pandemic prevention measures were applied to the electricity bill payment process.
Entities did not suspend electricity services for customers with overdue bills during the social distancing period. Particular units monitored overdue payments debts every day, collecting statistics on consumers and areas with payments overdue 15+ days. Entities read meters two-three times per month to avoid large cumulative collections at the end of the month. Distribution companies classified consumers most likely to have late payment due to the pandemic to avoid widespread late payments across a geographical area. They also closely monitored their geographies and consumers, regularly exchanged information, and sent early bill notifications to consumers.
Agencies and entities largely utilized information technology for communication with consumers by assigning customer care staff, telephone operators experienced in IP phones, CRM, AACC software, etc. These measures helped to timely address, accurately respond, and handle inquiries from consumers while providing a stable technical connection. Entities received requests via communication channels of the National Public Service Portal, Internet (Customer care website/App/Email/Zalo, etc.) and the customer hotline. Entities promoted e-payment via banks, mobile apps and applied technology to collect data remotely to record meter readings.
Like many countries around the world, Vietnam provided temporary relief to electricity customers affected by COVID-19 through payment extensions and continued supply. This act, announced by MOIT in April 2020, brought significant relief to consumers while also strengthening the relationship between consumers and power supply units. Vietnam’s power entities continued to persuade customers to pay if they were able. Agencies in the power sector also enhanced their online services to improve convenience, reduce touchpoints, and improve safety for consumers during the pandemic.
4.6 GENERAL ASSESSMENT
4.6.1 DIFFICULTIES IMPOSED BY COVID-19 FOR VIETNAM POWER SECTOR COVID-19 has caused several common difficulties for power entities and agencies in terms of human resources, equipment, communication, etc. Entities also often encountered challenges related to project implementation (compensation, sight clearances, etc.) These common challenges include the following:
• Three out of 30 interviewed entities and agencies (10 percent) had difficulty in "receiving and sending related information (mode of delivery and receipt of traditional documents was interrupted or delayed)"
• Nine out of 30 interviewed entities and agencies (30 percent) had difficulty in human resource availability due to “quarantine or the impact of school closure (not enough employees to perform the direct work, employees must be isolated or had to support the family when the children cannot go to school)”
• 13 out of 30 interviewed entities and agencies (43 percent) had difficulty in “changing the work mode from onsite to online (lack of online tools to conduct meetings or not familiar with online tools)"
• Four out of 30 interviewed entities and agencies (13 percent) had difficulty in “changing the mode of operation, system control from manual to automatic control or lack of remote operation and control modes"

USAID.GOV USAID V-LEEP COVID-19 IMPACT REPORT | 48
• 15 out of 30 interviewed entities and agencies (50 percent) had difficulty with the availability of the hardware due to “lack of necessary equipment (laptop, printer, scanner, etc.) to be able to work from home efficiently during isolation or family support.
• Five out of 30 interviewed entities and agencies (17 percent) had difficulty in updating information due to “interruption of updating information related to production and business activities from the field (meter readings, construction monitoring and inspection, acceptance of works)”
• Eight out of 30 interviewed entities and agencies (27 percent) had difficulty in "accessing consumers to collect electricity bills in the traditional way"
• 11 out of 30 interviewed entities and agencies (37 percent) had difficulty in collecting electricity bills as “consumers could not pay their electricity bills because their production and business activities were affected by COVID- 19”
• Six out of 30 interviewed entities and agencies (20 percent) had difficulty in material supply due to "lack of supplies and spare parts for maintenance activities or equipment components for new construction"
• Nine out of 26 interviewed entities and agencies (35 percent) had difficulties in the payment of bank interest for loans for production and business activities.
Some entities and agencies cover a wide geographic area of operation and some have offices in many locations. This makes communications and operations difficult. Foreign-investor companies required information in both English and Vietnamese, which required time for translation. However, only three out of 30 entities and agencies interviewed (10 percent) had difficulties in internal communication; 26 entities and agencies did not have problems (one agency did not respond). External communication difficulties were mainly related to unstable connection quality, which affected audio and video quality or translation.
4.6.2 ADVANTAGES RELATED TO COVID-19 Prior to COVID-19, Vietnam’s power system was developing at a high speed to meet the growth electricity demands of socio-economic activities. From 2011-2019, Vietnam experienced an annual load growth rate of 10 percent. This was expected to remain at 8 percent until 2030. With this expected load growth to ensure a safe and efficient power supply, Vietnam needed to install an additional capacity of 5000 - 6000 MW per year. However, COVID-19 has impacted socio-economic activities, thereby reducing electricity demand. This has reduced the immediate pressure to replenish power sources that were to be upgraded or replaced. Decision 3733/QD-BCT, which approved power system and market operations for 2020, predicted that the system needed to mobilize 3.4 billion kWh of electricity from oil sources (an expensive source) to meet demand. By the end of September 2020, the system only needed to mobilize 1.04 billion kWh from oil.
Implementing generation projects as per the revised PDP7 has been challenging. The booming development of renewable energy sources, although increasingly contributing to the power supply, still face many constraints in grid integration, especially related to transmission overload in specific areas. COVID-19 had major impacts on the investment and construction activities of renewable energy projects, slowing down their progress. As a result, the reduction in electricity demand also provides opportunities to better prepare for integration of variable RE resources into the transmission and distribution system.
COVID-19 response measures required the power sector to have more modern equipment to enable various modes of operation, control, management, and transactions via online channels and tools to minimize in-person interactions. Power sector entities were largely able to handle these new requirements, but they should continue to focus on infrastructure modernization, the application of modern technologies, and industry 4.0.

49 | USAID V-LEEP COVID-19 IMPACT REPORT USAID.GOV
Along with the rest of the country, the power sector has responded effectively to COVID-19, demonstrating its ability to rapidly address the challenges presented by the pandemic. The power sector was already attracting major foreign investment, but the successful handling of COVID-19 further enhances Vietnam’s position as a ripe destination for FDI. Direct investment in the power sector or tangentially in other economic sectors will both create opportunities for Vietnam’s power industry.

USAID.GOV USAID V-LEEP COVID-19 IMPACT REPORT | 50
PART 5: KEY FINDINGS AND RECOMMENDATIONS
5.1 KEY FINDINGS COVID-19 has impacted all facets of the power sector—from production and business performance to the assurance of continuous power supply to different sectors in the economy and activities of social life. Some of the major impacts on Vietnam’s power sector, include:
• The change in electricity demand of different consumers has shifted the load from production and business sectors to residential areas. Some industries were strongly affected. As a result, electricity demand did not increase to the extent expected, although there was still an increase compared to the same period in 2019.
• In the production and business plans at the beginning of 2020, targets assigned to power sector entities all related to electricity sales (electricity production for generation, transmitted electricity for the transmission entities, commercial electricity for the distribution entities, etc.). Therefore, when national demand for electricity consumption decreased due to COVID-19, all power sector entities ended up with lower revenues and profits. The one exception was renewable energy projects.
• Ongoing projects have largely been affected due to supply chain interruptions for materials and equipment as well as a lack of foreign experts. Although entities have addressed some of these issues by increasing exchanges via email, online communications, or video recordings, efficiency has not reached pre-pandemic levels when on-site communications were the norm.
Given these COVID-19 difficulties, the power sector designed and implemented response plans related to human resource preparation, planning, and infrastructure. These were concurrently implemented by the Ministry and management agencies (corporate to subordinate) entities, to ensure sufficient, stable, adequate, and reliable power supply.
5.2 RECOMMENDATIONS This section suggests seven key recommendations for Vietnam’s power sector entities and agencies to deal with future waves of COVID-19 and other pandemics or related national emergencies.
5.2.1 STAY ALERT TO CHANGES IN COVID-19 RESPONSE AND RECOVERY SITUATION This recommendation applies to all entities in the power sector.
As the rapidly evolving and irregular COVID-19 situation over the last year has demonstrated, it is essential to be prepared to respond immediately to epidemic threats. The 1,000+ cases that appeared in Stage 4 showed that more virulent COVID-19 variants can always re-emerge and flare up at any time. The COVID-19 response and global recovery situation shows that the threats assessed in this report will continue in 2021. Therefore, Vietnam power sector needs to maintain a high level of vigilance on COVID-19 situational awareness, and promptly respond to the risks of outbreaks in regions and cities by activating the appropriate response plans.

51 | USAID V-LEEP COVID-19 IMPACT REPORT USAID.GOV
5.2.2 PROVIDE ADDITIONAL EQUIPMENT AND INCREASED TRAINING ON THE APPLICATION OF INFORMATION TECHNOLOGY
Application: This recommendation applies to all entities and agencies in the power sector. However, since state budget resources must be allocated in advance, these agencies should focus on reviewing and implementing planning activities.
For the state management agencies, provision of additional equipment and training for application of information technology is of the most importance. Traditional activities that require in-person human interaction should be minimized whenever possible. Application of information technology guarantees better safety while also improving efficiency in work. Systems for sending and receiving documents, meeting and communicating online, and monitoring construction activities in the field have all been implemented very effectively throughout COVID-19 by entities and agencies in the power sector. However, for the state management agencies, the biggest challenge comes from the limited financial resources available for equipment related to online work as well as the difficulty in organizing online working skills training. In the future, entities should prioritize:
• Developing and issuing work procedures under the new circumstances, including procedures related to epidemic safety.
• Establishing working schedules for the following year by considering the possibility of epidemic reoccurrence and financial implications.
• Accelerating the construction of infrastructure by strengthening online service systems to ensure business continuity in case of quarantine or isolation due to epidemics.
• Enhancing the training of human resources to adapt to new normal conditions, to understand and use equipment proficiently, and to maximize application information technology in the workplace.
5.2.3 CONTINUE TO FOCUS ON SAFETY OF OPERATIONS AND SCHEDULING OF TEAMWORK Application: This recommendation applies to electricity generation, transmission and distribution units.
Power plant operators should continue to update standard operating procedures and emergency plans based on the evolving response plans for COVID-19 or similar events. With the goal of safe and stable power supply, operators must first be safe to operate the systems stably and efficiently. During COVID-19, operators in all entities were given protection priority by isolation in their work areas. Some entities adopted a three-shift and five-team model in which one team was externally isolated and served as a backup. This is a good practice to ensure safety. Other alternatives, such as increasing shift hours or using one of the four teams to be backup and applying only three shifts and three teams, are not feasible in the case of a prolonged COVID-19 type of emergency. In the future, entities should prioritize:
• Developing and issuing work procedures under the new circumstances, including procedures related to epidemic safety.
• Maintaining different human resource plans for varying epidemic scenarios. • Planning for securing alternative supply of fuels and materials in different epidemic
scenarios. • Planning for construction of infrastructure to ensure independent working environment
for the operating units and prevent infection from external sources in case of the epidemic returning.

USAID.GOV USAID V-LEEP COVID-19 IMPACT REPORT | 52
• Implementing constant reminders to raise awareness and to prevent negligence in preventing epidemics.
5.2.4 ENHANCE ONLINE IMPLEMENTATION OF PUBLIC SERVICES Application: This recommendation applies for electricity distribution units and state management agencies.
Good practices for power corporations or provincial power companies include the implementation of e-meter installations, non-cash electricity bill payment, and customer care activities through online channels. These solutions should be further promoted because they bring double benefits to power distribution units – they contribute to preventing and combating COVID-19 (and other pandemics) while also modernizing equipment, improving transparency, and enhancing management capacity. In the future, entities should prioritize:
• Accelerating plans for the installation of e-meters, non-cash electricity bill payments, and customer care activities through online channels.
• Building infrastructure that utilizes the benefits of information technology. • Establishing working schedules for the following year by considering the possibility of
epidemic reoccurrence and financial implications. • Planning for securing alternative supply of fuels and materials in different epidemic
scenarios. • Increasing training in online work platforms to improve staff proficiency.
5.2.5 DEVELOP ADEQUATE AND SECURE SUPPLY CHAIN FOR TRANSMISSION MAINTENANCE IS KEY FOR SAFE AND STABLE OPERATIONS
Application: This recommendation applies mainly to units performing construction investment activities, especially those related to new power sources and grid projects.
In the past few years, new power source construction projects have been mainly solar and wind projects. These two project types are popular because of the Feed-in-tariff, so ensuring the rate of energy supply is considered a vital factor of the project. COVID-19 has disrupted the equipment supply chain for these projects, which could negatively affect and delay the energy supply process. Investors must be flexible and choose suitable suppliers to minimize the impact of COVID-19 on implementation progress. In addition to sourcing equipment and meeting delivery schedule, units should also consider the advantages and disadvantages of bringing their brand experts to Vietnam to supervise installation, operate trials, and confirm completion.
For transmission units, adequate maintenance and safe and stable operation of the existing transmission system should be of the utmost importance. Ensuring adequate supplies and equipment for the maintenance of the transmission system should be a top priority. Given the nature of transmission operations, procurement of these materials should consider large volumes and be more flexible to enable materials to be transferred to units in need, if a supply disruption occurs. More detailed recommendations for these entities include:
• Developing and issuing work procedures under the new circumstances, including procedures related to epidemic safety.
• Maintaining different human resource plans for varying epidemic scenarios. • Planning for securing alternative supply of fuels and materials in different epidemic
scenarios.

53 | USAID V-LEEP COVID-19 IMPACT REPORT USAID.GOV
5.2.6 CONSIDER OPTIONS TO INCREASE LOCAL TECHNICAL SUPPORT TO REPLACE FOREIGN EXPERTS
Application: This recommendation applies to all entities and agencies in the power sector.
Many technical O&M issues could be addressed by locally available experts in Vietnam (mostly Vietnamese), rather than relying on outside experts. The pandemic has exposed a weakness in the warranty and O&M contracts, which rely on foreign experts to be physically present in Vietnam. During COVID-19, foreign experts were largely unable to come to Vietnam for many reasons, e.g., not being able to apply for a work permit, lack of commercial flights to Vietnam, or no agreement on costs for the 14-day compulsory quarantine. Detailed recommendations include:
• Including contingency terms in future warranty/O&M contracts to reduce dependence on foreign experts.
• Negotiating performance contracts to have flexibly to use domestic experts to reduce the impact on operations.
• Coordinating contract implementation to optimize the presence of foreign experts for multiple contracts if there are multiple contracts with the same firm that require the participation of foreign experts.
5.2.7 FLEXIBLY ADJUST PLAN FOR MAINTENANCE AND REPLACEMENT OF EQUIPMENT Application: This recommendation applies to electricity generation, transmission and distribution units.
Many units develop plans for scheduled maintenance based on calendar dates. Normally, this is appropriate and effective. However, in 2020 COVID-19 made this impractical; it would’ve been more helpful to be able to have the flexibility to adjust maintenance plans. Many entities ended up adjusting their plans, but this was mostly due to force majeure when foreign experts couldn’t come to Vietnam or when supply contracts couldn’t be executed in accordance with the planned schedule. Evaluation after adjusting the schedule of the maintenance plans has shown that there has been no impact on the performance or safety of operation. This suggests that units should consider flexibly adjusting their maintenance plans.

USAID.GOV USAID V-LEEP COVID-19 IMPACT REPORT | 54
REFERENCES 1. EVN (2020), EVN’s press release: Assessment of power supply in the last 4 months of 2020 and a preliminary outlook in 2021; Retrieved in December 2020 from http://npc.com.vn/View/tabid/56/id/19280/Default.aspx
2. EVN (2020), Annual Reports
3. General Statistics Office of Vietnam (2020), Statistics Data
4. USAID - VLEEP (2020), Global COVID-19 Impact Assessment Report on Power Sector and International Best Practices to Mitigate Impacts
5. GSO (2020), Survey results on assessing the impact of Covid-19 to production and business activities of Vietnamese enterprises
6. Mistry of Health, Dashboard for COVID-19 statistics. Retrieved in December 2020 from https://COVID-19.moh.gov.vn/
7. Ministry of Industry and Trade - MOIT (2020), Dashboard for COVID-19 statistics. Retrieved in December 2020 from https:// hanhdong.moit.gov.vn
8. Ministry of Industry and Trade - MOIT (2020), Minister of MOIT’s respond to Deputy Phan Thi Bich Thuan from HCMC
9. Nguyen Vu (2020), How does Covid-19 impact Vietnam's economy. Retrieved in December 2020 from <https://baodautu.vn/covid-19-tac-dong-den-kinh-te-viet-nam-the-nao-d121405.html>
10. V-LEEP project data
11. Water management Department, MONRE (2020), Forecasted that there will floods and rains but the amount of water flowing to hydropower reservoir is still very low
12. Xuan Tien (2020) How does COVID-19 affect the electricity supply in the coming hot season? Retrieved in December 2020 from <https://www.evn.com.vn/d6/news/Dich-COVID-19-anh-huong-the-nao-toi-tinh-hinh-cung-cap-dien-mua-nang-nong-sap-den-6-12-25448.aspx>


![Apocalipsis Revisado LEEP[1]Final Copy 2](https://static.fdocuments.in/doc/165x107/577c79831a28abe05492f5b1/apocalipsis-revisado-leep1final-copy-2.jpg)


