USAID- DRDF Dairy Projectpdf.usaid.gov/pdf_docs/PA00MH9K.pdf · · 2017-01-13Reasons for...
58
End-line Survey of Extension Phase USAID- DRDF Dairy Project Final Report January, 2017 Prepared By Sustainable Solutions (Pvt.) Ltd.
Transcript of USAID- DRDF Dairy Projectpdf.usaid.gov/pdf_docs/PA00MH9K.pdf · · 2017-01-13Reasons for...

`
End-line Survey of Extension Phase USAID- DRDF Dairy Project
Final Report
January, 2017
Prepared By
Sustainable Solutions (Pvt.) Ltd.
List of Acronyms
AIT Artificial Insemination Technician
AI Artificial Insemination
BZU Bahawaddin Zakrya University
DRDF Dairy and Rural Development Project
FGD Focus Group Discussion
KII Key Informant Interviews
KG Kilogram
HH Household
NGO Non-Government Organization
USAID United State Agency for International Development
UVAS University of Veterinary and Animal Sciences
WLEW Women Livestock Extension Workers

Table of Contents EXECUTIVE SUMARY ............................................................................... 1
1. INTRODUCTION & BACKGROUND ............................................... 5
2. OBJECTIVE & SCOPE OF WORK ................................................... 5
2.1. Objective ........................................................................................... 5
2.2. Scope of Work ..................................................................................... 6
3. METHODOLOGY ....................................................................... 6
3.1. Sampling ............................................................................................ 6
3.2. Instrument Development .......................................................................... 7
4. SURVEY EXECUTION ................................................................. 8
4.1. Field Team Training ......................................................................... 8
4.2. Field Team Deployment and Data Collection .............................................. 8
4.3. Data Validation .............................................................................. 9
4.4. Data Processing / Cleaning ................................................................. 9
4.5. Data Analysis - Report ...................................................................... 9
5. FINDINGS ................................................................................ 10
5.1. Women Livestock Extension Workers (WLEWs)........................................ 10
5.1.1. Respondent Level of Education ...................................................... 10
5.1.2. Respondent Marital Status and age ................................................. 11
5.1.3. Respondent Household Income ...................................................... 11
5.1.4. Distribution of Workers’ Household Income ....................................... 12
5.1.5. Respondent Contribution to Household Income ................................... 12
5.1.6. Possession of Productive Assets ..................................................... 13
5.1.7. Possession of General Assets ......................................................... 14
5.1.8. Workers Household Debt ............................................................. 14
5.1.9. Distribution of Household Expense .................................................. 15
5.1.10. Knowledge of Animals and Diseases ................................................ 16
5.1.11. Training Received by Workers ...................................................... 16
5.1.12. Knowledge of Farm Animal Feed & Nutrition Requirement .................... 16
5.1.13. Knowledge about Farmers Possessing Livestock .................................. 17
5.1.14. Family Issues and Challenges ........................................................ 17
5.1.15. Selling of Animal Feed to Farmers ................................................. 19
5.1.16. Extension Service Outreach ......................................................... 19
5.1.17. Linkages with Suppliers .............................................................. 19
5.1.18. Book Keeping and Business Training ............................................... 20
5.1.19. Treatment of Animals ................................................................ 20
Conclusion/Recommendations ................................................................. 21
5.2. Artificial Insemination Technicians ........................................................ 22
5.2.1. Level of Education ..................................................................... 22
5.2.2. Age Group and Marital Status ........................................................ 22
5.2.3. Household Productive Assets ......................................................... 23
5.2.4. Household General Assets ............................................................ 24
5.2.5. AITs Household Debt .................................................................. 24

5.2.6. Distribution of Household Expense .................................................. 24
5.2.7. Household Income and AIT’s Contribution ......................................... 25
5.2.8. Increase in HH income and Economic Security .................................... 25
5.2.9. Knowledge of Breeding of Animals .................................................. 26
5.2.10. Livelihood Training Received by AITs .............................................. 26
5.2.11. AI Reach ................................................................................ 26
5.2.12. AI Services and Monthly Income .................................................... 28
5.3. Farmers............................................................................................ 30
5.2.13. Farmer’s Level of Education ........................................................ 30
5.2.14. Marital Status, age group and family size ......................................... 30
5.2.15. Possession of Productive Assets ..................................................... 31
5.2.16. Possession of General Assets ........................................................ 31
5.2.17. Farmers and Household Debt........................................................ 32
5.2.18. Distribution of Household Expense ................................................. 32
5.2.19. Contribution of Respondent to Monthly HH Income ............................. 33
5.2.20. Household’s Perceived Economic Conditions ..................................... 33
5.2.21. Household’s Nutritional Status ...................................................... 34
5.2.22. Land Ownership (Acres) .............................................................. 34
5.2.23. Ownership of Animal Breed ......................................................... 34
5.2.24. Monthly Income from Farmer’ Livelihood Activities ............................. 36
5.2.25. Fodder Used ........................................................................... 37
5.2.26. Knowledge of Animal’s Nutrition Requirement ................................... 37
5.2.27. Facilities Available for Basic health of Farm Animals ........................... 38
5.2.28. Livestock Common Diseases ......................................................... 38
5.2.29. Breeding Practices .................................................................... 38
5.2.30. AIT Service Availability .............................................................. 39
5.2.31. Satisfaction with the Animal Health Services ..................................... 39
5.2.32. Satisfaction with the Breeding Services ........................................... 40
5.2.33. Knowledge and Use of Farm Practices ............................................. 40
5.2.34. Reasons for Farmers’ Inability to Use Farming Practices ....................... 41
5.2.35. Services of Silage Making ............................................................ 42
5.2.36. Increase in Income after Dairy Project Training ................................. 42
5.2.37. Dairy Project Information to Farmers .............................................. 43
5.2.38. Follow Up Meetings ................................................................... 44
Conclusion and Recommendations ............................................................. 45
6. Learning from Dairy Development Project ........................................ 47
Annex 1: Participants of FGDs ..................................................................... 51

List of Tables
Table 1 Endline Sample for data collection............................................................................................. 7
Table 2: Details of KIIs conducted .......................................................................................................... 7
Table 3: Education Level of Respondents ............................................................................................. 11
Table 4: Respondent age category and marital status .......................................................................... 11
Table 5 Workers HH income segregated by income source .............................................................. 12
Table 6 Distribution of HH income ...................................................................................................... 12
Table 7: Respondent Contribution to HH Income .............................................................................. 13
Table 8 Possession of HH productive assets ........................................................................................ 13
Table 9: Possession of General Assets ................................................................................................. 14
Table 10: Debt and ability to repayment .............................................................................................. 14
Table 11 Knowledge level of respondent regarding basic animal health .............................................. 16
Table 12: Level of knowledge of workers about diseases in farm animals........................................... 16
Table 13: Knowledge of animal feed ..................................................................................................... 17
Table 14: Family Issues/challenges faced by workers ........................................................................... 18
Table 15 Problems Faced by Workers ................................................................................................. 18
Table 16: Animal Feed Being Sold by Workers .................................................................................... 19
Table 17 Extension services reach ........................................................................................................ 19
Table 18Workers- Business and book keeping training ....................................................................... 20
Table 19 Disease Treatment and Monthly Income .............................................................................. 21
Table 20: Level of Education of AITs .................................................................................................... 22
Table 21 Respondent age categories .................................................................................................... 23
Table 22: average number of HH members by age .............................................................................. 23
Table 23: HH Productive Assets........................................................................................................... 23
Table 24: Percent Responses regarding possession of general assets .................................................. 24
Table 25: Household Debt and ability to repayment ........................................................................... 24
Table 26: Distribution of household expanse ....................................................................................... 25
Table 27: HH monthly income and contribution of respondent (multiple responses) ........................ 25
Table 28: AIT's knowledge of type of semen ....................................................................................... 26
Table 29: AI Reach in villages ................................................................................................................ 27
Table 30: Average number of farmers with AI outreach ..................................................................... 27
Table 31: Success ratio of pregnancy in inseminated animals .............................................................. 27
Table 32: AIT's practices of applying imported semen and income ..................................................... 28
Table 33: AITs' using local semen and monthly income ....................................................................... 28
Table 34: AIT's services of pregnancy test ........................................................................................... 29
Table 35: Farmers level of education .................................................................................................... 30
Table 36: Distribution of farmers by age group ................................................................................... 31
Table 37: Farmers' possession HH productive assets .......................................................................... 31
Table 38: Farmers having debt .............................................................................................................. 32
Table 39: Farmers: Contribution to monthly income .......................................................................... 33
Table 40: Farmers- HH Nutritional status ............................................................................................ 34
Table 41: Farmers – Cultivated average agriculture land ..................................................................... 34
Table 42: Farmer - farm animal ownership (percentage Responses) ................................................... 35
Table 43: Farmers - farm animals segregated by sex ............................................................................ 35

Table 44: Farmers - Status on Milking and Dry Animals ...................................................................... 36
Table 45: Farmer - production and income of dairy and agriculture ................................................... 36
Table 46: Farmers – use of fodder ....................................................................................................... 37
Table 47: Facilities of basic health of farm animals (multi responses) .................................................. 38
Table 48: Farmer- satisfaction on animal health services ..................................................................... 40
Table 49: Farmer- satisfaction with breeding services ......................................................................... 40
Table 50: Farmer-knowledge of farm practices .................................................................................... 41
Table 51: Farmers - inability to follow farm practices .......................................................................... 41
Table 52: Farmer - silage making practice ............................................................................................ 42
Table 53: Farmer - change in income ................................................................................................... 42
Table 54: Farmer - DRDF follow -up meetings .................................................................................... 44
List of Figures Figure 1: Increase in workers' income .................................................................................................. 13
Figure 2: Average distribution of expense ............................................................................................ 15
Figure 3: Percentage distribution of income on HH expenses ............................................................. 15
Figure 4: Farmers HH possession of general assets ............................................................................. 32
Figure 5: Farmers: Distribution of HH expense in percentages ........................................................... 33
Figure 6: Farmers Knowledge of animal nutrient ................................................................................. 38
Figure 7: Farmer -breeding approaches in use ..................................................................................... 39
Figure 8: Farmer - availability of AI services ......................................................................................... 39
Figure 9: Farmer - Change in income after training ............................................................................. 43
Figure 10: Farmer - medium used for information ............................................................................... 44

End line Survey of Dairy Project
Page 1 of 58
EXECUTIVE SUMARY
The public, private, industrial and international development sector has been active in improving the
potential of the dairy and livestock sector in Pakistan. USAID has been highly instrumental in supporting
projects for bringing in a positive change in people’s lives. The Dairy project has been highly successful
in doing so for thousands of farmers, Artificial Insemination Technicians and Women Livestock
Extension Workers.
The project entered into an extension phase from October 2014- October 2016. A baseline had been
conducted for setting benchmarks on a set of variables. In order to document changes, as a result of
input provided by the extension project and in comparison with benchmarked values set during
baseline, this end line survey has been conducted.
The sample of a total of 827 population size was taken for this end line Survey which includes 560
farmers, 148 AIT’s and 119 Women Live Stock Extension Workers (WLEWs) in 5 district of Punjab
as follows.
a) Lodhran
b) Khanewal
c) Multan
d) Vehari
e) Bahawalpur
Challenges faced during the survey
Although a considerable focus was placed on equipping data enumerators with in-depth understanding
of questions as well as probing techniques during training, however, the quality of the responses to a
number of questions was dependent on the skills of the data enumerators. Furthermore, the
consultant during data collection provided clear instruction and orientation on techniques of getting
accurate information; nevertheless, some enumeration errors cannot be ruled out in the field.
Data enumerators encountered challenges as the randomly sampled beneficiaries were sparsely spread
out in the districts causing major logistical issues. The vast geographic spread of the beneficiaries’
village locations rendered the transportation arrangements made for data collection (i.e. one car for
each district) insufficient, causing problems in data collection and efficiency. In addition, many of
beneficiaries couldn’t be found easily as their phones remained unanswered. As a result, planned
schedule of data collection had to be revisited, which increased the timeline in data collection.

End line Survey of Dairy Project
Page 2 of 58
Findings
Women Livestock Extension Workers
1) More than one third of WLEWs (36.1%) have completed high school and almost same
proportion of WLEWs reported to have completed middle level education. This indicates an
improved level of qualification of workers in comparison to baseline trends where 89%
reported completing middle level education.
2) The average household monthly income of the WLEWs is Rs. 22,000. It is evident that income
of household has slightly improved as compared to the baseline average HH income of Rs.
17,000. Income earned by workers through providing extension services together with jobs
and businesses in family are the main contributor to HH income which amounts to 45%.. This
is in contrast to baseline finding where main source of HH income was agriculture, amounting
to 39% of HH income. The increase in income is evdience of earning through the services
provided to farmers after acquired skills through project intervention.
3) A relatively small proportion i.e. 29% of the consulted workers have acquired debt. Of these,
57% are confident that they are able to repay the debt amount on a regular basis.
4) Almost all of workers consulted for the survey reported having different level of knowledge
about animal husbandry. Nearly 60% said that they have moderate to high level knowledge,
which is much higher than the average level of knowledge reported during baseline. During
baseline around 80% respondents reported basic level or no knowledge at all about animal
husbandry.
5) Data indicates that majority of workers possess knowledge about types of animal feed. More
than half of the workers (55.4%) said that they have high-level of knowledge regarding Vanda
and 38% believed that they have high-level of knowledge regarding fodder,and majority i.e.
62% said that they have moderate knowledge of fodder. Same proportion reported moderate
level knowledge about silage. It is evident from the data that workers’ knowledge has
considerably improved as compared to baseline data where majority (i.e. 80%) reported to
have basic level of knowledge about animal feed.
6) On average, each worker provides extension services to 75 farmers which account for 33%
of total estimated farmers in 3 villages in a month.
7) More than half of workers treat animals with diseases including tympani, indigestion,
diarrhoea and parasitic infestation.
8) Extension workers reported problems and issues affecting their work including
communities’ lack of willingness to consider women’s work as favourable, reluctance
of farmers to pay their remuneration for their services in the presence of public sector
veterinary staff providing similar services free of cost.These factors have a negative
bearing on their work.
Artificial Insemination Technicians
1) About 54.8% of the consulted AITs have completed high school and 41.9% have
completed intermediate. Only 3% have received education up to the graduation
level. None of the respondents are below middle school level of education.
End line Survey of Dairy Project
Page 3 of 58
2) Less than half (47 %) of the respondents are married. The average age of the
consulted AITs is 27 years. A fair majority (65.5%) of the respondents are between
20 to 29 years of age, followed by 25% AITs who fall in 30-39 years age group.
3) The average monthly household income of the consulted AITs is Rs. 29,776, indicating
a noticeable increase in household income compared to the income reported in
baseline (i.e. Rs 21,173). The main source of income is non-agriculture (Rs. 10,971)
(AIT’s earning from extesnion servivces, jobs and businesses in family), followed by
sale of milk (10,419) and agriculture (Rs. 8,386). It should be noted that AITs’ monthly
income, as a result of their invlovment in extension services, makes up the largest
portion of houseolds’ income coming from non-agriculture sources. Non-agriculture
contributes up to 81% in household income through extension services and 53% of
contribution of AITs is through sale of milk. Similarly, AIT constributes up to 39% from
agriculture income source.
4) A large majority (92%) reported an increase in household income during last year. More than
90% said that they are economically secure. Above 40% of AITs said they have outstanding
loans. Of those, 86% are confident to pay off the loans.
5) All of the consulted AITs said that they have knowledge regarding breeding of farm animals.
Of which 49% of AITs claim to have high level of knowledge of natural mating and 48%
regarding artificial insemination. The trend shows an increase in knowledge level as compared
to baseline, where majority (above 60%) of respondents expressed to exhibit basic level of
knowledge regarding both types of breeding of animals.
6) Around half of AITs have high level of knowledge regarding local as well as imported
semen and 24% said that they possess high level of knowledge regarding sexed semen.
7) Survey results regarding outreach revealed that AITs are the second largest to provide
services to farmers after veterinary staff. AITs provide extension services to an average
number of 159 regular farmers in seven villages.
8) Data shows that, on an average, each AIT handles 7 cases per month using imported semen
in each district with a success ratio of 59%. On average AITs are using local semen in 33 cases
per month with a conception success ratio of 70%.
Farmers
1) Overall, 72% of farmers are married. Average age of farmers in the target districts is
36 years. Household size of the surveyed districts is 9, at an average.
2) On average, farmers cultivate 6.3 acres of agricultural land, out of which more than
two acres of land is being used to grow fodder.
3) A relatively small proportion i.e. 29% of the consulted farmers have outsanding loans,
of these, majority (93.1%) of farmers are confident to payoff their loans..

End line Survey of Dairy Project
Page 4 of 58
4) The sale of milk contributes the largest portion of household income i.e. Rs. 25,887 followed
by livestock Rs. 16950, and from agriculture i.e. Rs. 13,984.
5) On average, farmers produce 450 liters of milk, of which 381 liters are sold in markets on a
monthly basis
6) Overall, a majority i.e. 85.7% perceived that their household is economically secure. A
fair majority of households (i.e. 68.9%) reported to have 3 meals a day.
7) Overall, 69.7% farmers reported owning Pure Sahiwal breed of cows, 58.2% farmers possess
cows of Cross/European breed and 57.7% said to own Local/Desi breed of cows. A change
can be noticed as compared to baseline figures in this regard as 60% reported owning Pure
Sahiwal breed, 54% Desi/Local and about 25% own cows of Cross European breed.
8) Above ninety percent of farmers are using cultivated fodder for farm animals in both winter
and summer seasons and a relatively smaller proportion around twenty percent use silage.
9) At an average, 90 percent of overall farmers claim to know animal nutritional requirements
indicating a change in knowledge base reported during baseline where 79 % of the farmers
reported knowing animals’ nutrition requirements.
10) For basic health and vaccination of animals both trained local person and veterinary hospital
are available for two third of farmers in the project area, whereas 27.8% of farmers reported
availability of AITs trained by dairy project.
11) A large majority, above ninety percent farmers reported to have knowledge about overall
benefits of best farming practices. Between, 68-79 percent farmers knew about silage making
and teat dipping. A large number i.e. 85% also reported to de-worming their animals and 93%
are vaccinating their animals. Similarly, 81% farmers are feeding their animals with Vanda.
However, only 22.6% farmers are making silage despite having greater knowledge they possess
on the subject.
12) The most important reason mentioned for not using all types of best farm practices is that
these practices are too expensive. The second most important reason is that ‘not enough
resources’ are available.
13) Responding to a question about increase in income after receiving training, 87% confirmed an
increase in their income. Level of increase in income varies and can be quantified in multiple
brackets e.g. 31.8% farmers reported an increase in monthly up to Rs.1000, 19.9% reported
an increase between Rs. 1000-2000, whereas same portion of farmers noted that their
monthly income has increased more than Rs. 5000.
14) A large majority i.e. 94% of farmers reported having heard about or watched programs on
dairy farming. The main source of information received on dairy farming is from social
mobilizers which are confirmed by 79% farmers. Almost 26% also reported leaflets and
pamphlets as sources of information regarding programs on dairy project.

End line Survey of Dairy Project
Page 5 of 58
1. INTRODUCTION & BACKGROUND
DRDF, in collaboration with the United States Agency for International Development (“USAID”), is
undertaking a Dairy Project in order to foster sustainable increase in dairy and livestock productivity
through adoption of best farming practices, breed improvement, availability of timely extension
services and promotion of livestock.
In this context, USAID-DRDF Dairy Project was conceived to fill the above gaps by;
Organizing the rural dairy farming in communities
Training unemployed rural women and men in livestock services to improve access to
breeding and health services; along with generating self-employment opportunities
Raising Awareness Amongst and Training Rural Dairy Producing Households in Farming Best
Practices to improve milk productivity through better management of livestock and input
resources and to inspire them to utilize needed livestock breeding and health services
To enable this activity to be sustainable beyond the funded life of the project by building the
capacity of the Dairy and Rural Development Foundation to introduce and maintain rural
businesses to improve the access of dairy households to inputs and continued technical
guidance.
The Dairy Project’s extension phase ran from October 2014 – October 2016. The project has
following four components:
1. Training and support for dairy farmers
2. Training and support for Artificial Insemination Technicians (AITs)
3. Training and support for Women Livestock Extension Workers (WLEWs)
4. Awareness Campaign
5. Farm up gradation
2. OBJECTIVE & SCOPE OF WORK 2.1. Objective
The main objective of this study is to measure the impact of the extension phase based on benchmarks
set on various variables during baseline. Following are the targeted areas that were covered under the
study:
Farm Productivity and efficiency: Milk Yield / Animal, Profitability, Milking Animals as a %age
of Total Animals Milk Quality and Price Yield, Livestock Growth, Land Usage
Sustainable availability of services: Extension, Quality Artificial Insemination, Diseases
Diagnosis and Treatment
Access to Inputs: Product Portfolio and Cost, quality of inputs, Usage
Market Access: Supply Chain steps to market of milk, livestock, meat
Employment opportunities for rural youth: Artificial Insemination, Health Provision, Herd
Management
Women Empowerment: Social Interaction and Respect, say in household affairs

End line Survey of Dairy Project
Page 6 of 58
Community Engagement: Collective Self Extension and knowledge propagation, collective
buying on scale, self-managed and arranged follow up gatherings, collective decision making
and problem solving.
2.2. Scope of Work
The scope of work included background literature review in order to better understand the project,
conducting interview with the relevant project staff for in depth understanding of activities, designing
baseline and end-line methodologies, preparation for conduct of surveys, training of field team and
pretesting of tools and instruments, conducting survey for the collection of data, analyzing the survey
results and preparation of assignment report.
3. METHODOLOGY Following methodology was adopted for the study:
3.1. Sampling
The objective of the sampling strategy is to create a representative sample of beneficiaries benefiting
from the Dairy Project. As the endline survey was a follow-up of baseline carried out before start of
the project, therefore the study team used same sampling approach as used in baseline study. It is
important to mention that during the endline survey, the baseline sample frame was adjusted to reflect
exclusion of some sample districts (Muzaffargarh) and adjustment of sample beneficiaries. Following
steps were undertaken for sampling;
Phase 1. Sample frame: It was a list of all the project beneficiaries who can be sampled. The
baseline sample was selected from the sample frame of 40,000 farmers, 2,000 WELWs,
1,000 AITs and 100 Model Farms. Data was collected from 984 respondents during
baseline and the endline surveyed 827 beneficiaries of project. This change is mainly due
to exclusion of Muzaffargarh from endline and less number of beneficiaries in some
respondent groups.
Phase 2. Adjustments in end line: The project has conducted farmers’ trainings for different
durations. To reflect this distribution, the end-line survey used stratified random sampling
by dividing the total sample frame into three strata i.e. farmers with one-day training, ii)
farmers with 7 days training and iii) farmers who received one-month training. This
distribution was discussed and agreed with DRDF staff before rolling out the data
collection. Logic behind this approach was to ensure representation of each group.
Phase 3. Sample selection: Finally, the primary sampling units for different respondent types
were selected using simple random sampling. Each selected beneficiary was contacted by
field supervisor to get consent and time for face to face interview. As a quality check,
CNIC and phone numbers was collected to validate interview and information from DRDF
registration data.
Though majority respondents of end line survey are not exactly the same who were surveyed in
baseline, however, both baseline and endline target same type of respondent groups within the target
districts. So, the comparison is possible to reflect upon changes before and after project interventions.
As the respondents of both baseline and endline survey targets same type of beneficiaries having similar
characteristics, therefore the findings can be generalized at the project beneficiary level not for the
communities in general. For example, one can say in Multan, project beneficiary framers’ income has
increased by X amount but cannot be generalized. Table 1 summarizes endline survey data collection.

End line Survey of Dairy Project
Page 7 of 58
Table 1 Endline Sample for data collection
Name of
District
Sample data collected
Farmers WLEWS AITs Total
Vehari 129 20 35 158
Lodhran 86 29 25 140
Khanewal 130 30 26 159
Multan 121 35 2 186
Bahawalpur 94 34 31 184
Total 560 148 119 827
In addition, two FGDs with a group of farmers and one FGD with combined group of AITs and
WLEWs in each district were conducted. Similarly, discussions with farmers of Model Farms were also
held (list of participants is annexed), besides KIIs (Key Informant Interviews) with government officials,
academia, DRDF management, and USAID staff. The table 2 provides details of participants of KIIs.
Table 2: Details of KIIs conducted
S# Name Designation Organization
1 Mr. Naseem Sadiq Secretary Livestock Department
2 Dr. Talat Naseer Pasha Vice Chancellor UVAS
3 Dr. Tayyab Munir Asst. Director ICE&E UVAS
4 Mr. Salman Shah Chairman DRDF
5 Mr. Sajjad Moghal Snr Development Advisor USAID Punjab and AOR
6 Mr. Ahmed Sajjad Chief Executive Officer DRDF
7 Mr. Sajid Naseer Managing Director PVTC
8 Mr. M Junaid Khan Chief of Party USAID PEEP
9 Dr. Umar Farooq General Manager Operations Dairy Project
10 Dr. Masood Dean Veterinary and Animal
Health Department BZU
11 Principal Veterinary College Principal Veterinary College Islamia University
Bahawalpur
12 Dr. Mohsin District Livestock Officer Livestock Department Vehari
13 Dr. Muhabbat Khan Ex-District Livestock Officer Livestock Department Vehari
14 Dr. Rab Nawaz District Livestock Officer Livestock Department
Bahawalpur
3.2. Instrument Development
Both quantitative and qualitative approaches were adopted to conduct end-line of Phase-II
beneficiaries. Instruments designed for baseline was used for end-line to track impact on set of same
variables. DRDF staff finalized these instruments during Baseline conduction after providing their
feedback. Moreover, the instruments were tested through piloting during baseline. However, a number
of performance variables were included in questionnaires for end-line survey.

End line Survey of Dairy Project
Page 8 of 58
4. SURVEY EXECUTION
The survey teams were hired from the targeted districts as they were well conversant with the
custom-culture, demographics and local communities. Five teams comprising data enumerators and
one supervisor representing both male and female were selected. The supervisors were former social
mobilizers of DRDF who were selected owing to the reasons of being familiar to areas in all target
districts. The idea was to assist data enumerators to easily reach to locations of sampled beneficiaries
in each district.
The survey teams were closely monitored at all levels each survey team was managed and supervised
by the survey supervisor and the consultant. The purpose of this arrangement was to ensure quality
of quantitative data collection.
The monitoring teams randomly selected filled forms and re-visited household to validate the
information gathered by the field enumerators. In some cases, respondents were also contacted.
4.1. Field Team Training
Training of field enumerators
Before the data collection exercise, a training was organized for the enumerators and field supervisors
representing each district. This training covered concept development and questionnaire
understanding, mock exercise, feedback and concept rebuilding. The training was conducted at Vehari
at DRDF Vehari Office. The training mainly focused on the following:
1. Understanding of various themes and questions in data collection tools
2. Understanding of terminologies regarding livestock.
3. Understanding of community data gathering principles
4. Mock-up Sessions/demonstrations
5. Participant Selection
6. Group work
Training of Data Entry Operators
Data entry resource persons were oriented in Islamabad when data collection was completed. The
objective of the orientation was to impart a clear understanding of the program interventions, survey
tools and their objectives and to ensure meticulous data entry.
4.2. Field Team Deployment and Data Collection
Questions and variables in each section and question of the instrument (s) were explained to
enumerators during detailed orientation/training session. Accompanied visits, spot checks and back
checks for data quality assurance were performed by survey team leader and his team. The Field
Supervisors (FSs) continually oriented the enumerators throughout the assignment. They were
accompanied with enumerator’s teams during the interview until completely confident that all
members are able to handle the task on their own.
In addition, 15 FGDs were conducted with beneficiaries in their respective locations. Each group
comprised of 6-10 participants. In addition, 12 KIIs were conducted with stakeholders in Lahore,
Patuki, Vehari, and Bahawalpur.
A daily debriefing session was held at each regional office at the end of each day. The field team
performed data editing and data validation tasks. The teams swapped their filled instruments and

End line Survey of Dairy Project
Page 9 of 58
cross-checked each other’s work. Marked envelops having filled out questionnaires were dispatched
to the centralized Data Management Hub in Islamabad, by the field supervisor.
4.3. Data Validation
Data quality assurance was ensured by:
Measurement Error: As part of the Quality Assurance Mechanism, all measurement errors were being
minimized through concept building exercise, mock exercise, and accompanied interviews.
Transcription Error: Transcription errors were minimized using data validation checklists. The
Enumerators validated the collected information before handing it over to the Field Supervisors (FS).
Any discrepancy in the filled instruments was adjusted using enumerators’ knowledge and respondents
were contacted via phone and verified information.
4.4. Data Processing / Cleaning
A specialized data entry program was developed in SPSS in line with the quantitative form to feed in
the data collected in the field.
4.5. Data Analysis - Report
The data collected in the field was randomly checked by the field supervisors for completion. The field
supervisors and monitors ensured cleaning of data at field level through checking completeness of
forms, consistency and logical flow of information. The data entry operators received clean forms to
be processed in the SPSS.
. Following steps were undertaken for data analysis and report writing:
Indexing of questionnaire
Post-entry verification
Perform Data Analysis
Consistency Check
Technical review of data analysis and final datasets
Draft report

End line Survey of Dairy Project
Page 10 of 58
5. FINDINGS
The finding of the end-line survey could be clubbed into three main categories:
1. Women Livestock Extension Worker
2. Artificial Insemination Technicians
3. Farmers
5.1. Women Livestock Extension Workers (WLEWs)
Section Summary
The average household monthly income of the WLEWs is Rs. 22,000. It is evident that income of
household has slightly improved as compared to the baseline average HH income of Rs. 17,000.
‘Income earned by HHs through ‘other income sources’ is the main contributor to HH income which
amounts to 45% of HH income. It should be noted that workers’ income from extension makes up a
fairly considerable portion of households’ income from ‘other income sources’ besides family
employment and small businesses. This is in contrast to baseline finding where main source of HH
income was agriculture, amounting to 39% of HH income. The increase in income is evidence of
earning through the services provided to farmers after acquired skills through project intervention.
Almost all of workers consulted for the survey reported having different level of knowledge about
animal husbandry. Nearly 60% said that they have knowledge ranging from moderate to high level,
which is much higher than the average level of knowledge reported during baseline. During baseline
around 80% respondents reported basic level or no knowledge about animal husbandry. Data indicates
that majority of farmers possess knowledge about types of animal feed. More than half of the workers
(55.4%) said that they have high-level of knowledge regarding Vanda and 38% believed that they have
high-level knowledge regarding fodder, and majority i.e. 62% said that they have moderate knowledge
of fodder. Same proportion reported moderate level of knowledge about silage. It is evident from
the data that workers’ knowledge has considerably improved as compared to baseline data where
majority (i.e. 80%) reported to have basic level of knowledge about animal feed.
On average, each worker provides extension services to 75 farmers which account for 33% of total
estimated farmers in 3 villages in a month. More than half of workers treat animals with diseases
including tympani, indigestion, diarrhea and parasitic infestation.
Extension workers reported problems and issues affecting their work including communities’ lack of
willingness to consider women’s work as favorable, reluctance of farmers to pay their remuneration
for their services in the presence of public sector veterinary staff providing similar services free of
cost. These factors have a negative bearing on their work.
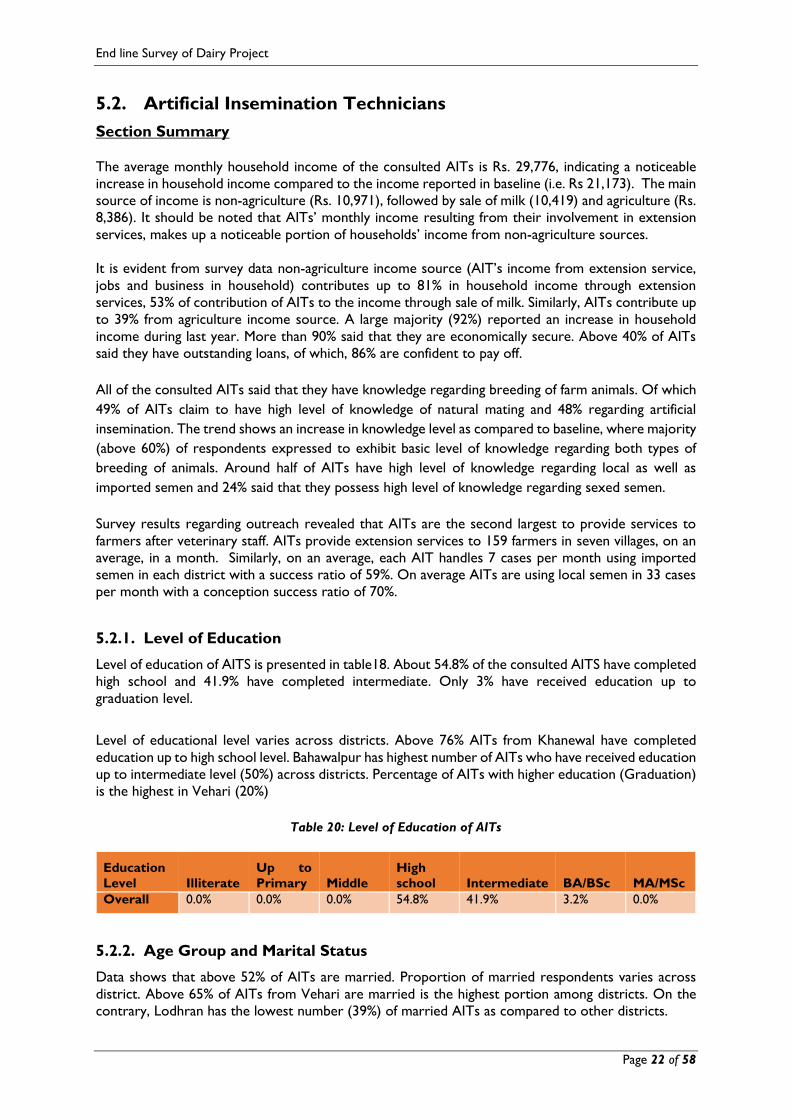
5.1.1. Respondent Level of Education
More than one third of WLEWs (36.1%) have completed high school and almost the same proportion
of WLEWs (34%) reported to have completed middle level education, 17% intermediate, 8.2% BA/BSc
and 2.7% have completed MA/MSc level of education. Across districts, variation does exist with regard
to WLEWs education level - 53% respondents from Lodhran have middle level education, whereas
50% in Bahawalpur have completed high school. Proportion of WLEWs of having intermediate level in
Multan is comparatively high as compare to other districts where 23%of them reported to have
intermediate level of education

End line Survey of Dairy Project
Page 11 of 58
Table 3: Education Level of Respondents
Level of education
Education
Categories Illiterate
Up to
Primary Middle
High
School Intermediate BA/BSc MA/MSc
Any
Other Total
Overall 0.7% 1.4% 34.0% 36.1% 17.0% 8.2% 2.7% 0.0% 100.0%
5.1.2. Respondent Marital Status and age
Above 60% of the consulted WLEWs are married. Percentage of married WLEWs is the highest in
Multan (73.5 %) followed by Vehari (70%). On the contrary, proportion of married WLEWs is the
lowest in Khanewal (44 %).
The average age comes as 28 years. Data showed the highest number of workers (54.2%) is between
20-29 years of age bracket followed by 28.9% workers who fall under age category of 30-39 years of
age. More than 68 % of workers from Lodhran are between 20 to 30 years of age which is the highest
percentage among all districts.
Table 4: Respondent age category and marital status
Age Categories Marital Status
Up to 19
Years
20-29
Years
30-39
Years
40-49
Years
50 Years
and Above
Married Unmarried
7.7% 54.2% 28.9% 8.5% 0.7% 60.3% 39.7%
5.1.3. Respondent Household Income
Table (5) presents overall data on household income segregated by sources of income. The overall
average household monthly income of the workers is Rs. 22,000. District wise data indicates workers’
household income is highest in Bahawalpur (Rs. 25,000) followed by Khanewal (Rs. 23,000) and is
lowest in Vehari (Rs. 20,800). It is evident that monthly income of household has reasonably improved
as compared to level of income reported in baseline, where on average HH monthly income was
around Rs. 17,000.
Household’s other income sources which include jobs, small businesses in family and worker’s monthly
earning from extension services are the highest contributor among income sources (i.e. Rs. 10,000).
They noted that they earn income from selling Vanda, treating animals and selling animal medicines to
farmers. Household’s monthly income from livestock is Rs. 5,000, followed by agriculture (Rs. 4000)
and dairy (Rs. 3,000).
Workers’ engagement in extension services not only contributes to their family income but also
empowers them within their communities. Workers noted that despite the reluctance in accepting
women as livestock extension workers in a primitive society their social standing has been enhanced.
They further informed that income contribution to household has enhanced their respect in the family.
“Though I was literate but was unable to augment a livelihood. I had to handle household chores and look after my
family members. I always dreamt to carve out a profession/livelihood activity to support my family whose essential
needs were barely met. Fortunately, I got an opportunity to receive a livelihood training from dairy project which
greatly helped me to earn a considerable amount to meet needs of my family. I successfully treat farm animals
owned by farmers living in nearby villages. This work has provided me a respectable socio-economic standing.”
- A 20 years old female extension worker from Lodhran
End line Survey of Dairy Project
Page 12 of 58
Table 5 Workers HH income segregated by income source
Income
Sources
Overall Dairy Agriculture Income Livestock Others (Jobs, extension
services –Vanda selling,
medicines, business etc.
Overall 22,000
3,000 4,000 5,000 10,000
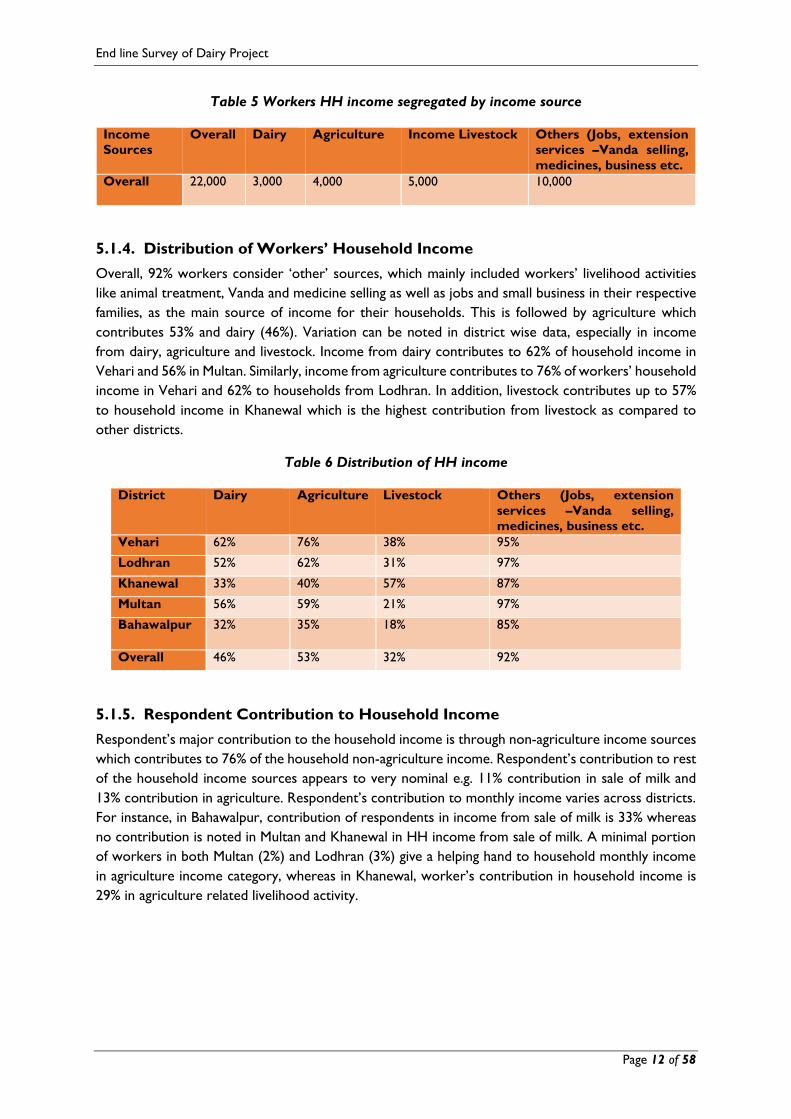
5.1.4. Distribution of Workers’ Household Income
Overall, 92% workers consider ‘other’ sources, which mainly included workers’ livelihood activities
like animal treatment, Vanda and medicine selling as well as jobs and small business in their respective
families, as the main source of income for their households. This is followed by agriculture which
contributes 53% and dairy (46%). Variation can be noted in district wise data, especially in income
from dairy, agriculture and livestock. Income from dairy contributes to 62% of household income in
Vehari and 56% in Multan. Similarly, income from agriculture contributes to 76% of workers’ household
income in Vehari and 62% to households from Lodhran. In addition, livestock contributes up to 57%
to household income in Khanewal which is the highest contribution from livestock as compared to
other districts.
Table 6 Distribution of HH income
District Dairy Agriculture Livestock Others (Jobs, extension
services –Vanda selling,
medicines, business etc.
Vehari 62% 76% 38% 95%
Lodhran 52% 62% 31% 97%
Khanewal 33% 40% 57% 87%
Multan 56% 59% 21% 97%
Bahawalpur 32% 35% 18% 85%
Overall 46% 53% 32% 92%
5.1.5. Respondent Contribution to Household Income
Respondent’s major contribution to the household income is through non-agriculture income sources
which contributes to 76% of the household non-agriculture income. Respondent’s contribution to rest
of the household income sources appears to very nominal e.g. 11% contribution in sale of milk and
13% contribution in agriculture. Respondent’s contribution to monthly income varies across districts.
For instance, in Bahawalpur, contribution of respondents in income from sale of milk is 33% whereas
no contribution is noted in Multan and Khanewal in HH income from sale of milk. A minimal portion
of workers in both Multan (2%) and Lodhran (3%) give a helping hand to household monthly income
in agriculture income category, whereas in Khanewal, worker’s contribution in household income is
29% in agriculture related livelihood activity.

End line Survey of Dairy Project
Page 13 of 58
Table 7: Respondent Contribution to HH Income
Income
Categories
Sale of
milk
Sale of Dairy
Products
Agriculture Non-Agriculture
income
Overall 11% 0 13% 76%
When question was asked regarding increase in income after receiving training, 59.3% of workers
responded affirmatively, whereas almost 32% of workers said that their income has stayed the same.
A nominal proportion reported that their income has decreased.
Figure 1: Increase in workers' income
5.1.6. Possession of Productive Assets
About three-fourth of workers reported possessing tools including sewing machine, washing machine,
and carpentry tools and livestock. In addition, 63.5% responded that they have land/real estate owned
by their respective families. Similarly, 43% reported owning cash saving and 49% said that they own
precious metals including gold, silver and jewellery etc. A considerable proportion (34%) of workers
said that they hold bank accounts. Variation regarding ownership of productive assets does exist.
Slightly more than 90% workers from Vehari reported to own livestock followed by Lodhran where
82% said that they possess livestock. A large majority (95%) from Vehari said that they own tools like
sewing machine, washing machine etc. On the contrary, only 9% workers from Bahawalpur informed
they hold bank accounts as compared to other districts where a considerable portion of respondents
reported holding bank accounts.
Table 8 Possession of HH productive assets
Productive Assets Percentage Responses
Savings certificates 3.4%
Livestock 77.0%
Cash savings 43.2%
Land/real estate) 63.5%
Bank accounts 34.0%
59.3%
31.7%
9.0%
Increased Stayed the same Decreased

End line Survey of Dairy Project
Page 14 of 58
Productive Assets Percentage Responses
Tractor/farm equipment 15.5%
Gold, silver and precious metals (including
jewelry 49.7%
Other tools (e.g. sewing machine, washing
machine, carpentry tools 77.0%
5.1.7. Possession of General Assets
Almost all consulted workers reported to own fans at their households, followed by cell phones
reported by 96% workers. Almost 62% workers own refrigerators and 52% reported having washing
machine at their homes. However, there are variations in possession of general assets across districts
– all the workers from Vehari, Lodhran and Khanewal own fans. Likewise, Multan and Vehari, all
consulted workers have cell phone in their possessions. As opposed to overall trend, 61% workers in
Vehari reported to own TV with dish antenna at their households.
Table 9: Possession of General Assets
5.1.8. Workers Household Debt
A relatively small proportion i.e. 29% of the consulted workers has acquired debt. Of those, 57% are
confident that they are able to repay the debt amount on a regular basis. A small portion of the
consulted workers (9%) also reported that their family members have outstanding loans; however, a
fairly larger proportion of these workers believed that their household members are capable to pay
off outstanding debt.
District-wise data on workers and their household debt shows similar trends, nevertheless variation
in trends regarding workers’ ability repay their outstanding loans does exist. For instance, 83% workers
from Bahawalpur who have debt have shown their ability payback their debt. On the contrary, none
in Lodhran are capable to repay the amount.
Table 10: Debt and ability to repayment
% of having
debt
Ability to
make
regular
repayments?
Household
members
having debt
Ability to make
regular repayments
Overall 26.5%
57.1%
9.1%
66.7%
General Assets Response Percentage
Fans 98.6%
Landline phone 6.3%
Refrigerator 61.9%
Cell phone 95.9%
HH Other Assets (TV with dish antenna) 28.1%
Washing machine 52.4%
TV without Dish Antenna/Cable 36.1%
Bicycle 32.4%
Radio 7.7%
End line Survey of Dairy Project
Page 15 of 58
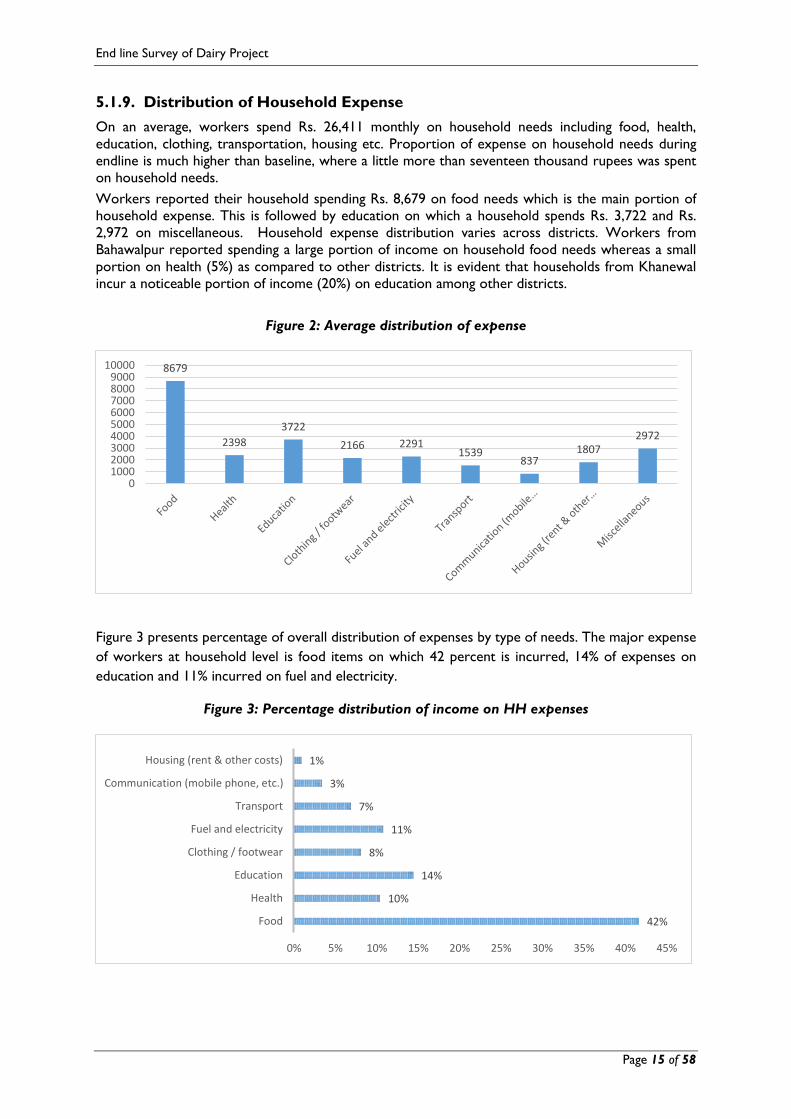
5.1.9. Distribution of Household Expense
On an average, workers spend Rs. 26,411 monthly on household needs including food, health,
education, clothing, transportation, housing etc. Proportion of expense on household needs during
endline is much higher than baseline, where a little more than seventeen thousand rupees was spent
on household needs.
Workers reported their household spending Rs. 8,679 on food needs which is the main portion of
household expense. This is followed by education on which a household spends Rs. 3,722 and Rs.
2,972 on miscellaneous. Household expense distribution varies across districts. Workers from
Bahawalpur reported spending a large portion of income on household food needs whereas a small
portion on health (5%) as compared to other districts. It is evident that households from Khanewal
incur a noticeable portion of income (20%) on education among other districts.
Figure 2: Average distribution of expense
Figure 3 presents percentage of overall distribution of expenses by type of needs. The major expense
of workers at household level is food items on which 42 percent is incurred, 14% of expenses on
education and 11% incurred on fuel and electricity.
Figure 3: Percentage distribution of income on HH expenses
8679
2398
3722
2166 22911539
8371807
2972
0100020003000400050006000700080009000
10000
42%
10%
14%
8%
11%
7%
3%
1%
0% 5% 10% 15% 20% 25% 30% 35% 40% 45%
Food
Health
Education
Clothing / footwear
Fuel and electricity
Transport
Communication (mobile phone, etc.)
Housing (rent & other costs)

End line Survey of Dairy Project
Page 16 of 58
5.1.10. Knowledge of Animals and Diseases
Almost all of workers consulted for the survey reported having knowledge of animal husbandry. When
asked to rate their knowledge level about basic animal health, 38.5% workers reported their level of
knowledge as moderate. Comparatively a small portion of workers (19%) claimed that they have high
level of knowledge about animal health. Basic knowledge is reported by 23.6% respondents and 19%
said that they don’t have knowledge about basic animal health. As compared to baseline figures, an
upward trend in knowledge level can be observed in respondents of endline. For instance, 18.9%
respondents of endline reported having high level of knowledge, whereas during baseline only 6% of
respondents had reported possessing such level of knowledge.
Table 11 Knowledge level of respondent regarding basic animal health
Knowledge
Level None Basic Knowledge Moderate High
Overall 18.9% 23.6% 38.5% 18.9%
The table 12 presents respondents’ knowledge level of diseases in farm animals. It is evident from the
data that majority of workers possess better knowledge regarding diseases in farm animals. Above
sixty percent rated their knowledge from good to excellent with regard to diseases like diarrhoea,
tympani, indigestion and Parasitic Infestation each. Results of baseline indicated that respondents
lacked knowledge regarding diseases in animals. For instance, around eighty percent rate their
knowledge of each disease poor to fair. Workers believed that their level of knowledge has increased
as result of training and ongoing support from dairy project. Workers noted that due to their acquired
skills, they are able to provide animal health services to farmers in their respective areas.
Table 12: Level of knowledge of workers about diseases in farm animals
Diseases Poor Fair Average Good Excellent
Diarrhea 2.7% 6.8% 23.8% 56.5% 10.2%
Tympani 7% 6.8% 23.8% 57.1% 11.6%
Indigestion 0.0% 8.3% 23.4% 57.9% 10.3%
Parasitic Infestation 2.1% 6.9% 29.2% 53.5% 8.3%
Mastitis 6.2% 12.4% 28.3% 40.7% 12.4%
ND Vaccination 11.0% 16.4% 27.4% 39.7% 5.5%
Hemorrhagic
Septicemia
8.2% 15.8% 26.7% 41.1% 8.2%
Foot & Mouth
Diseases
7.5% 15.1% 21.9% 43.2% 12.3%
Calf Care 7.5% 17.0% 26.5% 40.1% 8.8%
5.1.11. Training Received by Workers
All of the consulted workers have received livestock extension training from Dairy Project. However,
data indicates that a few respondents have received livelihood training from other organizations.. For
instance, only three workers said that they received a livelihood training on kitchen gardening and
business development from organizations, other than Dairy Project.
5.1.12. Knowledge of Farm Animal Feed & Nutrition Requirement
Almost all of the workers said that they have knowledge of animal feed and nutrition requirement.
However, it is evident that workers’ knowledge level varies to a greater extent. More than half of
worker said that they have high-level of knowledge regarding Vanda, whereas 62% believed that they
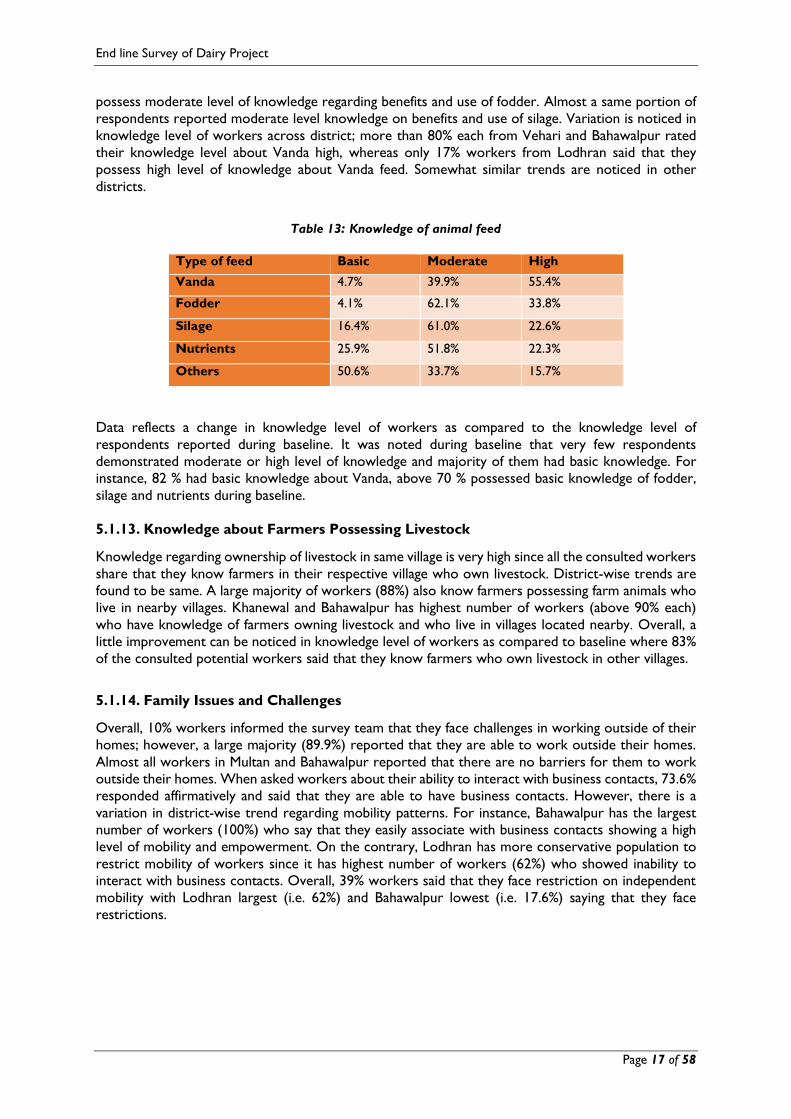
End line Survey of Dairy Project
Page 17 of 58
possess moderate level of knowledge regarding benefits and use of fodder. Almost a same portion of
respondents reported moderate level knowledge on benefits and use of silage. Variation is noticed in
knowledge level of workers across district; more than 80% each from Vehari and Bahawalpur rated
their knowledge level about Vanda high, whereas only 17% workers from Lodhran said that they
possess high level of knowledge about Vanda feed. Somewhat similar trends are noticed in other
districts.
Table 13: Knowledge of animal feed
Type of feed Basic Moderate High
Vanda 4.7% 39.9% 55.4%
Fodder 4.1% 62.1% 33.8%
Silage 16.4% 61.0% 22.6%
Nutrients 25.9% 51.8% 22.3%
Others 50.6% 33.7% 15.7%
Data reflects a change in knowledge level of workers as compared to the knowledge level of
respondents reported during baseline. It was noted during baseline that very few respondents
demonstrated moderate or high level of knowledge and majority of them had basic knowledge. For
instance, 82 % had basic knowledge about Vanda, above 70 % possessed basic knowledge of fodder,
silage and nutrients during baseline.
5.1.13. Knowledge about Farmers Possessing Livestock
Knowledge regarding ownership of livestock in same village is very high since all the consulted workers
share that they know farmers in their respective village who own livestock. District-wise trends are
found to be same. A large majority of workers (88%) also know farmers possessing farm animals who
live in nearby villages. Khanewal and Bahawalpur has highest number of workers (above 90% each)
who have knowledge of farmers owning livestock and who live in villages located nearby. Overall, a
little improvement can be noticed in knowledge level of workers as compared to baseline where 83%
of the consulted potential workers said that they know farmers who own livestock in other villages.
5.1.14. Family Issues and Challenges
Overall, 10% workers informed the survey team that they face challenges in working outside of their
homes; however, a large majority (89.9%) reported that they are able to work outside their homes.
Almost all workers in Multan and Bahawalpur reported that there are no barriers for them to work
outside their homes. When asked workers about their ability to interact with business contacts, 73.6%
responded affirmatively and said that they are able to have business contacts. However, there is a
variation in district-wise trend regarding mobility patterns. For instance, Bahawalpur has the largest
number of workers (100%) who say that they easily associate with business contacts showing a high
level of mobility and empowerment. On the contrary, Lodhran has more conservative population to
restrict mobility of workers since it has highest number of workers (62%) who showed inability to
interact with business contacts. Overall, 39% workers said that they face restriction on independent
mobility with Lodhran largest (i.e. 62%) and Bahawalpur lowest (i.e. 17.6%) saying that they face
restrictions.

End line Survey of Dairy Project
Page 18 of 58
Table 14: Family Issues/challenges faced by workers
District Ability to work
outside home
Ability to associate with
business contact
Restriction on
independent mobility
Vehari 81.0% 81.0% 47.6%
Lodhran 89.7% 24.1% 62.1%
Khanewal 80.0% 73.3% 26.7%
Multan 97.1% 85.3% 50.0%
Bahawalpur 97.1% 100.0% 17.6%
Overall 89.9% 73.6% 39.9%
Extension workers reported problems and issues affecting their work in their respective communities.
For instance, 55% workers said that their work is not looked at favourably in communities. More than
sixty percent said that farmers often decline to pay their remuneration in return to their services. One
third of respondents (33%) noted that the presence of other service providers like veterinary officer
in their areas gets their work affected.
District level variations exist since 80% from Bahawalpur said that their work is not accepted whereas
only 28% workers from Khanewal reported to face such problem. A fair majority of workers (58%)
from Lodhran reported restriction on their mobility whereas a small number from Bahawalpur (9%)
said that restricted mobility affects their work. Patterns of other problems being faced by workers
are somewhat similar across districts.
Table 15 Problems Faced by Workers
Problems Work is not
looked at
favorably in
the society
Restrictions
on mobility
Restrictions
on talking
to men
Other
women in
their
Baradri
also
works
Farmers
decline to
pay for
your
services
Veterinary
Officer available
in your village
Overall 55.4% 35.8% 27.4% 21.8% 65.3% 33.1%
Discussion with workers during the data collection revealed that cultural barriers do exist but their
family members allow them to visit farmers. They noted that ever since they received training and
started providing services, perception on female mobility has somewhat changed. However, they said
that they can’t go to other villages located far away. They can only visit to farmers based in their
respective villages but they are allowed to go nearby villages when they are accompanied by a male
family member.
“In the beginning, farmers were not willing to acquire our services owing to a negative but a dominant belief that the treating
animals is a man’s domain and a woman is not capable to assume this responsibility. Our family members were reluctant to
allow us to work due to people’s attitude. However, we mustered our courage and successfully handled a few cases. Gradually,
more people started to approach us for treatment of animals. Now our work is now much appreciated”
-A worker from Vehari.
End line Survey of Dairy Project
Page 19 of 58
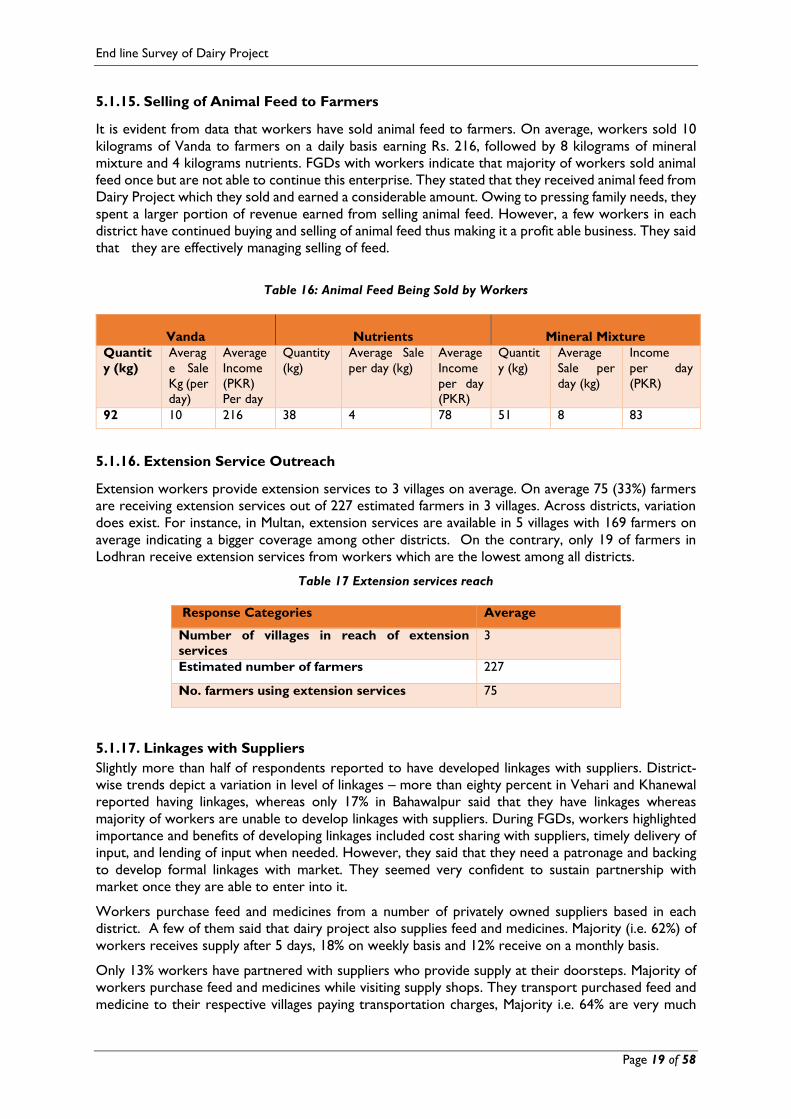
5.1.15. Selling of Animal Feed to Farmers
It is evident from data that workers have sold animal feed to farmers. On average, workers sold 10
kilograms of Vanda to farmers on a daily basis earning Rs. 216, followed by 8 kilograms of mineral
mixture and 4 kilograms nutrients. FGDs with workers indicate that majority of workers sold animal
feed once but are not able to continue this enterprise. They stated that they received animal feed from
Dairy Project which they sold and earned a considerable amount. Owing to pressing family needs, they
spent a larger portion of revenue earned from selling animal feed. However, a few workers in each
district have continued buying and selling of animal feed thus making it a profit able business. They said
that they are effectively managing selling of feed.
Table 16: Animal Feed Being Sold by Workers
Vanda Nutrients Mineral Mixture
Quantit
y (kg)
Averag
e Sale
Kg (per
day)
Average
Income
(PKR)
Per day
Quantity
(kg)
Average Sale
per day (kg)
Average
Income
per day
(PKR)
Quantit
y (kg)
Average
Sale per
day (kg)
Income
per day
(PKR)
92 10 216 38 4 78 51 8 83
5.1.16. Extension Service Outreach
Extension workers provide extension services to 3 villages on average. On average 75 (33%) farmers
are receiving extension services out of 227 estimated farmers in 3 villages. Across districts, variation
does exist. For instance, in Multan, extension services are available in 5 villages with 169 farmers on
average indicating a bigger coverage among other districts. On the contrary, only 19 of farmers in
Lodhran receive extension services from workers which are the lowest among all districts.
Table 17 Extension services reach
Response Categories Average
Number of villages in reach of extension
services
3
Estimated number of farmers 227
No. farmers using extension services 75
5.1.17. Linkages with Suppliers
Slightly more than half of respondents reported to have developed linkages with suppliers. District-
wise trends depict a variation in level of linkages – more than eighty percent in Vehari and Khanewal
reported having linkages, whereas only 17% in Bahawalpur said that they have linkages whereas
majority of workers are unable to develop linkages with suppliers. During FGDs, workers highlighted
importance and benefits of developing linkages included cost sharing with suppliers, timely delivery of
input, and lending of input when needed. However, they said that they need a patronage and backing
to develop formal linkages with market. They seemed very confident to sustain partnership with
market once they are able to enter into it.
Workers purchase feed and medicines from a number of privately owned suppliers based in each
district. A few of them said that dairy project also supplies feed and medicines. Majority (i.e. 62%) of
workers receives supply after 5 days, 18% on weekly basis and 12% receive on a monthly basis.
Only 13% workers have partnered with suppliers who provide supply at their doorsteps. Majority of
workers purchase feed and medicines while visiting supply shops. They transport purchased feed and
medicine to their respective villages paying transportation charges, Majority i.e. 64% are very much
End line Survey of Dairy Project
Page 20 of 58
satisfied with input suppliers while 21% are just satisfied with input suppliers. Rest showed little
satisfaction with the input suppliers.
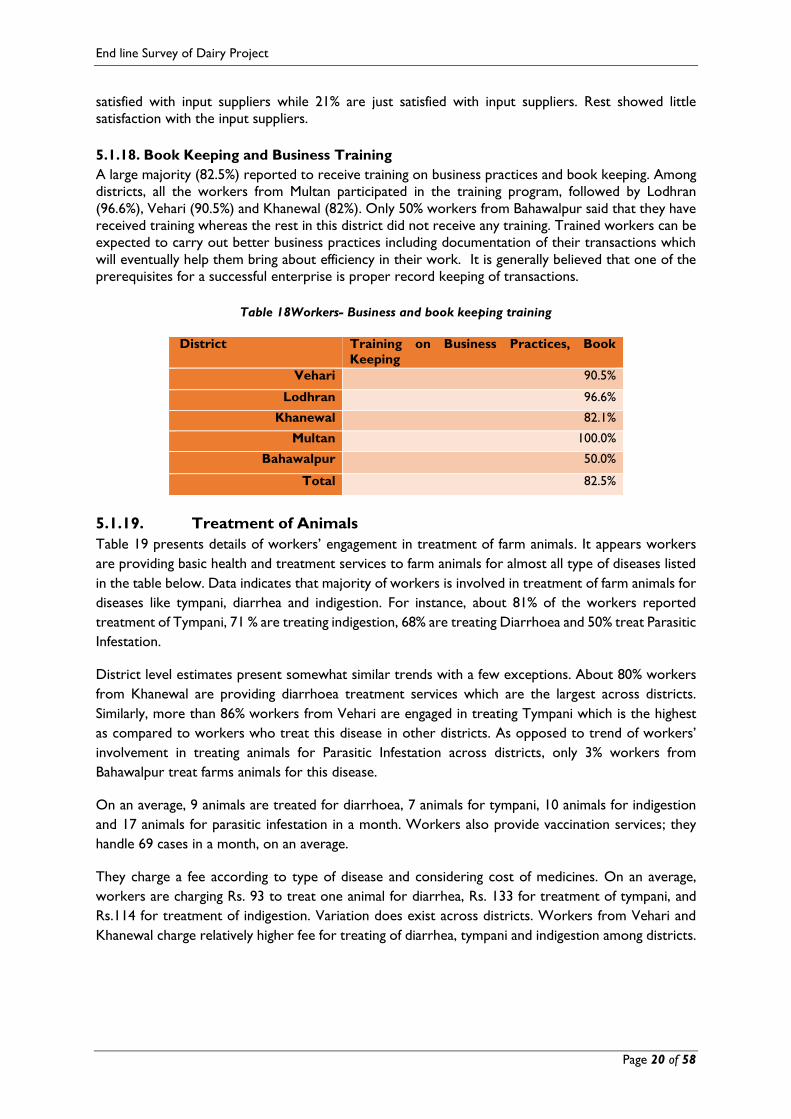
5.1.18. Book Keeping and Business Training
A large majority (82.5%) reported to receive training on business practices and book keeping. Among
districts, all the workers from Multan participated in the training program, followed by Lodhran
(96.6%), Vehari (90.5%) and Khanewal (82%). Only 50% workers from Bahawalpur said that they have
received training whereas the rest in this district did not receive any training. Trained workers can be
expected to carry out better business practices including documentation of their transactions which
will eventually help them bring about efficiency in their work. It is generally believed that one of the
prerequisites for a successful enterprise is proper record keeping of transactions.
Table 18Workers- Business and book keeping training
District Training on Business Practices, Book
Keeping
Vehari 90.5%
Lodhran 96.6%
Khanewal 82.1%
Multan 100.0%
Bahawalpur 50.0%
Total 82.5%
5.1.19. Treatment of Animals
Table 19 presents details of workers’ engagement in treatment of farm animals. It appears workers
are providing basic health and treatment services to farm animals for almost all type of diseases listed
in the table below. Data indicates that majority of workers is involved in treatment of farm animals for
diseases like tympani, diarrhea and indigestion. For instance, about 81% of the workers reported
treatment of Tympani, 71 % are treating indigestion, 68% are treating Diarrhoea and 50% treat Parasitic
Infestation.
District level estimates present somewhat similar trends with a few exceptions. About 80% workers
from Khanewal are providing diarrhoea treatment services which are the largest across districts.
Similarly, more than 86% workers from Vehari are engaged in treating Tympani which is the highest
as compared to workers who treat this disease in other districts. As opposed to trend of workers’
involvement in treating animals for Parasitic Infestation across districts, only 3% workers from
Bahawalpur treat farms animals for this disease.
On an average, 9 animals are treated for diarrhoea, 7 animals for tympani, 10 animals for indigestion
and 17 animals for parasitic infestation in a month. Workers also provide vaccination services; they
handle 69 cases in a month, on an average.
They charge a fee according to type of disease and considering cost of medicines. On an average,
workers are charging Rs. 93 to treat one animal for diarrhea, Rs. 133 for treatment of tympani, and
Rs.114 for treatment of indigestion. Variation does exist across districts. Workers from Vehari and
Khanewal charge relatively higher fee for treating of diarrhea, tympani and indigestion among districts.

End line Survey of Dairy Project
Page 21 of 58
Table 19 Disease Treatment and Monthly Income
Disease Do you treat? Av. No.
of Cases
/month
Av. Fee
Charged /
Case
Average
Monthly
Expanse
Average
Monthly
Revenue Yes No
Diarrhea 67.6% 32.4% 9 93 501 837
Tympani 81.1% 18.9% 7 133 314 931
Indigestion 71.2% 28.8% 10 114 529 1140
Parasitic Infestation 50.0% 50.0% 17 139 829 2363
Mastitis 31.5% 68.5% 4 251 600 1004
ND Vaccination 22.7% 77.3% 69 46 376 3174
Hemorrhagic
Septicemia
22.7% 77.3% 18 101 538 1818
Foot & Mouth
Diseases
33.3% 66.7% 12 152 760 1824
Calf Care 26.5% 73.5% 17 218 667 3706
A large majority (i.e. 90%) of workers are excited to share that farmers approach them for advice on
animal health and nutrition issues. Across districts, all the workers from Bahawalpur said that farmers
consult them on issues related to health and nutrition. Responding to a question about their reliability,
a majority (88.5%) said that farmers consider their services reliable. District-wise trends show a little
variation – above 90% each from Multan and Bahawalpur said that farmers consider them reliable
which is the highest across districts. Above 76 percent workers from Vehari reported having reliability
among farmers which is lowest as compared to other districts.
Conclusion/Recommendations
Almost all of workers consulted for the study reported an improved level of knowledge of animal
husbandry as compared to level of knowledge reported by potential workers during baseline,
Furthermore, a large number of workers have significantly higher level of knowledge on animal feed
as compared to knowledge level reported during baseline. Workers are engaged in providing extension
services to a considerable number of farmers in their respective areas. Majority of workers treat
diseases in animals like tympani, indigestion, diarrhea and parasitic infestation in animals.
Despite facing social issues and cultural issues, workers believe that their acceptance as worker in
their respective communities has improved during last one year. They claim that community members
recognize their work and give respect. In addition, workers believe that their livelihood greatly
contribute to household income which earned them respect in their families.
Workers believe that they should be linked with livestock department so that they can have better
acceptance within communities. Furthermore, since workers are not linked to livestock department
which could affect sustainability of their work after phasing out of the project, when there will be no
monitoring and support mechanism available for workers. There is an urgent need to have dialogues
with government relevant departments at provincial and district level to find ways to institutionalize
these workers. There is also need to discuss on policy level to sustain monitoring and ongoing support.
According to relevant government officials and academia they were not consulted during design and
conceptualization of the project. They believe that their contextual knowledge and experience might
have proved a value addition to the project especially in targeting and setting selection criteria as well
as in training design. Future interventions might need to be designed in close coordination with
relevant stakeholders including government line departments and relevant university departments.
End line Survey of Dairy Project
Page 22 of 58
5.2. Artificial Insemination Technicians
Section Summary
The average monthly household income of the consulted AITs is Rs. 29,776, indicating a noticeable
increase in household income compared to the income reported in baseline (i.e. Rs 21,173). The main
source of income is non-agriculture (Rs. 10,971), followed by sale of milk (10,419) and agriculture (Rs.
8,386). It should be noted that AITs’ monthly income resulting from their involvement in extension
services, makes up a noticeable portion of households’ income from non-agriculture sources.
It is evident from survey data non-agriculture income source (AIT’s income from extension service,
jobs and business in household) contributes up to 81% in household income through extension
services, 53% of contribution of AITs to the income through sale of milk. Similarly, AITs contribute up
to 39% from agriculture income source. A large majority (92%) reported an increase in household
income during last year. More than 90% said that they are economically secure. Above 40% of AITs
said they have outstanding loans, of which, 86% are confident to pay off.
All of the consulted AITs said that they have knowledge regarding breeding of farm animals. Of which
49% of AITs claim to have high level of knowledge of natural mating and 48% regarding artificial
insemination. The trend shows an increase in knowledge level as compared to baseline, where majority
(above 60%) of respondents expressed to exhibit basic level of knowledge regarding both types of
breeding of animals. Around half of AITs have high level of knowledge regarding local as well as
imported semen and 24% said that they possess high level of knowledge regarding sexed semen.
Survey results regarding outreach revealed that AITs are the second largest to provide services to
farmers after veterinary staff. AITs provide extension services to 159 farmers in seven villages, on an
average, in a month. Similarly, on an average, each AIT handles 7 cases per month using imported
semen in each district with a success ratio of 59%. On average AITs are using local semen in 33 cases
per month with a conception success ratio of 70%.
5.2.1. Level of Education
Level of education of AITS is presented in table18. About 54.8% of the consulted AITS have completed
high school and 41.9% have completed intermediate. Only 3% have received education up to
graduation level.
Level of educational level varies across districts. Above 76% AITs from Khanewal have completed
education up to high school level. Bahawalpur has highest number of AITs who have received education
up to intermediate level (50%) across districts. Percentage of AITs with higher education (Graduation)
is the highest in Vehari (20%)
Table 20: Level of Education of AITs
Education
Level Illiterate
Up to
Primary Middle
High
school Intermediate BA/BSc MA/MSc
Overall 0.0% 0.0% 0.0% 54.8% 41.9% 3.2% 0.0%
5.2.2. Age Group and Marital Status
Data shows that above 52% of AITs are married. Proportion of married respondents varies across
district. Above 65% of AITs from Vehari are married is the highest portion among districts. On the
contrary, Lodhran has the lowest number (39%) of married AITs as compared to other districts.
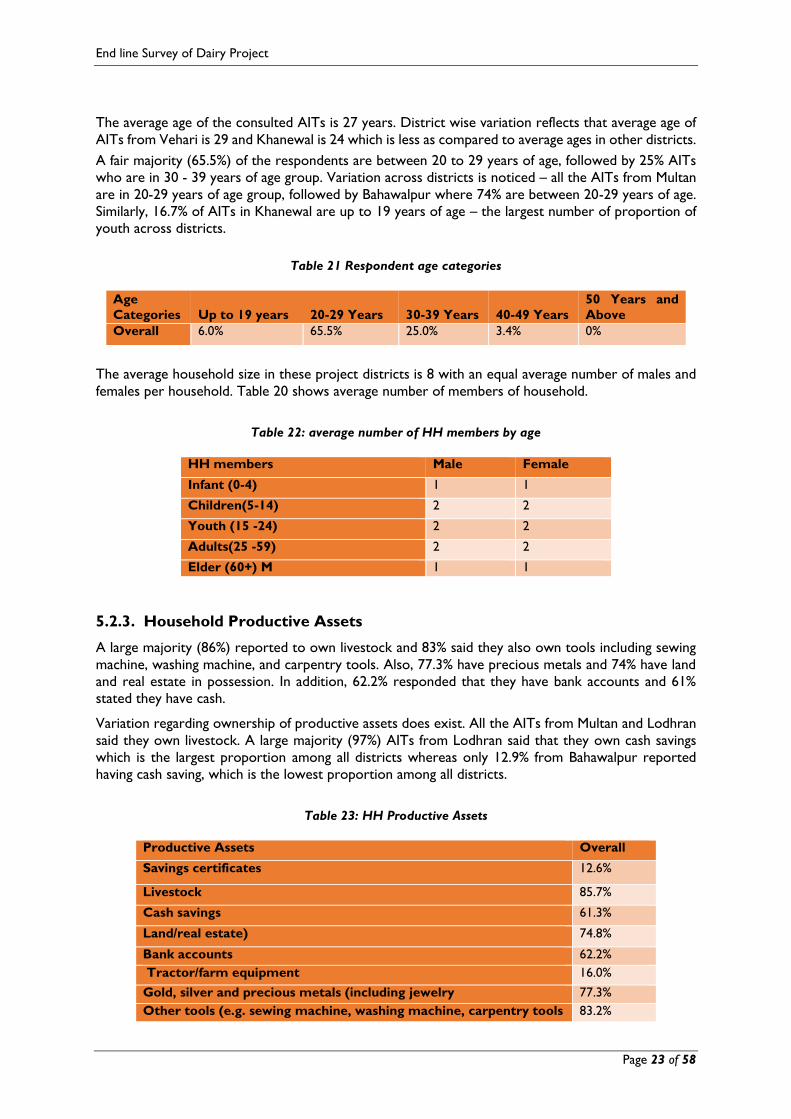
End line Survey of Dairy Project
Page 23 of 58
The average age of the consulted AITs is 27 years. District wise variation reflects that average age of
AITs from Vehari is 29 and Khanewal is 24 which is less as compared to average ages in other districts.
A fair majority (65.5%) of the respondents are between 20 to 29 years of age, followed by 25% AITs
who are in 30 - 39 years of age group. Variation across districts is noticed – all the AITs from Multan
are in 20-29 years of age group, followed by Bahawalpur where 74% are between 20-29 years of age.
Similarly, 16.7% of AITs in Khanewal are up to 19 years of age – the largest number of proportion of
youth across districts.
Table 21 Respondent age categories
Age
Categories Up to 19 years 20-29 Years 30-39 Years 40-49 Years
50 Years and
Above
Overall 6.0% 65.5% 25.0% 3.4% 0%
The average household size in these project districts is 8 with an equal average number of males and
females per household. Table 20 shows average number of members of household.
Table 22: average number of HH members by age
5.2.3. Household Productive Assets
A large majority (86%) reported to own livestock and 83% said they also own tools including sewing
machine, washing machine, and carpentry tools. Also, 77.3% have precious metals and 74% have land
and real estate in possession. In addition, 62.2% responded that they have bank accounts and 61%
stated they have cash.
Variation regarding ownership of productive assets does exist. All the AITs from Multan and Lodhran
said they own livestock. A large majority (97%) AITs from Lodhran said that they own cash savings
which is the largest proportion among all districts whereas only 12.9% from Bahawalpur reported
having cash saving, which is the lowest proportion among all districts.
Table 23: HH Productive Assets
HH members Male Female
Infant (0-4) 1 1
Children(5-14) 2 2
Youth (15 -24) 2 2
Adults(25 -59) 2 2
Elder (60+) M 1 1
Productive Assets Overall
Savings certificates 12.6%
Livestock 85.7%
Cash savings 61.3%
Land/real estate) 74.8%
Bank accounts 62.2%
Tractor/farm equipment 16.0%
Gold, silver and precious metals (including jewelry 77.3%
Other tools (e.g. sewing machine, washing machine, carpentry tools 83.2%
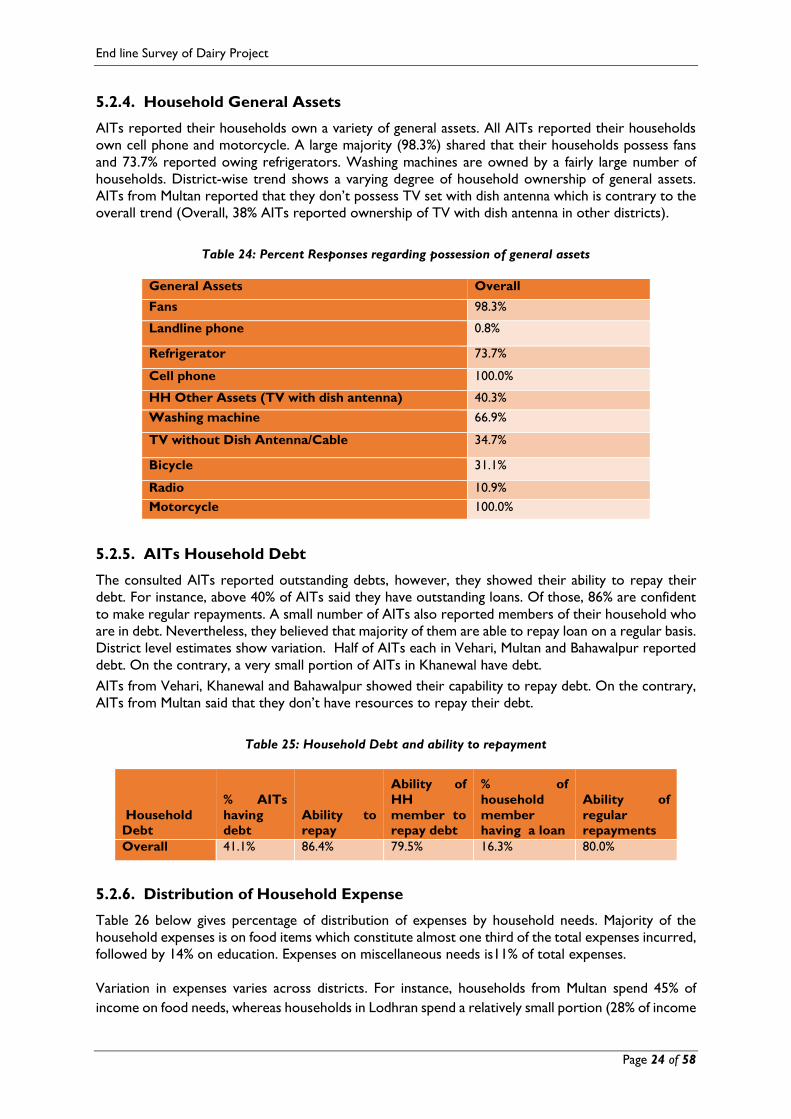
End line Survey of Dairy Project
Page 24 of 58
5.2.4. Household General Assets
AITs reported their households own a variety of general assets. All AITs reported their households
own cell phone and motorcycle. A large majority (98.3%) shared that their households possess fans
and 73.7% reported owing refrigerators. Washing machines are owned by a fairly large number of
households. District-wise trend shows a varying degree of household ownership of general assets.
AITs from Multan reported that they don’t possess TV set with dish antenna which is contrary to the
overall trend (Overall, 38% AITs reported ownership of TV with dish antenna in other districts).
Table 24: Percent Responses regarding possession of general assets
General Assets Overall
Fans 98.3%
Landline phone 0.8%
Refrigerator 73.7%
Cell phone 100.0%
HH Other Assets (TV with dish antenna) 40.3%
Washing machine 66.9%
TV without Dish Antenna/Cable 34.7%
Bicycle 31.1%
Radio 10.9%
Motorcycle 100.0%
5.2.5. AITs Household Debt
The consulted AITs reported outstanding debts, however, they showed their ability to repay their
debt. For instance, above 40% of AITs said they have outstanding loans. Of those, 86% are confident
to make regular repayments. A small number of AITs also reported members of their household who
are in debt. Nevertheless, they believed that majority of them are able to repay loan on a regular basis.
District level estimates show variation. Half of AITs each in Vehari, Multan and Bahawalpur reported
debt. On the contrary, a very small portion of AITs in Khanewal have debt.
AITs from Vehari, Khanewal and Bahawalpur showed their capability to repay debt. On the contrary,
AITs from Multan said that they don’t have resources to repay their debt.
Table 25: Household Debt and ability to repayment
Household
Debt
% AITs
having
debt
Ability to
repay
Ability of
HH
member to
repay debt
% of
household
member
having a loan
Ability of
regular
repayments
Overall 41.1% 86.4% 79.5% 16.3% 80.0%
5.2.6. Distribution of Household Expense
Table 26 below gives percentage of distribution of expenses by household needs. Majority of the
household expenses is on food items which constitute almost one third of the total expenses incurred,
followed by 14% on education. Expenses on miscellaneous needs is11% of total expenses.
Variation in expenses varies across districts. For instance, households from Multan spend 45% of
income on food needs, whereas households in Lodhran spend a relatively small portion (28% of income

End line Survey of Dairy Project
Page 25 of 58
on food items as compared to other districts. Households from Lodhran spend a significant portion
on health i.e. 27%, which is much larger than households’ investment on health in other districts.
Table 26: Distribution of household expanse
Household Needs Percent Distribution
Food 34%
Health 8%
Education 14%
Clothing / footwear 8%
Fuel and electricity 7%
Transport 8%
Communication (mobile phone,
etc.)
5%
Housing (rent & other costs) 5%
Miscellaneous 11%
5.2.7. Household Income and AIT’s Contribution
Table 27 presents estimates of household’s monthly income and AIT’s contribution. Estimates show
average monthly income of AIT’s household from non-agriculture livelihood activities is Rs. 10,971,
sale of milk is Rs. 10,419 and from agriculture is Rs. 8,386. Income of non-agriculture livelihood stands
high in its contribution to household income which is 81%. Data indicates that the revenue from AIT’s
extension services makes up a noticeable portion of non-agriculture livelihood source of households..
AIT contributes on average, more than 50% in the HH income coming from sale of milk. This is
followed by agriculture, where AITs contribute to HH income by 39%.
It is evident from data that AITs earn a considerable amount from AI extension services. As a result,
their contribution in monthly income has greatly improved. District-wise estimates reflect variations -
only 20% contribution from AITs from Bahawalpur to household income comes from sale of milk,
whereas 100% contribution is made by AITs in this district to household income through their
involvement in AI extension services as part of non-agriculture activity.
Table 27: HH monthly income and contribution of respondent (multiple responses)
Sources
of HH
income
Monthly
HH
Income
Sale of
Milk
%
Contribution
Monthly HH
Income
Agriculture
%
Contribution
Income HH
Non-
Agriculture
%
Contribution
Overall Rs. 10,419 53% Rs. 8,386 39% Rs.10,971 81%
5.2.8. Increase in HH income and Economic Security
A large majority (92%) of AITs reported an increase in household income during last year. All of AITs
from Multan and Lodhran said that their household income has increased. More than 90% said that
they are economically secured. All the AITs from Vehari and Multan said that they are economically
secure, followed by Lodhran (96%), Khanewal (84%) and Bahawalpur (80.6%).
A majority (72.7%) AITs noted that their family members take three meals in a day, whereas 27%
shared that their family members have 2 meals on a daily basis. Data reveals variation across districts.

End line Survey of Dairy Project
Page 26 of 58
For instance, all AITs in Lodhran stated that their household members take three meals in a day. On
the contrary, only 25% AITs from Khanewal reported that their family members take 3 meals a day.
5.2.9. Knowledge of Breeding of Animals
All of the consulted AITs said that they have knowledge regarding breeding of farm animals. No
noticeable variation is noticed across districts. When AITs were asked to rate their knowledge level
of both types of breeding, almost 49% reported having high level of knowledge of natural mating of
breeding and almost 48% AITs rate their knowledge of artificial insemination as high. Above forty
percent rate their knowledge moderate in both categories of breeding of animals. Across districts,
80% AITs from Lodhran in each breeding category have moderate knowledge. On the contrary, more
than 80% of AITs from Khanewal demonstrate high level of knowledge in both breeding forms.
Knowledge level regarding breeding of farm animals
Knowledge Level None Basic Knowledge Moderate High
Natural Mating 0.0% 11.8% 40.3% 47.9%
Artificial Insemination 0.0% 7.6% 43.7% 48.7%
Almost half of AITs have high level of knowledge regarding local as well as imported semen. A relatively
small portion (24%) rates their knowledge high regarding sexed semen. A slightly above one third of
AITs each reported having moderate knowledge of local, imported and sexed semen. District level
variation is not momentous with an exception of Bahawalpur where all AITs possess high level of
knowledge regarding local and imported semen.
Table 28: AIT's knowledge of type of semen
AIT Knowledge of Semen
Knowledge
Level
None Basic Knowledge Moderate High
Local Semen 2.5% 11.8% 37.8% 47.9%
Imported Semen .8% 15.1% 34.5% 49.6%
Sexed Semen 15.1% 23.5% 37.0% 24.4%
5.2.10. Livelihood Training Received by AITs
It is noted that a few AITs have received livelihood training from different institutions. For instance, 2
respondents have completed 2-years Livestock Assistant Diploma (LAD) from Agriculture University
Faisalabad, 2 have completed a 3-months course on Village Veterinary Workers (VVW) from
University of Veterinary and Animal Sciences, Lahore. Similarly, one respondent has completed one-
year Veterinary Assistant Diploma from a college and one has received 15-days training in agriculture
from an NGO. In addition, one respondent has received 15-days training on fisheries from GIZ.
5.2.11. AI Reach
The consulted AITs reported availability of AI services to farmers in target communities. For instance,
60% AITs confirmed that veterinary doctor is available for farmers, and 44% said that AITs are
providing AI services to farmers in target areas.
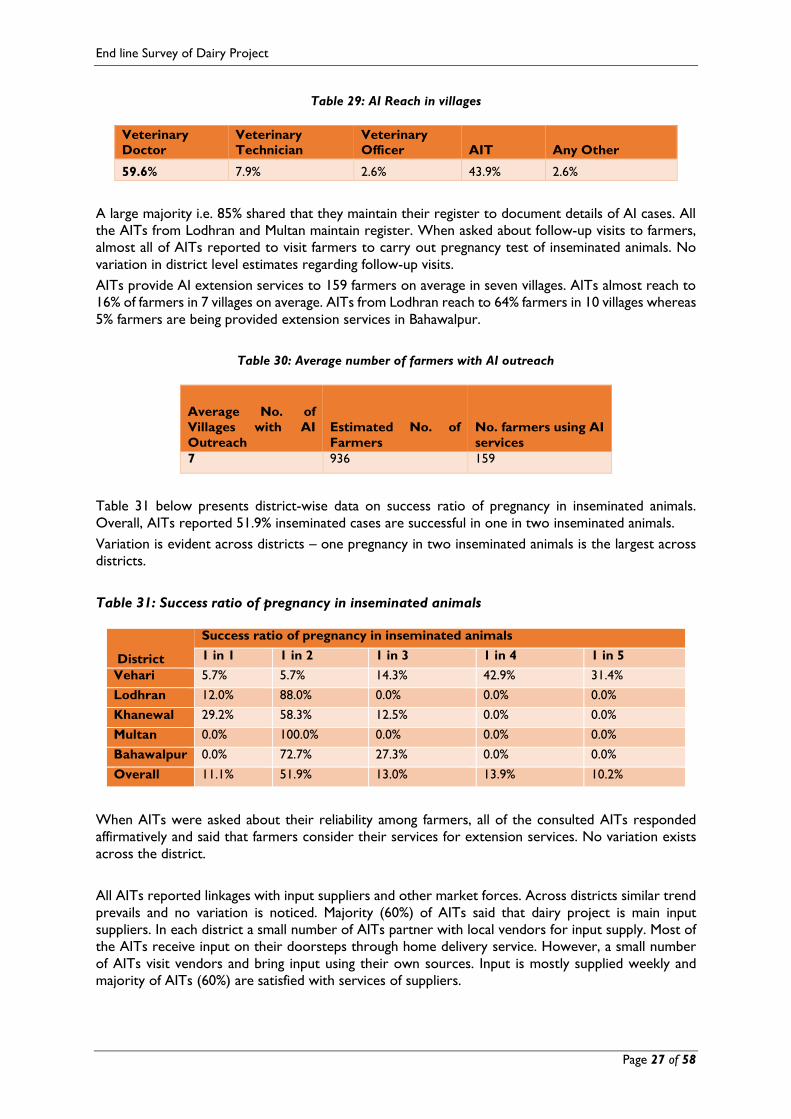
End line Survey of Dairy Project
Page 27 of 58
Table 29: AI Reach in villages
Veterinary
Doctor
Veterinary
Technician
Veterinary
Officer AIT Any Other
59.6% 7.9% 2.6% 43.9% 2.6%
A large majority i.e. 85% shared that they maintain their register to document details of AI cases. All
the AITs from Lodhran and Multan maintain register. When asked about follow-up visits to farmers,
almost all of AITs reported to visit farmers to carry out pregnancy test of inseminated animals. No
variation in district level estimates regarding follow-up visits.
AITs provide AI extension services to 159 farmers on average in seven villages. AITs almost reach to
16% of farmers in 7 villages on average. AITs from Lodhran reach to 64% farmers in 10 villages whereas
5% farmers are being provided extension services in Bahawalpur.
Table 30: Average number of farmers with AI outreach
Average No. of
Villages with AI
Outreach
Estimated No. of
Farmers
No. farmers using AI
services
7 936 159
Table 31 below presents district-wise data on success ratio of pregnancy in inseminated animals.
Overall, AITs reported 51.9% inseminated cases are successful in one in two inseminated animals.
Variation is evident across districts – one pregnancy in two inseminated animals is the largest across
districts.
Table 31: Success ratio of pregnancy in inseminated animals
District
Success ratio of pregnancy in inseminated animals
1 in 1 1 in 2 1 in 3 1 in 4 1 in 5
Vehari 5.7% 5.7% 14.3% 42.9% 31.4%
Lodhran 12.0% 88.0% 0.0% 0.0% 0.0%
Khanewal 29.2% 58.3% 12.5% 0.0% 0.0%
Multan 0.0% 100.0% 0.0% 0.0% 0.0%
Bahawalpur 0.0% 72.7% 27.3% 0.0% 0.0%
Overall 11.1% 51.9% 13.0% 13.9% 10.2%
When AITs were asked about their reliability among farmers, all of the consulted AITs responded
affirmatively and said that farmers consider their services for extension services. No variation exists
across the district.
All AITs reported linkages with input suppliers and other market forces. Across districts similar trend
prevails and no variation is noticed. Majority (60%) of AITs said that dairy project is main input
suppliers. In each district a small number of AITs partner with local vendors for input supply. Most of
the AITs receive input on their doorsteps through home delivery service. However, a small number
of AITs visit vendors and bring input using their own sources. Input is mostly supplied weekly and
majority of AITs (60%) are satisfied with services of suppliers.

End line Survey of Dairy Project
Page 28 of 58
5.2.12. AI Services and Monthly Income
Data show that, on an average, each AIT handles 7 cases using imported semen in each district on a
monthly basis. The average monthly number of conception from imported semen is reflecting 59% of
success ratio. Average number of conceived cases in Lodhran is 8 out of 10 cases, suggesting success
ratio of 75%. AITs charge i.e. Rs. 1081 per case, on an average, nevertheless, AITs in Multan charge
Rs. 1,250 per case, on average, which is highest as compared to other districts. On average, each AIT
earns Rs. 7,567 using imported semen on a monthly basis with an expense of Rs. 4,208. Across districts,
AITs in Multan earns revenue of Rs, 12,500, on an average, in a month, which is the highest across all
districts. On the contrary, AITs from Khanewal, on an average, earn slightly more than four thousand,
which is the lowest as compared to other districts.
Table 32: AIT's practices of applying imported semen and income
District
Average
Applied
per
month
Average
Conceived
Per month
%
Conceive
d
Av. Fee
Charged /
Case
(PKR)
Average
Monthly
Revenue
(PKR)
Average
Monthly
Expense
(PKR)
Vehari 10 5 46% 1145 11450 6173
Lodhran 7 5 71% 1032 7224 4706
Khanewal 4 3 69% 1066 4264 575
Multan 10 8 75% 1250 12500 3020
Bahawalpur 5 3 66% 1050 5250 2781
Total 7 4 59% 1081 7567 4208
It is evident from data that on average AITs are using local semen in 33 cases per month. AITs in
Multan reported applying local semen on 75 cases, which is highest among all districts. On the other
hand, monthly use of local semen is lowest in Khanewal and Bahawalpur (26 cases each) among
districts. On average AITs charge Rs. 377 per case using local semen with a conception rate of 70%.
On an average, AITs earns Rs. 12,441 as monthly revenue with an expense of Rs. 4,438. The average
monthly revenue of AITs from Multan is highest among all district (i.e. Rs. 20,625), with an expanse of
Rs. 4411.
Table 33: AITs' using local semen and monthly income
District
Average
Applied per
month
Average
Conceived
Per
month
%
Conception
Av. Fee
Charged /
Case
Total
Monthly
Revenue
Total
Monthly
Expense
Vehari 40 26 63% 483 19,720 4411
Lodhran 35 27 79% 340 11,900 5510
Khanewal 26 18 69% 319 8,294 4061
Multan 75 63 83% 275 20,625 1350
Bahawalpur 26 19 72% 340 8,840 4184
Overall 33 23 70% 377 12,441 4438
On average an AIT performs 48 pregnancy tests in a month and charges Rs. 86 for each test. Average
monthly revenue from pregnancy tests is Rs. 3,088 and monthly expenses are Rs. 661.Average charges
for a pregnancy test in Multan and Vehari is more than one hundred rupees which is the highest among
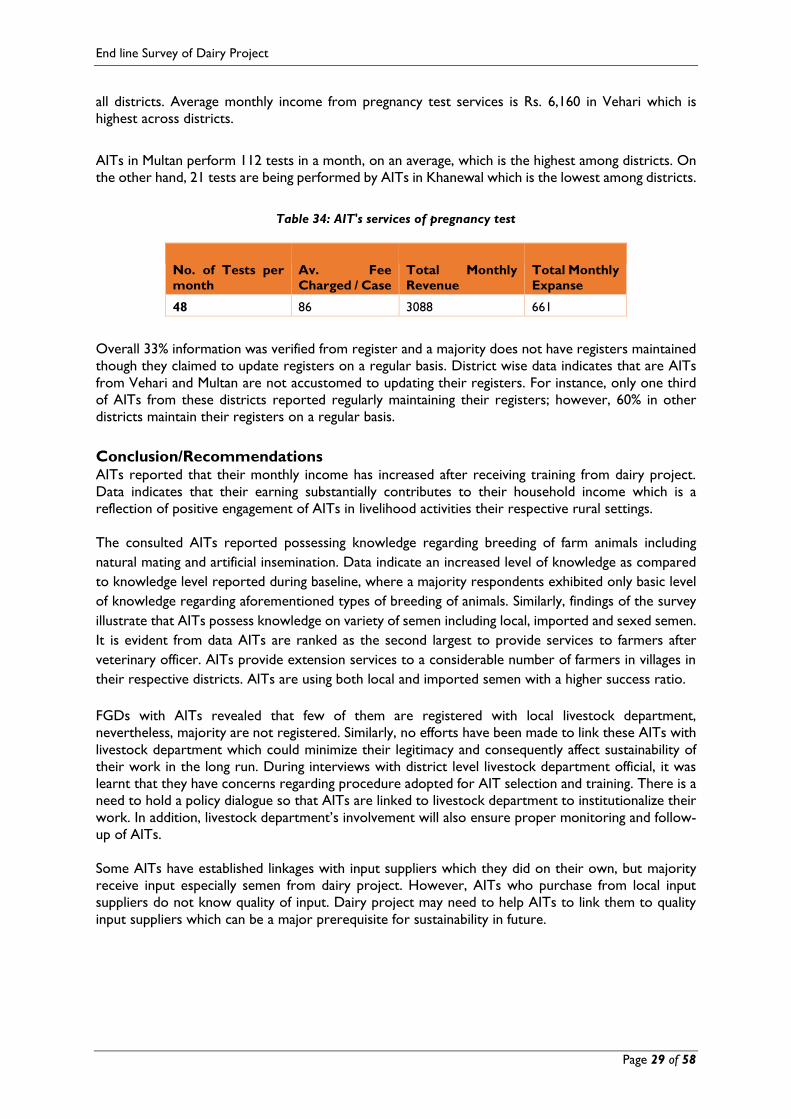
End line Survey of Dairy Project
Page 29 of 58
all districts. Average monthly income from pregnancy test services is Rs. 6,160 in Vehari which is
highest across districts.
AITs in Multan perform 112 tests in a month, on an average, which is the highest among districts. On
the other hand, 21 tests are being performed by AITs in Khanewal which is the lowest among districts.
Table 34: AIT's services of pregnancy test
No. of Tests per
month
Av. Fee
Charged / Case
Total Monthly
Revenue
Total Monthly
Expanse
48 86 3088 661
Overall 33% information was verified from register and a majority does not have registers maintained
though they claimed to update registers on a regular basis. District wise data indicates that are AITs
from Vehari and Multan are not accustomed to updating their registers. For instance, only one third
of AITs from these districts reported regularly maintaining their registers; however, 60% in other
districts maintain their registers on a regular basis.
Conclusion/Recommendations AITs reported that their monthly income has increased after receiving training from dairy project.
Data indicates that their earning substantially contributes to their household income which is a
reflection of positive engagement of AITs in livelihood activities their respective rural settings.
The consulted AITs reported possessing knowledge regarding breeding of farm animals including
natural mating and artificial insemination. Data indicate an increased level of knowledge as compared
to knowledge level reported during baseline, where a majority respondents exhibited only basic level
of knowledge regarding aforementioned types of breeding of animals. Similarly, findings of the survey
illustrate that AITs possess knowledge on variety of semen including local, imported and sexed semen.
It is evident from data AITs are ranked as the second largest to provide services to farmers after
veterinary officer. AITs provide extension services to a considerable number of farmers in villages in
their respective districts. AITs are using both local and imported semen with a higher success ratio.
FGDs with AITs revealed that few of them are registered with local livestock department,
nevertheless, majority are not registered. Similarly, no efforts have been made to link these AITs with
livestock department which could minimize their legitimacy and consequently affect sustainability of
their work in the long run. During interviews with district level livestock department official, it was
learnt that they have concerns regarding procedure adopted for AIT selection and training. There is a
need to hold a policy dialogue so that AITs are linked to livestock department to institutionalize their
work. In addition, livestock department’s involvement will also ensure proper monitoring and follow-
up of AITs.
Some AITs have established linkages with input suppliers which they did on their own, but majority
receive input especially semen from dairy project. However, AITs who purchase from local input
suppliers do not know quality of input. Dairy project may need to help AITs to link them to quality
input suppliers which can be a major prerequisite for sustainability in future.

End line Survey of Dairy Project
Page 30 of 58
5.3. Farmers
Section Summary
The sale of milk contributes the largest portion of household income i.e. Rs. 25,887 followed by
livestock Rs. 16,950, and from agriculture is Rs. 13,984. On average, farmers produce 450 liters of
milk, of which 381 liters are sold in markets on a monthly basis
Overall, 69.7% farmers reported owning Pure Sahiwal breed of cows, 58.2% farmers possess cows of
Cross/European breed and 57.7% said to own Local/Desi breed of cows. A change can be noticed as
compared to baseline figures where 60% reported owning Pure Sahiwal breed, 54% Desi/Local and
about 25% own cows of Cross European breed.
At an average, 90 percent of overall farmers claim to know about animal nutritional requirements
indicating a change in knowledge base reported during baseline where 79 % of the farmers reported
knowing animals’ nutrition requirements.
For basic health and vaccination of animals both trained local person and veterinary hospital are
available for two third of farmers in the project area, whereas 27.8% of farmers reported availability
of AITs trained by dairy project.
Above ninety percent farmers reported to have knowledge about overall benefits of best farming
practices. Between, 68-79 percent farmers knew about silage making and teat dipping. A large number
i.e. 85% also reported to de-worming their animals and 93% are vaccinating their animals. Similarly,
81% farmers are feeding their animals with Vanda. However, only 22.6% farmers are making silage
despite having greater knowledge they possess on the subject.
5.2.13. Farmer’s Level of Education
Survey results showed that 18.6% of the farmers are illiterate and have never been to school while
14.1 % completed primary and 19.1% middle level. Comparatively a larger portion (i.e. 27.4%) has
completed high school. At district level, results showed a varying degree of educational back
ground.24.6% of farmer have never been to school in Vehari; whereas 35.1% of farmers in Bahawalpur
have completed high school.
Table 35: Farmers level of education
Level of
Education
Illiterate Up to
Primary
Middle High
School
Intermediate BA/BSc MA/MSc Any
Other
Overall 18.6% 14.1% 19.1% 27.4% 12.2% 5.9% 2.7% 0.0%
5.2.14. Marital Status, age group and family size
Overall, 72% of farmers are married. Number of married farmers is the highest in Vehari and Multan
(almost 80 %) and the lowest in Bahawalpur (63 %).
Average age of farmers in the target districts is 36 years. Above half of respondents are between 30
to 49 years of age while one fourth of respondents fall in the category of 50 years or above. Proportion
of very young (up to 29 years of age) farmers is the highest (52 %) in Bahawalpur, whereas older age
farmers (50 years or above) are more prevalent (24%) in Vehari among all districts. Household size in
these districts is 9. Household size is the largest in Khanewal i.e. 10.

End line Survey of Dairy Project
Page 31 of 58
Table 36: Distribution of farmers by age group
Age
Category
Up to 19
Years
20-29
Years
30-39
Years
40-49
Years
50-59
Years
60 Years and
above
Overall 1.4% 35.1% 27.7% 17.4% 11.6% 6.9%
5.2.15. Possession of Productive Assets
Above ninety percent of farmers reported they own livestock. More than 80% farmers own land and
tools including sewing machine, washing machine, carpentry tools. A total of 30 % reported owning
Gold/silver and other precious metals. Nearly 60% reported to have cash in hand and whereas 48%
run bank accounts.
Survey results at the district level represent somewhat similar trends except Bahawalpur where only
16% have bank account as opposed to overall trend. However, farmers of this district have more cash
saving as compared to other districts.
Table 37: Farmers' possession HH productive assets
Productive Assets Overall
Savings certificates 6.30%
Livestock 96.40%
Cash savings 58.50%
Land/real estate 86.20%
Bank accounts 48.30%
Tractor/farm equipment 33.20%
Gold, silver and precious metals (including jewelry 79.30%
Other tools (e.g. sewing machine, washing machine,
carpentry tools) 87.10%
5.2.16. Possession of General Assets
Survey results showed that farmers own non-productive assets – a majority 98% reported to have
owned fans; similarly, 97% informed that they use cell phones. Likewise, more than 80% respondents
reported to own motorbikes –a main source of transportation in villages to travel to main city and
towns within district. Refrigerators and washing machines are owned by three fourth of respondents.

End line Survey of Dairy Project
Page 32 of 58
Figure 4: Farmers HH possession of general assets
5.2.17. Farmers and Household Debt
A relatively small proportion i.e. 29% of the consulted farmers has acquired debt. Of those, majority
(93.1%) of farmers said that they are able to repay the debt amount. A small number of the consulted
farmers also reported that their family members also borrowed money to meet some of their urgent
needs, however, a fairly larger number of respondents (61.8%) of them believed that their household
members are capable to repay their outstanding loan. Variation is noted across districts. Almost half
of respondents in Lodhran reported debt. On the contrary, only one fourth of respondents from each
Khanewal and Multan reported having outstanding loan.
Table 38: Farmers having debt
% of
having
debt
Ability to make
regular
repayments?
household
members able
to make
regular
repayments
Household
members
having debt
Ability to make
regular
repayments
Overall 29.1% 93.1% 48.4% 7.6% 61.8%
5.2.18. Distribution of Household Expense
On an average, a household spends Rs. 54,308 monthly on households needs including food, health,
education, clothing, transportation, housing etc. However, trends of house expense distribution vary
across districts. Farmers from Khanewal and Multan reported monthly expenses Rs. 67,092 and Rs.
66,597 respectively. Farmers from Lodhran reported Rs. 39,247 being incurred on household’s
expenses, which is the lowest as compared to other districts.
Figure 5 presents percentage of distribution of expenses by item overall. The major expense at
household level is food items on which 38 percent of household income is incurred, 11% of expenses
are taking place each on education, clothing and miscellaneous needs. During FGDs, AITs informed
that they spend on education of their siblings and children from their monthly income.
98.7%
2.0%
78.9%
97.1%
41.3%
76.9%
35.6%
37.9%
11.1%
85.5%
0.0% 20.0% 40.0% 60.0% 80.0% 100.0% 120.0%
Fan
Landline phone
Refrigerator
Cell phone
TV with dish antena
Washing machine
TV without Dish…
Bicycle
Radio
Motorcycle

End line Survey of Dairy Project
Page 33 of 58
Figure 5: Farmers: Distribution of HH expense in percentages
5.2.19. Contribution of Respondent to Monthly HH Income
Data suggests that respondent farmers are substantially contributing to household income from sale
of milk (i.e. 58%). Likewise, respondents considerably contribute to household income from non-
agriculture as well as agriculture sources of livelihood. Respondent farmers contribute 45% from non-
agriculture and 39% contribute from agriculture sources to their household income. Survey results
illustrate an improvement in farmers’ contribution to household income from sale of milk as compared
to baseline figures where 38% of contribution was reported from this source. Qualitative data also
confirms that farmers’ contribution to household income from sale of milk has increased. Farmers
noted that their milk yield has increased due to their improved farming practices resulting in increase
in their household income.
Respondent’s contribution across districts varies. For instance, in Vehari respondents contribute to
94% of monthly household income while respondent farmers from Lodhran contribute 28%, which is
the lowest across districts. Overall, respondents from Vehari contribute 87%, whereas in Multan,
respondent farmers’ contribution to their household income appears to be at lowest i.e.16%.
Table 39: Farmers: Contribution to monthly income
Income
Categories
Sale of milk Sale of Dairy
products
Agriculture Non-Agriculture
income
HH
Income
(Rs)
Contribution
(%)
HH
income
Contribution
(%)
HH
income
Contribution
(%)
HH
income
Contribution
(%)
Overall 25,087 58 9,886 8.5 7,917 39 2,526 44.7
5.2.20. Household’s Perceived Economic Conditions Overall, a majority i.e. 85.7% perceived that their household is economically secure. District-wise
perceptions present somewhat similar trends where majority of farmers reported that they are
economically secure. However, a considerable proportion (35%) from Multan is apprehensive of their
livelihood prospects and said that they are not economically secure.
37.6
7.4
11.1
11.0
9.3
7.5
3.3
1.5
11.2
0.0 5.0 10.0 15.0 20.0 25.0 30.0 35.0 40.0
Food water etc. =
Health
Education
Clothing / footwear
Fuel and electricity
Transport
Communication (mobile phone, etc.)
Housing (rent & other costs)
Miscellaneous

End line Survey of Dairy Project
Page 34 of 58
5.2.21. Household’s Nutritional Status Table 40 presents household nutritional status of the consulted farmers. A fair large number of
farmers (i.e. 68.9%) reported their households are having meals three times a day. District wise data
on nutritional status of farmers’ household presents variation. Majority (93%) of farmers from Vehari
reported taking meals three times a day, indicating better nutritional status of their households. On
the contrary, a little above one third of farmers (30.8%) from Lodhran reported taking three meals
daily, and a majority of farmers (69.2%) in this district said that they take two meals in a day.
Table 40: Farmers- HH Nutritional status
District One Two Three
Four or
Great
Vehari 0.0% 7.0% 93.0% 0.0%
Lodhran 0.0% 69.2% 30.8% 0.0%
Khanewal 0.0% 28.9% 71.1% 0.0%
Multan 4.3% 28.3% 65.2% 2.2%
Bahawalpur 0.0% 58.1% 41.9% 0.0%
Total .6% 30.2% 68.9% .3%
5.2.22. Land Ownership (Acres) Table 41 presents details of the average land holding and its utilization. Average land holding in the
project area is 11 acres of cultivatable agricultural land. Land holdings size varies slightly across
districts. Farmers each from Lodhran and Multan have 12 acres of land holding on average, whereas
farmers each from Vehari and Bahawalpur reported owning 11 acres of land, on an average.
Regarding proportion of agricultural land used for growing fodder, it was noted that more than one-
third of the agricultural land was allocated for fodder. Land allocation for fodder varies across five
districts. A large portion of land is used for fodder in Multan (50%) followed by Bahawalpur (42%).
Farmers cultivate mainly maize on their land due to the fact that they are more sensitized regarding
nutritional benefits of maize for farm animals. Farmers believe that maize serves an important
component of nutritional feed of farm animals.
Table 41: Farmers – Cultivated average agriculture land
District
Cultivatable Agricultural
Land (Acres) % Used for Fodder
Vehari 11 22.1
Lodhran 12 29.6
Khanewal 10 23.0
Multan 12 49.6
Bahawalpur 11 41.5
Total 11 33.6
5.2.23. Ownership of Animal Breed
Survey findings show that farmers own each type of animal breeds. Discussion with farmers revealed
that animal breed has greatly improved over the years. The following table shows percentage
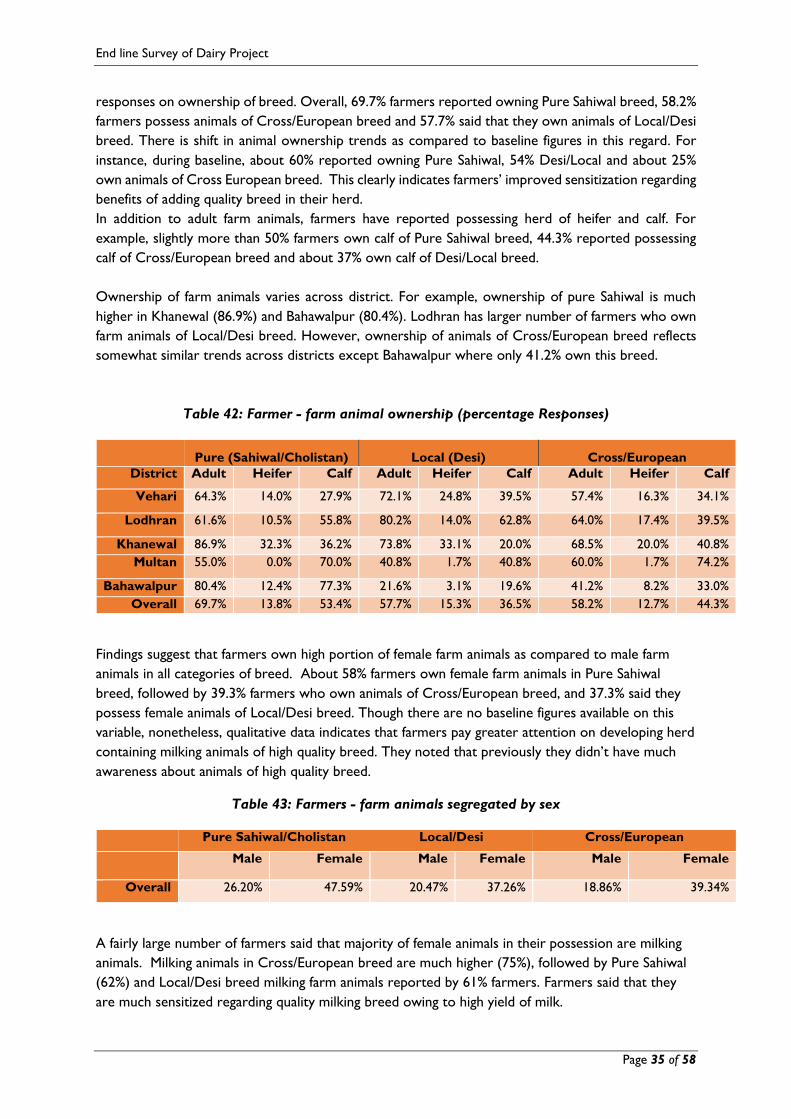
End line Survey of Dairy Project
Page 35 of 58
responses on ownership of breed. Overall, 69.7% farmers reported owning Pure Sahiwal breed, 58.2%
farmers possess animals of Cross/European breed and 57.7% said that they own animals of Local/Desi
breed. There is shift in animal ownership trends as compared to baseline figures in this regard. For
instance, during baseline, about 60% reported owning Pure Sahiwal, 54% Desi/Local and about 25%
own animals of Cross European breed. This clearly indicates farmers’ improved sensitization regarding
benefits of adding quality breed in their herd.
In addition to adult farm animals, farmers have reported possessing herd of heifer and calf. For
example, slightly more than 50% farmers own calf of Pure Sahiwal breed, 44.3% reported possessing
calf of Cross/European breed and about 37% own calf of Desi/Local breed.
Ownership of farm animals varies across district. For example, ownership of pure Sahiwal is much
higher in Khanewal (86.9%) and Bahawalpur (80.4%). Lodhran has larger number of farmers who own
farm animals of Local/Desi breed. However, ownership of animals of Cross/European breed reflects
somewhat similar trends across districts except Bahawalpur where only 41.2% own this breed.
Table 42: Farmer - farm animal ownership (percentage Responses)
Pure (Sahiwal/Cholistan) Local (Desi) Cross/European
District Adult Heifer Calf Adult Heifer Calf Adult Heifer Calf
Vehari 64.3% 14.0% 27.9% 72.1% 24.8% 39.5% 57.4% 16.3% 34.1%
Lodhran 61.6% 10.5% 55.8% 80.2% 14.0% 62.8% 64.0% 17.4% 39.5%
Khanewal 86.9% 32.3% 36.2% 73.8% 33.1% 20.0% 68.5% 20.0% 40.8%
Multan 55.0% 0.0% 70.0% 40.8% 1.7% 40.8% 60.0% 1.7% 74.2%
Bahawalpur 80.4% 12.4% 77.3% 21.6% 3.1% 19.6% 41.2% 8.2% 33.0%
Overall 69.7% 13.8% 53.4% 57.7% 15.3% 36.5% 58.2% 12.7% 44.3%
Findings suggest that farmers own high portion of female farm animals as compared to male farm
animals in all categories of breed. About 58% farmers own female farm animals in Pure Sahiwal
breed, followed by 39.3% farmers who own animals of Cross/European breed, and 37.3% said they
possess female animals of Local/Desi breed. Though there are no baseline figures available on this
variable, nonetheless, qualitative data indicates that farmers pay greater attention on developing herd
containing milking animals of high quality breed. They noted that previously they didn’t have much
awareness about animals of high quality breed.
Table 43: Farmers - farm animals segregated by sex
Pure Sahiwal/Cholistan Local/Desi Cross/European
Male Female Male Female Male Female
Overall 26.20% 47.59% 20.47% 37.26% 18.86% 39.34%
A fairly large number of farmers said that majority of female animals in their possession are milking
animals. Milking animals in Cross/European breed are much higher (75%), followed by Pure Sahiwal
(62%) and Local/Desi breed milking farm animals reported by 61% farmers. Farmers said that they
are much sensitized regarding quality milking breed owing to high yield of milk.

End line Survey of Dairy Project
Page 36 of 58
“Previously I was unable to produce high yield of milk due to the fact that I did not have quality breed of milking animals
in my herd. I was unable to earn adequate revenue and large portion of my earning would go to balance cost on
production. Out of desperation, I thought to close down dairy farming and start a new enterprise. However, due to
sensitization from staff of dairy project, I introduced milking animals of high quality breed into my herd. Soon, this
initiative started paying off my and milk production has substantially increased resulting in increase in revenue which
ultimately contributed to my household income”
-A farmer from Lodhran who owns a model dairy farm.
Table 44: Farmers - Status on Milking and Dry Animals
Animal Breed
Number of
Farmers having
female animals
Percentage of
farmers having
milking animals
Percentage of farmers
having dry animals
Pure Sahiwal 269 62% 38%
Local/Desi 212 61% 39%
Cross/European 226 75% 25%
5.2.24. Monthly Income from Farmer’ Livelihood Activities
Milk production is the main income source for majority of farmers with the fact that majority of
farmers are engaged in this activity for their livelihood. On average, farmers produce 450 liters of
milk, of which 381 liters are sold in markets on a monthly basis. Average monthly household income
from milk is Rs. 25,087 with an expense of Rs. 11,819. The consulted farmers shared during FGD that
their yield of milk has increased owing to improved feed, shed improvement, and disease control.
“I had 12 milking animals, but milk yield was not which adequate resulting in lesser revenue. I was oblivious of
modern dairy farming techniques and mainly relied on same orthodox outdated practices. When I attended training
organized by diary project, I learnt many meaningful skills of taking care farm animals. I have acquired skills and
knowledge regarding benefits of nutritional feed on growth of animals and milk yield. In addition, I came to know
how to look after animals. This training has given us an impetus to understand animals’ health conditions. I am
happy that milk yield has increased and I am able to save Rs.600-700 on a daily basis”
- A farmer from Vehari.
Production of butter seems to be less prevalent since only 39 farmers reported processing butter
production with a monthly average of 2.4 kilograms. A considerable number (i.e. 157) farmers
reported selling dry animals with an average of 3 animals in a year making a handsome amount (i.e. Rs.
95,333) yearly on an average. Similarly, 172 farmers said that they are also engaged in agriculture
activities including production of crops, fodder, manure/straw and earn a considerable revenue yearly
(i.e. Rs. 166,605) on average.
Table 45: Farmer - production and income of dairy and agriculture
Description
Quantity
Produced
(kg/liters)
Quantity
Sold
(kg/liters) Income Expense N
Milk(Monthly) 450 381 25,087 11,819 450

End line Survey of Dairy Project
Page 37 of 58
Description
Quantity
Produced
(kg/liters)
Quantity
Sold
(kg/liters) Income Expense N
Butter & Ghee
(Monthly) 2.4 2 6,900 2123 39
Dry Animals(Sale)
(Yearly) 3 2 95,333 48868 157
Calf Sale(Yearly) 3 2 48,933 25151 105
Milking Animals
(Yearly) 2 2 59,555 16993 42
Others e.g.
Agriculture, Fodder,
Manure, Wheat
Straw etc.)
(Seasonal)
224 210 166,605 81119 172
5.2.25. Fodder Used During summer season, 97 % of the farmers are using cultivated fodder for farm animals, followed by
Vanda which is used by almost by 81% of farmers. Similarly, 80% farmers are using dried fodder during
summer season. (80%). Almost same trends are noticed in winter seasons. For instance, 95.6% farmers
reported using cultivated fodder, 78% Vanda and 80.5% are using dried fodder during winter season.
A considerable number of farmers used ‘Khal’ as fodder during both seasons. Farmers also use silage
during both seasons – 17% in summer and 22% in winter. Discussion with farmers revealed that training
has sensitized them regarding importance of nutritional feed and its benefits
Training and ongoing technical support from dairy project has increased my awareness regarding benefits of
nutritional feed. Owing to support, we have learnt how to process and make nutritional feed like silage and Vanda.
We came to know that nutritional feed increases animal’s growth and milk yield. Practically speaking, milk yield of my
farm milking animal has increased substantially owing to use of nutritional feed. -A 43 years farmer from Vehari
Comparing to baseline figures on usage of silage and Vanda, end-line survey results depict an
improvement e.g. during baseline 50% farmers reported using Vanda as animal feed, whereas during
time of end-line, 80% farmers said that they use Vanda. Likewise, during baseline little more than 5%
farmers reported using silage, whereas 17-22 percent farmers reported use of silage as feed during
this survey.
Table 46: Farmers – use of fodder
Type of
Fodder
Cultivated
Fodder
Collected
Fodder
Purchased
Fodder
Grazing Khal Vanda Silage Nutrition
Mix
Dried
Fodder
Summer 97.2% 13.9% 12.2% 11.7% 76.0% 81.3% 16.6% 35.8% 80.4%
Winter 95.6% 13.6% 13.5% 9.1% 75.0% 78.0% 21.7% 42.2% 80.5%
5.2.26. Knowledge of Animal’s Nutrition Requirement Figure 6 below present’s data on farmers’ knowledge of animal’s nutrition requirement. On average,
90% farmers know animal’s nutritional requirements – an improvement in knowledge as compared to
baseline figures where 79% of the farmers knew animals’ nutrition requirements. Similar trends
pertaining to farmers’ knowledge are noticed across districts except Bahawalpur- farmers where 58%
farmers said that they know about animal’s nutritional requirements.

End line Survey of Dairy Project
Page 38 of 58
Figure 6: Farmers Knowledge of animal nutrient
5.2.27. Facilities Available for Basic health of Farm Animals
Data suggest that local trained persons and veterinary hospitals are available for almost one third of
farmers for providing services with regard to basic health and vaccination of animals. As opposed to
trends during baseline, services of AITs and WLEWs are also available for farmers. About 27.8%
consulted farmers reported availability of AITs and very nominal number (5%) said that services of
WLEWs are available. Discussion with farmers revealed that WLEWs do not reach to farmers due to
cultural constraints and they serve farmers live in their close vicinity. Some of farmers go to dispensary
or veterinary hospital since they treat their animals free of cost, whereas WLEWs charge a fee for
vaccination or treatment.
Table 47: Facilities of basic health of farm animals (multi responses)
Type of
Services
Self By a local
trained
Person
Local
Dispensary
Veterinary
Hospital
WLEWs AITs Any other
Overall 11.7% 32.3% 25.6% 32.7% 5.0% 27.8% 4.5%
5.2.28. Livestock Common Diseases
On average, two animals each from pure Sahiwal, one from local breed and three animals from cross
breed suffered from disease during the last one year. Variation across districts is not significant except
Bahawalpur where, on average, five animals were suffered from diseases.
Framers reported that 4 animals of pure breed, 5 animals of local breed and 6 animals of cross breed
got vaccinated during last one year. This shows a slight improvement in vaccination trend during
baseline where farmers reported 3.7 animals of pure breed, 2.2 animals of local breed and 2.4 animals
of cross breed received vaccination. Haemorrhagic Septicaemia and foot and mouth diseases are
reported by farmers as common diseases.
5.2.29. Breeding Practices A majority (84%) reported using artificial insemination as an approach for animal breeding showing a
significant change in the trend recorded during baseline where 45% reported using artificial
insemination for breeding of animals. Responses showed a considerable number (60%) of farmers are
96.9% 98.8%93.6% 96.5%
58.6%
90.0%
0.0%
20.0%
40.0%
60.0%
80.0%
100.0%
120.0%
Vehari Lodhran Khanewal Multan Bahawalpur Overall

End line Survey of Dairy Project
Page 39 of 58
also using natural mating as approach for breeding of their animals. A few farmers also reported use
of embryo transfer for breeding. Similar trends are noticed across districts.
Figure 7: Farmer -breeding approaches in use
5.2.30. AIT Service Availability Majority of farmers consulted said that they are well aware regarding importance of artificial
insemination technique for breeding of their animals. Similarly, they are well aware of presence of
trained artificial insemination technicians. More than half of farmers reported availing AI services in
their respective locations. Proportion of responses (i.e. 63.4%) of availability of AI technicians is notably
higher than the proportion of responses documented during baseline which said 53% of farmers were
aware of presence of AITs in their areas.
A large number of farmers (72%) from Vehari said that they are availing services of AI, whereas
comparatively a lower portion (41%) from Bahawalpur reported availing services of AI.
Figure 8: Farmer - availability of AI services
5.2.31. Satisfaction with the Animal Health Services
Almost 58% farmers said they are highly satisfied with available animal basic health services (12.6%
extremely satisfied, 45% very satisfied). This trend showed a significant increase in perceptions of
farmers as compared to their responses during baseline where only 9 percent of farmers showed a
high level of satisfaction with basic health services and vaccination of animals. One third of farmers is
somewhat satisfied with animal health services and 8% percent farmers appear not to be satisfied with
services available in the area. Variation is noticed across districts; above 70% farmers from Multan and
Vehari reported high level of satisfaction, whereas majority of farmers (61%) from Bahawalpur
reported little satisfaction on animal health services.
60.0%
83.9%
1.7%
0.0% 10.0% 20.0% 30.0% 40.0% 50.0% 60.0% 70.0% 80.0% 90.0%
Natural Matting
Artificial Insemination
Embryo Transfer
3.7% 4.3%
37.7%
63.4%
Availability of AI Services (Multiple Responses)
AI Center AI Clinic Veterinary Hospital AI Technician

End line Survey of Dairy Project
Page 40 of 58
Table 48: Farmer- satisfaction on animal health services
Ranking
categories
Extremely
satisfied
Very
satisfied
Somewhat
satisfied
Not very
satisfied
Not at all
satisfied
Overall 12.6% 45.0% 33.2% 6.6% 2.7%
5.2.32. Satisfaction with the Breeding Services
Likewise, above half of respondents showed their satisfaction (12.6% extremely satisfied, 45.7% highly
satisfied) indicating a significant increase in satisfaction level of farmers as compared to baseline where
only 11.6% farmers showed high level of satisfaction on available breeding services.
Level of satisfaction on breeding services varies across districts; almost 76% farmers from Vehari and
72% of the farmers from Multan expressed high level of satisfaction on breeding services. Nevertheless,
60% farmers in Bahawalpur expressed a somewhat satisfaction on breeding services available in the
area.
Table 49: Farmer- satisfaction with breeding services
Ranking
categories
Extremely
satisfied
Very
satisfied
Somewhat
satisfied
Not very
satisfied
Not at all
satisfied
Total 12.6% 45.7% 33.5% 6.0% 2.2%
5.2.33. Knowledge and Use of Farm Practices Table 50 presents details of knowledge and use of farmer practices. A large majority, above ninety
percent farmers reported to have high level knowledge about vaccination, natural mating, de-worming,
benefit of free water access to animals, Vanda feeding, AI using imported and local semen. Similarly,
considerably larger portion (68-79 percent) farmers know about silage making and teat dipping. Level
of knowledge in farmers about most of farming practices has significantly improved during the last one
year. Farmers level of knowledge regarding silage making, benefit of free water access to animals and
shed improvement has significantly improved as compared to baseline finding where 38% had
knowledge of silage making, 64% knew benefits of free water access and 42% had knowledge of shed
improvement.
Mostly farmers reported using their knowledge and carry out farming practices. A large number i.e.
85% reported they are de-worming and 93% are vaccinating their animals – a slight improvement as
compared to baseline trends (i.e. 81% de-worming, 84% vaccination). Similarly, 81% farmers are feeding
their animals with Vanda reflecting a substantial improvement as compared to baseline trends where
only 58% said that they are using Vanda for animal feeding. However, only 22.6% farmers are making
silage despite having greater knowledge they possess on the subject, displaying a slight improvement
as compared to baseline figures where only 15% farmers reported making silage to feed animal.
Nevertheless, farmers are using artificial insemination techniques using both imported (76.7%) and
local semen (80%) – a considerable improvement against baseline trends where a slightly more than
half of farmers were using AI techniques.
Across districts, both knowledge and use of farm practices are somewhat similar except Bahawalpur
where only slightly less than half of farmers reported not having knowledge of silage making, de-
worming and shed improvement.

End line Survey of Dairy Project
Page 41 of 58
Table 50: Farmer-knowledge of farm practices
Farm Practices Knowledge Practice
De-worming 91.1% 85.2%
Vaccination 98.7% 92.9%
Silage Making 78.3% 20.6%
Free Water Access to Animals 94.8% 75.2%
Shed Improvement (fencing, model construction) 78.7% 30.4%
Vanda feeding to animals 97.2% 81.0%
Teat dipping 67.6% 45.8%
Natural Mating 96.1% 79.7%
Artificial Insemination using Imported Semen 92.5% 76.7%
Artificial Insemination using Local Semen 95.6% 80.1%
Data recording of farm animals 76.2% 38.3%
5.2.34. Reasons for Farmers’ Inability to Use Farming Practices
Below table-51 shows reasons highlighted by farmers for not using farming practices. Farmers who do
not use de-worming practices – 64% of them said that they do not have enough information, whereas
33% are of the view that they are satisfied with traditional methods of vaccination. 24% of the consulted
farmers don’t ensure free water access to animals owing to their belief on traditional methods. 35%
farmers reported not having enough resources for silage-making. Of those farmers who don’t prefer
Vanda and opt for traditional methods of feeding, said that Vanda feeding is too costly. About 63% of
farmers of those who do not practice data recording said that they do not have enough time to carry
out this activity.
Table 51: Farmers - inability to follow farm practices
Farm Practices Satisfied
with
traditional
methods
Too
Costly
Small land
to
implement
Not
enough
time
Not
enough
resources
Not enough
Information
Any
Other
De-worming 3.0% 4.5% 0.0% 6.0% 19.4% 64.2% 3.0%
Vaccination 33.3% 19.0% 9.5% 4.8% 14.3% 14.3% 4.8%
Silage Making 7.1% 30.6% 5.6% 7.5% 35.4% 12.3% 1.5%
Free Water Access
to Animals
23.6% 12.4% 28.1% 11.2% 16.9% 4.5% 3.4%
Shed Improvement
(fencing, model
Construction
8.6% 34.9% 14.1% 4.3% 23.9% 12.9% 1.2%
Vanda feeding to
animals
28.1% 32.8% 6.3% 4.7% 9.4% 14.1% 4.7%
Teat dipping 13.6% 13.6% 0.8% 20.0% 1.6% 42.4% 8.0%
Natural Mating 9.8% 7.3% 0.0% 0.0% 41.5% 8.5% 32.9%
Artificial
Insemination using
Imported Semen
33.3% 13.3% 1.1% 1.1% 10.0% 28.9% 12.2%
Artificial
Insemination using
Local Semen
36.3% 8.8% 0.0% 1.1% 9.9% 19.8% 24.2%
Data recording of
farm animals
7.3% 4.1% 0.0% 63.5% 8.2% 13.7% 3.2%

End line Survey of Dairy Project
Page 42 of 58
5.2.35. Services of Silage Making
Slightly more than half of consulted farmers (56%) reported participating in silage show. Farmers also
informed availability of silage making technician in some of areas. However, only 18.9% farmers said
that they are using services of silage making technician. Farmers’ participation in silage show is much
higher in Lodhran (69.8%), followed by Vehari and Multan (60% each). Only one third of farmers from
Bahawalpur said that they participated in silage show.
Of those who avail services of silage making technician – a fair majority 62.8% showed satisfaction with
the work of silage making technician. However, level of responses pertaining to satisfaction level on
services of silage making technician vary across districts. Almost all of farmers from Bahawalpur are
satisfied with Silage Making Technician, nonetheless, only 20% farmers in Bahawalpur seem satisfied
with the services offered by the technician.
Table 52: Farmer - silage making practice
Districts
Percentage of
farmers
participated in
silage show
Percentage of farmers Using
services of the Silage Making
Technician
Level of satisfaction
regarding Silage
Making Technician
Vehari 61.4% 18.8% 44.6%
Lodhran 69.8% 12.1% 63.6%
Khanewal 52.0% 8.3% 53.8%
Multan 61.0% 37.3% 95.7%
Bahawalpur 34.1% 8.2% 20.0%
Overall 55.9% 18.9% 62.8%
5.2.36. Increase in Income after Dairy Project Training
A large majority of farmers (87%) reported an increase in their income after receiving training in dairy
farming. Almost of all of the farmers in Multan and 94% in Lodhran and 90% in Khanewal noted an
increase in their income. However, 20-25% farmers from Bahawalpur and Vehari reported either
decrease or no change in their income after receiving training in dairy.
Table 53: Farmer - change in income
District Income
Increased
Income
Decreased
No
Change
Vehari 81.1% 1.9% 17.0%
Lodhran 93.8% 3.7% 2.5%
Khanewal 90.3% 5.8% 3.9%
Multan 95.5% 4.5% 0.0%
Bahawalpur 75.3% 9.4% 15.3%
Overall 87.2% 5.1% 7.7%
Data indicates variation in responses of farmers regarding change in their income after training. For
instance, 31.8% farmers reported an increase in monthly income up to Rs.1000, whereas 19.9%

End line Survey of Dairy Project
Page 43 of 58
reported Rs. 1000-2000. Almost same number of farmers noted that their monthly income has
increased more than Rs.5000. Across districts, 67% farmers from Bahawalpur fall in the first category
of income increase (up to 1000), whereas considerable number of farmers from Vehari (34%) reported
an increase in monthly income above Rs. 5000. Similarly, 25% farmers from Multan reported an
increase in income between Rs. 4000-5000 and 23% of farmers in this district reported increase in
income more than Rs. 5000.
Figure 9: Farmer - Change in income after training
5.2.37. Dairy Project Information to Farmers
A large majority 94% of farmers had heard/watched about programs on dairy farming. Across district,
similar trends are reported. Farmers considered the main source of information on dairy farming and
the project was through social mobilizer, reported by 79% farmers. Almost 26% reported leaflets and
pamphlets as sources of information regarding programs on dairy project. Farmers who have
heard/seen program through social mobilizers are 93% from Khanewal 92% from Bahawalpur and 83%
from Lodhran, whereas only 51% farmers from Multan have heard such program through social
mobilizers. Farmers shared during FGDs that dairy project’s social mobilizers and livestock experts
often would visit them and provided information about dairy project. In addition, aforementioned staff
from dairy project also discussed issues on fodder, animal’s health, sale of milk and related matters.
31.8%
19.9%
10.8%
7.1%
11.4%
19.0%
Rs. 0-1000
Rs. 1000-2000
Rs. 2000-3000,
Rs.3000-4000
Rs.4000-5000
Above Rs.5000
0.0% 5.0% 10.0% 15.0% 20.0% 25.0% 30.0% 35.0%
Level of Increase in Monthly Income After Training
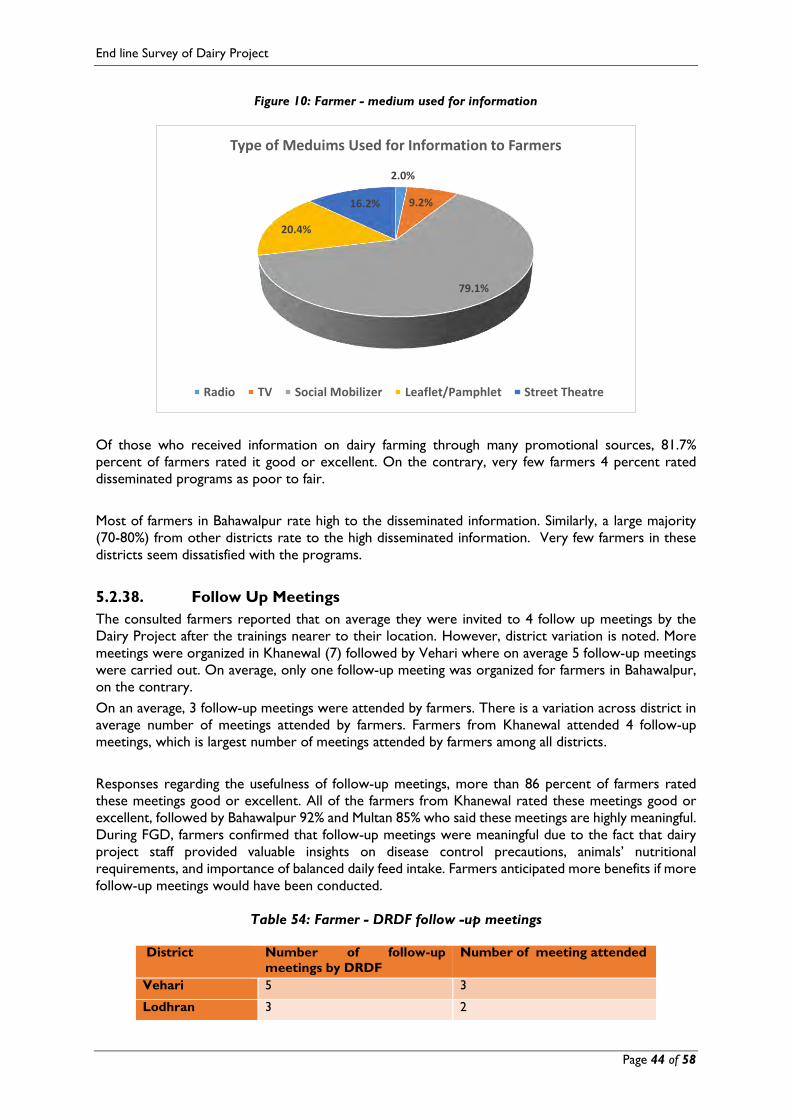
End line Survey of Dairy Project
Page 44 of 58
Figure 10: Farmer - medium used for information
Of those who received information on dairy farming through many promotional sources, 81.7%
percent of farmers rated it good or excellent. On the contrary, very few farmers 4 percent rated
disseminated programs as poor to fair.
Most of farmers in Bahawalpur rate high to the disseminated information. Similarly, a large majority
(70-80%) from other districts rate to the high disseminated information. Very few farmers in these
districts seem dissatisfied with the programs.
5.2.38. Follow Up Meetings
The consulted farmers reported that on average they were invited to 4 follow up meetings by the
Dairy Project after the trainings nearer to their location. However, district variation is noted. More
meetings were organized in Khanewal (7) followed by Vehari where on average 5 follow-up meetings
were carried out. On average, only one follow-up meeting was organized for farmers in Bahawalpur,
on the contrary.
On an average, 3 follow-up meetings were attended by farmers. There is a variation across district in
average number of meetings attended by farmers. Farmers from Khanewal attended 4 follow-up
meetings, which is largest number of meetings attended by farmers among all districts.
Responses regarding the usefulness of follow-up meetings, more than 86 percent of farmers rated
these meetings good or excellent. All of the farmers from Khanewal rated these meetings good or
excellent, followed by Bahawalpur 92% and Multan 85% who said these meetings are highly meaningful.
During FGD, farmers confirmed that follow-up meetings were meaningful due to the fact that dairy
project staff provided valuable insights on disease control precautions, animals’ nutritional
requirements, and importance of balanced daily feed intake. Farmers anticipated more benefits if more
follow-up meetings would have been conducted.
Table 54: Farmer - DRDF follow -up meetings
District Number of follow-up
meetings by DRDF
Number of meeting attended
Vehari 5 3
Lodhran 3 2
2.0%
9.2%
79.1%
20.4%
16.2%
Type of Meduims Used for Information to Farmers
Radio TV Social Mobilizer Leaflet/Pamphlet Street Theatre
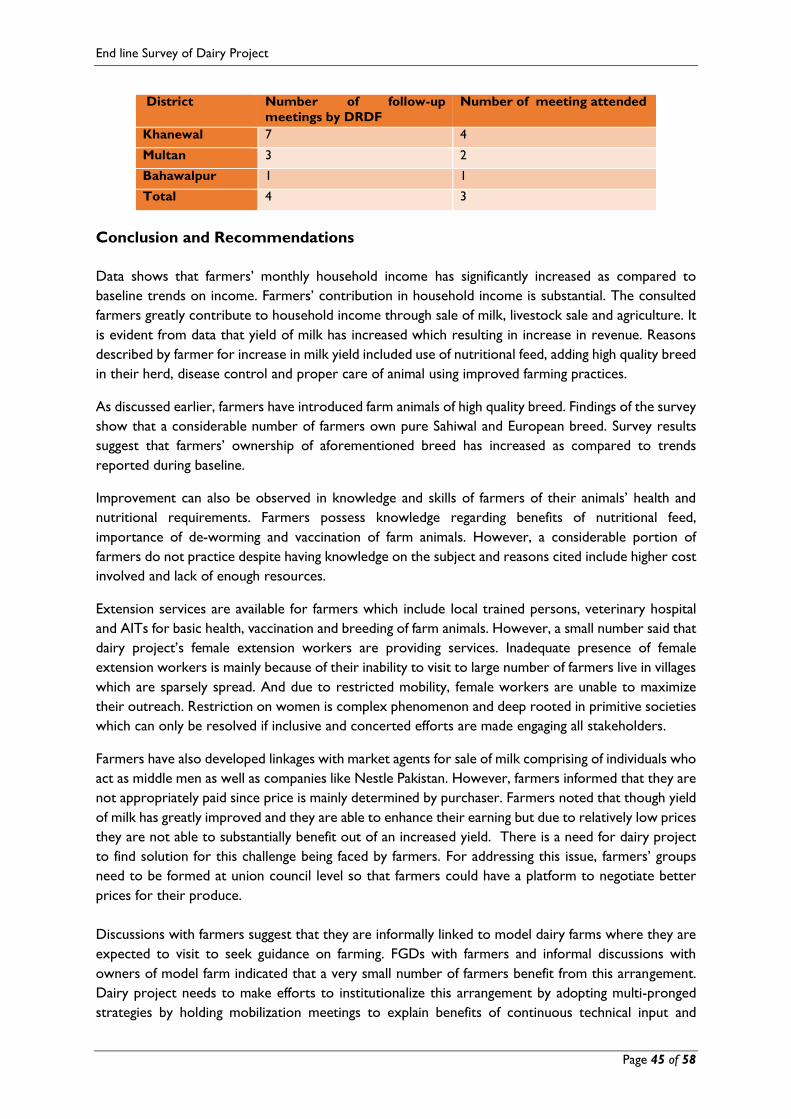
End line Survey of Dairy Project
Page 45 of 58
District Number of follow-up
meetings by DRDF
Number of meeting attended
Khanewal 7 4
Multan 3 2
Bahawalpur 1 1
Total 4 3
Conclusion and Recommendations
Data shows that farmers’ monthly household income has significantly increased as compared to
baseline trends on income. Farmers’ contribution in household income is substantial. The consulted
farmers greatly contribute to household income through sale of milk, livestock sale and agriculture. It
is evident from data that yield of milk has increased which resulting in increase in revenue. Reasons
described by farmer for increase in milk yield included use of nutritional feed, adding high quality breed
in their herd, disease control and proper care of animal using improved farming practices.
As discussed earlier, farmers have introduced farm animals of high quality breed. Findings of the survey
show that a considerable number of farmers own pure Sahiwal and European breed. Survey results
suggest that farmers’ ownership of aforementioned breed has increased as compared to trends
reported during baseline.
Improvement can also be observed in knowledge and skills of farmers of their animals’ health and
nutritional requirements. Farmers possess knowledge regarding benefits of nutritional feed,
importance of de-worming and vaccination of farm animals. However, a considerable portion of
farmers do not practice despite having knowledge on the subject and reasons cited include higher cost
involved and lack of enough resources.
Extension services are available for farmers which include local trained persons, veterinary hospital
and AITs for basic health, vaccination and breeding of farm animals. However, a small number said that
dairy project’s female extension workers are providing services. Inadequate presence of female
extension workers is mainly because of their inability to visit to large number of farmers live in villages
which are sparsely spread. And due to restricted mobility, female workers are unable to maximize
their outreach. Restriction on women is complex phenomenon and deep rooted in primitive societies
which can only be resolved if inclusive and concerted efforts are made engaging all stakeholders.
Farmers have also developed linkages with market agents for sale of milk comprising of individuals who
act as middle men as well as companies like Nestle Pakistan. However, farmers informed that they are
not appropriately paid since price is mainly determined by purchaser. Farmers noted that though yield
of milk has greatly improved and they are able to enhance their earning but due to relatively low prices
they are not able to substantially benefit out of an increased yield. There is a need for dairy project
to find solution for this challenge being faced by farmers. For addressing this issue, farmers’ groups
need to be formed at union council level so that farmers could have a platform to negotiate better
prices for their produce.
Discussions with farmers suggest that they are informally linked to model dairy farms where they are
expected to visit to seek guidance on farming. FGDs with farmers and informal discussions with
owners of model farm indicated that a very small number of farmers benefit from this arrangement.
Dairy project needs to make efforts to institutionalize this arrangement by adopting multi-pronged
strategies by holding mobilization meetings to explain benefits of continuous technical input and
End line Survey of Dairy Project
Page 46 of 58
initiating more trainings to improve capacities of farmers who manage model dairy farms. These
trainings could be specialized training of trainers. This will be instrumental in enhancing the trust among
farmers.
Survey results show that farmers possess knowledge regarding benefits of silage and Vanda but
majority are reluctant to process and make the aforementioned feed. Farmers believe that process of
silage and Vanda making is expensive and they do not have ample resources. This can be addressed by
forming farmers’ enterprise groups in order mobilize them for resource sharing. A few successful
instances elsewhere can be instrumental for learning.

End line Survey of Dairy Project
Page 47 of 58
6. Learning from Dairy Development Project Dairy Development Project was initiated on the basis of under mentioned three major lessons from
the previous experiences in the field of dairy development in Pakistan.
i. Livestock is an integral component of national economy in terms of its share in Gross
Domestic Production (GDP) and nutrition. It follows that increased productivity in
livestock sector can upturn GDP and, at the same time, enhance socio economic
conditions of people living below the poverty line.
ii. Skills and capacity enhancement of farmers plays vital role in improving the services in
livestock sector which, ultimately, results in better production of yield i.e. milk as well as
related dairy products and meat.
iii. Women constitute more than half of our population and they play a central role in agro
and livestock-based economy. Their share, however, remains unrecognized. Secondly, it
was also learnt, from previous projects, that the key to structural empowerment of
women lies in women’s freedom from economic subjugation which they can win through
their income-generation activities.
Keeping the abovementioned lessons in mind, dairy development initiative was started with the right
step in the right direction: empowerment of women through skill development. The project also
engaged women as livestock workers, small entrepreneurs and social mobilizers. The initiative was
also taken for including training program for men too. These training programs were focused on
Artificial Insemination, Livestock Farm Management and on the question of improvement in the on-
going phase of the project.
During the on-going phase, the project team learnt these key lessons:
1. Sharing information is key for better coordination among stakeholders
The project engaged numerous partners and stakeholders from Public- private sectors, NGOs, CBOs
and community members. Though it was challenging to take along all the stakeholders with diverse
stakes and interests in the project; the project team managed to do it by adopting participatory
approach. During the project implementation and community engagement phase, it was learnt that
sharing rather than concealing the information is key to trust building. This sharing of information plays
key role in reducing trust-deficit which naturally exists in the beginning of the project. Once the trust
is built, it promises better coordination which brings about desired results and developmental
outcomes. As result of help and assistance from stakeholders and partners; the project overachieved
the targets within the due timeframe and viable resources.
2. Learning is reciprocal process
The project engaged University of Veterinary & Animal Sciences (UVAS) as training institute. Through
the project, the faculty got an opportunity to know the ground realities at close quarters through
coming into direct connection with the rural communities and farmers. The faculty also had a chance
to relate their academic knowledge with the realities of the field. By this time, the faculty acknowledges
that learning is a never-ending process and they must remain in contact with the agro and livestock-
based workers in the field. Now, there is realization that through consecutive engagement; they can
upgrade their learning and find workable solutions to the problems faced in the field.
3. More to be done in livestock sector

End line Survey of Dairy Project
Page 48 of 58
There are 6.500 million small farmers in Punjab; so a single project cannot reach to all the small scale
farmers in one go. The efforts are still little and less as compared to huge needs and demands of the
community at village level. For economic growth and social uplift, more efforts are required and more
work is needed to be done.
4. Better management improves the quality
Usually the training of 9-12 months is required for Artificial Insemination Technicians (AITs). However,
the Dairy Project trained its AITs in one month which was expended to six months later on as regular
requirement. About the quality of the training the UVAS is of the opinion that the better management,
implementation and integration of all stakeholders in the project yielded even better results in training
of less duration as compared to the training which are provided in 9-12 months.
5. Small farmers are backbone of the economy
In Pakistan the landholding is comparatively smaller and its reason is fragmentation of land. Therefore,
it is always challenging to reach out the smaller farmers in far flung areas. But once the small farmers
were approached and engaged; it resulted in increased productivity and profitability is enhanced and
it directly benefits the households at grassroots level. The small farmers which constitute 7.6 million
households and almost 50.00 million individuals are the half of the population in Punjab. So, improving
the conditions of these farmers amounts to improving the economy of the province.
6. A regulatory mechanism brings efficiency in the services of AIs.
The Provincial Government brought training and services for the Artificial Inseminators (AIs) under
a regulatory framework through a policy. The training delivery and examination for passing out trainees
was standardized with a database of successful service providers. This act of provincial government
improved the efficiency and efficacy in the services of AIs in the sector. The AIs are bound to ensure
Insemination of the promised breed. In case of failure; the AIs are taken to task by provincial authorities
with penalties like fines and cancellation of their licenses. During the process of standardization, it was
learnt that the regulations resulted in improved efficiency and efficacy of the services.
7. The community organizations and clusters are the key to success
In Pakistan the small farmers make a major portion of rural economy. The small farmers, however, do
not afford to adopt best practices at their own. For introduction and sustainability of best practices in
farming and dairy sector, each and every farmer needs to be approached and engaged in the
participatory development process. To reinforce the success stories and promote best practices; the
community organizations and clusters of farmers played a key role of a shared platform where smaller
farmers can participate on equal basis. Initially, the project did not encourage the community
organizations and clusters to avoid unnecessary pressure groups and power politics. Later on, it was
learnt that the community organizations are instrumental for promoting collective businesses like
supply of inputs i.e. medicines, semen, fodder and fertilizers along with selling dairy products. Dairy
and Rural Development Foundation (DRDF), after success of a few such organizations by the Dairy
Project, now plans to form at least 1000 organizations all across the Punjab.
8. Participation of women cannot be assured without removing the social barriers in the
society:
Women play a key role in agriculture sector by managing livestock at household level and processing
dairy products. Keeping their important role in view, DRDF took women empowerment initiative by

End line Survey of Dairy Project
Page 49 of 58
ensuring their equal participation in services delivery in livestock and dairy sector. With passage of
time, it was realized that the women’s participation could not be ensured to the mark if their mobility
is restricted for socio-religious reasons. It was felt that until all the structural factors, which restrict
their mobility, are not removed; their full participation in services delivery cannot be ensured. From
collecting to selling milk, processing products and supplying fodder as well as treatment of animals, the
women in rural areas are always dependent upon their male relatives. Therefore, there is dire need
of shifting gender roles when it comes to service delivery and more.
9. Training is not an event it is a lifetime learning process
Training or skill development is not a one-time activity or an event but it is a lifelong journey. The
learning process never ends in life; so we cannot leave people after training, without refresher courses
and continuous engagement, in a particular skill, behavior and knowledge. A follow up is needed on
regular basis so that trainees must be equipped with new technological inventions and fresh
information. On realizing this, DRDF has decided to become permanent training institute for the
farmers to 1) facilitate follow up, 2) share new knowledge and 3) introducing best practices in the field.
10. Multi-disciplinary team is key to success of a development project
Dairy Project was implemented by a multi-disciplinary teamand diverse groups of people from
development sector and from corporate sector with relevant knowledge of social dynamics and
required skills. The team was efficient in conducting regular meetings, meeting the deadlines and
providing equal opportunities to the job seekers with appropriate skillset. Running a project with
such a team with diverse educational and professional backgrounds helped us achieve more than what
we were initially looking for.
11. During implementation successful components need to be scaled up
A project always starts to achieve some targets and translate certain outcomes into reality. The ground
realities, however, unfolded themselves during implementation phase and things were to be rearranged
accordingly. The project must be open to pick and scale up the successful components for greater
benefit of both direct and indirect beneficiaries and stakeholders of the project. In Dairy Development
Project the component of clustering the communities was one of the vital components, as it engaged
a wide range of stakeholders, needs to be picked and scaled up for social uplift and greater good of
great number of people.
12. Earning by women is spent on family wellbeing
While working with women and engaging them in income-generation activities; it was learnt that the
income generated by women is spent on family wellbeing as compared to that earned by men. Usually
50% of income earned by men comes to home after it has been spent on personal needs like cigarettes
and even drugs, in certain cases. The income by women, on the other hand, is spent on health and
educational needs of children. It has also been learnt that women have more propensity to save and
invest on lucrative projects.
13. A pre-designed structure doesn’t work for rural areas
Dairy Project had certain pre conceived notions and designs of animal shelters which were drastically
changed according to requirement of each individual farmers and ground realities. It has also been
learnt that the design of the physical structures must not be pre-conceived and kept open for
End line Survey of Dairy Project
Page 50 of 58
modification during implementation phase of the project. The structure must be designed according
to the type and number of animals which vary from individual to individual, and place to place.
14. Farmers do not count their own input while calculating cost
In rural Pakistan, agriculture is not just an economic activity but a way of life. So, the in rural
communities hardly considered it a business or profession. The farmers usually do not count time
spent and work done in farming and livestock care by the family members. As result the farmers sell
their produce at cheaper prices. If time and labor by the family members is counted, the cost of the
produce would be far higher which would result in more profits and income. It was observed that the
farmers usually live hand to mouth because of not valuing the cost of their labor and time spent in
farming and animal care activities.
15. Street theatre was more effective than TV and Radio in Rural areas
Media campaigns were also part of mobilization process. However, it was observed that instead of
print and electronic media, people were more interested in street theatre. The electronic media was
ineffective because of interrupted electric supply and the print media proved to be unproductive in
the face of lower literacy rate. The street theater; however, was opted instead and was liked by
communities because of its entertaining nature, interactivity and live performance. The messages and
SoundBits communicated during the performance were carefully designed so that people may
remember and quote them.
16. Participatory learning was more effective than monotonous lectures
It was also learnt during the project that the monotonous lectures in skills development were
sometimes taken as too serious and boring by the trainees. The participatory learning method,
however, provide them with opportunity to share and learn from each other’s experiences in a
mutually learning environment. To make participation even more effective; a model farm was selected
for a visit where the farmers were briefed by the farm owner and he explains his innovative methods
of livestock management. The visiting farmers asked questions and shared their own experiences. It
was also learnt that through interactive exposures to model farms, the farmers learnt more as
compared to what they learnt in monotonous lecturing sessions by experts.
17. Consent of Government authorities should be accorded for Policy shift before a project
is launched
The shift in policy and regulation during implementation phase of the project jeopardized the smooth
implementation of the activities. The Dairy Project was designed for short duration training courses
for AITs. During implementation phase, however, the Government increased the duration of the
course through a policy shift.
The change in duration resulted into drastic increase in cost of the training for each trainee. As a
result, the number of trainees were reduced to meet the cost. It was also learnt that the Government
line departments must also be taken on board so that project could be implemented smoothly.
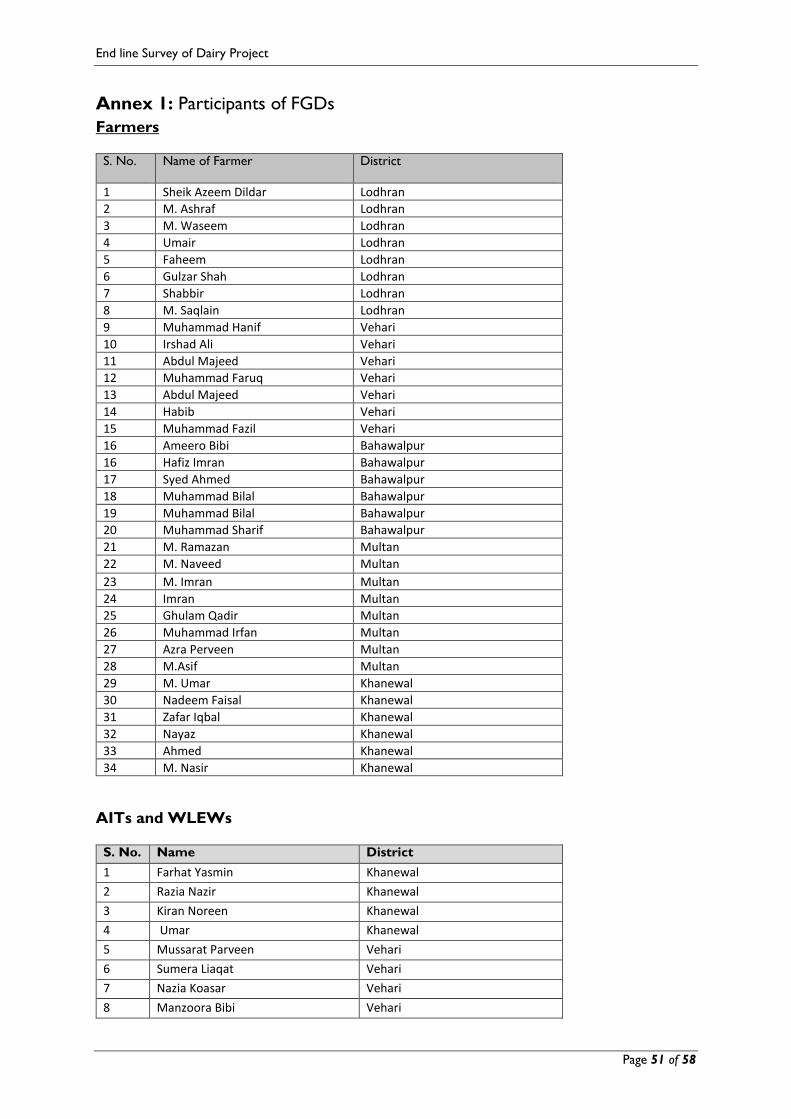
End line Survey of Dairy Project
Page 51 of 58
Annex 1: Participants of FGDs
Farmers
S. No. Name of Farmer District
1 Sheik Azeem Dildar Lodhran
2 M. Ashraf Lodhran
3 M. Waseem Lodhran
4 Umair Lodhran
5 Faheem Lodhran
6 Gulzar Shah Lodhran
7 Shabbir Lodhran
8 M. Saqlain Lodhran
9 Muhammad Hanif Vehari
10 Irshad Ali Vehari
11 Abdul Majeed Vehari
12 Muhammad Faruq Vehari
13 Abdul Majeed Vehari
14 Habib Vehari
15 Muhammad Fazil Vehari
16 Ameero Bibi Bahawalpur
16 Hafiz Imran Bahawalpur
17 Syed Ahmed Bahawalpur
18 Muhammad Bilal Bahawalpur
19 Muhammad Bilal Bahawalpur
20 Muhammad Sharif Bahawalpur
21 M. Ramazan Multan
22 M. Naveed Multan
23 M. Imran Multan
24 Imran Multan
25 Ghulam Qadir Multan
26 Muhammad Irfan Multan
27 Azra Perveen Multan
28 M.Asif Multan
29 M. Umar Khanewal
30 Nadeem Faisal Khanewal
31 Zafar Iqbal Khanewal
32 Nayaz Khanewal
33 Ahmed Khanewal
34 M. Nasir Khanewal
AITs and WLEWs
S. No. Name District
1 Farhat Yasmin Khanewal
2 Razia Nazir Khanewal
3 Kiran Noreen Khanewal
4 Umar Khanewal
5 Mussarat Parveen Vehari
6 Sumera Liaqat Vehari
7 Nazia Koasar Vehari
8 Manzoora Bibi Vehari

End line Survey of Dairy Project
Page 52 of 58
9 Sajida Vehari
10 Nazreena Bibi Vehari
11 M. Umair Vehari
11 Iram Hassan Bahawalpur
12 Khalida Yasmin Bahawalpur
13 Bushra Bibi Bahawalpur
14 Mohbeen Gulzar Bahawalpur
15 Gulzar Ahmed Bahawalpur
16 Musarrat Multan
17 Eashida Multan
18 Azra Parveen Multan
19 Imran Multan
20 M. Ramazan Multan
21 Sheikh Azeem Dildar Lodhran
22 Azra Bibi Lodhran
23 Shugufta Parveen Lodhran
Farm Upgradation (Individual Interviews and observations)
S. No. Name of Farmers District
1 Amjad Sindhu Multan
2 Lashkar Ali Multan
3 Shahzad Multan