USAID ASSIST Project Southern Africa Region Report FY17 · PDF filePLHIV People living with...
28
Southern Africa Region Report FY17 SEPTEMBER 2017 This annual report was prepared by University Research Co., LLC for review by the United States Agency for International Development (USAID). The USAID Applying Science to Strengthen and Improve Systems (ASSIST) Project is made possible by the generous support of the American people through USAID. Cooperative Agreement Number: AID-OAA-A-12-00101 Performance Period: October 1, 2016 – September 15, 2017 USAID ASSIST Project
Transcript of USAID ASSIST Project Southern Africa Region Report FY17 · PDF filePLHIV People living with...

Southern Africa Region Report FY17
SEPTEMBER 2017
This annual report was prepared by University Research Co., LLC for review by the United States Agency for International Development (USAID). The USAID Applying Science to Strengthen and Improve Systems (ASSIST) Project is made possible by the generous support of the American people through USAID.
Cooperative Agreement Number:
AID-OAA-A-12-00101
Performance Period:
October 1, 2016 – September 15, 2017
USAID ASSIST Project


USAID ASSIST Project
Applying Science to Strengthen and Improve Systems
Southern Africa Region Report FY17 Cooperative Agreement Number AID-OAA-A-12-00101
Performance Period: October 1, 2016 – September 15, 2017
SEPTEMBER 2017
DISCLAIMER
This annual regional report was authored by University Research Co., LLC (URC). The views expressed do not necessarily reflect the views of the United States Agency for International Development or the United States Government.

Acknowledgements
This annual report was prepared by University Research Co., LLC (URC) for review by the United States Agency for International Development (USAID) under the USAID Applying Science to Strengthen and Improve Systems (ASSIST) Project, which is funded by the American people through USAID’s Bureau for Global Health, Office of Health Systems. The project is managed by URC under the terms of Cooperative Agreement Number AID-OAA-A-12-00101. URC's global partners for USAID ASSIST include: EnCompass LLC; FHI 360; Harvard T. H. Chan School of Public Health; HEALTHQUAL International; Initiatives Inc.; Institute for Healthcare Improvement; Johns Hopkins Center for Communication Programs; and WI-HER, LLC.
For more information on the work of the USAID ASSIST Project, please visit www.usaidassist.org or write [email protected].
Recommended citation
USAID Applying Science to Strengthen and Improve Systems (ASSIST) Project. 2017. Southern Africa Region Report FY17. Published by the USAID ASSIST Project. Chevy Chase, MD: University Research Co., LLC (URC).
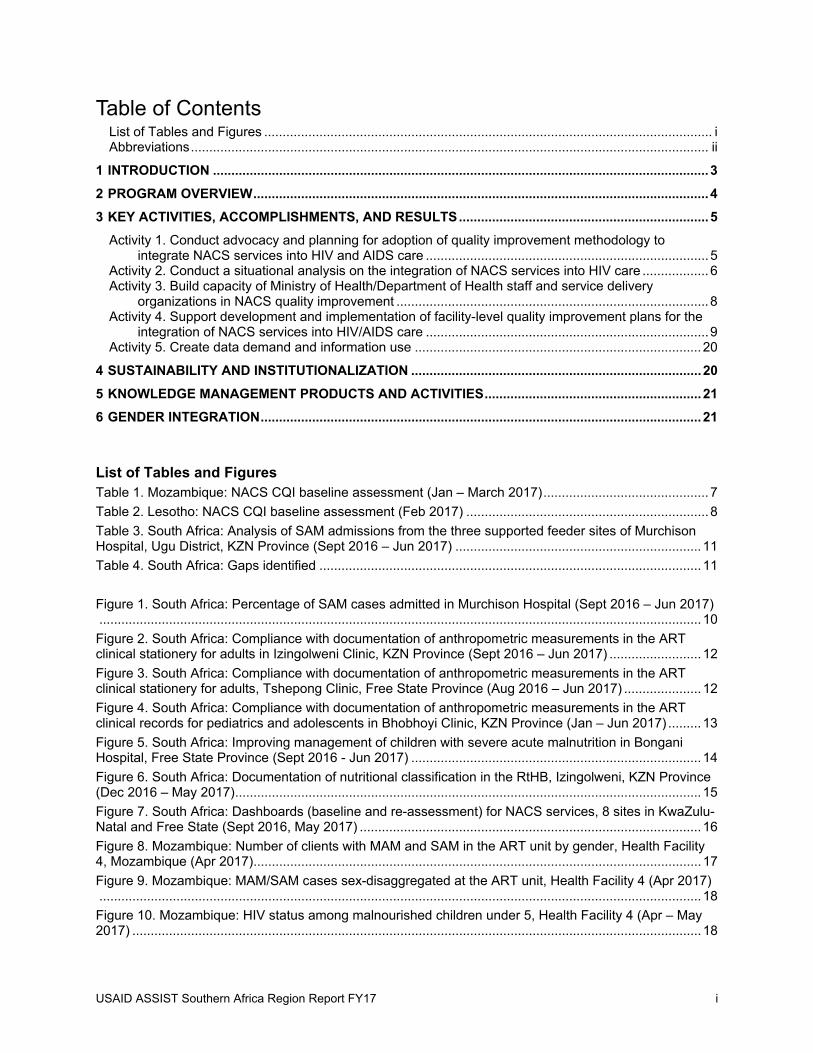
USAID ASSIST Southern Africa Region Report FY17 i
Table of Contents List of Tables and Figures .......................................................................................................................... i Abbreviations ............................................................................................................................................. ii
1 INTRODUCTION ....................................................................................................................................... 3
2 PROGRAM OVERVIEW ............................................................................................................................ 4
3 KEY ACTIVITIES, ACCOMPLISHMENTS, AND RESULTS .................................................................... 5
Activity 1. Conduct advocacy and planning for adoption of quality improvement methodology to integrate NACS services into HIV and AIDS care ............................................................................. 5
Activity 2. Conduct a situational analysis on the integration of NACS services into HIV care .................. 6 Activity 3. Build capacity of Ministry of Health/Department of Health staff and service delivery
organizations in NACS quality improvement ..................................................................................... 8 Activity 4. Support development and implementation of facility-level quality improvement plans for the
integration of NACS services into HIV/AIDS care ............................................................................. 9 Activity 5. Create data demand and information use .............................................................................. 20
4 SUSTAINABILITY AND INSTITUTIONALIZATION ............................................................................... 20
5 KNOWLEDGE MANAGEMENT PRODUCTS AND ACTIVITIES ........................................................... 21
6 GENDER INTEGRATION ........................................................................................................................ 21
List of Tables and Figures Table 1. Mozambique: NACS CQI baseline assessment (Jan – March 2017) ............................................. 7
Table 2. Lesotho: NACS CQI baseline assessment (Feb 2017) .................................................................. 8
Table 3. South Africa: Analysis of SAM admissions from the three supported feeder sites of Murchison Hospital, Ugu District, KZN Province (Sept 2016 – Jun 2017) ................................................................... 11
Table 4. South Africa: Gaps identified ........................................................................................................ 11
Figure 1. South Africa: Percentage of SAM cases admitted in Murchison Hospital (Sept 2016 – Jun 2017) .................................................................................................................................................................... 10
Figure 2. South Africa: Compliance with documentation of anthropometric measurements in the ART clinical stationery for adults in Izingolweni Clinic, KZN Province (Sept 2016 – Jun 2017) ......................... 12
Figure 3. South Africa: Compliance with documentation of anthropometric measurements in the ART clinical stationery for adults, Tshepong Clinic, Free State Province (Aug 2016 – Jun 2017) ..................... 12
Figure 4. South Africa: Compliance with documentation of anthropometric measurements in the ART clinical records for pediatrics and adolescents in Bhobhoyi Clinic, KZN Province (Jan – Jun 2017) ......... 13
Figure 5. South Africa: Improving management of children with severe acute malnutrition in Bongani Hospital, Free State Province (Sept 2016 - Jun 2017) ............................................................................... 14
Figure 6. South Africa: Documentation of nutritional classification in the RtHB, Izingolweni, KZN Province (Dec 2016 – May 2017) ............................................................................................................................... 15
Figure 7. South Africa: Dashboards (baseline and re-assessment) for NACS services, 8 sites in KwaZulu-Natal and Free State (Sept 2016, May 2017) ............................................................................................. 16
Figure 8. Mozambique: Number of clients with MAM and SAM in the ART unit by gender, Health Facility 4, Mozambique (Apr 2017) .......................................................................................................................... 17
Figure 9. Mozambique: MAM/SAM cases sex-disaggregated at the ART unit, Health Facility 4 (Apr 2017) .................................................................................................................................................................... 18
Figure 10. Mozambique: HIV status among malnourished children under 5, Health Facility 4 (Apr – May 2017) ........................................................................................................................................................... 18

ii USAID ASSIST Southern Africa Region Report FY17
Figure 11. Mozambique: Sex-disaggregation of children under five with malnutrition, Health Facility 4 (Apr – May 2017) ................................................................................................................................................ 19
Figure 12. Mozambique: Sex-disaggregated data of MAM and SAM clients in the ART unit, Moatize Hospital (May 2017) .................................................................................................................................... 19
Abbreviations
ADHC Adolescent Health corner AIDS Acquired immunodeficiency syndrome ANC Antenatal care ART Antiretroviral therapy ASSIST USAID Applying Science to Strengthen and Improve Systems Project CFR Case fatality rate CQI Continuous quality improvement DHIS District Health Information System DOH Department of Health (South Africa) DPS Provincial Department of Health (Mozambique) EGPAF Elizabeth Glaser Pediatric AIDS Foundation FANTA Food and Nutrition Technical Assistance Project FY Fiscal year HIV Human immunodeficiency virus KZN KwaZulu-Natal M2M Mothers to Mothers MAM Moderate acute malnutrition MOH Ministry of Health MUAC Mid-upper arm circumference NACS Nutrition assessment, counselling, and support NDOH National Department of Health (South Africa) PDSA Plan-do-study-act cycle PEPFAR U.S. President's Emergency Plan for AIDS Relief PLHIV People living with HIV QI Quality improvement RtHB Road to Health Booklet SAM Severe acute malnutrition TB Tuberculosis URC University Research Co., LLC USAID United States Agency for International Development WHO World Health Organization

USAID ASSIST Southern Africa Region Report FY17 3
1 Introduction Malnutrition in the Southern Africa Region is a persistent problem. HIV and malnutrition interact in a vicious cycle. HIV infection causes or aggravates malnutrition through reduced food intake, increased energy needs, impaired nutrient absorption, and nutrient losses associated with frequent and persistent diarrhea. Malnutrition can hasten the progression of HIV, further weakening the immune system, increasing susceptibility to opportunistic infections, and reducing the effectiveness of both antiretroviral therapy (ART) and treatment of opportunistic infections. Thus, nutrition and food security support are a critical component of comprehensive HIV and AIDS programs to improve clinical outcomes for people living with HIV (PLHIV) and to mitigate the impact of the disease on HIV-affected families.
South Africa is one of the 34 countries that account for 90% of the global burden of malnutrition. According to recent data, of all hospitalized children that died in 2012-2013, 29% were underweight for age, and 30% were severely malnourished. The case fatality rate (CFR) for severe acute malnutrition (SAM) among hospitalized children under five in South Africa is 11%, far above the World Health Organization’s (WHO) threshold of <5%.1 Findings from the 2003 Mozambique Demographic and Health Survey reports that acute under nutrition contributes to 36% of child deaths.2 A child mortality study conducted by the University of Botswana in 2013 indicated that one of the major causes of child mortality is malnutrition. Sixty-three percent (63%) of children who died had some degree of malnutrition.3
Since January 2016, the USAID Applying Science to Strengthen and Improve Systems (ASSIST) Project was given the mandate to contribute to the evidence base on how integration of nutrition assessment, counselling, and support (NACS) services into HIV/AIDS care can influence engagement, adherence, and retention of PLHIV. In addition, the project worked to reduce the prevalence of moderate and severe acute malnutrition and CFR associated with SAM.
In fiscal year (FY)17, ASSIST’s work focused on two provinces in South Africa with high numbers of SAM admissions and/or high CFR: Free State (12% CFR) and KwaZulu-Natal (KZN) (10% CFR). An average of three feeder facilities per hospital were selected based on the number of SAM referrals for admissions to the respective hospitals. In FY16, ASSIST supported two districts in Free State and one district in KZN, for a total of 12 selected sites (four in each district) for support in South Africa. All the sites formed quality improvement (QI) teams that initiated quality improvement projects for their sites. In March 2017, ASSIST transitioned out of one of the districts in Free State, reducing the number of supported sites to eight.
A similar approach was followed in the selection of sites in Lesotho and Mozambique. In Lesotho, 10 sites were chosen among five PEPFAR priority (scale-up) districts. QI teams were formed and QI projects were initiated in nine of the 10 sites. In Mozambique, two provinces (Nampula and Tete) with two sites in each province were chosen. One QI team was formed in Moatize Hospital. The original scope of work proposed work in Botswana, but funding limitations and delays in securing approvals for sites in Botswana limited the work to the other three countries.
ASSIST provided technical assistance in QI for this initiative and worked with site-level staff to implement recommended approaches. The project’s objectives were to:
Build the capacity of service delivery organizations (Ministry of Health and other stakeholders) to improve the effectiveness, efficiency, client-centeredness, safety, accessibility, and equity of NACS services in the context of HIV/AIDS care through team-driven, data-driven QI approaches
Institutionalize the capacity to improve through competency development at the in-service and policy levels
Conduct monitoring and evaluation activities Implement knowledge management activities to effectively and efficiently capture and disseminate
learning about what improves outcomes Improve the management and treatment of SAM and reduce SAM case fatality
1 Child Healthcare Problem Identification Programme: Saving Children 2012-2013. Accessed: http://www.childpip.org.za/images/stories/documents/saving_children_2012-2013.pdf. 2Demographic Health Survey, Mozambique 2011. Accessed: http://dhsprogram.com/publications/publication-fr266-dhs-final-reports.cfm 3 Demographic Health Survey, Mozambique 2011

4 USAID ASSIST Southern Africa Region Report FY17
Scale of USAID ASSIST’s Work in the Southern Africa Region
South Africa DOH MOH in Lesotho, Mozambique & Botswana
2 out of 9 provinces in South Africa (3 out of 52 districts) 2 provinces in Mozambique 5 districts in Lesotho
12 sites in South Africa 10 sites in Lesotho 4 sites in Mozambique
12 QI teams in South Africa 9 QI teams in Lesotho 1 QI team in Mozambique
2 Program Overview What are we trying to accomplish? At what scale?
1. Conduct advocacy and planning for adoption of quality improvement methodology to integrate NACS services into HIV and AIDS care
Conduct meetings with provincial and district leaders for buy-in to implement QI methodology
Identify feeder facilities for site level support Identify district and facility key focal persons
South Africa: 2 provinces (KZN and Free State); 3 districts (Lejweleputswa and Fezile Dabi in Free State and Ugu in KZN), 12 sites (4 in each district)
Lesotho: 5 districts (Maseru, Mohale’s Hoek, Mafeteng, Leribe, Berea), 10 sites
Mozambique: 2 provinces (Nampula and Tete), 4 sites
2. Conduct a situational analysis on the integration of NACS services into HIV and AIDS care
Adapt baseline assessment tool for NACS quality Conduct baseline assessment at project sites to:
o Identify bottlenecks and quality gaps o Estimate caseloads
Conduct feedback sessions to Provincial MOH/DOH, district managers, and facility operational managers
South Africa: 12 sites Lesotho: 10 sites Mozambique: 4 sites
3. Build capacity of Ministry of Health/Department of Health staff and service delivery organizations in NACS quality improvement Develop quality improvement training materials to
integrate NACS services into HIV and AIDS care Conduct training attached with on-site mentoring,
coaching and supportive supervision Procure and distribute mid-upper arm
circumference (MUAC) measuring tapes
South Africa: 12 sites Lesotho: 10 sites Mozambique: 4 sites
HIV and Nutrition

USAID ASSIST Southern Africa Region Report FY17 5
What are we trying to accomplish? At what scale?
4. Support development and implementation of facility-level quality improvement plans for the integration of NACS services into HIV and AIDS care Set up facility quality improvement teams Develop facility level QI plans Conduct coaching and supervision on the
implementation of QI plans
South Africa: 12 sites Lesotho: 10 sites Mozambique: 4 sites
5. Create data demand and information use
Conduct ongoing monitoring of program against set standards
Empower provincial and district health units to monitor plans
Support the development and utilization of a nutritional dashboard for decision making
Knowledge management and disseminate learning about what improves outcomes
South Africa: 2 provinces 3 districts, 12 sites
Lesotho: 5 districts, 10 sites Mozambique: 2 provinces, 4 sites
Improvement Activity Cross-cutting Activity
3 Key Activities, Accomplishments, and Results Activity 1. Conduct advocacy and planning for adoption of quality improvement methodology to integrate NACS services into HIV and AIDS care
BACKGROUND
Adequate nutrition is not only an indicator of development, but also a significant process for its achievement. Poor nutrition increases the burden of economic loss and disease by threatening people’s health, reducing productivity, and shortening life expectancy. Effective advocacy is thus necessary to generate financial and political support for scaling up projects and maintaining successful national nutrition programs. Although the health sector plays a key role in the implementation and scale-up of nutrition-specific interventions, other sectors (e.g., agriculture, social development, and education) need to be part of nutrition-sensitive interventions to address the above-mentioned issues. In 2010, a Framework for Scaling Up Nutrition was developed to reposition nutrition on the international agenda.4 Unfortunately, this framework has not cascaded down to reach all levels of care in the health system. Advocacy is therefore crucial to ensure that both management and implementers understand that nutrition is a cross-cutting priority service for all the clients served in the health care system so that malnutrition can be prevented and managed better. Since the success of any project lies in the buy-in from management, ASSIST worked to involve management from all levels, including Provincial Ministry/Department of Health (DOH), district managers, facility operational managers, and PEPFAR implementing partners, to advocate for the acceleration of the prevention and management of severe and moderate malnutrition.
KEY ACCOMPLISHMENTS AND RESULTS
Held advocacy and planning meetings in Mozambique (Nov 2016). ASSIST met with the Provincial Department of Health (DPS) in both Nampula and Tete provinces and presented the envisaged continuous quality improvement (CQI) support for the provinces. On Nov 21, 2016,
4 This is a consensus document based on the thinking and experience of the many individuals and institutions who participated in the process. This partnership includes developing countries, academic and research institutions, civil society organizations, the private sector, bilateral development agencies, United Nations specialized agencies (FAO, UNICEF, WFP, and WHO), nutrition-specific collaboration organizations of the United Nations (SCN and REACH), and the World Bank. In addition, the document has been shared widely and has benefited from invaluable input and feedback from many individuals and organizations not involved in the face-to-face consultations. (Scalingupnutrition.org)

6 USAID ASSIST Southern Africa Region Report FY17
ASSIST forwarded a letter of request to the DPS Tete Director outlining proposed CQI pilot sites, dates for the baseline, support needed from DPS (e.g., staffing, transport, etc.), and the CQI support process following the baseline assessment
ASSIST held a meeting with USAID mission in Mozambique (Nov 17, 2016). ASSIST met to discuss the sites in Mozambique, project deliverables, reporting requirements, CQI/NACS training, recruitment, and the expenditure analysis report.
During the advocacy meetings, ASSIST conducted site visits to the two supported sites in Tete, Mozambique (Nov 17-18, 2016), i.e., Moatize Hospital and Health Facility Number 4. The aim of the site visit was to get an overview and understanding of how the nutrition activities were implemented and what challenges were being experienced.
Initiated a process of recruiting a consultant to translate (Nov 2016), the NACS training materials into Portuguese.
Consultant from Mozambique signed a work contract with ASSIST on February 21, 2017 and the activities assigned to him.
Activity 2. Conduct a situational analysis on the integration of NACS services into HIV care
BACKGROUND
The goal of quality care is to use the available resources in providing quality care to the population in the most timely, effective, and efficient manner possible. A situational analysis is required to ensure that all the enabling factors as well as barriers to providing high quality care are explored. The results then guide the development of site-level quality improvement plans.
ASSIST collaborated with the Ministries/Department of Health in each country in conducting baseline assessments at some of the selected sites to identify quality gaps and bottlenecks that could be addressed through implementation of the quality improvement methodology. Feedback sessions were held to share baseline findings with national, provincial, district managers and facility operational managers.
KEY ACCOMPLISHMENTS AND RESULTS
Study protocol submitted to the MOH ethics committee in Lesotho (Nov 28, 2016) and was subsequently approved (Jan 16, 2017).
For Mozambique assessments, ASSIST aligned the NACS baseline assessment tool with the tool used by Food and Nutrition Assistance (FANTA) Project (Dec 2016). ASSIST is supporting FANTA sites in Mozambique. In these sites, implementing partners (IPs) already conducted a baseline assessment. Thus, to complement the work being done, ASSIST adapted FANTA’s tool for the site-level assessments.
Baseline assessments conducted in 3 of 4 sites in Mozambique (Jan and Mar 2017) and in 10 of 10 sites in Lesotho (Feb 6-10, 2017). A tool with eight components was used to complete the assessment, examining: Staffing; nutrition services; procedure for nutrition assessment and classification; equipment and tools for assessment and classification; health education and counselling; commodity management; referral; and monitoring and evaluation. The baseline assessment involved interviewing staff, observing nutrition assessment practices, reviewing client records (ART, antenatal care, and Road to Health Booklets) to assess compliance with documentation of anthropometric measurements, and review of equipment and tools for nutrition assessment. The dashboard is calculated as follows: Numerator is the number of positive responses divided by number of both positive and negative responses (denominator). A dashboard was developed which shows areas that need to be addressed (red and yellow) so that the quality of nutrition services can be improved using the quality improvement methodology.
The baseline assessment reports (1st draft) for the sites in Mozambique were compiled and sent to USAID for review on April 26, 2017. These were finalized and sent to the USAID Mission on May 19, 2017.

USAID ASSIST Southern Africa Region Report FY17 7
The results of the assessment in Mozambique are displayed in Table 1. The team completed the baseline assessment for Moatize Hospital and Hospital Rural De Angoche on Jan 23 and 27, 2017 respectively, and for Health Facility Number 4 on Mar 27-28, 2017. The findings indicate that the delivery of nutrition services at an optimal level in two of the assessed sites might be challenging as the staff are not adequately capacitated to implement nutrition services. Health education and counselling for the communities had low scores in all the sites and was prioritized in improvement plans. The procedure for nutrition assessment and classification scored low in two of the three sites because anthropometric measurements were not being done correctly.
Table 1. Mozambique: NACS CQI baseline assessment (Jan – March 2017)
Facility name
Staff component
Nutrition services
Procedure for nutrition assessment and classification
Equipment and tools for assessment and classification of nutritional status
Health education and counselling
Commodity management
Referral Monitoring and evaluation
Overall performance
1
Moatize
Hospital
28.6%
87.9%
49.2%
92.9%
34.8%
90.9%
81.8%
62.4%
66.0%
2
Hospital Rural De Angoche
33.3%
96.3%
38.0%
77.8%
17.4%
69.6%
45.5%
49.3%
53.4%
3
Health Facility Number 4
100%
77.8%
75.5%
89.9%
26.1%
42.9%
57.1%
69.6%
67.4%
Scale: Poor <60 Fair 60 - 90 Good >90
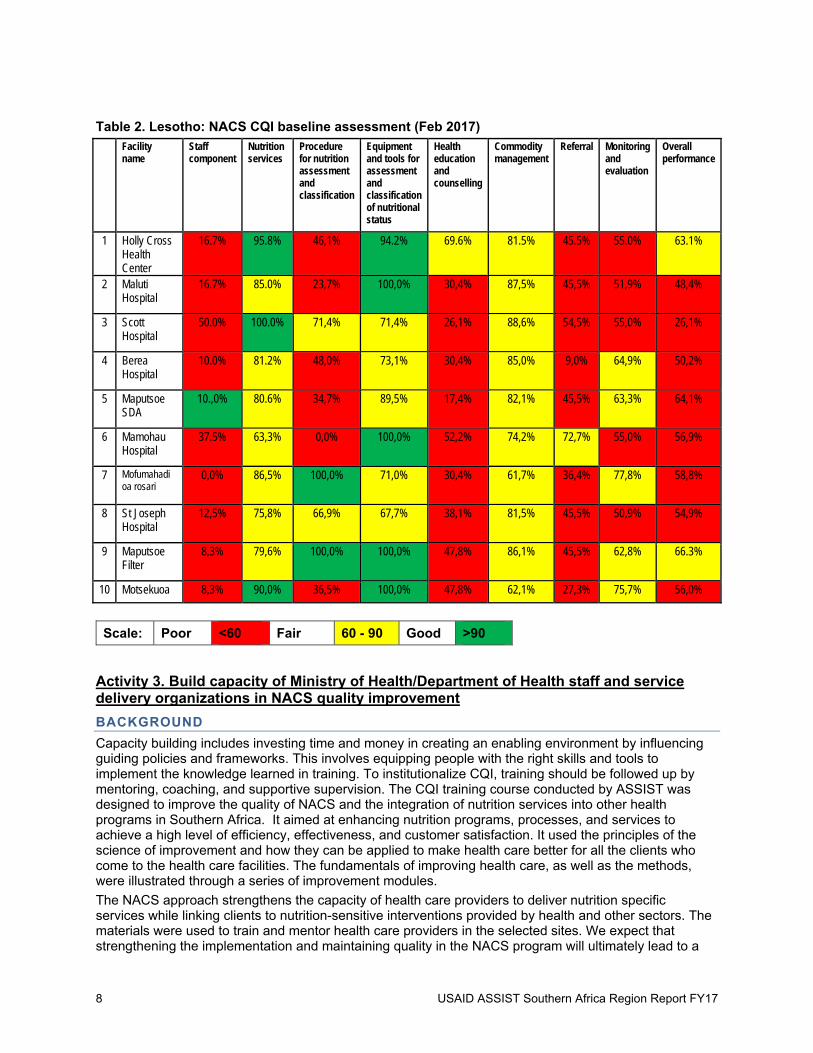
The results of the assessment in Lesotho are displayed in Table 2. The NACS baseline assessment tool with the same eight components as used in Mozambique was used to assess the sites in Lesotho in February 2017. To assess the procedure for nutrition assessment and classification, the team observed five clients receiving NACS services in each of the following age groups: infants and children, adolescents, adults non-pregnant, and pregnant women. The results show that there were many areas for improvement (yellow and red). The low scores in the staff component indicate that there is a need for capacity building for staff to ensure that quality nutrition services are provided. Health education and referral also need to be prioritized when addressing the gaps using QI methodology. The Ministry of Health and the facility managers were given a summary of the findings and a sheet of scores (%) at the end of each site assessment.
8 USAID ASSIST Southern Africa Region Report FY17
Table 2. Lesotho: NACS CQI baseline assessment (Feb 2017)
Facility name Staff
component Nutrition services Procedure
for nutrition assessment and classification
Equipment and tools for assessment and classification of nutritional status
Health education and counselling
Commodity management
Referral Monitoring and evaluation
Overall performance
1 Holly Cross Health Center
16.7% 95.8% 46,1% 94.2% 69.6% 81.5% 45.5% 55.0% 63.1%
2 Maluti Hospital
16.7% 85.0% 23,7% 100,0% 30,4% 87,5% 45,5% 51,9% 48,4%
3 Scott Hospital
50.0% 100.0% 71,4% 71,4% 26,1% 88,6% 54,5% 55,0% 26,1%
4 Berea Hospital
10.0% 81.2% 48,0% 73,1% 30,4% 85,0% 9,0% 64,9% 50,2%
5 Maputsoe SDA
10.,0% 80.6% 34,7% 89,5% 17,4% 82,1% 45,5% 63,3% 64,1%
6 Mamohau Hospital
37.5% 63,3% 0,0% 100,0% 52,2% 74,2% 72,7% 55,0% 56,9%
7 Mofumahadi oa rosari
0,0% 86,5% 100,0% 71,0% 30,4% 61,7% 36,4% 77,8% 58,8%
8 St Joseph Hospital
12,5% 75,8% 66,9% 67,7% 38,1% 81,5% 45,5% 50,9% 54,9%
9 Maputsoe Filter
8,3% 79,6% 100,0% 100,0% 47,8% 86,1% 45,5% 62,8% 66.3%
10 Motsekuoa 8,3% 90,0% 36,5% 100,0% 47,8% 62,1% 27,3% 75,7% 56,0%
Scale: Poor <60 Fair 60 - 90 Good >90
Activity 3. Build capacity of Ministry of Health/Department of Health staff and service delivery organizations in NACS quality improvement
BACKGROUND
Capacity building includes investing time and money in creating an enabling environment by influencing guiding policies and frameworks. This involves equipping people with the right skills and tools to implement the knowledge learned in training. To institutionalize CQI, training should be followed up by mentoring, coaching, and supportive supervision. The CQI training course conducted by ASSIST was designed to improve the quality of NACS and the integration of nutrition services into other health programs in Southern Africa. It aimed at enhancing nutrition programs, processes, and services to achieve a high level of efficiency, effectiveness, and customer satisfaction. It used the principles of the science of improvement and how they can be applied to make health care better for all the clients who come to the health care facilities. The fundamentals of improving health care, as well as the methods, were illustrated through a series of improvement modules.
The NACS approach strengthens the capacity of health care providers to deliver nutrition specific services while linking clients to nutrition-sensitive interventions provided by health and other sectors. The materials were used to train and mentor health care providers in the selected sites. We expect that strengthening the implementation and maintaining quality in the NACS program will ultimately lead to a

USAID ASSIST Southern Africa Region Report FY17 9
reduction in the prevalence of severe and moderate acute malnutrition and subsequent case fatality rates.
KEY ACCOMPLISHMENTS AND RESULTS
South Africa
Conducted two NACS CQI trainings in Free State and KwaZulu-Natal in South Africa (Oct 2016). Fifty-one (51) participants were trained. To institutionalize CQI, the training was followed up by mentoring, coaching, and supportive supervision visits during November and December.
Mozambique
ASSIST aligned the training material to the Mozambique QI Strategy (Feb 2017) to ensure that the country-specific QI information was included in the ASSIST CQI training. Areas to be incorporated in the training materials were identified and the materials were sent to the consultant in Mozambique to review and align with the country policies and guidelines. In April 2017, the training materials were submitted to USAID for inputs before translation into Portuguese. The materials were finalized, translated, and submitted to USAID on May 21, 2017.
An in-service training was conducted (June 13, 2017) for five staff members from ART, ANC, TB, the under 5s unit as well as the nutritionist at Moatize Hospital. The representatives were presented with the gaps that were identified during the baseline assessment that was conducted in January 2017. After presenting the gaps, staff excused themselves citing that they needed to attend to the clients. Only the nutritionist was available for the in-service training on application of the QI methodology in addressing the quality gaps. Practical examples were given to make it easy for her to give feedback to the different units. The following content was covered: Identification of a problem related to nutrition, forming QI teams, developing an aim statement and indicators, problem analysis and development, and testing and implementing changes using the plan-do-study-act (PDSA) cycle.
Lesotho
An in-service training was conducted (June 5 – 9, 2017) in 9 out of 10 supported facilities where 129 participants attended. The participants were introduced to concepts of quality and quality improvement and the staff were taken through the use of the PDSA cycle. The following content was also covered: Identification of a problem related to nutrition, forming QI teams, developing an aim statement and indicators, problem analysis and development, and testing and implementing changes using the PDSA cycle. The facilities were left with work to do on identifying problems, forming teams, and developing an aim statement and indicators.
Activity 4. Support development and implementation of facility-level quality improvement plans for the integration of NACS services into HIV/AIDS care
BACKGROUND
Building on QI training and capacity building, there is a need for mentoring, coaching, and supportive supervision at site level to ensure that the skills learned from the training are translated into day-to-day service delivery, and for sites, districts and provincial health units to monitor results against standards and plans. Following a capacity building training in South Africa and in-service trainings in Mozambique and Lesotho, the participants were expected to initiate quality improvement projects in their facilities. This involved agreeing on the problems they are dealing with in antenatal care, integrated management of childhood illnesses, and anti-retroviral therapy. QI teams would then work on the identified problem. The team would develop an aim statement and indicators to monitor progress of the project. The team would then do a root-cause analysis and also develop, test, and implement the changes using the PDSA cycle.
KEY ACCOMPLISHMENTS AND RESULTS
South Africa
Conducted 8 and 10 mentoring and coaching visits in KwaZulu-Natal and Free State, respectively, in the supported facilities (Nov 2016 - June 30, 2017). Mentoring and coaching was done in collaboration with the District Clinical Specialist Team for Pediatrics in Free State and the nutritionists in KwaZulu-Natal. The following activities were done: monitoring progress of QI projects, record reviews, observation and onsite training, investigation of SAM cases admitted in hospital from the supported sites, and data collection.
10 USAID ASSIST Southern Africa Region Report FY17
Sept '16 Oct '16 Nov '16 Dec '16 Jan' 17 Feb '17 Mar'17Apr'201
7May'17 Jun'17
Children under 5 years with severe acutemalnutrition ‐Admission
5 7 3 5 4 10 8 6 3 6
Children under 5 years with severe acutemalnutrition ‐Deaths
0 0 0 0 0 0 1 3 1 0
Children under 5 years with severe acutemalnutrition ‐Case Fatality Rate (%)
0 0 0 0 0 0 12.5 50 33.3 0
0
10
20
30
40
50
60
SAM Case Fatality Rate (%)
Conducted record reviews in all the supported sites in the two provinces, to assess compliance with documentation of the anthropometric measurements in the Road to Health Booklet (RtHB), maternity case record, and ART clinical stationery (Oct 2016 - Jun 2017). Facilities in all the 12 sites in Free State and KZN were mentored and coached on how to improve compliance with documentation of the anthropometric measurements in the RtHB, ART clinical stationery, and maternity case records and to improve the management of SAM clients. In March 2017, ASSIST transitioned out of one of the two districts in Free State (Fezile Dabi), reducing the number of supported sites in South Africa to eight sites in two districts in two provinces.
Progress on the quality improvement projects was monitored by ASSIST staff monthly through continuous mentoring and coaching to assess improvement with documentation of anthropometric measurements for the target populations (children under 5 years, pregnant women, and PLHIV) (Nov 2016 - June 2017).
QI teams were formed in all 12 sites in South Africa as of January 2017.
ASSIST institutionalized documentation audits in the supported sites to assess compliance with documentation of anthropometric measurements in the clients’ records (Feb 2017). The facility staff began to conduct their own periodic documentation audits and report their findings to the Nutrition Officers during their visits.
All the supported sites in South Africa have initiated quality improvement projects in an endeavour to improve compliance with documentation of anthropometric measurements in the RtHB, maternity case records, and ART clinical stationery (Jan 2017). It is expected that improving compliance with nutritional assessment will result in fewer clients diagnosed with SAM as they will be diagnosed on time as MAM and will be given supplements and managed accordingly before they deteriorate to SAM.
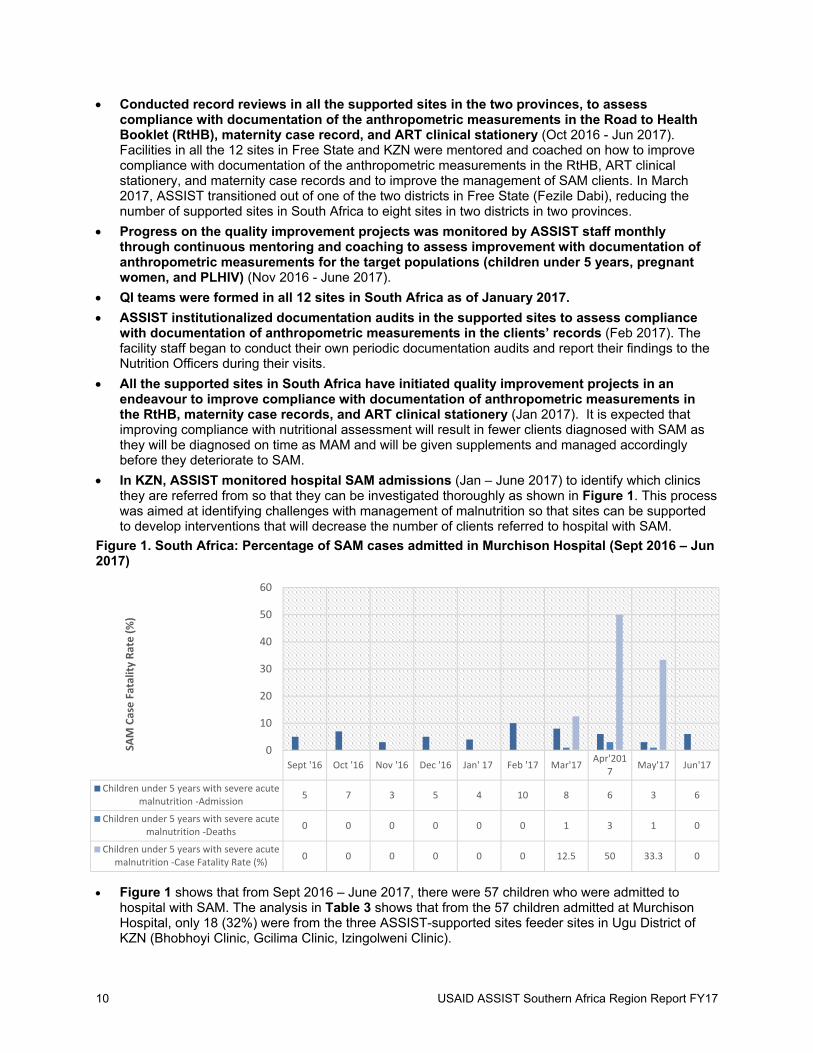
In KZN, ASSIST monitored hospital SAM admissions (Jan – June 2017) to identify which clinics they are referred from so that they can be investigated thoroughly as shown in Figure 1. This process was aimed at identifying challenges with management of malnutrition so that sites can be supported to develop interventions that will decrease the number of clients referred to hospital with SAM.
Figure 1. South Africa: Percentage of SAM cases admitted in Murchison Hospital (Sept 2016 – Jun 2017)
Figure 1 shows that from Sept 2016 – June 2017, there were 57 children who were admitted to hospital with SAM. The analysis in Table 3 shows that from the 57 children admitted at Murchison Hospital, only 18 (32%) were from the three ASSIST-supported sites feeder sites in Ugu District of KZN (Bhobhoyi Clinic, Gcilima Clinic, Izingolweni Clinic).

USAID ASSIST Southern Africa Region Report FY17 11
Table 3. South Africa: Analysis of SAM admissions from the three supported feeder sites of Murchison Hospital, Ugu District, KZN Province (Sept 2016 – Jun 2017)
Sep Oct Nov Dec Jan Feb Mar April May June Total
Bhobhoyi Clinic 0 0 0 0 0 0 1 1 0 0 2
Gcilima Clinic 1 2 0 2 1 1 1 0 1 0 9
Izingolweni Clinic 1 2 0 1 0 2 0 0 1 0 7
After analysis, the gaps (Table 4) were identified and staff implemented a change idea to reinforce
integration of NACS through measuring anthropometric measurements at all clinic visits and documenting the findings in the RtHB to ensure that the gaps are addressed. The gaps have been addressed as evidenced by data that shows that in June 2017, there were no clients admitted to Murchison Hospital with SAM from the three ASSIST supported sites shown in Table 3.
Table 4. South Africa: Gaps identified
Health Care Worker Issues Client Issues
Plotting of the 3 graphs (WfA, L/HfA, WfL/H) not done routinely
If plotted, sometimes they are plotted wrongly, leading to incorrect or delayed management
MUAC is not done routinely Incorrect issuing of supplements to clients Classification of the nutrition status is not
routinely done as such MAM is missed Staff do not document counselling on the
clients’ records when it was done.
Parents do not bring their children for growth monitoring
They do not obey instructions, e.g., when a child should come for follow-up
Figure 2 shows an improvement in the documentation of anthropometric measurements in the ART
record for adults in one of the supported sites, Izingolweni, in KZN. The facility initiated a quality improvement project. The following changes were implemented: o After the CQI training, the clinic representative who attended the training conducted an in-service
training on NACS for the staff members who did not attend the training. o The ASSIST nutrition officer reinforced that client record audits should be done monthly by the
site staff to assess compliance with documentation on the anthropometric measurements. o Involvement of the clinic supervisor who also monitored progress of the quality improvement
projects during her clinic visits.
Figure 3 for Tshepong Clinic in Free State shows that during the 1st and 2nd CQI visits, there were improvements with the documentation in the clients’ files. However, this is not the case with the 3rd CQI visit because there was a staff rotation where the professional nurse who had been trained was not present. She had to go work night duty, and a nurse who had not been oriented on NACS was now working in the unit. Changes implemented were:
o Staff conducting monthly record review to assess compliance o Operational manager emphasized the importance of documentation during staff meetings o In-service training of staff on NACS by the dietician o Operational manager conducted in-service training for staff doing night duty on NACS

12 USAID ASSIST Southern Africa Region Report FY17
Weight HeightBMI (Routine
)MUAC
(Routine)Results
Interpreted
Number ofrecordsaudited
Baseline ‐Sept 2016 8 8 0 0 0 10
1st CQI Visit ‐Dec 2016 10 9 0 0 0 10
2nd CQI Visit ‐Jan 2017 9 9 8 7 0 10
3rd CQI Visit ‐Feb 2017 10 10 9 8 1 10
4th CQI Visit Mar 2017 10 10 10 10 10 10
5th CQI Visit Apr‐2017 10 10 10 9 10 10
Re‐Assessment May 2017 10 10 10 10 10 10
7th CQI Visit June 2017 10 10 10 9 10 10
0
2
4
6
8
10
12# of compliant records
Figure 2. South Africa: Compliance with documentation of anthropometric measurements in the ART clinical stationery for adults in Izingolweni Clinic, KZN Province (Sept 2016 – Jun 2017)
Figure 3. South Africa: Compliance with documentation of anthropometric measurements in the ART clinical stationery for adults, Tshepong Clinic, Free State Province (Aug 2016 – Jun 2017)
Weightbaseline
Weight lastvisit
BaselineHeight
RoutineMUAC
BaselineBMI
RoutineBMI
ResultsInterpreted
Actiontakenwhere
applicable
HAARTFiles
audited
Aug 2016 Baseline assessment 9 10 6 0 5 0 0 0 10
Dec 2016 QI site visit 8 9 8 1 5 1 1 0 10
Jan 2017 QI site visit 8 10 5 10 5 9 10 4 10
Mar 2017 QI site visit 10 10 1 3 5 8 8 3 10
Apr 2017 QI site visit 9 10 4 10 4 10 10 6 10
May 2017 QI site visit 8 10 5 10 4 10 9 4 10
Jun 2017 QI site visit 9 9 10 9 10 10 5 10
0
2
4
6
8
10
12
# of Compliant records

USAID ASSIST Southern Africa Region Report FY17 13
Figure 4 shows an improvement on compliance with documentation of anthropometric measurements in the ART clinical stationery for children. Changes implemented were:
o The staff member who attended the CQI training conducted an in-service training for the staff members who did not attend the training.
o The ASSIST nutrition officer who supported the site introduced a monthly audit of clients’ records to assess compliance with documentation of the anthropometric measurements.
o The ASSIST nutrition officer provided continuous mentoring and coaching support to the site.
Figure 4. South Africa: Compliance with documentation of anthropometric measurements in the ART clinical records for pediatrics and adolescents in Bhobhoyi Clinic, KZN Province (Jan – Jun 2017)
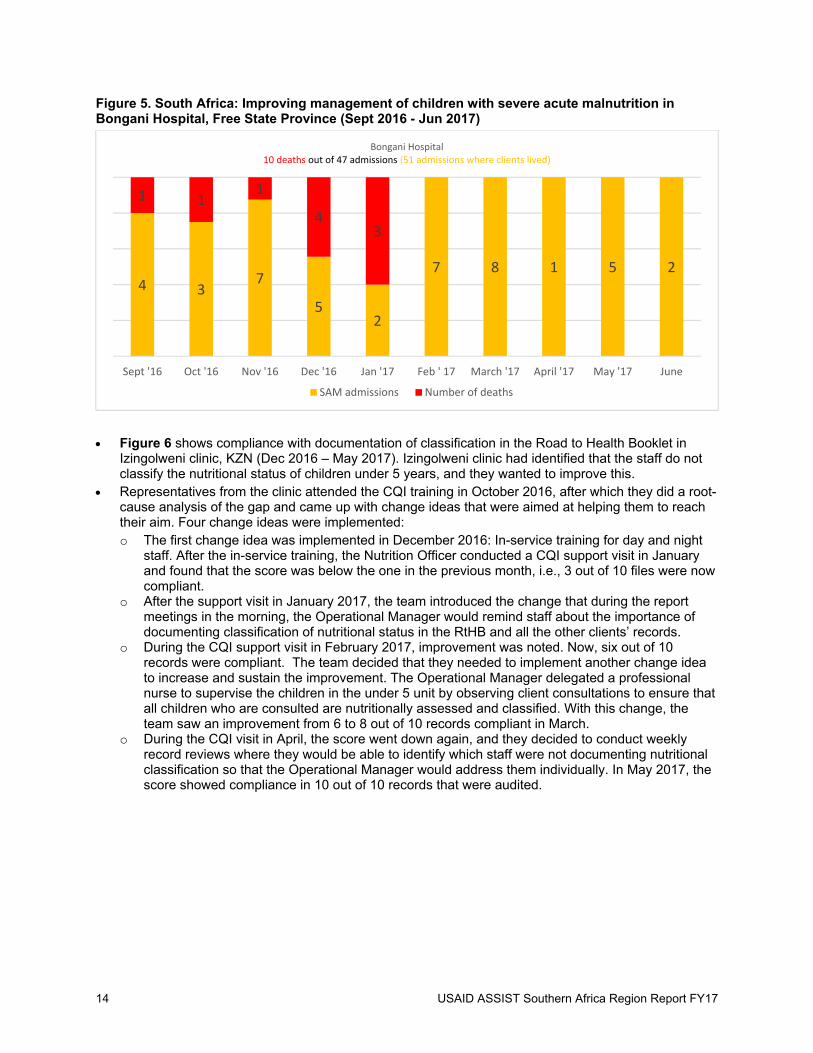
Figure 5 shows the SAM admissions and case fatality rates of Bongani Hospital in Free State. Bongani Hospital had 10 SAM deaths from Sept 2016 to Jan 2017, and we saw a significant decrease (0%) in SAM deaths from Feb – June 2017. This was partly attributed to the CQI support by ASSIST. The facilities were able to diagnose malnutrition in patients in timely manner and this meant that client management was effective and efficient.
Weight HeightBMI/ BMI ForAge (Routine )
MUAC(Routine)
ResultsInterpreted
Number ofrecordsaudited
2nd CQI Visit ‐Jan 2017 10 9 3 9 9 10
3rd CQI Visit ‐ Feb 2017 9 9 3 9 7 10
4th CQI Visit ‐ Mar 2017 10 10 6 9 9 10
5th CQI Visit Apr‐2017 10 10 9 8 7 10
Re‐Assessment May 2017 10 10 10 10 10 10
7th CQI Visit June 2017 10 10 10 10 9 10
0
1
2
3
4
5
6
7
8
9
10
# of compliant records
14 USAID ASSIST Southern Africa Region Report FY17
Figure 5. South Africa: Improving management of children with severe acute malnutrition in Bongani Hospital, Free State Province (Sept 2016 - Jun 2017)
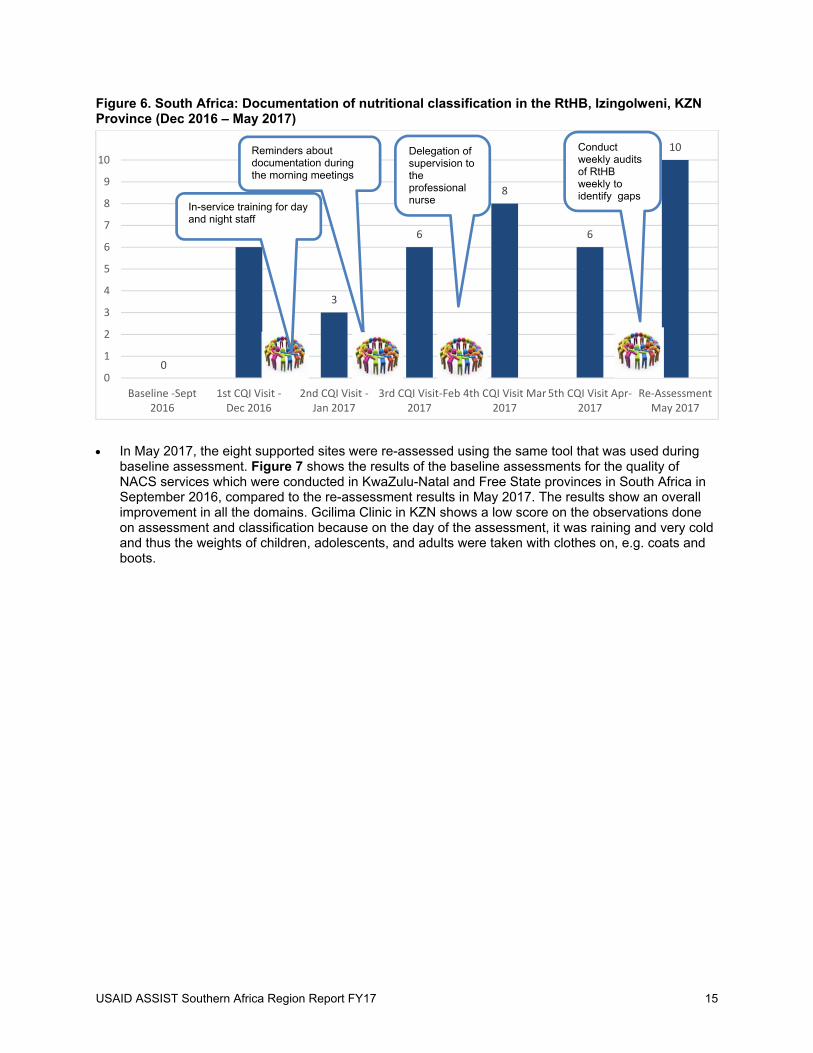
Figure 6 shows compliance with documentation of classification in the Road to Health Booklet in Izingolweni clinic, KZN (Dec 2016 – May 2017). Izingolweni clinic had identified that the staff do not classify the nutritional status of children under 5 years, and they wanted to improve this.
Representatives from the clinic attended the CQI training in October 2016, after which they did a root-cause analysis of the gap and came up with change ideas that were aimed at helping them to reach their aim. Four change ideas were implemented: o The first change idea was implemented in December 2016: In-service training for day and night
staff. After the in-service training, the Nutrition Officer conducted a CQI support visit in January and found that the score was below the one in the previous month, i.e., 3 out of 10 files were now compliant.
o After the support visit in January 2017, the team introduced the change that during the report meetings in the morning, the Operational Manager would remind staff about the importance of documenting classification of nutritional status in the RtHB and all the other clients’ records.
o During the CQI support visit in February 2017, improvement was noted. Now, six out of 10 records were compliant. The team decided that they needed to implement another change idea to increase and sustain the improvement. The Operational Manager delegated a professional nurse to supervise the children in the under 5 unit by observing client consultations to ensure that all children who are consulted are nutritionally assessed and classified. With this change, the team saw an improvement from 6 to 8 out of 10 records compliant in March.
o During the CQI visit in April, the score went down again, and they decided to conduct weekly record reviews where they would be able to identify which staff were not documenting nutritional classification so that the Operational Manager would address them individually. In May 2017, the score showed compliance in 10 out of 10 records that were audited.
4 37
52
7 8 1 5 2
1 11
43
Sept '16 Oct '16 Nov '16 Dec '16 Jan '17 Feb ' 17 March '17 April '17 May '17 June
Bongani Hospital10 deaths out of 47 admissions (51 admissions where clients lived)
SAM admissions Number of deaths
USAID ASSIST Southern Africa Region Report FY17 15
Figure 6. South Africa: Documentation of nutritional classification in the RtHB, Izingolweni, KZN Province (Dec 2016 – May 2017)
In May 2017, the eight supported sites were re-assessed using the same tool that was used during baseline assessment. Figure 7 shows the results of the baseline assessments for the quality of NACS services which were conducted in KwaZulu-Natal and Free State provinces in South Africa in September 2016, compared to the re-assessment results in May 2017. The results show an overall improvement in all the domains. Gcilima Clinic in KZN shows a low score on the observations done on assessment and classification because on the day of the assessment, it was raining and very cold and thus the weights of children, adolescents, and adults were taken with clothes on, e.g. coats and boots.
0
6
3
6
8
6
10
0
1
2
3
4
5
6
7
8
9
10
Baseline ‐Sept2016
1st CQI Visit ‐Dec 2016
2nd CQI Visit ‐Jan 2017
3rd CQI Visit‐Feb2017
4th CQI Visit Mar2017
5th CQI Visit Apr‐2017
Re‐AssessmentMay 2017
In-service training for day and night staff
Conduct weekly audits of RtHBweekly to identify gaps
Delegation of supervision to the professional nurse
Reminders about documentation during the morning meetings

16 USAID ASSIST Southern Africa Region Report FY17
Figure 7. South Africa: Dashboards (baseline and re-assessment) for NACS services, 8 sites in KwaZulu-Natal and Free State (Sept 2016, May 2017)
BASELINE SEPTEMBER 2016 RE-ASSESSMENT MAY 2017 KwaZulu-Natal Free State KwaZulu-Natal Free State
Bho
bho
yi
Clin
ic
Gci
lima
Clin
ic
Izin
golw
eni
C
linic
Mur
chis
on
Hos
pita
l
Tsh
epo
ng
Clin
ic
Tha
bong
C
linic
Chi
ef A
. Lu
thu
li C
linic
Bon
gan
i H
ospi
tal
Bho
bho
yi
Clin
ic
Gci
lima
Clin
ic
Izin
golw
eni
C
linic
Mur
chis
on
Hos
pita
l
Tsh
epo
ng
Clin
ic
Tha
bong
C
linic
Chi
ef A
. Lu
thu
li C
linic
Bon
gan
i H
ospi
tal
Staff component 57 43 25 71 0 100 0 0 100 100 100 100 100 100 100 100
Nutrition services 100 100 100 100 61 86 67 16 100 100 100 100 92 100 92 30
Assessment & Classification
75 40 39 100 6 8 9 6 75 33 60 80 77 25 74 62
Equipment & Tools 100 100 92 100 61 72 61 56 100 96 100 100 100 100 100 82
Education & Counselling 78 35 19 100 4 10 22 30 83 62 67 100 87 17 61 78
Commodity Management
81 74 87 100 67 88 83 66 94 81 92 100 60 81 75 91
Referral 55 55 100 20 50 100 56 25 100 81 92 100 82 55 64 100
Monitoring & Evaluation 48 39 50 31 36 70 43 51 94 97 100 100 76 66 70 66
Overall Score 74 61 64 79 36 67 43 31 93 81 90 98 84 68 79 76

USAID ASSIST Southern Africa Region Report FY17 17
Mozambique
The first CQI mentoring and coaching visit was done in Moatize Hospital and Health Facility 4 on 12 – 15 June 2017. The objectives of the support visit were to: o Orient staff on CQI methodology and the use of PDSA cycle in addressing the gaps. o Mentor staff on the application of CQI methodology to address the gaps identified during the
baseline assessment. o Improve data collection of the following indicators: # of ART clients diagnosed with SAM and
MAM (sex disaggregated), # of pregnant women diagnosed with SAM and MAM, # of pregnant women with malnutrition and HIV +ve, # of children below 5 years with SAM and MAM (sex disaggregated), and # of children below 5 with malnutrition and HIV +ve.
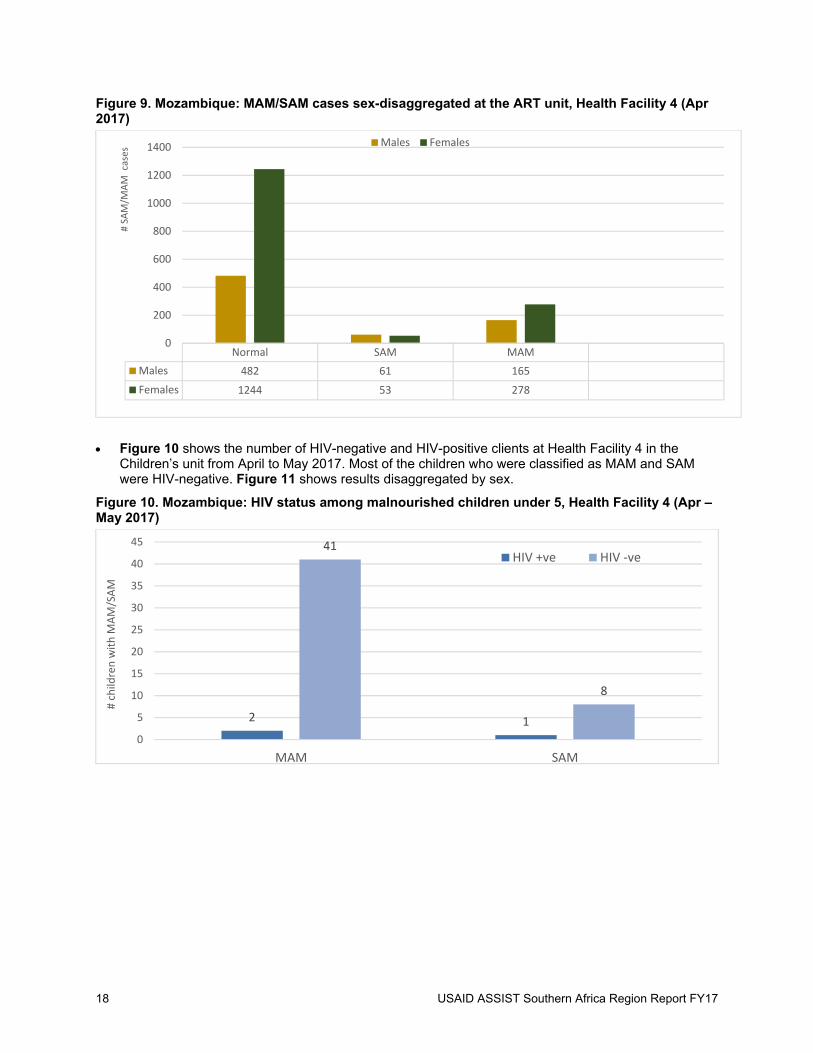
Figure 8 shows the differences in the number of male and female clients diagnosed with MAM and SAM in the ART unit in Health Facility Number 4 in April 2017. that in the ART unit in Health Facility 4, there were more MAM cases than SAM. More clients were diagnosed with MAM than SAM and females were high compared to males, and slightly more males than females were diagnosed with SAM. Figure 9 shows that in the ART unit in Health Facility 4, there were more MAM cases than SAM. More clients were diagnosed with MAM than SAM and females were high compared to males, and slightly more males than females were diagnosed with SAM.
Figure 8. Mozambique: Number of clients with MAM and SAM in the ART unit by gender, Health Facility 4, Mozambique (Apr 2017)
235
84
43
Mozambique: Number of Male clients with MAM and SAM in the ART unit,
Health Facility 4, Mozambique (Apr 2017)
NORMAL MAM
SAM
609
132
19
Mozambique: Number of Female clients with MAM and SAM in the ART unit, Health
Facility 4, Mozambique (Apr 2017)
Normal MAM SAM
18 USAID ASSIST Southern Africa Region Report FY17
Figure 9. Mozambique: MAM/SAM cases sex-disaggregated at the ART unit, Health Facility 4 (Apr 2017)
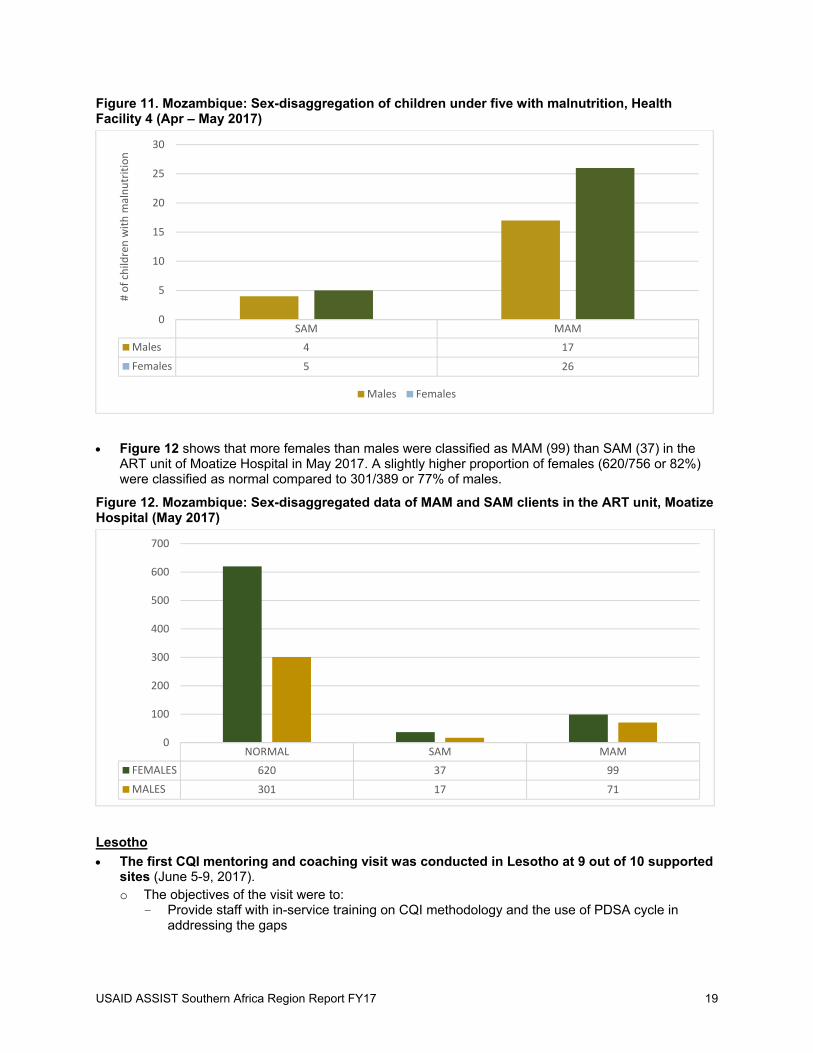
Figure 10 shows the number of HIV-negative and HIV-positive clients at Health Facility 4 in the Children’s unit from April to May 2017. Most of the children who were classified as MAM and SAM were HIV-negative. Figure 11 shows results disaggregated by sex.
Figure 10. Mozambique: HIV status among malnourished children under 5, Health Facility 4 (Apr – May 2017)
Normal SAM MAM
Males 482 61 165
Females 1244 53 278
0
200
400
600
800
1000
1200
1400
# SA
M/M
AM cases
Males Females
2 1
41
8
0
5
10
15
20
25
30
35
40
45
MAM SAM
# child
ren with M
AM/SAM
HIV +ve HIV ‐ve
USAID ASSIST Southern Africa Region Report FY17 19
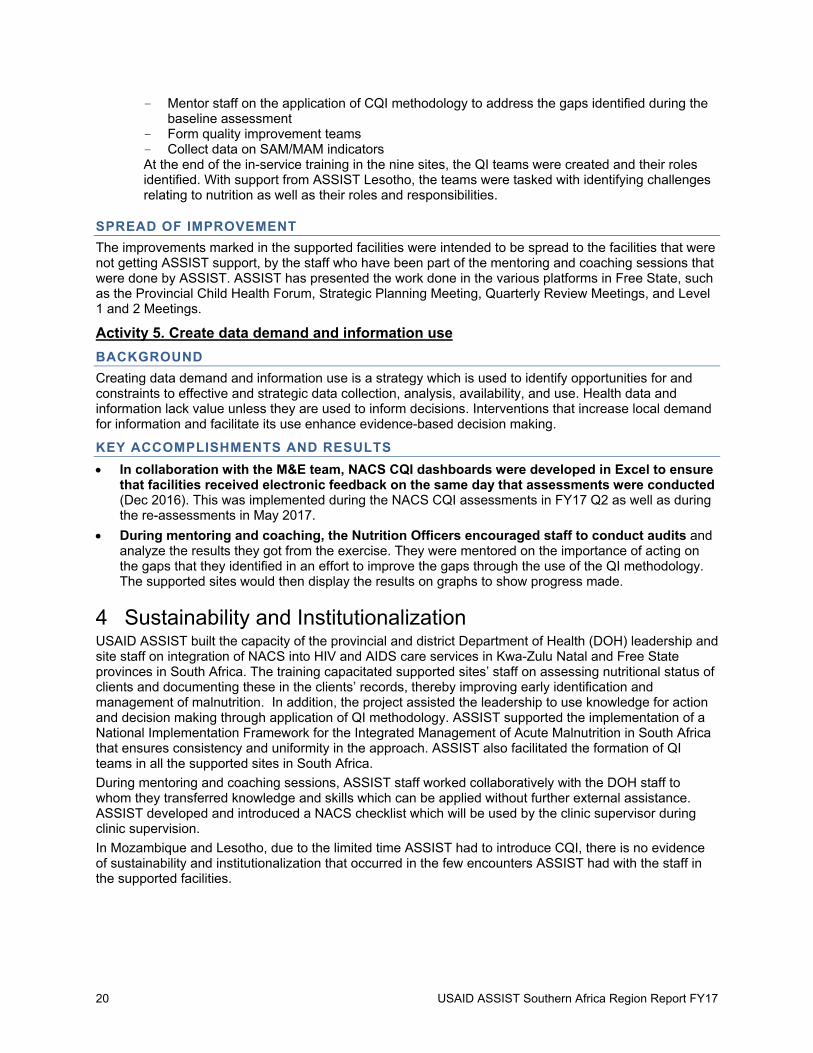
Figure 11. Mozambique: Sex-disaggregation of children under five with malnutrition, Health Facility 4 (Apr – May 2017)
Figure 12 shows that more females than males were classified as MAM (99) than SAM (37) in the ART unit of Moatize Hospital in May 2017. A slightly higher proportion of females (620/756 or 82%) were classified as normal compared to 301/389 or 77% of males.
Figure 12. Mozambique: Sex-disaggregated data of MAM and SAM clients in the ART unit, Moatize Hospital (May 2017)
Lesotho
The first CQI mentoring and coaching visit was conducted in Lesotho at 9 out of 10 supported sites (June 5-9, 2017). o The objectives of the visit were to:
- Provide staff with in-service training on CQI methodology and the use of PDSA cycle in addressing the gaps
SAM MAM
Males 4 17
Females 5 26
0
5
10
15
20
25
30
# of child
ren with m
alnutrition
Males Females
NORMAL SAM MAM
FEMALES 620 37 99
MALES 301 17 71
0
100
200
300
400
500
600
700
20 USAID ASSIST Southern Africa Region Report FY17
- Mentor staff on the application of CQI methodology to address the gaps identified during the baseline assessment
- Form quality improvement teams - Collect data on SAM/MAM indicators At the end of the in-service training in the nine sites, the QI teams were created and their roles identified. With support from ASSIST Lesotho, the teams were tasked with identifying challenges relating to nutrition as well as their roles and responsibilities.
SPREAD OF IMPROVEMENT
The improvements marked in the supported facilities were intended to be spread to the facilities that were not getting ASSIST support, by the staff who have been part of the mentoring and coaching sessions that were done by ASSIST. ASSIST has presented the work done in the various platforms in Free State, such as the Provincial Child Health Forum, Strategic Planning Meeting, Quarterly Review Meetings, and Level 1 and 2 Meetings.
Activity 5. Create data demand and information use
BACKGROUND
Creating data demand and information use is a strategy which is used to identify opportunities for and constraints to effective and strategic data collection, analysis, availability, and use. Health data and information lack value unless they are used to inform decisions. Interventions that increase local demand for information and facilitate its use enhance evidence-based decision making.
KEY ACCOMPLISHMENTS AND RESULTS
In collaboration with the M&E team, NACS CQI dashboards were developed in Excel to ensure that facilities received electronic feedback on the same day that assessments were conducted (Dec 2016). This was implemented during the NACS CQI assessments in FY17 Q2 as well as during the re-assessments in May 2017.
During mentoring and coaching, the Nutrition Officers encouraged staff to conduct audits and analyze the results they got from the exercise. They were mentored on the importance of acting on the gaps that they identified in an effort to improve the gaps through the use of the QI methodology. The supported sites would then display the results on graphs to show progress made.
4 Sustainability and Institutionalization USAID ASSIST built the capacity of the provincial and district Department of Health (DOH) leadership and site staff on integration of NACS into HIV and AIDS care services in Kwa-Zulu Natal and Free State provinces in South Africa. The training capacitated supported sites’ staff on assessing nutritional status of clients and documenting these in the clients’ records, thereby improving early identification and management of malnutrition. In addition, the project assisted the leadership to use knowledge for action and decision making through application of QI methodology. ASSIST supported the implementation of a National Implementation Framework for the Integrated Management of Acute Malnutrition in South Africa that ensures consistency and uniformity in the approach. ASSIST also facilitated the formation of QI teams in all the supported sites in South Africa.
During mentoring and coaching sessions, ASSIST staff worked collaboratively with the DOH staff to whom they transferred knowledge and skills which can be applied without further external assistance. ASSIST developed and introduced a NACS checklist which will be used by the clinic supervisor during clinic supervision.
In Mozambique and Lesotho, due to the limited time ASSIST had to introduce CQI, there is no evidence of sustainability and institutionalization that occurred in the few encounters ASSIST had with the staff in the supported facilities.

USAID ASSIST Southern Africa Region Report FY17 21
5 Knowledge Management Products and Activities Disseminated the Lesotho baseline assessment findings during a presentation at key stakeholders’
meeting in Lesotho (Mar 2017).
A close-out meeting was held on Sept 11, 2017, with Ugu District and the KZN provincial office representatives where the lessons learned were shared with the attendants. The supported facilities presented their quality improvement projects to the audience. In this meeting the facilities and the Acting District Manager promised to continue with the work that was done by ASSIST. The Nutrition Director welcomed the work done by ASSIST and urged the facilities and supervisor to monitor the quality improvement projects that were initiated by the facilities. She requested ASSIST to compile an approach that they used to support the district so that it can be shared with other partners. She applauded ASSIST in the manner in which they supported the district with success.
6 Gender Integration ASSIST staff were trained on integrating gender in QI in February 2017. Improvement activities in
South Africa collected and analyzed some nutrition data by sex, to identify gender-related gaps or issues and address them with targeted improvement activities. Sex-disaggregated data was only collected in Mozambique. This was possible because their DHIS captures it as such. Due to time constraints in ASSIST’s support to the sites, there wasn’t enough time to identify gender-related gaps and develop change ideas to address them.


USAID APPLYING SCIENCE TO STRENGTHEN AND IMPROVE SYSTEMS PROJECT
University Research Co., LLC
5404 Wisconsin Avenue, Suite 800
Chevy Chase, MD 20815
Tel: (301) 654-8338
Fax: (301) 941-8427
www.usaidassist.org