USAID Trade Project - United States Agency for …pdf.usaid.gov/pdf_docs/PA00K25K.pdfUS Agency for...
18
US Agency for International Development (USAID) Trade Project USAID Trade Project USAID/Pakistan Office of Economic Growth & Agriculture Contract Number: EEM-I-00-07-00005 Deloitte Consulting, LLP May 31, 2012 Disclaimer: This publication was produced for review by the United States Agency for International development. It was prepared by Deloitte Consulting, LLP. USAID Trade Project Quarterly Trade Bulletin Fiscal Year 2012, Quarter 3 (January - March)
-
Upload
hoanghuong -
Category
Documents
-
view
231 -
download
8
Transcript of USAID Trade Project - United States Agency for …pdf.usaid.gov/pdf_docs/PA00K25K.pdfUS Agency for...

US Agency for International Development (USAID) Trade Project
USAID Trade Project USAID/Pakistan Office of Economic Growth & Agriculture Contract Number: EEM-I-00-07-00005 Deloitte Consulting, LLP May 31, 2012 Disclaimer: This publication was produced for review by the United States Agency for International development. It was prepared by Deloitte Consulting, LLP.
USAID Trade Project Quarterly Trade Bulletin Fiscal Year 2012, Quarter 3 (January - March)

US Agency for International Development (USAID) Trade Project
Table of Contents
Introduction .............................................................................................................................. 1
Background ............................................................................................................................. 1
Report Structure ..................................................................................................................... 1
Macroeconomic Outlook ......................................................................................................... 2
Export of Goods ....................................................................................................................... 5
Import of Goods ....................................................................................................................... 7
Import/Export Markets ............................................................................................................. 8
Trade-Related Projects in Pakistan ..................................................................................... 10
European Union (EU) - Trade Related Technical Assistance II (TRTA) ............................. 10
The World Bank - Trade & Transport Facilitation Program (TTFP-2) ................................. 10
Asian Development Bank – National Highway Sector Development Program ................... 10
Multi Donor Trust Fund (MDFT) - Economic revitalization of KP and FATA ....................... 10
Pakistan Poverty Alleviation Fund (PPAF)........................................................................... 10
Punjab Government - Punjab Economic Opportunities Programme (PEOP) ..................... 11
ADB – Karachi Harbor Crossing Project .............................................................................. 11
Annex 1: End Notes ............................................................................................................... 12
Annex 2: General Trade Related Figures of Pakistan ....................................................... 13
Annex 2: Acronyms ............................................................................................................... 15

US Agency for International Development (USAID) Trade Project 1
Introduction Background In response to Pakistan’s worsening trade situation as indicated by declining exports and low ranking (84 out of 118 countries) in the 2008 Global Enabling Trade Report Index, the USAID launched the USAID Trade Project on June 22, 2009 with three key aims: 1) to improve Pakistan’s overall trade environment through improved regulations, policies, systems and capacity; (2) to increase cross-border trade with Pakistan’s neighbors, especially with Afghanistan through implementation of the Afghan Pakistan Transit Trade Agreement; and (3) to support the implementation of sustainable and competitive Special Economic Zones (SEZs) and the Reconstruction Opportunity Zones (ROZs) program.
Report Structure The present report’s structure begins with an introduction; a brief overview of macroeconomic outlook, export/import of goods, export/import markets, and introduction of trade related projects other than those of USAID. This report also includes a series of data tables collected from different sources, primarily the State Bank of Pakistan (SBP) and the Pakistan Bureau of Statistics (PBS). In addition, various news sources such as the Business Recorder, Dawn, and The News among others have also been used for background information. The report is required as part of the project work plan to make available up-to-date market information and a current trade scenario in the country to all relevant stakeholders.

US Agency for International Development (USAID) Trade Project 2
Macroeconomic Outlook Pakistan’s economy continues to deal with economic challenges. The country’s trade deficit for the first nine months of the ongoing fiscal year FY 2012 (July-March) crossed the USD $16 billion mark according to the latest figures released by the Pakistan Bureau of Statistics (PBS). Exports fell by 3.03 percent to USD $17.190 billion in FY 2012 (July-March), from USD $17.727 billion in the same period last year.1 The Trade Development Authority of Pakistan (TDAP) expects the ongoing fiscal year’s 2012 (July-June) exports to be to the tune of USD $23 billion.2 Depreciation of the Pakistani Rupee (PKR), rising oil prices in the global market, and the decline in prices of textile commodities – Pakistan’s major export – have been highlighted as the primary reasons behind the rising deficit. Imports of several commodities, including fertilizer and food products, also contributed to the rising deficit. The amount paid for external debt serving by the country increased; according to the State Bank of Pakistan (SBP) debt servicing for the period FY 2012 (Jan-March) stood at USD $912 million. The country made payments worth USD $452 million to the International Monetary Fund (IMF) in this period.3 Due to these debt payments, the country’s foreign exchange reserves, after crossing the USD $18 million mark in last July, are declining. The value of the PKR is also consistently depreciating against major foreign currencies including the US dollar in the past twelve months. It is expected that the PKR will continue to remain under pressure if concrete steps to rejuvenate exports and bring in foreign investment are not taken. The sale of 3G telecommunication licenses, expected to inject much needed foreign investment in the country, was delayed by the Pakistan Telecommunications Authority (PTA). It is expected that these licenses will generate approximately USD $1 billion for the country and improve Pakistan’s exchange reserves position. 4 Pakistan is also seeking the release of funds from the United States under the Coalition Support Fund (CSF). Remittances sent home by overseas Pakistanis continued, increasing by 25.17 percent in the period under review in comparison to the same period last year. The Pakistan Remittance Initiative (PRI), aims to reduce impediments to send remittances to the country, continues to be highlighted by the SBP as playing an important role in increasing workers remittances by SBP.5 Key markets from where remittances originated include Saudi Arabia, UAE, USA and UK.6 Inflation levels in this period were lower than the prior year. Average Consumer Price Index (CPI) inflation for FY 2012 (Jan-Mar) was 10.65 percent, in comparison to 13.42 percent observed in FY2011 (Jan-Mar). CPI reached a low of 9.75 percent in December 2011 but has since slightly increased due to a surge in petroleum prices and electricity charges.
# Indicator Period FY2011 FY2012 1 Consumer Price Index % (12mma) Jan-Mar 13.42 10.65 2 Current Account Deficit (% of GDP) Jan-Mar -1.70% -2.52% 3 Exports (FOB) US$ billion Jan-Mar 6.91 5.99 4 Imports (CIF) US$ billion Jan-Mar 9.91 10.61 5 GDP growth rate (%) Jul-Jun 2.4a 3.8 b 6 Average Forex Reserves (USD $ billion) Jan-Mar 17.48 16.60 7 Foreign Direct Investment (USD $ million) Jan-Mar 317.6 67.2 8 Remittances (USD $ million) N/A 2,725 3,411
Source: PBS/SBP, Estimate for FY2011, SBP Forecast

US Agency for International Development (USAID) Trade Project 3
The State Bank of Pakistan (SBP) predicts that due to inflationary pressures, the CPI may not decline to single digit levels in the next fiscal year FY 2013 (July-June). As per the Medium Term Budgetary Framework (MTBF), the government targeted inflation in FY 2013 (July-June) at 9.5 and 8 percent in FY 2014 (July-June).7 Reasons behind the high inflation projection include heavy government borrowing, low investment, weakening PKR, and rising price of oil in the international market.
The SBP continues to maintain a 12 percent interest rate since October 2011, and did not resort to any further cuts in the period under review due to the overall macroeconomic conditions in the country (such as expectations of high inflation levels in the future). In comparison to economies in the region, Pakistan still has a relatively high interest rate. The SBP recently increased the minimum savings rate on bank savings accounts from 5 to 6 percent.8 The country’s trade deficit also continues to widen; Pakistan Bureau of Statistics (PBS) reports that exports declined by 13.31 percent in the period under review over last year. Imports, however, surged by 7.06 percent. The decrease in textile exports, attributed to the ongoing energy crisis and decline in prices of textile commodities in the international market, contributed towards this decline. Textile exports account for a large percentage of the country’s total export receipts.
7.08.09.0
10.011.012.013.014.015.0
Perc
ent
Source: PBS
CPI Index Year over Year Change
5001,0001,5002,0002,5003,0003,5004,0004,5005,000
Mill
ions
US
$
Source: PBS
Exports Imports Linear (Exports) Linear (Imports)

US Agency for International Development (USAID) Trade Project 4
The Institute of Public Policy (IPP) expects that the Gross Domestic Product (GDP) growth rate in Pakistan for FY 2012 (July-June) to be 2.7 percent, falling short of the Government’s 4 percent GDP growth rate target for FY2012 (July-June).9 Despite slow economic growth, tax revenue collection by the Federal Board of Authority in the country still increased by 24.10 percent to PKR 1,266.04 billion (USD $14.07 billion) during FY 2012 (July-March), in comparison to the same period last year.10 Export of services in FY 2012 (July-Feb) stood at USD $3,252.27 million against USD $5,172.81 million recorded for services imported in the same period. Sectors making up the country’s services exports include transportation, government, business services, travel, communication and IT.11 Latest figures released by the SBP indicate that Foreign Direct Investment (FDI) in the country declined by 78.85 percent to USD $67.20 million in FY 2012 (Jan-Mar) compared to the prior year. The ongoing energy crisis, variable security, and political instability deter foreign investors from exploring opportunities in the country. Major markets of origin for FDI arriving in Pakistan in FY 2012 (Jan-Mar) include China, USA, Italy, Switzerland, Hong Kong, UK and UAE. The power crisis in the country continues unabated; output of the local industry is hampered by several hours of load shedding each day. The power shortfall in the country recently increased to 5,500 MW with total demand standing at 15,664 MW against production of 11,164 MW.12 Reduced water inflows to the reservoirs of Mangla and Tarbela and fuel cuts to oil-based power are highlighted as reasons for the spike in the national power deficit. Pakistan remains dependent on oil and gas based fuel generation and needs to begin diversifying to meet demands. Some energy projects promising to help the country in the future are in the pipeline. The Asian Development Bank and the Islamic Development Bank recently agreed to provide USD $133 million to fund two wind power projects.13 Other initiatives, such as the proposed Turkmenistan, Afghanistan, Pakistan and India (TAPI) gas pipeline have the potential to help Pakistan meet its energy demands in addition to improving regional cooperation between member countries. A cross-border 3,300 MW electricity transmission project, called CASA-1000, connecting Kyrgyzstan and Tajikistan to Pakistan through Afghanistan has also been recently proposed.14

US Agency for International Development (USAID) Trade Project 5
Export of Goods Pakistan’s exports declined by 13.31 percent in FY 2012 (Jan-Mar), in comparison to the same period last year. The textile sector, the country’s major export industry, experienced declines in the period under review. Power shortages in the country and lower prices of textile commodities in the international market contributed to the aforementioned decline. The Pakistan Bureau of Statistics (PBS) reports that textiles exports declined by 9.6 percent (or USD $1.076 billion) during FY2012 (July-April).15 Pakistani textile exporters have also recently expressed concerns over recent revision of EU trade concessions package for Pakistan. The revised concession package that may hamper textile exports from Pakistan to the EU is expected to become operational in the second half of 2012.16 All Pakistan Textile Mills Association (APTMA) highlighted that the textile industry suffered a loss of USD $9 billion in the FY2012 (Jul-Mar) due to problems in the industry.17 Due to the lack of diversification in exports, the country’s total export receipts are heavily dependent on the performance of the textile sector. It should, however, be noted that the recent depreciation of the PKR may help textile exports in the future. The Pakistan Tanners Association (PTA) highlighted that the country’s leather exporters fear decline in exports in the coming future due to rising production costs that are making Pakistani leather products uncompetitive in the international market.18 In order to avoid shortages of raw materials used by the leather industry, the association suggested that the government impose restrictions on the quantity of live animal exports. The country, despite initial efforts and significant potential, has been unable to export significant quantities of mangos to the United States and other markets due to its inability to meet associated phytosanitary requirements. A need for improving fruit storage and sanitation facilities is needed for the country to utilize this opportunity.19 The United States Agency for International Development (USAID) recently funded a livestock export training program that will deliver training pertaining to international dairy and meat standards.20 The program is part of the joint efforts by USAID and the Agribusiness Support Fund (ASF) to increase competitiveness and productivity of the country’s agricultural sector.
TABLE 1 : TOP 10 EXPORT COMMODITIES (BY VALUE)
Top 10 Export commodities
Jan-Mar (Thousand US $) Change
in Value %
Change FY2011 FY2012 Cotton Cloth 627,702 615,172 (12,531) -2.00% Knitwear 691,811 508,572 (183,239) -26.49% Bed Wear 495,959 442,985 (52,974) -10.68% Cotton Yarn 539,316 399,971 (139,345) -25.84% Readymade Garments 273,616 353,329 79,713 29.13% Rice (Non-Basmati) 257,472 348,956 91,484 35.53% Rice Basmati 291,169 274,889 (16,280) -5.59% Raw Cotton 68,934 215,073 146,140 212.00% Towels 150,292 165,870 15,578 10.37% Solid Fuel (incl Naptha) 105,676 151,910 46,234 43.75%
Source: SBP

US Agency for International Development (USAID) Trade Project 6
Jewelry exports showed an increase in the period under review. Recently a committee was setup by the Government for the promotion of Pakistani gems and jewelry in global markets. The committee aims to increase gems and Jewelry exports to USD $5.5 billion by 2016-17.21 In addition, the Pakistan Gems and Jewellery Development Company (PGJMC) is also operating gem testing labs in the country to promote the industry. The All Pakistan Gems & Jewelry Manufacturers Association (APGJMA) is of the view that there is still vast untapped potential in the gems and jewelry sector of the country. If gems and jewelry manufacturing and processing capabilities of the country are enhanced, export performance can be greatly enhanced. 22 Export of auto parts also increased during the period under review. There are over 200 auto parts manufacturers in the country and the Pakistan Association of Automotive Parts and Accessories Manufacturers (PAAPAM), is eyeing to boost exports of auto parts to USD $250 million export by 2014 with the collaboration of Trade Development Authority of Pakistan (TDAP).23 Export of sports goods including footballs and gloves witnesses an increase as well. Work is on-going for the establishment of a Sports Industries Development Centre (SIDC) in the country, which will allow the local sports industry to adopt modern technologies for production conduct workforce training24. Seafood exports surged by 18.31 percent to reach USD $80.20 million, in the period under review according to figures released by the State Bank of Pakistan (SBP). The Government of Pakistan is presently engaged in providing assistance to seafood processing units in the country to improve their operations in order to meet international standards, which will assist the Pakistani seafood industry in increasing its exports. The country’s rice exports saw an increase in the period under review as Pakistani rice exporters took advantage of the shortage of rice supply in the international market created due to the recent floods in Thailand. Pakistan’s rice exporters have improved performance, with exports to Malaysia increasing by 244 percent in the last two years.25 China also recently permitted basmati rice imports from India which is likely to make the Chinese market more competitive for Pakistani rice exporters. This decision comes at a time when there have been considerable increases in production and export of rice from India.26 The Basmati Growers Association (BGA) states that Pakistan’s total basmati rice export potential, is valued at USD $4 billion, is not properly utilized as there is still room for increasing production. The association believes that there is a need to adopt value addition methods, introduce high yield rice varieties, reduce trademark registration impediments, and focus on decreasing post-harvest losses.27
TABLE 2: TOP 10 RISING EXPORT COMMODITIES (BY VALUE)
Top 10 Export commodities
Jan-Mar (Thousand US $) Increase
in value %
Increase FY2011 FY2012
Raw Cotton 68,934 215,073 146,140 212.00%
Rice (Non-Basmati) 257,472 348,956 91,484 35.53%
Readymade Garments 273,616 353,329 79,713 29.13%
Jewelry 59,597 109,578 49,981 83.86% Solid Fuel including Naptha 105,676 151,910 46,234 43.75%
Guar and Guar Products 13,390 39,793 26,403 197.19%
Plastic Materials 117,506 139,566 22,060 18.77%
Towels 150,292 165,870 15,578 10.37%
Sports Goods 117,065 130,420 13,356 11.41%
Madeup Textile Articles 86,217 99,543 13,326 15.46%
Source: SBP
US Agency for International Development (USAID) Trade Project 7
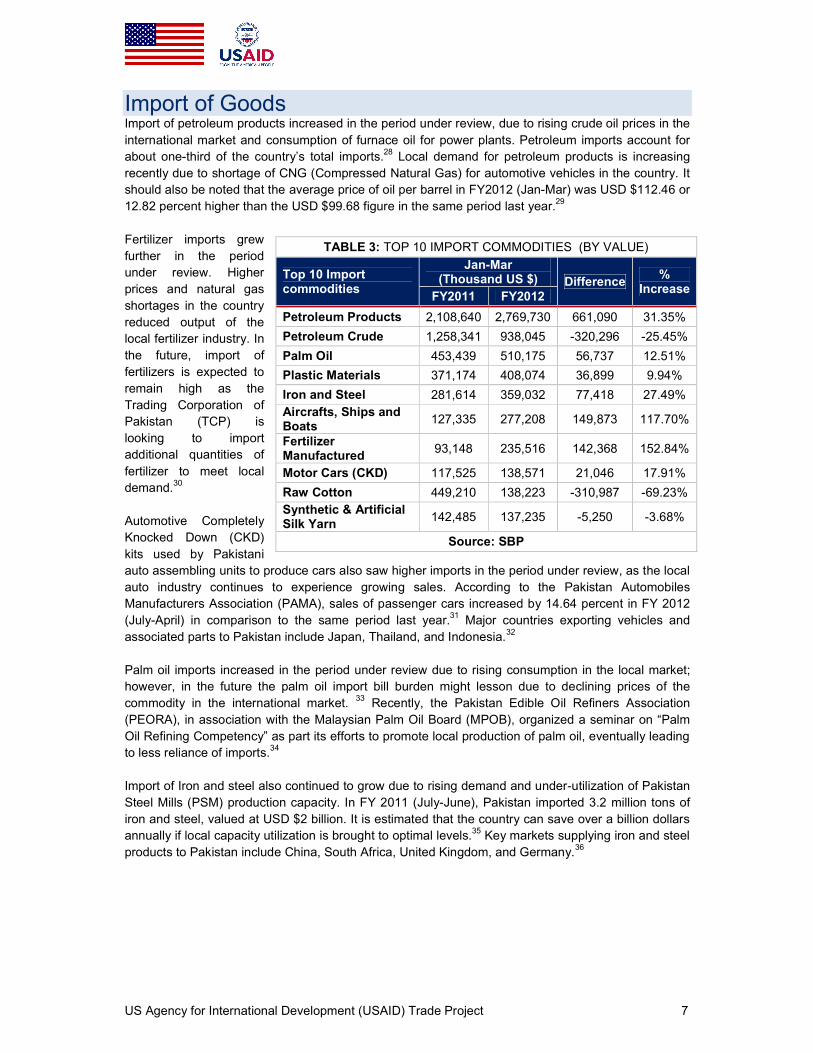
Import of Goods Import of petroleum products increased in the period under review, due to rising crude oil prices in the international market and consumption of furnace oil for power plants. Petroleum imports account for about one-third of the country’s total imports.28 Local demand for petroleum products is increasing recently due to shortage of CNG (Compressed Natural Gas) for automotive vehicles in the country. It should also be noted that the average price of oil per barrel in FY2012 (Jan-Mar) was USD $112.46 or 12.82 percent higher than the USD $99.68 figure in the same period last year.29 Fertilizer imports grew further in the period under review. Higher prices and natural gas shortages in the country reduced output of the local fertilizer industry. In the future, import of fertilizers is expected to remain high as the Trading Corporation of Pakistan (TCP) is looking to import additional quantities of fertilizer to meet local demand.30 Automotive Completely Knocked Down (CKD) kits used by Pakistani auto assembling units to produce cars also saw higher imports in the period under review, as the local auto industry continues to experience growing sales. According to the Pakistan Automobiles Manufacturers Association (PAMA), sales of passenger cars increased by 14.64 percent in FY 2012 (July-April) in comparison to the same period last year.31 Major countries exporting vehicles and associated parts to Pakistan include Japan, Thailand, and Indonesia.32 Palm oil imports increased in the period under review due to rising consumption in the local market; however, in the future the palm oil import bill burden might lesson due to declining prices of the commodity in the international market. 33 Recently, the Pakistan Edible Oil Refiners Association (PEORA), in association with the Malaysian Palm Oil Board (MPOB), organized a seminar on “Palm Oil Refining Competency” as part its efforts to promote local production of palm oil, eventually leading to less reliance of imports.34 Import of Iron and steel also continued to grow due to rising demand and under-utilization of Pakistan Steel Mills (PSM) production capacity. In FY 2011 (July-June), Pakistan imported 3.2 million tons of iron and steel, valued at USD $2 billion. It is estimated that the country can save over a billion dollars annually if local capacity utilization is brought to optimal levels.35 Key markets supplying iron and steel products to Pakistan include China, South Africa, United Kingdom, and Germany.36
TABLE 3: TOP 10 IMPORT COMMODITIES (BY VALUE)
Top 10 Import commodities
Jan-Mar (Thousand US $) Difference %
Increase FY2011 FY2012 Petroleum Products 2,108,640 2,769,730 661,090 31.35% Petroleum Crude 1,258,341 938,045 -320,296 -25.45% Palm Oil 453,439 510,175 56,737 12.51% Plastic Materials 371,174 408,074 36,899 9.94% Iron and Steel 281,614 359,032 77,418 27.49% Aircrafts, Ships and Boats 127,335 277,208 149,873 117.70%
Fertilizer Manufactured 93,148 235,516 142,368 152.84%
Motor Cars (CKD) 117,525 138,571 21,046 17.91% Raw Cotton 449,210 138,223 -310,987 -69.23% Synthetic & Artificial Silk Yarn 142,485 137,235 -5,250 -3.68%
Source: SBP

US Agency for International Development (USAID) Trade Project 8
U. S. A.15.24%
U.A.E 8.79%
China8.42%
U. K.5.34%
Germany4.72%
Afghanistan3.92%Bangladesh
3.03%Italy
2.50%
Turkey2.37%
South Korea2.29%
Others43.37%
Figure 1; Share in Exports (Jan-Mar/ FY2012)
Import/Export Markets Pakistan’s exports for the period under review FY 2011-12 (Jan-Mar) still remain largely concentrated around traditional export partners. There is a need for diversification of the country’s exports to different markets across the world. Exports to the top 10 countries made up 56.63 percent of the country’s total exports. The United States continues to be the largest recipient of exports from Pakistan, followed by the UAE, China, and the United Kingdom. The recent decline in exports to some countries is primarily due to lower exports of textile – the country’s major export commodity. In FY 2012 (Jan-Mar), Pakistan maintained a trade surplus of USD $711.50 million with the United States. Exports to the UAE increased to nearly USD $517.39 million in the period under review, but still remains well below USD $1.62 billion worth of imports from the country. Exports to the UAE include gems and jewelry, petroleum products, rice and textiles whereas petroleum products make up the bulk of imports from the country.37 During the recent 10th session of the Pakistan-UAE Joint Ministerial Commission (JMC), the foreign ministers of the two countries met in order to boost trade relations.38 Imports from other Middle Eastern states including Saudi Arabia, Kuwait, and Oman, largely composed of petroleum products as well.39
Exports to Afghanistan declined in the period under review, but continue to remain far higher than imports from the country. Information released by the SBP reveals that the decline is largely due to a drop in the export of petroleum products.40 This drop occurred due to restrictions placed on export of petroleum products by Pakistan to Afghanistan. Pakistan exports a large variety of products to Afghanistan as the country remains dependent on imports due to an underdeveloped industry.
Pakistan’s exports to, and imports from, China did not see any significant change in the period under review. The trade deficit between the two countries stood at USD $546.69 million. The head of Trade Development Authority of Pakistan (TDAP) stated that bilateral trade between the two countries is expected to increase to USD $15 billion annually by 2015.41
TABLE 4 : TOP 10 EXPORT DESTINATIONS (BY VALUE) Top 10 Export Destinations
Jan-Mar (Thousand US $) Difference %
Change FY2011 FY2012 USA 981,255 896,942 -84,313 -8.59% UAE 427,328 517,389 90,061 21.08% China 487,025 495,602 8,577 1.76% UK 324,322 314,313 -10,009 -3.09% Germany 326,167 277,701 -48,466 -14.86% Afghanistan 540,561 230,475 -310,087 -57.36% Bangladesh 341,708 178,150 -163,558 -47.86% Italy 191,211 147,315 -43,896 -22.96% Turkey 190,752 139,249 -51,503 -27.00% South Korea 122,850 134,798 11,948 9.73%
Source: SBP
US Agency for International Development (USAID) Trade Project 9
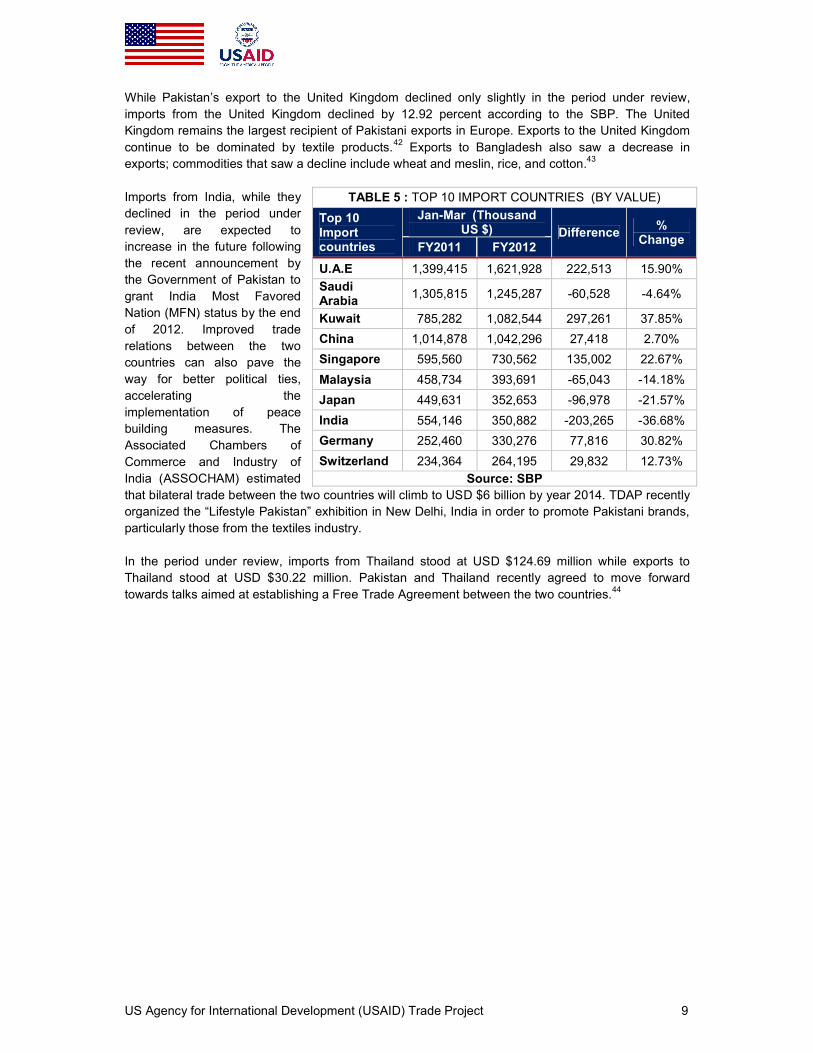
While Pakistan’s export to the United Kingdom declined only slightly in the period under review, imports from the United Kingdom declined by 12.92 percent according to the SBP. The United Kingdom remains the largest recipient of Pakistani exports in Europe. Exports to the United Kingdom continue to be dominated by textile products.42 Exports to Bangladesh also saw a decrease in exports; commodities that saw a decline include wheat and meslin, rice, and cotton.43 Imports from India, while they declined in the period under review, are expected to increase in the future following the recent announcement by the Government of Pakistan to grant India Most Favored Nation (MFN) status by the end of 2012. Improved trade relations between the two countries can also pave the way for better political ties, accelerating the implementation of peace building measures. The Associated Chambers of Commerce and Industry of India (ASSOCHAM) estimated that bilateral trade between the two countries will climb to USD $6 billion by year 2014. TDAP recently organized the “Lifestyle Pakistan” exhibition in New Delhi, India in order to promote Pakistani brands, particularly those from the textiles industry. In the period under review, imports from Thailand stood at USD $124.69 million while exports to Thailand stood at USD $30.22 million. Pakistan and Thailand recently agreed to move forward towards talks aimed at establishing a Free Trade Agreement between the two countries.44
TABLE 5 : TOP 10 IMPORT COUNTRIES (BY VALUE) Top 10 Import countries
Jan-Mar (Thousand US $) Difference %
Change FY2011 FY2012 U.A.E 1,399,415 1,621,928 222,513 15.90% Saudi Arabia 1,305,815 1,245,287 -60,528 -4.64%
Kuwait 785,282 1,082,544 297,261 37.85% China 1,014,878 1,042,296 27,418 2.70% Singapore 595,560 730,562 135,002 22.67% Malaysia 458,734 393,691 -65,043 -14.18% Japan 449,631 352,653 -96,978 -21.57% India 554,146 350,882 -203,265 -36.68% Germany 252,460 330,276 77,816 30.82% Switzerland 234,364 264,195 29,832 12.73%
Source: SBP

US Agency for International Development (USAID) Trade Project 10
Trade-Related Projects in Pakistan Below is a list of Trade-related projects, other than those instituted by USAID.
European Union (EU) - Trade Related Technical Assistance II (TRTA) Trade Related Technical Assistance (TRTA-II) program is funded by the European Union (EU). It aims to assist Pakistan in developing the required capacity to deal with challenges in trade, in order to support the county’s integration into the global economy. The overall objective of the programme is to effectively contribute towards poverty alleviation and sustainable development in the country. The main body responsible for the TRTA-II program implementation is the United Nations Industrial Development Organization (UNIDO). The TRTA-II has three components: Component-1 (Trade Policy Capacity Building) is being managed by the International Trade Centre (ITC), Component-II (Export Development through Improvement of the Quality Infrastructure) is under UNDIO itself, and World Intellectual Property Organization (WIPO) is responsible for Component-3 (Strengthening of Intellectual Property Rights). The Ministry of Commerce with assistance from the European Union (EU) and United Nations Industrial Development Organization (UNIDO) is currently working on a Co-operation program on Trade Related Technical Assistance (TRTA II). The TRTA II program started implementation on 01 January 2010. (Status – Active)
The World Bank - Trade & Transport Facilitation Program (TTFP-2) The Trade & Transport Facilitation Program (TTFP-2), with a total funding of USD $25 million obtained from the World Bank (WB), aims to improve Pakistan’s international competitiveness through simplified export and import documentary procedures, modernization of related legislation and creation of a national capacity to solve potential problems between the transport users and providers. The project has two components: (I) National Trade Corridor, and (II) Trade and Transport Facilitation. The project is planned to continue operating till the end of 2013. (Status – Active)
Asian Development Bank – National Highway Sector Development Program The National Highway Sector Development Program with the 2nd tranche of US$230 million aims at reduction of transport costs for goods and passengers and to improve the regional connectivity to the country’s main economic centers. It will lead to the improvement of road sector efficiency on the main transport corridor in Pakistan and institutional capacity building of National Highway Authority (NHA). The project is scheduled to operate till the end of 2013. (Status – Active)
Multi Donor Trust Fund (MDFT) - Economic revitalization of KP and FATA The aim of this USD $20 million project is to support the Government of Pakistan in its effort to stimulate economic growth in Khyber Pakhtunkhwa (KP) and Federally Administered Tribal Areas (FATA) through the creation of various employment opportunities via institutional capacity building, investment mobilization and by providing support to Small and Medium Enterprises (SMEs). The project has three components: (1) SME development, (II) Attracting Investments from the Diaspora, and (III) Institution Building to Foster Investment and Implement Regulatory Reforms. The implementing agencies for this project include the Government of KP and FATA secretariat. (Status – Active)
Pakistan Poverty Alleviation Fund (PPAF) The Pakistan Poverty Alleviation Fund (PPAF) project is designed to bring about economic uplift in the country by providing better income opportunities to poor people. The project is focused on low income groups from urban and rural communities. PPAF is present in 129 districts of the country through its partner organizations. The Third Pakistan Poverty Alleviation Fund (PPAF III) project, funded by World Bank, was initiated in August 2009 and is scheduled to continue operating till 2015. (Status – Active)

US Agency for International Development (USAID) Trade Project 11
Punjab Government - Punjab Economic Opportunities Programme (PEOP) The UKAID Department for International Development (DFID) Punjab Economic Opportunities Programme (PEOP) has been formulated in cooperation with the Government of Pakistan. The BP £55 million program focuses on poverty alleviation in four districts of Punjab province -Bahawalpur, Bahawalnagar, Lodhran and Muzaffargarh- by enhancing livestock quality and quantity, thereby supporting overall economic uplift in the region. Key features of the program include: (I) Skill development, (II) Livestock and dairy development, (III) Center for Inclusive Growth, and (IV) Technical assistance. The program is scheduled to continue operating till the end of 2012. (Status – Active)
ADB – Karachi Harbor Crossing Project The USD $225,000 technical assistance fund under the project plans to: - (I) rationalize Karachi Port Trust’s current business strategy and future investment plans; and (II) build its financial planning and forecasting capacity. It will also establish bankability of the Karachi harbor Crossing Project on a non-sovereign basis. Additionally, a $200 million loan from ADB is in the pipeline for approval in 2013. (Status – Active)
US Agency for International Development (USAID) Trade Project 12
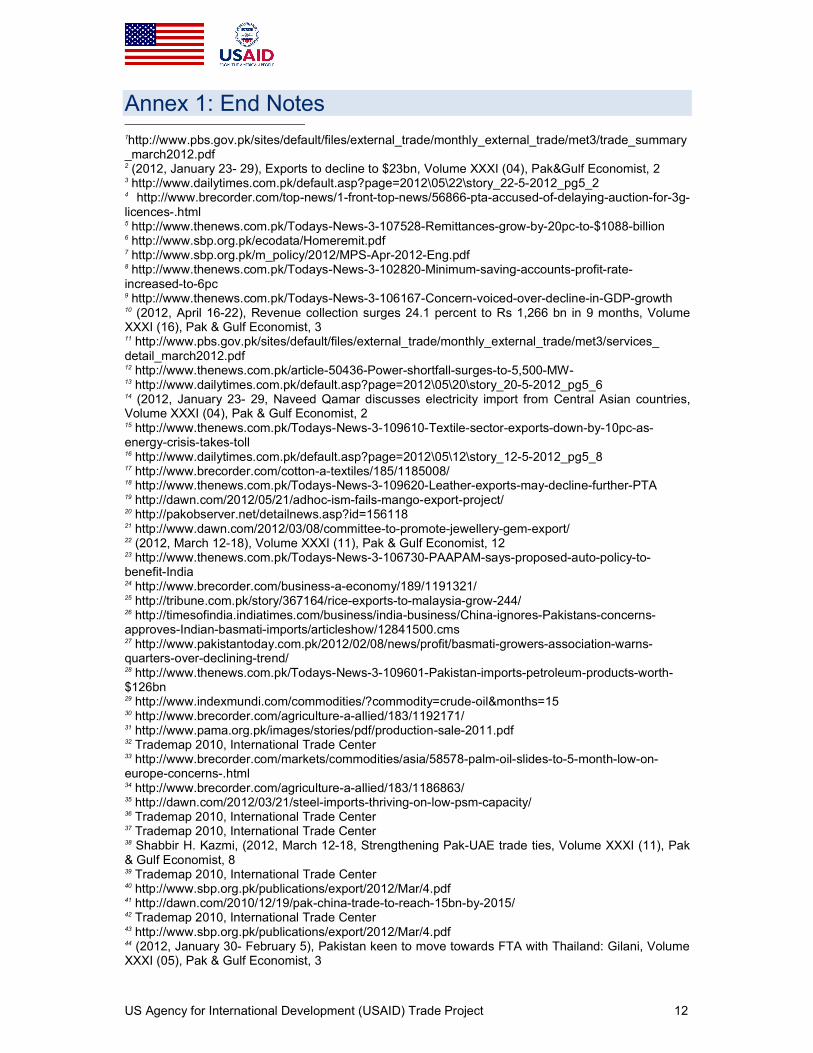
Annex 1: End Notes 1http://www.pbs.gov.pk/sites/default/files/external_trade/monthly_external_trade/met3/trade_summary_march2012.pdf 2 (2012, January 23- 29), Exports to decline to $23bn, Volume XXXI (04), Pak&Gulf Economist, 2 3 http://www.dailytimes.com.pk/default.asp?page=2012\05\22\story_22-5-2012_pg5_2 4 http://www.brecorder.com/top-news/1-front-top-news/56866-pta-accused-of-delaying-auction-for-3g-licences-.html 5 http://www.thenews.com.pk/Todays-News-3-107528-Remittances-grow-by-20pc-to-$1088-billion 6 http://www.sbp.org.pk/ecodata/Homeremit.pdf 7 http://www.sbp.org.pk/m_policy/2012/MPS-Apr-2012-Eng.pdf 8 http://www.thenews.com.pk/Todays-News-3-102820-Minimum-saving-accounts-profit-rate-increased-to-6pc 9 http://www.thenews.com.pk/Todays-News-3-106167-Concern-voiced-over-decline-in-GDP-growth 10 (2012, April 16-22), Revenue collection surges 24.1 percent to Rs 1,266 bn in 9 months, Volume XXXI (16), Pak & Gulf Economist, 3 11 http://www.pbs.gov.pk/sites/default/files/external_trade/monthly_external_trade/met3/services_ detail_march2012.pdf 12 http://www.thenews.com.pk/article-50436-Power-shortfall-surges-to-5,500-MW- 13 http://www.dailytimes.com.pk/default.asp?page=2012\05\20\story_20-5-2012_pg5_6 14 (2012, January 23- 29, Naveed Qamar discusses electricity import from Central Asian countries, Volume XXXI (04), Pak & Gulf Economist, 2 15 http://www.thenews.com.pk/Todays-News-3-109610-Textile-sector-exports-down-by-10pc-as-energy-crisis-takes-toll 16 http://www.dailytimes.com.pk/default.asp?page=2012\05\12\story_12-5-2012_pg5_8 17 http://www.brecorder.com/cotton-a-textiles/185/1185008/ 18 http://www.thenews.com.pk/Todays-News-3-109620-Leather-exports-may-decline-further-PTA 19 http://dawn.com/2012/05/21/adhoc-ism-fails-mango-export-project/ 20 http://pakobserver.net/detailnews.asp?id=156118 21 http://www.dawn.com/2012/03/08/committee-to-promote-jewellery-gem-export/ 22 (2012, March 12-18), Volume XXXI (11), Pak & Gulf Economist, 12 23 http://www.thenews.com.pk/Todays-News-3-106730-PAAPAM-says-proposed-auto-policy-to-benefit-India 24 http://www.brecorder.com/business-a-economy/189/1191321/ 25 http://tribune.com.pk/story/367164/rice-exports-to-malaysia-grow-244/ 26 http://timesofindia.indiatimes.com/business/india-business/China-ignores-Pakistans-concerns-approves-Indian-basmati-imports/articleshow/12841500.cms 27 http://www.pakistantoday.com.pk/2012/02/08/news/profit/basmati-growers-association-warns-quarters-over-declining-trend/ 28 http://www.thenews.com.pk/Todays-News-3-109601-Pakistan-imports-petroleum-products-worth-$126bn 29 http://www.indexmundi.com/commodities/?commodity=crude-oil&months=15 30 http://www.brecorder.com/agriculture-a-allied/183/1192171/ 31 http://www.pama.org.pk/images/stories/pdf/production-sale-2011.pdf 32 Trademap 2010, International Trade Center 33 http://www.brecorder.com/markets/commodities/asia/58578-palm-oil-slides-to-5-month-low-on-europe-concerns-.html 34 http://www.brecorder.com/agriculture-a-allied/183/1186863/ 35 http://dawn.com/2012/03/21/steel-imports-thriving-on-low-psm-capacity/ 36 Trademap 2010, International Trade Center 37 Trademap 2010, International Trade Center 38 Shabbir H. Kazmi, (2012, March 12-18, Strengthening Pak-UAE trade ties, Volume XXXI (11), Pak & Gulf Economist, 8 39 Trademap 2010, International Trade Center 40 http://www.sbp.org.pk/publications/export/2012/Mar/4.pdf 41 http://dawn.com/2010/12/19/pak-china-trade-to-reach-15bn-by-2015/ 42 Trademap 2010, International Trade Center 43 http://www.sbp.org.pk/publications/export/2012/Mar/4.pdf 44 (2012, January 30- February 5), Pakistan keen to move towards FTA with Thailand: Gilani, Volume XXXI (05), Pak & Gulf Economist, 3

US Agency for International Development (USAID) Trade Project 13
Annex 2: General Trade Related Figures of Pakistan
TABLE A: TOP 10 RISING EXPORT DESTINATIONS (BY VALUE)
Top 10 Export Destinations
Jan-Mar (Thousand USD $)
Increase % Increase
FY2011 FY2012 U.A.E 427,328 517,389 90,061 21.08% Vietnam 34,038 101,611 67,573 198.52% Egypt 29,841 76,425 46,584 156.11% India 84,644 113,661 29,016 34.28% Philippines 24,505 42,262 17,757 72.46% Senegal 3,235 20,400 17,165 530.65% Indonesia 40,471 57,205 16,734 41.35% Macao 1,589 17,167 15,579 980.67% Saudi Arabia 98,534 112,306 13,772 13.98% Malaysia 52,646 66,006 13,359 25.38%
Source: SBP
U.A.E 16.38%
Saudi Arabia12.57%
Kuwait10.93%
China10.52%
Singapore7.38%
Malaysia3.98%
Japan3.56%
India3.54%
Germany3.33%
Switzerland2.67% Others
25.14%
Figure A; Share in Imports (Jan-Mar/ FY2012)

US Agency for International Development (USAID) Trade Project 14
TABLE B: TOP 10 DECLINING EXPORTS DESTINATIONS (BY VALUE)
Top 10 Export Destinations
Jan-Mar (Thousand US $) Decline % Decrease
FY2011 FY2012 Afghanistan 540,561 230,475 -310,087 -57.36% Bangladesh 341,708 178,150 -163,558 -47.86% USA 981,255 896,942 -84,313 -8.59% Hong Kong 175,369 120,920 -54,449 -31.05% Turkey 190,752 139,249 -51,503 -27.00% Germany 326,167 277,701 -48,466 -14.86% Italy 191,211 147,315 -43,896 -22.96% Switzerland 55,174 23,724 -31,450 -57.00% Belgium 140,433 109,590 -30,842 -21.96% Yemen Arab Republic 51,409 21,316 -30,093 -58.54%
Source: SBP
TABLE C: TOP 10 RISING IMPORT COUNTRIES (BY VALUE)
Top 10 Import countries
Jan-Mar (Thousand US $) Increase %
Increase FY2011 FY2012 Kuwait 785,282 1,082,544 297,261 37.85% U.A.E 1,399,415 1,621,928 222,513 15.90% Singapore 595,560 730,562 135,002 22.67% Germany 252,460 330,276 77,816 30.82% Morocco 52,632 101,719 49,088 93.27% Vietnam 15,925 63,763 47,838 300.40% Oman 10,417 56,887 46,470 446.09% Russian Federation 4,126 43,892 39,765 963.73% Indonesia 112,769 148,556 35,788 31.74% Ukraine 2,014 33,845 31,831 1580.50%
Source: SBP
Source: SBP
TABLE D : TOP 10 DECLINING IMPORT COUNTRIES (BY VALUE)
Top 10 Import countries
Jan-Mar (Thousand US $) Decrease %
Decrease FY2011 FY2012 India 554,146 350,882 -203,265 -36.68% USA 317,541 185,438 -132,103 -41.60% Japan 449,631 352,653 -96,978 -21.57% Malaysia 458,734 393,691 -65,043 -14.18% Saudi Arabia 1,305,815 1,245,287 -60,528 -4.64% Malta 45,599 464 -45,135 -98.98% Qatar 49,477 16,898 -32,580 -65.85% Finland 50,993 27,775 -23,219 -45.53% UK 167,746 146,067 -21,679 -12.92% Thailand 137,605 124,693 -12,912 -9.38%

US Agency for International Development (USAID) Trade Project 15
Annex 2: Acronyms ADB Asian Development Bank APTTA Afghan Pakistan Transit Trade Agreement APTMA All Pakistan Textile Mills Association APGJMA All Pakistan Gems and Jewelry Manufacturers Association ASF Agribusiness Support fund ASSOCHAM Associated Chambers of Commerce and Industry of India BGA Basmati Growers Association CKD Completely Knocked Down CPI Consumer Price Index CNG Compressed Natural Gas EU European Union FBR Federal Board of Revenue FDI Foreign Direct Investment FY Fiscal Year GoP Government of Pakistan IMF International Monetary Fund IPP Institute of Public Policy ISDB Islamic Development Bank IPR Intellectual Property Rights JMC Joint Ministerial Commission KPK Khyber Pukhtoonkhwa LSM Large Scale Manufacturing MoC Ministry of Commerce MPOB Malaysian Palm Oil Board MTBF Medium Term Budgetary Framework MW Megawatt NHA National Highway Authority NTICP The National Trade Corridor Improvement Program PAAPAM Pakistan Association of Automotive Parts and Accessories Manufacturers PEORA Pakistan Edible Oil Refiners Association PBS Pakistan Bureau of Statistics PGJDC Pakistan Gems and Jewelry Development Company PRI Pakistan Remittance Initiative PTA Pakistan Tanners Association PTA Pakistan Telecommunications Authority ROZ Reconstruction Opportunity Zones SBP State Bank of Pakistan SEZ Special Economic Zones SIDC Sports Industries Development Center TAPI Trans-Afghanistan Pipeline TCP Trading Corporation Of Pakistan TDAP Trade Development Authority Of Pakistan TRTA The Trade Related Technical Assistance UNESCAP United Nations Economic and Social Commission for Asia-Pacific UNIDO United Nations Industrial Development Organization USAID United States Agency for International Development WB World Bank WTO World Trade Organization YoY Year on Year

US Agency for International Development (USAID) Trade Project 16
USAID Trade Project Deloitte Consulting, LLP
http://www.pakistantrade.org