US MUNICIPALS - data. · PDF filePNC Financial Services Group Inc 17 0.880 2,384 107 14 1.252...
17
US MUNICIPALS LEAGUE TABLES First 3Q 2017
Transcript of US MUNICIPALS - data. · PDF filePNC Financial Services Group Inc 17 0.880 2,384 107 14 1.252...

US MUNICIPALS LEAGUE TABLES
First 3Q 2017

CONTENTS
1. Total Long Term Tables2. Long Term Negotiated Tables3. Long Term Competitive Tables4. Short Term Notes Tables5. Combined Long & Short Term Tables6. Long Term Fixed Rate Tables7. Long Term & Muni-Backed Corporates Tables
DATA SUBMISSIONS AND QUERIES
US Municipals
Contact Laura Albright
Sophia Sung
Phone +1 609 279 3011
+1 609 279 3017
Email [email protected]
Bloomberg’s municipal bond database includes nearly one million active securities, and another four million that are matured or expired, associated with over 45,000 municipal issuers who reside in the United States, Mariana Islands, U.S. Virgin Islands, Puerto Rico, and Guam.
LEAG<GO> for a full range of league tables
CDRA<GO> for Bloomberg’s Municipal calendar
Due to the dynamic nature of the Professional Service product, league table rankings may vary between this release and data found on the Bloomberg Professional Service.
FIRST 3Q 2017
US MUNICIPALS
© 2017 Bloomberg Finance L.P. All rights reserved.
8. Table Criteria
Bloomberg USMunicipalLeagueTables|1st3Q2017
BloombergLeagueTableReports Page1
USMunicipalLongTerm
USMunicipalLongTerm(LeftLead)
1st3Q2017 1st3Q2016
Firm RankMkt
Share(%)Volume(USD
Mln)DealCount
PrevRank
PrevMktShare(%)
MktShareChg(%)
BankofAmericaMerrillLynch 1 16.144 43,728 303 1 15.569 0.575
Citi 2 13.237 35,854 308 2 12.568 0.669
JPMorgan 3 7.539 20,419 177 3 10.472 -2.933
MorganStanley 4 7.532 20,401 196 4 7.307 0.225
GoldmanSachs 5 7.056 19,113 43 9 4.092 2.964
RBCCapitalMarkets 6 6.946 18,815 354 6 5.093 1.853
WellsFargo 7 5.147 13,941 154 5 5.749 -0.602
Stifel 8 4.463 12,088 541 8 4.208 0.255
PiperJaffray&Co 9 3.818 10,341 301 11 3.662 0.156
RaymondJames&Associates 10 3.720 10,076 419 10 3.842 -0.122
Barclays 11 3.114 8,435 58 7 4.349 -1.235
RobertWBaird&Co 12 2.536 6,870 552 12 2.841 -0.305
Jefferies 13 2.258 6,117 41 16 1.041 1.217
SiebertCisnerosShank&CoLLC
14 1.401 3,795 20 17 1.020 0.381
LoopCapitalMarketsLLC 15 1.314 3,558 7 18 0.991 0.323
DADavidson 16 1.165 3,156 248 15 1.044 0.121
PNCFinancialServicesGroupInc
17 0.880 2,384 107 14 1.252 -0.372
ZieglerCosInc/The 18 0.749 2,030 33 19 0.838 -0.089
Roosevelt&CrossInc 19 0.717 1,941 235 21 0.729 -0.012
GeorgeKBaum&Co 20 0.667 1,807 90 23 0.674 -0.007
TOTAL 100% 270,862 6,410 100%
Thistableconsistsofalllong-termissuance(fixedrate&adjustablerate)fortheUSMunicipalMarketinUSDollars.Remarketeddealsandprivateplacementsarenotincluded.
GeneralObligation20%
SchoolDistrict16%
HigherEducation8%
Hospital7%
Water&Sewer6%
Others42%
MarketShareChange
MunicipalIndustryDistribution
20%
16%
8%7%
6%
42%
Banko
fAmeri
caM
errill
Lync
hCiti
JPM
organ
Morgan
Stan
ley
RBCCap
italM
arkets
Goldman
Sac
hs
5
10
15
Mar
ketS
hare
(%)
0
20
2017 2016 2015

Bloomberg USMunicipalLeagueTables|1st3Q2017
BloombergLeagueTableReports Page2
USMunicipalLongTerm(EconomicCredit)
1st3Q2017 1st3Q2016
Firm RankMkt
Share(%)Volume(USD
Mln)DealCount
PrevRank
PrevMktShare(%)
MktShareChg(%)
BankofAmericaMerrillLynch 1 15.830 42,879 319 1 15.249 0.581
Citi 2 12.768 34,585 321 2 12.077 0.691
JPMorgan 3 8.594 23,278 191 3 10.108 -1.514
MorganStanley 4 7.667 20,767 206 4 7.230 0.437
RBCCapitalMarkets 5 6.629 17,956 357 6 5.334 1.295
GoldmanSachs 6 5.731 15,524 50 8 4.100 1.631
WellsFargo 7 5.106 13,830 158 5 6.272 -1.166
Stifel 8 4.893 13,254 544 7 4.360 0.533
PiperJaffray&Co 9 3.806 10,309 301 11 3.683 0.123
RaymondJames&Associates 10 3.780 10,237 426 9 4.022 -0.242
Barclays 11 3.132 8,484 61 10 3.995 -0.863
RobertWBaird&Co 12 2.536 6,870 552 12 2.851 -0.315
Jefferies 13 2.257 6,113 43 17 1.041 1.216
SiebertCisnerosShank&CoLLC
14 1.603 4,342 23 14 1.225 0.378
LoopCapitalMarketsLLC 15 1.313 3,558 7 18 0.941 0.372
DADavidson 16 1.165 3,156 248 16 1.044 0.121
PNCFinancialServicesGroupInc
17 0.880 2,384 107 15 1.152 -0.272
SamuelARamirez&CoInc 18 0.876 2,372 10 13 1.956 -1.080
ZieglerCosInc/The 19 0.749 2,030 33 19 0.896 -0.147
Roosevelt&CrossInc 20 0.717 1,941 235 21 0.696 0.021
TOTAL 100% 270,867 6,412 100%
RankedbyDealCount(EconomicCredit)
Firm RankMkt
Share(%)DealCount
RobertWBaird&Co 1 2.54 552
Stifel 2 4.89 544
RaymondJames&Associates 3 3.78 426
RBCCapitalMarkets 4 6.63 357
Citi 5 12.77 321
BankofAmericaMerrillLynch 6 15.83 319
PiperJaffray&Co 7 3.81 301
DADavidson 8 1.17 248
Roosevelt&CrossInc 9 0.72 235
MorganStanley 10 7.67 206
JPMorgan 11 8.59 191
WellsFargo 12 5.11 158
AmeritasInvestmentCorp 13 0.21 142
FTNFinancial 14 0.48 141
BOKFinancialCorp 15 0.40 139
UMBBankNA 16 0.18 138
JanneyMontgomeryScottLLC 17 0.66 126
HutchinsonShockeyErley&Co
18 0.63 116
NorthlandSecuritiesGroupLLC
19 0.17 109
PNCFinancialServicesGroupInc
20 0.88 107

Bloomberg USMunicipalLeagueTables|1st3Q2017
BloombergLeagueTableReports Page3
USMunicipalLongTermNegotiated
USMunicipalLongTermNegotiated(LeftLead)
1st3Q2017 1st3Q2016
Firm RankMkt
Share(%)Volume(USD
Mln)DealCount
PrevRank
PrevMktShare(%)
MktShareChg(%)
BankofAmericaMerrillLynch 1 13.707 28,005 143 1 13.994 -0.287
Citi 2 13.180 26,929 177 2 12.158 1.022
GoldmanSachs 3 8.995 18,378 40 6 5.336 3.659
RBCCapitalMarkets 4 8.623 17,619 318 5 6.414 2.209
MorganStanley 5 7.119 14,545 92 4 6.610 0.509
JPMorgan 6 6.911 14,120 90 3 10.073 -3.162
Stifel 7 5.736 11,720 489 7 5.272 0.464
PiperJaffray&Co 8 4.465 9,124 225 10 4.169 0.296
Barclays 9 4.088 8,354 57 9 5.077 -0.989
RaymondJames&Associates 10 3.950 8,070 258 11 3.684 0.266
WellsFargo 11 3.692 7,544 66 8 5.219 -1.527
Jefferies 12 2.505 5,117 26 19 1.077 1.428
SiebertCisnerosShank&CoLLC
13 1.857 3,795 20 14 1.342 0.515
LoopCapitalMarketsLLC 14 1.741 3,558 7 15 1.304 0.437
DADavidson 15 1.489 3,043 224 13 1.349 0.140
RobertWBaird&Co 16 0.995 2,033 174 17 1.162 -0.167
ZieglerCosInc/The 17 0.993 2,030 33 18 1.102 -0.109
GeorgeKBaum&Co 18 0.879 1,795 87 20 0.872 0.007
SamuelARamirez&CoInc 19 0.748 1,528 8 12 2.405 -1.657
PNCFinancialServicesGroupInc
20 0.654 1,337 72 16 1.163 -0.509
TOTAL 100% 204,318 3,885 100%
Thistableconsistsofalllong-termissuance(fixed&adjustablerate)fortheUSMunicipalMarketinUSDollarsthatwerebroughttomarketbynegotiatedunderwriting.Remarketeddealsandprivateplacementsarenotincluded.
SchoolDistrict14%
GeneralObligation13%
HigherEducation10%
Hospital9%
Water&Sewer7%
Others47%
MarketShareChange
MunicipalIndustryDistribution
14%
13%
10%
9%7%
47%
Banko
fAmeri
caM
errill
Lync
hCiti
JPM
organ
RBCCap
italM
arkets
Morgan
Stan
ley
Goldman
Sac
hs
5
10
Mar
ketS
hare
(%)
0
15
2017 2016 2015

Bloomberg USMunicipalLeagueTables|1st3Q2017
BloombergLeagueTableReports Page4
USMunicipalLongTermNegotiated(EconomicCredit)
1st3Q2017 1st3Q2016
Firm RankMkt
Share(%)Volume(USD
Mln)DealCount
PrevRank
PrevMktShare(%)
MktShareChg(%)
BankofAmericaMerrillLynch 1 13.291 27,157 159 1 13.574 -0.283
Citi 2 12.559 25,661 190 2 11.511 1.048
JPMorgan 3 8.310 16,979 104 3 9.593 -1.283
RBCCapitalMarkets 4 8.203 16,760 321 4 6.731 1.472
MorganStanley 5 7.298 14,910 102 5 6.508 0.790
GoldmanSachs 6 7.238 14,790 47 8 5.347 1.891
Stifel 7 6.307 12,886 492 7 5.473 0.834
PiperJaffray&Co 8 4.450 9,092 225 10 4.197 0.253
Barclays 9 4.112 8,402 60 9 4.610 -0.498
RaymondJames&Associates 10 4.029 8,231 265 11 3.921 0.108
WellsFargo 11 3.638 7,433 70 6 5.908 -2.270
Jefferies 12 2.503 5,113 28 18 1.077 1.426
SiebertCisnerosShank&CoLLC
13 2.125 4,342 23 13 1.612 0.513
LoopCapitalMarketsLLC 14 1.741 3,558 7 15 1.238 0.503
DADavidson 15 1.489 3,043 224 14 1.349 0.140
SamuelARamirez&CoInc 16 1.161 2,372 9 12 2.574 -1.413
RobertWBaird&Co 17 0.995 2,033 174 17 1.175 -0.180
ZieglerCosInc/The 18 0.993 2,030 33 16 1.179 -0.186
GeorgeKBaum&Co 19 0.879 1,795 87 20 0.872 0.007
PNCFinancialServicesGroupInc
20 0.654 1,337 72 19 1.031 -0.377
TOTAL 100% 204,318 3,885 100%
RankedbyDealCount(EconomicCredit)
Firm RankMkt
Share(%)DealCount
Stifel 1 6.31 492
RBCCapitalMarkets 2 8.20 321
RaymondJames&Associates 3 4.03 265
PiperJaffray&Co 4 4.45 225
DADavidson 5 1.49 224
Citi 6 12.56 190
RobertWBaird&Co 7 0.99 174
BankofAmericaMerrillLynch 8 13.29 159
AmeritasInvestmentCorp 9 0.28 141
JPMorgan 10 8.31 104
MorganStanley 11 7.30 102
GeorgeKBaum&Co 12 0.88 87
PNCFinancialServicesGroupInc
13 0.65 72
WellsFargo 14 3.64 70
Roosevelt&CrossInc 15 0.40 65
LJHart&Co 16 0.09 62
Barclays 17 4.11 60
HutchinsonShockeyErley&Co
18 0.33 55
FifthThirdBancorp 19 0.38 47
GoldmanSachs 19 7.24 47

Bloomberg USMunicipalLeagueTables|1st3Q2017
BloombergLeagueTableReports Page5
USMunicipalLongTermCompetitive
USMunicipalLongTermCompetitive(LeftLead)
1st3Q2017 1st3Q2016
Firm RankMkt
Share(%)Volume(USD
Mln)DealCount
PrevRank
PrevMktShare(%)
MktShareChg(%)
BankofAmericaMerrillLynch 1 23.627 15,722 160 1 20.555 3.072
Citi 2 13.411 8,925 131 2 13.869 -0.458
WellsFargo 3 9.613 6,397 88 6 7.425 2.188
JPMorgan 4 9.466 6,299 87 3 11.737 -2.271
MorganStanley 5 8.801 5,857 104 4 9.516 -0.715
RobertWBaird&Co 6 7.269 4,837 378 5 8.160 -0.891
RaymondJames&Associates 7 3.015 2,006 161 7 4.344 -1.329
JanneyMontgomeryScottLLC 8 1.874 1,247 94 12 1.636 0.238
PiperJaffray&Co 9 1.829 1,217 76 9 2.056 -0.227
RBCCapitalMarkets 10 1.797 1,196 37 18 0.910 0.887
Roosevelt&CrossInc 11 1.683 1,120 170 14 1.484 0.199
FTNFinancial 12 1.608 1,070 126 11 1.733 -0.125
PNCFinancialServicesGroupInc
13 1.573 1,047 35 13 1.533 0.040
HutchinsonShockeyErley&Co 14 1.547 1,029 61 8 2.296 -0.749
MesirowFinancialInc 15 1.522 1,013 22 16 0.964 0.558
Jefferies 16 1.503 1,000 15 17 0.925 0.578
FidelityCapitalMarkets 17 1.176 783 52 15 1.279 -0.103
GoldmanSachs 18 1.104 735 3 33 0.152 0.952
UBS 19 1.057 703 54 19 0.860 0.197
JJBHilliardWLLyonsLLC 20 0.740 493 70 22 0.632 0.108
TOTAL 100% 66,543 2,531 100%
Thistableconsistsofalllong-termissuance(fixed&adjustablerate)fortheUSMunicipalMarketinUSDollarsthatwerebroughttomarketbycompetitiveunderwriting.Remarketeddealsandprivateplacementsarenotincluded.
GeneralObligation43%
SchoolDistrict22%
IncomeTax6%
Sales&ExciseTax5%
Others24%
MarketShareChange
MunicipalIndustryDistribution
43%
22%
6%
5%
24%
Banko
fAmeri
caM
errill
Lync
hCiti
Well
sFarg
o
JPM
organ
Morgan
Stan
ley
Robert
WB
aird&
Co
5
10
15
20
Mar
ketS
hare
(%)
0
25
2017 2016 2015

Bloomberg USMunicipalLeagueTables|1st3Q2017
BloombergLeagueTableReports Page6
USMunicipalLongTermCompetitive(EconomicCredit)
1st3Q2017 1st3Q2016
Firm RankMkt
Share(%)Volume(USD
Mln)DealCount
PrevRank
PrevMktShare(%)
MktShareChg(%)
BankofAmericaMerrillLynch 1 23.625 15,722 160 1 20.554 3.071
Citi 2 13.410 8,925 131 2 13.868 -0.458
WellsFargo 3 9.612 6,397 88 6 7.425 2.187
JPMorgan 4 9.466 6,299 87 3 11.736 -2.270
MorganStanley 5 8.800 5,857 104 4 9.515 -0.715
RobertWBaird&Co 6 7.269 4,837 378 5 8.160 -0.891
RaymondJames&Associates 7 3.015 2,006 161 7 4.343 -1.328
JanneyMontgomeryScottLLC 8 1.874 1,247 94 12 1.636 0.238
PiperJaffray&Co 9 1.829 1,217 76 9 2.056 -0.227
RBCCapitalMarkets 10 1.797 1,196 37 18 0.910 0.887
Roosevelt&CrossInc 11 1.683 1,120 170 14 1.484 0.199
FTNFinancial 12 1.608 1,070 126 11 1.733 -0.125
PNCFinancialServicesGroupInc
13 1.573 1,047 35 13 1.533 0.040
HutchinsonShockeyErley&Co 14 1.547 1,029 61 8 2.296 -0.749
MesirowFinancialInc 15 1.522 1,013 22 16 0.964 0.558
Jefferies 16 1.502 1,000 15 17 0.925 0.577
FidelityCapitalMarkets 17 1.176 783 52 15 1.279 -0.103
GoldmanSachs 18 1.104 735 3 33 0.152 0.952
UBS 19 1.057 703 54 19 0.860 0.197
JJBHilliardWLLyonsLLC 20 0.740 493 70 22 0.632 0.108
TOTAL 100% 66,549 2,533 100%
RankedbyDealCount(EconomicCredit)
Firm RankMkt
Share(%)DealCount
RobertWBaird&Co 1 7.27 378
Roosevelt&CrossInc 2 1.68 170
RaymondJames&Associates 3 3.01 161
BankofAmericaMerrillLynch 4 23.63 160
Citi 5 13.41 131
FTNFinancial 6 1.61 126
UMBBankNA 7 0.48 123
BOKFinancialCorp 8 0.57 110
MorganStanley 9 8.80 104
JanneyMontgomeryScottLLC 10 1.87 94
WellsFargo 11 9.61 88
JPMorgan 12 9.47 87
PiperJaffray&Co 13 1.83 76
NorthlandSecuritiesGroupLLC
14 0.51 74
JJBHilliardWLLyonsLLC 15 0.74 70
SamcoCapitalMarkets 16 0.60 67
HutchinsonShockeyErley&Co
17 1.55 61
UBS 18 1.06 54
FidelityCapitalMarkets 19 1.18 52
Stifel 19 0.55 52

Bloomberg USMunicipalLeagueTables|1st3Q2017
BloombergLeagueTableReports Page7
USMunicipalLongTermFixedRate
USMunicipalLongTermFixedRate(LeftLead)
1st3Q2017 1st3Q2016
Firm RankMkt
Share(%)Volume(USD
Mln)DealCount
PrevRank
PrevMktShare(%)
MktShareChg(%)
BankofAmericaMerrillLynch 1 15.907 41,556 294 1 15.478 0.429
Citi 2 13.336 34,840 295 2 12.654 0.682
MorganStanley 3 7.549 19,720 190 4 7.223 0.326
JPMorgan 4 7.369 19,250 170 3 10.449 -3.080
GoldmanSachs 5 7.130 18,626 42 8 4.216 2.914
RBCCapitalMarkets 6 6.625 17,308 345 6 4.931 1.694
WellsFargo 7 5.272 13,772 151 5 5.686 -0.414
Stifel 8 4.508 11,777 527 7 4.268 0.240
PiperJaffray&Co 9 3.910 10,214 299 11 3.746 0.164
RaymondJames&Associates 10 3.840 10,032 416 10 3.975 -0.135
Barclays 11 2.872 7,502 50 9 4.069 -1.197
RobertWBaird&Co 12 2.630 6,870 552 12 2.950 -0.320
Jefferies 13 2.210 5,772 39 17 1.006 1.204
SiebertCisnerosShank&CoLLC
14 1.453 3,795 20 16 1.059 0.394
LoopCapitalMarketsLLC 15 1.362 3,558 7 18 0.974 0.388
DADavidson 16 1.198 3,131 247 15 1.081 0.117
PNCFinancialServicesGroupInc
17 0.913 2,384 107 14 1.238 -0.325
ZieglerCosInc/The 18 0.777 2,030 33 19 0.846 -0.069
Roosevelt&CrossInc 19 0.743 1,941 235 21 0.757 -0.014
GeorgeKBaum&Co 20 0.684 1,788 89 23 0.693 -0.009
TOTAL 100% 261,244 6,299 100%
Thistableconsistsofalllong-termfixed-rateissuancefortheUSMunicipalMarketinUSDollarsthatwerebroughttomarket.Remarketeddealsandprivateplacementsarenotincluded.
GeneralObligation21%
SchoolDistrict17%
HigherEducation8%
Hospital7%
Water&Sewer6%
Others41%
MarketShareChange
MunicipalIndustryDistribution
21%
17%
8%7%
6%
41%
Banko
fAmeri
caM
errill
Lync
hCiti
JPM
organ
Morgan
Stan
ley
RBCCap
italM
arkets
Goldman
Sac
hs
5
10
15
Mar
ketS
hare
(%)
0
20
2017 2016 2015
Bloomberg USMunicipalLeagueTables|1st3Q2017
BloombergLeagueTableReports Page8
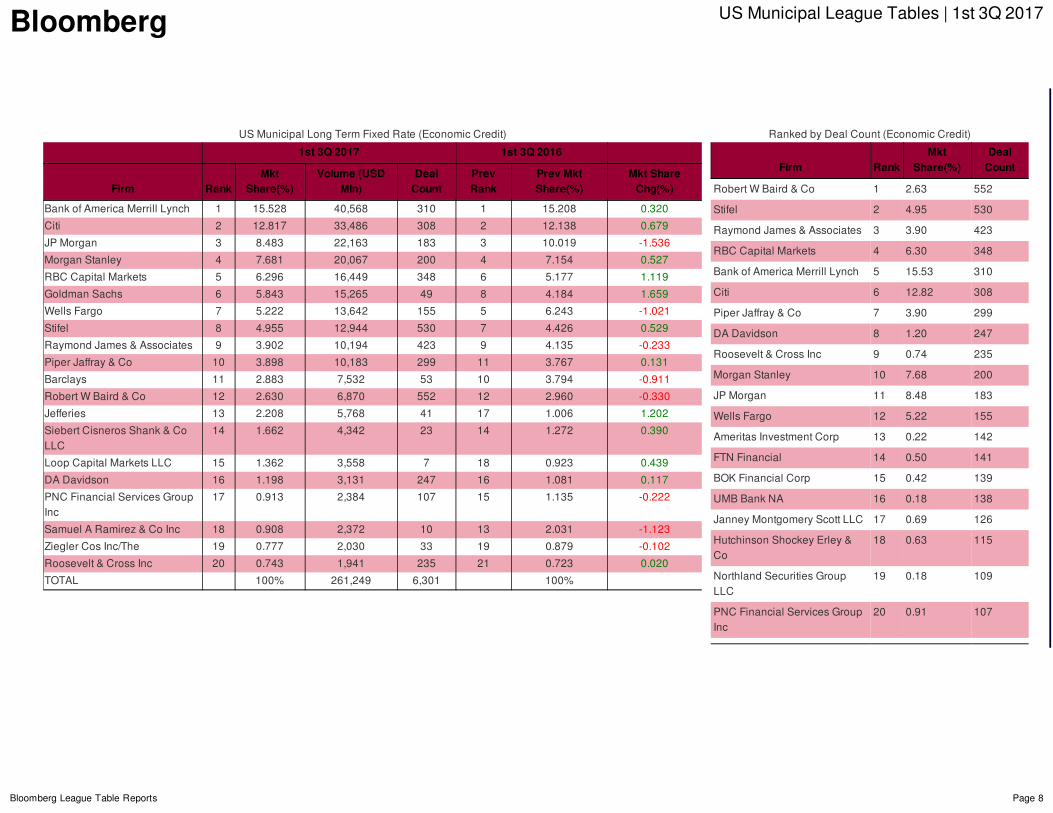
USMunicipalLongTermFixedRate(EconomicCredit)
1st3Q2017 1st3Q2016
Firm RankMkt
Share(%)Volume(USD
Mln)DealCount
PrevRank
PrevMktShare(%)
MktShareChg(%)
BankofAmericaMerrillLynch 1 15.528 40,568 310 1 15.208 0.320
Citi 2 12.817 33,486 308 2 12.138 0.679
JPMorgan 3 8.483 22,163 183 3 10.019 -1.536
MorganStanley 4 7.681 20,067 200 4 7.154 0.527
RBCCapitalMarkets 5 6.296 16,449 348 6 5.177 1.119
GoldmanSachs 6 5.843 15,265 49 8 4.184 1.659
WellsFargo 7 5.222 13,642 155 5 6.243 -1.021
Stifel 8 4.955 12,944 530 7 4.426 0.529
RaymondJames&Associates 9 3.902 10,194 423 9 4.135 -0.233
PiperJaffray&Co 10 3.898 10,183 299 11 3.767 0.131
Barclays 11 2.883 7,532 53 10 3.794 -0.911
RobertWBaird&Co 12 2.630 6,870 552 12 2.960 -0.330
Jefferies 13 2.208 5,768 41 17 1.006 1.202
SiebertCisnerosShank&CoLLC
14 1.662 4,342 23 14 1.272 0.390
LoopCapitalMarketsLLC 15 1.362 3,558 7 18 0.923 0.439
DADavidson 16 1.198 3,131 247 16 1.081 0.117
PNCFinancialServicesGroupInc
17 0.913 2,384 107 15 1.135 -0.222
SamuelARamirez&CoInc 18 0.908 2,372 10 13 2.031 -1.123
ZieglerCosInc/The 19 0.777 2,030 33 19 0.879 -0.102
Roosevelt&CrossInc 20 0.743 1,941 235 21 0.723 0.020
TOTAL 100% 261,249 6,301 100%
RankedbyDealCount(EconomicCredit)
Firm RankMkt
Share(%)DealCount
RobertWBaird&Co 1 2.63 552
Stifel 2 4.95 530
RaymondJames&Associates 3 3.90 423
RBCCapitalMarkets 4 6.30 348
BankofAmericaMerrillLynch 5 15.53 310
Citi 6 12.82 308
PiperJaffray&Co 7 3.90 299
DADavidson 8 1.20 247
Roosevelt&CrossInc 9 0.74 235
MorganStanley 10 7.68 200
JPMorgan 11 8.48 183
WellsFargo 12 5.22 155
AmeritasInvestmentCorp 13 0.22 142
FTNFinancial 14 0.50 141
BOKFinancialCorp 15 0.42 139
UMBBankNA 16 0.18 138
JanneyMontgomeryScottLLC 17 0.69 126
HutchinsonShockeyErley&Co
18 0.63 115
NorthlandSecuritiesGroupLLC
19 0.18 109
PNCFinancialServicesGroupInc
20 0.91 107
Bloomberg USMunicipalLeagueTables|1st3Q2017
BloombergLeagueTableReports Page9
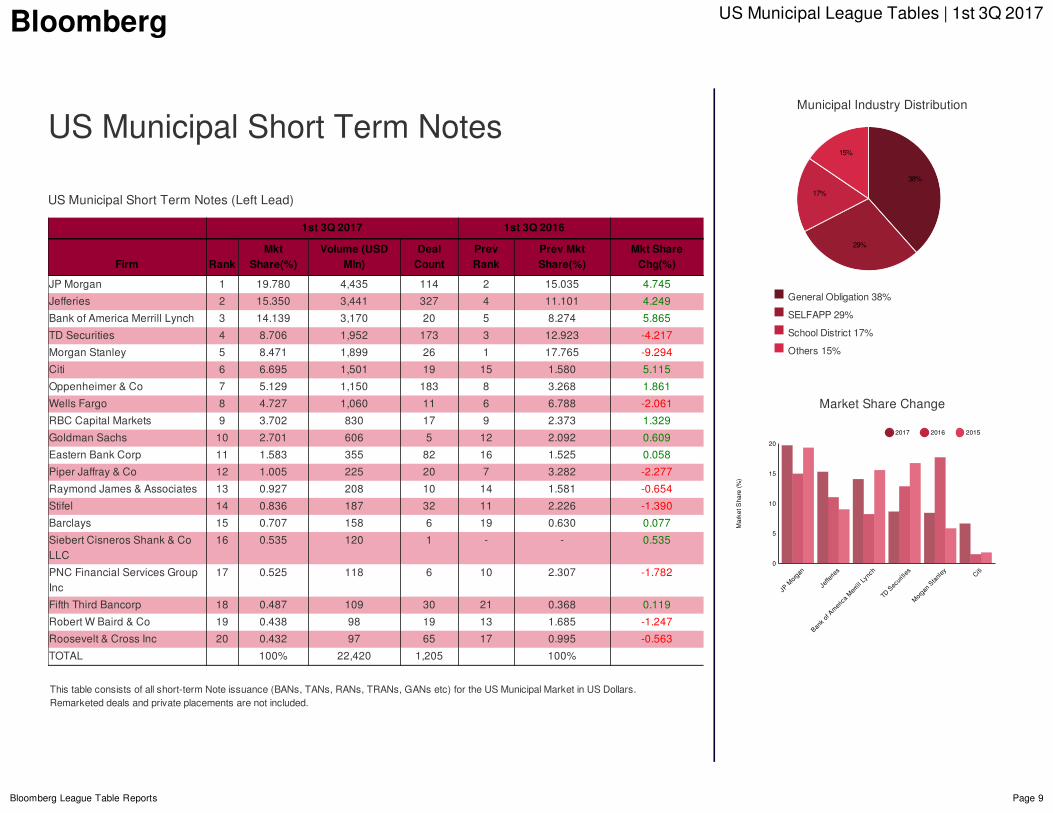
USMunicipalShortTermNotes
USMunicipalShortTermNotes(LeftLead)
1st3Q2017 1st3Q2016
Firm RankMkt
Share(%)Volume(USD
Mln)DealCount
PrevRank
PrevMktShare(%)
MktShareChg(%)
JPMorgan 1 19.780 4,435 114 2 15.035 4.745
Jefferies 2 15.350 3,441 327 4 11.101 4.249
BankofAmericaMerrillLynch 3 14.139 3,170 20 5 8.274 5.865
TDSecurities 4 8.706 1,952 173 3 12.923 -4.217
MorganStanley 5 8.471 1,899 26 1 17.765 -9.294
Citi 6 6.695 1,501 19 15 1.580 5.115
Oppenheimer&Co 7 5.129 1,150 183 8 3.268 1.861
WellsFargo 8 4.727 1,060 11 6 6.788 -2.061
RBCCapitalMarkets 9 3.702 830 17 9 2.373 1.329
GoldmanSachs 10 2.701 606 5 12 2.092 0.609
EasternBankCorp 11 1.583 355 82 16 1.525 0.058
PiperJaffray&Co 12 1.005 225 20 7 3.282 -2.277
RaymondJames&Associates 13 0.927 208 10 14 1.581 -0.654
Stifel 14 0.836 187 32 11 2.226 -1.390
Barclays 15 0.707 158 6 19 0.630 0.077
SiebertCisnerosShank&CoLLC
16 0.535 120 1 - - 0.535
PNCFinancialServicesGroupInc
17 0.525 118 6 10 2.307 -1.782
FifthThirdBancorp 18 0.487 109 30 21 0.368 0.119
RobertWBaird&Co 19 0.438 98 19 13 1.685 -1.247
Roosevelt&CrossInc 20 0.432 97 65 17 0.995 -0.563
TOTAL 100% 22,420 1,205 100%
Thistableconsistsofallshort-termNoteissuance(BANs,TANs,RANs,TRANs,GANsetc)fortheUSMunicipalMarketinUSDollars.Remarketeddealsandprivateplacementsarenotincluded.
GeneralObligation38%
SELFAPP29%
SchoolDistrict17%
Others15%
MarketShareChange
MunicipalIndustryDistribution
38%
29%
17%
15%
JPM
organ
Jeffe
ries
Banko
fAmeri
caM
errill
Lync
h
TDS
ecuri
ties
Morgan
Stan
ley Citi
5
10
15
Mar
ketS
hare
(%)
0
20
2017 2016 2015
Bloomberg USMunicipalLeagueTables|1st3Q2017
BloombergLeagueTableReports Page10
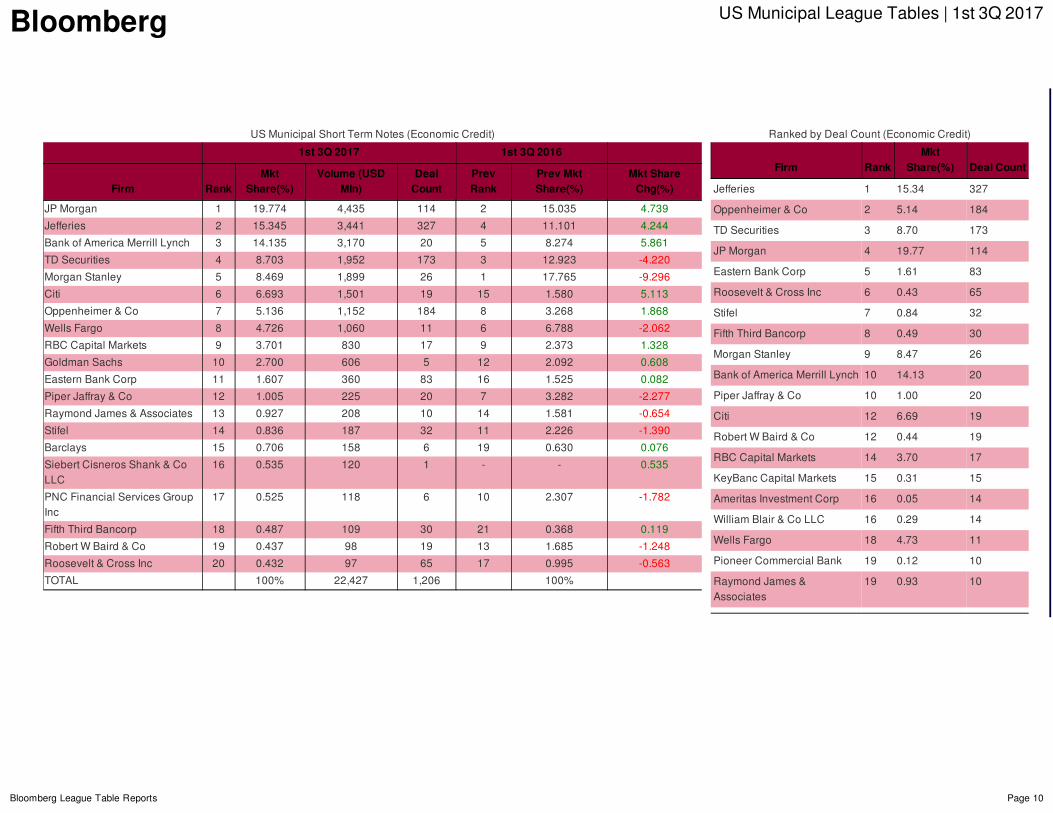
USMunicipalShortTermNotes(EconomicCredit)
1st3Q2017 1st3Q2016
Firm RankMkt
Share(%)Volume(USD
Mln)DealCount
PrevRank
PrevMktShare(%)
MktShareChg(%)
JPMorgan 1 19.774 4,435 114 2 15.035 4.739
Jefferies 2 15.345 3,441 327 4 11.101 4.244
BankofAmericaMerrillLynch 3 14.135 3,170 20 5 8.274 5.861
TDSecurities 4 8.703 1,952 173 3 12.923 -4.220
MorganStanley 5 8.469 1,899 26 1 17.765 -9.296
Citi 6 6.693 1,501 19 15 1.580 5.113
Oppenheimer&Co 7 5.136 1,152 184 8 3.268 1.868
WellsFargo 8 4.726 1,060 11 6 6.788 -2.062
RBCCapitalMarkets 9 3.701 830 17 9 2.373 1.328
GoldmanSachs 10 2.700 606 5 12 2.092 0.608
EasternBankCorp 11 1.607 360 83 16 1.525 0.082
PiperJaffray&Co 12 1.005 225 20 7 3.282 -2.277
RaymondJames&Associates 13 0.927 208 10 14 1.581 -0.654
Stifel 14 0.836 187 32 11 2.226 -1.390
Barclays 15 0.706 158 6 19 0.630 0.076
SiebertCisnerosShank&CoLLC
16 0.535 120 1 - - 0.535
PNCFinancialServicesGroupInc
17 0.525 118 6 10 2.307 -1.782
FifthThirdBancorp 18 0.487 109 30 21 0.368 0.119
RobertWBaird&Co 19 0.437 98 19 13 1.685 -1.248
Roosevelt&CrossInc 20 0.432 97 65 17 0.995 -0.563
TOTAL 100% 22,427 1,206 100%
RankedbyDealCount(EconomicCredit)
Firm RankMkt
Share(%) DealCount
Jefferies 1 15.34 327
Oppenheimer&Co 2 5.14 184
TDSecurities 3 8.70 173
JPMorgan 4 19.77 114
EasternBankCorp 5 1.61 83
Roosevelt&CrossInc 6 0.43 65
Stifel 7 0.84 32
FifthThirdBancorp 8 0.49 30
MorganStanley 9 8.47 26
BankofAmericaMerrillLynch 10 14.13 20
PiperJaffray&Co 10 1.00 20
Citi 12 6.69 19
RobertWBaird&Co 12 0.44 19
RBCCapitalMarkets 14 3.70 17
KeyBancCapitalMarkets 15 0.31 15
AmeritasInvestmentCorp 16 0.05 14
WilliamBlair&CoLLC 16 0.29 14
WellsFargo 18 4.73 11
PioneerCommercialBank 19 0.12 10
RaymondJames&Associates
19 0.93 10
Bloomberg USMunicipalLeagueTables|1st3Q2017
BloombergLeagueTableReports Page11
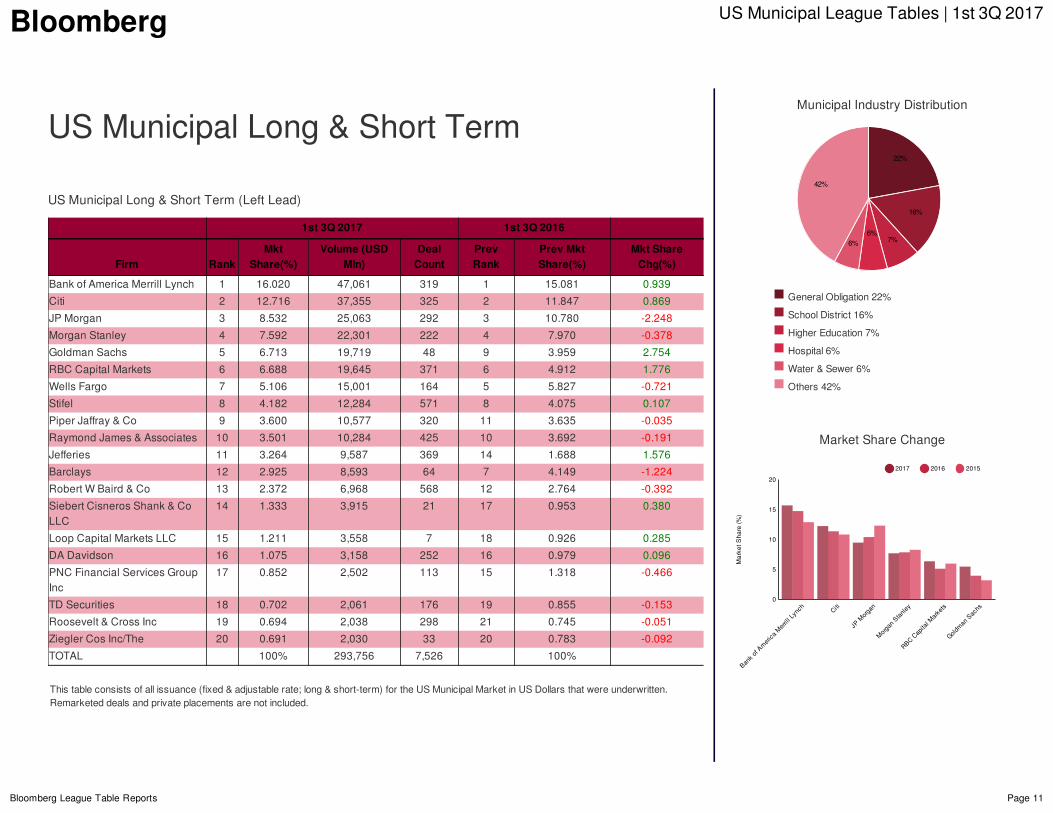
USMunicipalLong&ShortTerm
USMunicipalLong&ShortTerm(LeftLead)
1st3Q2017 1st3Q2016
Firm RankMkt
Share(%)Volume(USD
Mln)DealCount
PrevRank
PrevMktShare(%)
MktShareChg(%)
BankofAmericaMerrillLynch 1 16.020 47,061 319 1 15.081 0.939
Citi 2 12.716 37,355 325 2 11.847 0.869
JPMorgan 3 8.532 25,063 292 3 10.780 -2.248
MorganStanley 4 7.592 22,301 222 4 7.970 -0.378
GoldmanSachs 5 6.713 19,719 48 9 3.959 2.754
RBCCapitalMarkets 6 6.688 19,645 371 6 4.912 1.776
WellsFargo 7 5.106 15,001 164 5 5.827 -0.721
Stifel 8 4.182 12,284 571 8 4.075 0.107
PiperJaffray&Co 9 3.600 10,577 320 11 3.635 -0.035
RaymondJames&Associates 10 3.501 10,284 425 10 3.692 -0.191
Jefferies 11 3.264 9,587 369 14 1.688 1.576
Barclays 12 2.925 8,593 64 7 4.149 -1.224
RobertWBaird&Co 13 2.372 6,968 568 12 2.764 -0.392
SiebertCisnerosShank&CoLLC
14 1.333 3,915 21 17 0.953 0.380
LoopCapitalMarketsLLC 15 1.211 3,558 7 18 0.926 0.285
DADavidson 16 1.075 3,158 252 16 0.979 0.096
PNCFinancialServicesGroupInc
17 0.852 2,502 113 15 1.318 -0.466
TDSecurities 18 0.702 2,061 176 19 0.855 -0.153
Roosevelt&CrossInc 19 0.694 2,038 298 21 0.745 -0.051
ZieglerCosInc/The 20 0.691 2,030 33 20 0.783 -0.092
TOTAL 100% 293,756 7,526 100%
Thistableconsistsofallissuance(fixed&adjustablerate;long&short-term)fortheUSMunicipalMarketinUSDollarsthatwereunderwritten.Remarketeddealsandprivateplacementsarenotincluded.
GeneralObligation22%
SchoolDistrict16%
HigherEducation7%
Hospital6%
Water&Sewer6%
Others42%
MarketShareChange
MunicipalIndustryDistribution
22%
16%
7%6%
6%
42%
Banko
fAmeri
caM
errill
Lync
hCiti
JPM
organ
Morgan
Stan
ley
RBCCap
italM
arkets
Goldman
Sac
hs
5
10
15
Mar
ketS
hare
(%)
0
20
2017 2016 2015
Bloomberg USMunicipalLeagueTables|1st3Q2017
BloombergLeagueTableReports Page12
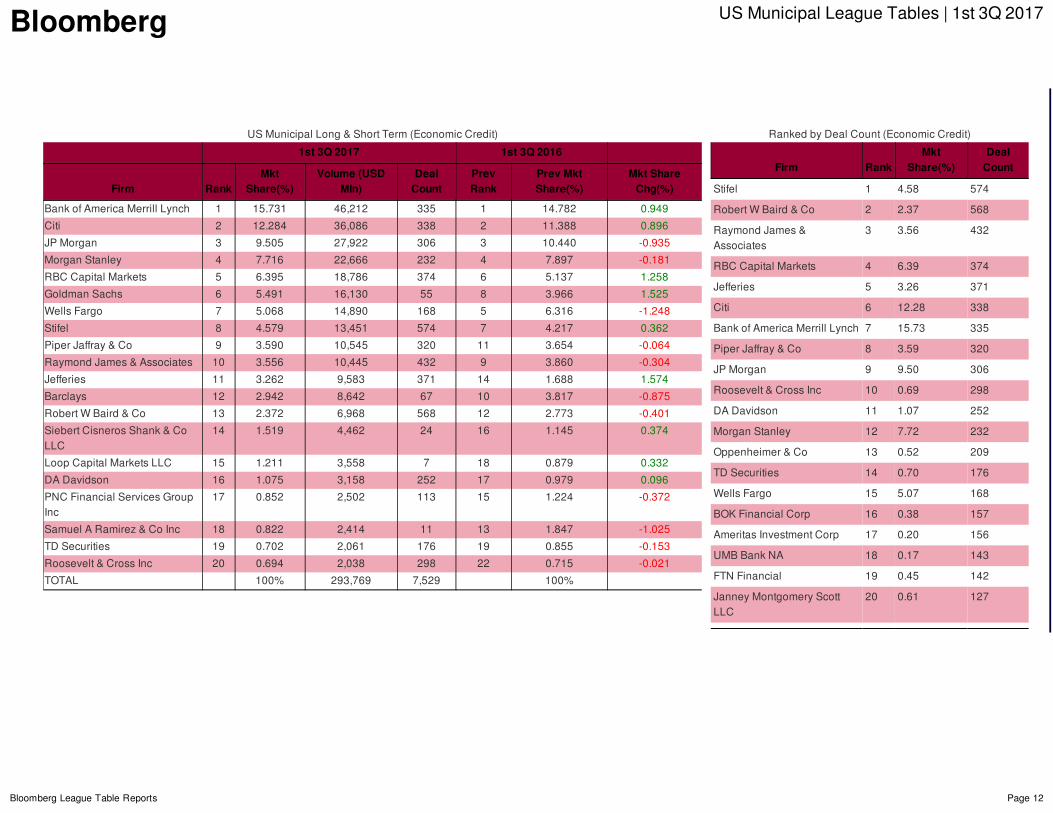
USMunicipalLong&ShortTerm(EconomicCredit)
1st3Q2017 1st3Q2016
Firm RankMkt
Share(%)Volume(USD
Mln)DealCount
PrevRank
PrevMktShare(%)
MktShareChg(%)
BankofAmericaMerrillLynch 1 15.731 46,212 335 1 14.782 0.949
Citi 2 12.284 36,086 338 2 11.388 0.896
JPMorgan 3 9.505 27,922 306 3 10.440 -0.935
MorganStanley 4 7.716 22,666 232 4 7.897 -0.181
RBCCapitalMarkets 5 6.395 18,786 374 6 5.137 1.258
GoldmanSachs 6 5.491 16,130 55 8 3.966 1.525
WellsFargo 7 5.068 14,890 168 5 6.316 -1.248
Stifel 8 4.579 13,451 574 7 4.217 0.362
PiperJaffray&Co 9 3.590 10,545 320 11 3.654 -0.064
RaymondJames&Associates 10 3.556 10,445 432 9 3.860 -0.304
Jefferies 11 3.262 9,583 371 14 1.688 1.574
Barclays 12 2.942 8,642 67 10 3.817 -0.875
RobertWBaird&Co 13 2.372 6,968 568 12 2.773 -0.401
SiebertCisnerosShank&CoLLC
14 1.519 4,462 24 16 1.145 0.374
LoopCapitalMarketsLLC 15 1.211 3,558 7 18 0.879 0.332
DADavidson 16 1.075 3,158 252 17 0.979 0.096
PNCFinancialServicesGroupInc
17 0.852 2,502 113 15 1.224 -0.372
SamuelARamirez&CoInc 18 0.822 2,414 11 13 1.847 -1.025
TDSecurities 19 0.702 2,061 176 19 0.855 -0.153
Roosevelt&CrossInc 20 0.694 2,038 298 22 0.715 -0.021
TOTAL 100% 293,769 7,529 100%
RankedbyDealCount(EconomicCredit)
Firm RankMkt
Share(%)DealCount
Stifel 1 4.58 574
RobertWBaird&Co 2 2.37 568
RaymondJames&Associates
3 3.56 432
RBCCapitalMarkets 4 6.39 374
Jefferies 5 3.26 371
Citi 6 12.28 338
BankofAmericaMerrillLynch 7 15.73 335
PiperJaffray&Co 8 3.59 320
JPMorgan 9 9.50 306
Roosevelt&CrossInc 10 0.69 298
DADavidson 11 1.07 252
MorganStanley 12 7.72 232
Oppenheimer&Co 13 0.52 209
TDSecurities 14 0.70 176
WellsFargo 15 5.07 168
BOKFinancialCorp 16 0.38 157
AmeritasInvestmentCorp 17 0.20 156
UMBBankNA 18 0.17 143
FTNFinancial 19 0.45 142
JanneyMontgomeryScottLLC
20 0.61 127
Bloomberg USMunicipalLeagueTables|1st3Q2017
BloombergLeagueTableReports Page13
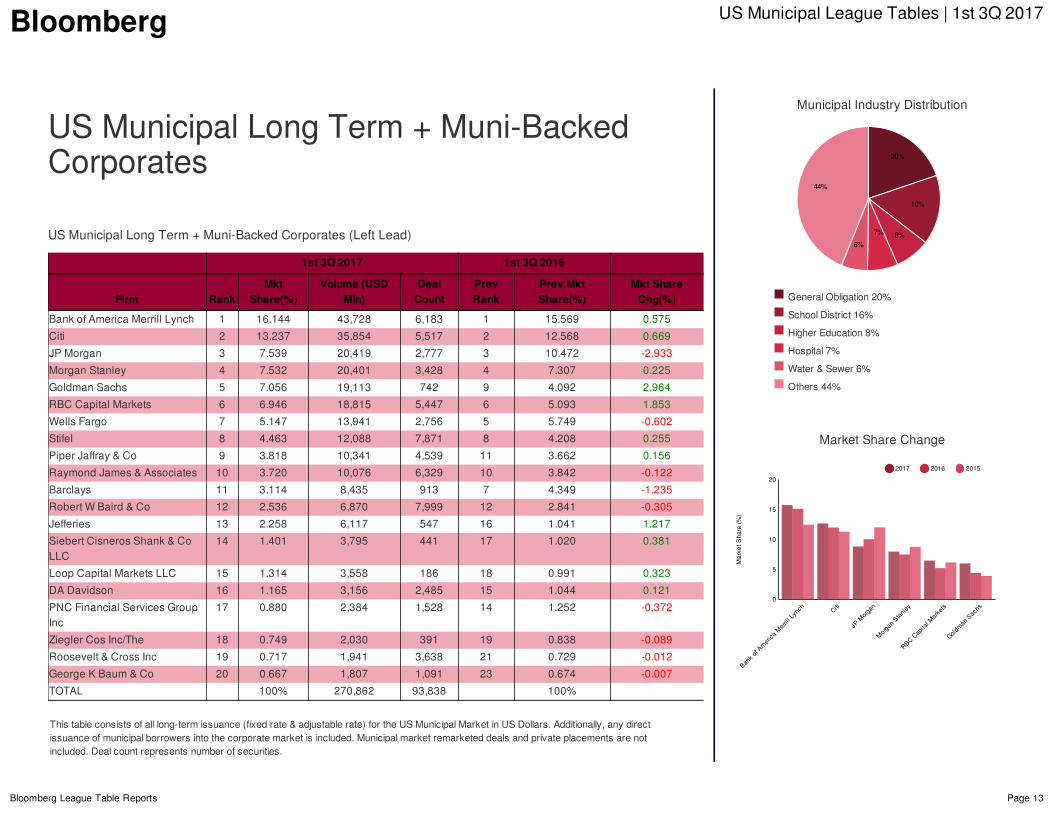
USMunicipalLongTerm+Muni-BackedCorporates
USMunicipalLongTerm+Muni-BackedCorporates(LeftLead)
1st3Q2017 1st3Q2016
Firm RankMkt
Share(%)Volume(USD
Mln)DealCount
PrevRank
PrevMktShare(%)
MktShareChg(%)
BankofAmericaMerrillLynch 1 16.144 43,728 6,183 1 15.569 0.575
Citi 2 13.237 35,854 5,517 2 12.568 0.669
JPMorgan 3 7.539 20,419 2,777 3 10.472 -2.933
MorganStanley 4 7.532 20,401 3,428 4 7.307 0.225
GoldmanSachs 5 7.056 19,113 742 9 4.092 2.964
RBCCapitalMarkets 6 6.946 18,815 5,447 6 5.093 1.853
WellsFargo 7 5.147 13,941 2,756 5 5.749 -0.602
Stifel 8 4.463 12,088 7,871 8 4.208 0.255
PiperJaffray&Co 9 3.818 10,341 4,539 11 3.662 0.156
RaymondJames&Associates 10 3.720 10,076 6,329 10 3.842 -0.122
Barclays 11 3.114 8,435 913 7 4.349 -1.235
RobertWBaird&Co 12 2.536 6,870 7,999 12 2.841 -0.305
Jefferies 13 2.258 6,117 547 16 1.041 1.217
SiebertCisnerosShank&CoLLC
14 1.401 3,795 441 17 1.020 0.381
LoopCapitalMarketsLLC 15 1.314 3,558 186 18 0.991 0.323
DADavidson 16 1.165 3,156 2,485 15 1.044 0.121
PNCFinancialServicesGroupInc
17 0.880 2,384 1,528 14 1.252 -0.372
ZieglerCosInc/The 18 0.749 2,030 391 19 0.838 -0.089
Roosevelt&CrossInc 19 0.717 1,941 3,638 21 0.729 -0.012
GeorgeKBaum&Co 20 0.667 1,807 1,091 23 0.674 -0.007
TOTAL 100% 270,862 93,838 100%
Thistableconsistsofalllong-termissuance(fixedrate&adjustablerate)fortheUSMunicipalMarketinUSDollars.Additionally,anydirectissuanceofmunicipalborrowersintothecorporatemarketisincluded.Municipalmarketremarketeddealsandprivateplacementsarenotincluded.Dealcountrepresentsnumberofsecurities.
GeneralObligation20%
SchoolDistrict16%
HigherEducation8%
Hospital7%
Water&Sewer6%
Others44%
MarketShareChange
MunicipalIndustryDistribution
20%
16%
8%7%
6%
44%
Banko
fAmeri
caM
errill
Lync
hCiti
JPM
organ
Morgan
Stan
ley
RBCCap
italM
arkets
Goldman
Sac
hs
5
10
15
Mar
ketS
hare
(%)
0
20
2017 2016 2015
Bloomberg USMunicipalLeagueTables|1st3Q2017
BloombergLeagueTableReports Page14
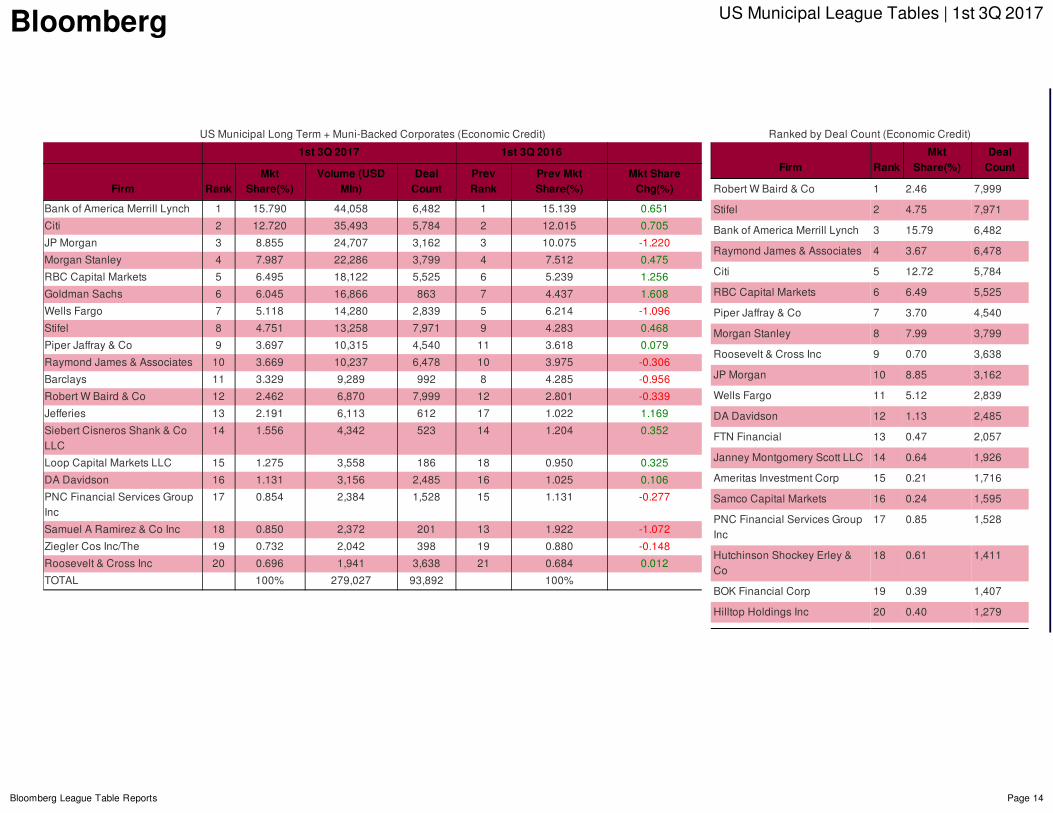
USMunicipalLongTerm+Muni-BackedCorporates(EconomicCredit)
1st3Q2017 1st3Q2016
Firm RankMkt
Share(%)Volume(USD
Mln)DealCount
PrevRank
PrevMktShare(%)
MktShareChg(%)
BankofAmericaMerrillLynch 1 15.790 44,058 6,482 1 15.139 0.651
Citi 2 12.720 35,493 5,784 2 12.015 0.705
JPMorgan 3 8.855 24,707 3,162 3 10.075 -1.220
MorganStanley 4 7.987 22,286 3,799 4 7.512 0.475
RBCCapitalMarkets 5 6.495 18,122 5,525 6 5.239 1.256
GoldmanSachs 6 6.045 16,866 863 7 4.437 1.608
WellsFargo 7 5.118 14,280 2,839 5 6.214 -1.096
Stifel 8 4.751 13,258 7,971 9 4.283 0.468
PiperJaffray&Co 9 3.697 10,315 4,540 11 3.618 0.079
RaymondJames&Associates 10 3.669 10,237 6,478 10 3.975 -0.306
Barclays 11 3.329 9,289 992 8 4.285 -0.956
RobertWBaird&Co 12 2.462 6,870 7,999 12 2.801 -0.339
Jefferies 13 2.191 6,113 612 17 1.022 1.169
SiebertCisnerosShank&CoLLC
14 1.556 4,342 523 14 1.204 0.352
LoopCapitalMarketsLLC 15 1.275 3,558 186 18 0.950 0.325
DADavidson 16 1.131 3,156 2,485 16 1.025 0.106
PNCFinancialServicesGroupInc
17 0.854 2,384 1,528 15 1.131 -0.277
SamuelARamirez&CoInc 18 0.850 2,372 201 13 1.922 -1.072
ZieglerCosInc/The 19 0.732 2,042 398 19 0.880 -0.148
Roosevelt&CrossInc 20 0.696 1,941 3,638 21 0.684 0.012
TOTAL 100% 279,027 93,892 100%
RankedbyDealCount(EconomicCredit)
Firm RankMkt
Share(%)DealCount
RobertWBaird&Co 1 2.46 7,999
Stifel 2 4.75 7,971
BankofAmericaMerrillLynch 3 15.79 6,482
RaymondJames&Associates 4 3.67 6,478
Citi 5 12.72 5,784
RBCCapitalMarkets 6 6.49 5,525
PiperJaffray&Co 7 3.70 4,540
MorganStanley 8 7.99 3,799
Roosevelt&CrossInc 9 0.70 3,638
JPMorgan 10 8.85 3,162
WellsFargo 11 5.12 2,839
DADavidson 12 1.13 2,485
FTNFinancial 13 0.47 2,057
JanneyMontgomeryScottLLC 14 0.64 1,926
AmeritasInvestmentCorp 15 0.21 1,716
SamcoCapitalMarkets 16 0.24 1,595
PNCFinancialServicesGroupInc
17 0.85 1,528
HutchinsonShockeyErley&Co
18 0.61 1,411
BOKFinancialCorp 19 0.39 1,407
HilltopHoldingsInc 20 0.40 1,279
Bloomberg US Municipals - League Table Criteria
Bloomberg L.P. reserves the right of final decision concerning league eligibility and requires adequate documentation for the same. Bloomberg L.P. and its suppliers believe the information herein was obtained from reliable sources, but they do not guarantee its accuracy. Neither the information nor the opinion expressed constitutes a solicitation of the purchase or sale of securities or commodities. Due to the dynamic nature of the Professional Service product, League Table rankings may vary between the quarterly/year-end publications and data found on the Bloomberg Professional Service.
General Guidelines
Standard published tables will assign deal credit based on true economic credit as reported by the issuer or the bookrunner. In absence of reported economic credit, 100% will be assigned to the bookrunner.
Dollar value of credit will be assigned based on the percentage allocation reported for economic credit (or designated by the user in a custom table) and applied against the total par value of the bonds issued. Zero coupon bonds (CABS) or intermediate appreciation bonds (convertible CABs) will be included at the market value (accreted value) on the interest accrual date.
All debt issued by municipal issuers will be eligible for league credit. Taxable and tax-exempt debt is eligible for league credit unless a table includes specific tax type criteria. “Tax-exempt” is defined as federally tax-exempt and includes bonds subject to AMT and bonds designated as Bank Qualified. Each table has three potential display formats. “Economic Credit” displays rankings based on true economic credit allocations of applicable deals. “Left Lead” assigns 100% credit to the bookrunner and 0% to all other syndicate participants. “Deal Count” displays rankings based on deal quantity rather than aggregate economic credit amounts. US Municipals tables included in the “Global Capital Markets” and “Americas Capital Markets” publications are ranked according to true economic credit. The US Municipals publication displays all three variations for all tables. A “deal” refers to the aggregate series within an issuance led by a particular underwriter or syndicate. For example: a $50 million issuance is split into three series- a $10 million Series A, a $20 million Series B, and a $20 million Series C. Bank 1 is the underwriter of Series A & B, while Bank 2 is the underwriter of Series C. Bank 1 would have one “deal” worth $30 million, and Bank 2 would have one “deal” worth $20 million.
Exclusions
Derivatives, private placements, variable rate preferred securities, municipal commercial paper, and remarketings are excluded from municipal league table eligibility.
The full version of Bloomberg’s League table Standards & Guidelines can be accessed and subscribed to on the Reports tab on LEAG<GO>.
![JS1000 Joystick Base Data Sheet - Danfoss...Weight (base without grip) 0.38 kg [0.838 lb] Environmental parameters Operating temperature-40 C to +80 C [-40 F to +175 F] Storage temperature-55](https://static.fdocuments.in/doc/165x107/5f0b06767e708231d42e7b57/js1000-joystick-base-data-sheet-danfoss-weight-base-without-grip-038-kg.jpg)