U.S. Hydropower Resource Assessment Final Report · PDF fileABSTRACT . To provide a more...
49
DOE/ID-10430.2 U.S. Hydropower Resource Assessment Final Report Alison M. Conner James E. Francfort Ben N. Rinehart Published December 1998 Idaho National Engineering and Environmental Laboratory Renewable Energy Products Department Lockheed Martin Idaho Technologies Company Idaho Falls, Idaho 83415 Prepared for the U.S. Department of Energy Assistant Secretary for Energy Efficiency and Renewable Energy Under DOE Idaho Operations Office Contract DE-AC07-94ID13223
Transcript of U.S. Hydropower Resource Assessment Final Report · PDF fileABSTRACT . To provide a more...

DOE/ID-10430.2
U.S. Hydropower Resource Assessment Final Report
Alison M. Conner James E. Francfort
Ben N. Rinehart
Published December 1998
Idaho National Engineering and Environmental Laboratory Renewable Energy Products Department
Lockheed Martin Idaho Technologies Company Idaho Falls, Idaho 83415
Prepared for the U.S. Department of Energy
Assistant Secretary for Energy Efficiency and Renewable Energy Under DOE Idaho Operations Office
Contract DE-AC07-94ID13223

ABSTRACT
To provide a more accurate assessment of the domestic undeveloped hydropower capacity, the U.S. Department of Energy’s Hydropower Program developed a computer model, Hydropower Evaluation Software (HES). HES allows the personal computer user to assign environmental attributes to potential hydropower sites, calculate development suitability factors for each site based on the environmental, legal, and institutional attributes present, and generate reports based on these suitability factors. This report describes the development of HES, its data requirements, and its application to each state assessment; in addition, it summarizes the data derivation process and data for the states. Modeling of the undeveloped hydropower resources in the United States, based on environmental, legal, and institutional constraints, has identified 5,677 sites that have a total undeveloped capacity of about 30,000 megawatts.
iii
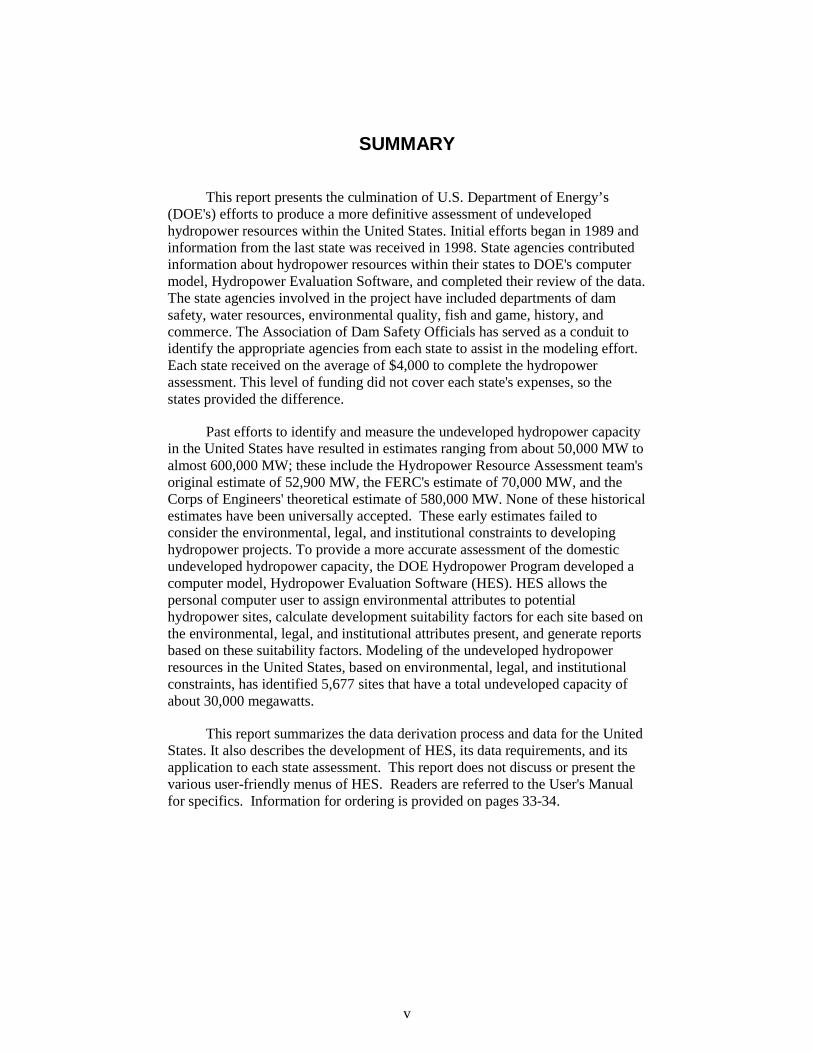
SUMMARY
This report presents the culmination of U.S. Department of Energy’s (DOE's) efforts to produce a more definitive assessment of undeveloped hydropower resources within the United States. Initial efforts began in 1989 and information from the last state was received in 1998. State agencies contributed information about hydropower resources within their states to DOE's computer model, Hydropower Evaluation Software, and completed their review of the data. The state agencies involved in the project have included departments of dam safety, water resources, environmental quality, fish and game, history, and commerce. The Association of Dam Safety Officials has served as a conduit to identify the appropriate agencies from each state to assist in the modeling effort. Each state received on the average of $4,000 to complete the hydropower assessment. This level of funding did not cover each state's expenses, so the states provided the difference.
Past efforts to identify and measure the undeveloped hydropower capacity in the United States have resulted in estimates ranging from about 50,000 MW to almost 600,000 MW; these include the Hydropower Resource Assessment team's original estimate of 52,900 MW, the FERC's estimate of 70,000 MW, and the Corps of Engineers' theoretical estimate of 580,000 MW. None of these historical estimates have been universally accepted. These early estimates failed to consider the environmental, legal, and institutional constraints to developing hydropower projects. To provide a more accurate assessment of the domestic undeveloped hydropower capacity, the DOE Hydropower Program developed a computer model, Hydropower Evaluation Software (HES). HES allows the personal computer user to assign environmental attributes to potential hydropower sites, calculate development suitability factors for each site based on the environmental, legal, and institutional attributes present, and generate reports based on these suitability factors. Modeling of the undeveloped hydropower resources in the United States, based on environmental, legal, and institutional constraints, has identified 5,677 sites that have a total undeveloped capacity of about 30,000 megawatts.
This report summarizes the data derivation process and data for the United States. It also describes the development of HES, its data requirements, and its application to each state assessment. This report does not discuss or present the various user-friendly menus of HES. Readers are referred to the User's Manual for specifics. Information for ordering is provided on pages 33-34.
v

ACKNOWLEDGMENTS
The authors would like to thank Peggy A. M. Brookshier and John V. Flynn of the Department of Energy for their active participation and timely comments. We also thank all those individuals from the states for providing valuable information and positive feedback.
vii

CONTENTS
ABSTRACT....................................................................................................................................... iii
SUMMARY ....................................................................................................................................... v
ACKNOWLEDGMENTS.................................................................................................................. vii
INTRODUCTION.............................................................................................................................. 1
Need For Uniform Criteria ...................................................................................................... 1
Model Development ................................................................................................................ 2
Model Validation ..................................................................................................................... 2
Modeling Process..................................................................................................................... 3
Model Goal .............................................................................................................................. 3
DATA SOURCES.............................................................................................................................. 4
Primary Data Sources .............................................................................................................. 4
Secondary Data Sources .......................................................................................................... 5
Data Sources for Threatened and Endangered Species............................................................ 6
SITE ATTRIBUTES AND SUITABILITY FACTOR DETERMINATION.................................... 7
Environmental, Legal, and Institutional Attribute Definitions ................................................ 7
Suitability Factor Values ......................................................................................................... 11
Dam Status............................................................................................................................... 11
Overall Project Suitability Factor ............................................................................................ 12
LIMITATIONS AND APPLICABILITY .......................................................................................... 14
ASSESSMENT PROCESS AND ASSUMPTIONS.......................................................................... 15
SUMMARY OF COMPLETED HYDROPOWER RESOURCE ASSESSMENT........................... 16
CONCLUSIONS................................................................................................................................ 32
OBTAINING INDIVIDUAL STATE INFORMATION ................................................................... 33
ADDITIONAL HYDROPOWER EVALUATION SOFTWARE INFORMATION........................ 34
REFERENCES................................................................................................................................... 35
ix

Appendix A—Basic Site Data............................................................................................................ A-1
FIGURES
1. Sample printout of resource database listing................................................................................. 10
2. Number of sites with undeveloped hydropower capacity by state for Alabama through Missouri 25
3. Number of sites with undeveloped hydropower capacity by state for Montana through Wyoming 26
4. Total undeveloped hydropower capacity by state for Alabama through Missouri........................ 27
5. Total undeveloped hydropower capacity by state for Montana through Wyoming ...................... 27
6. Total undeveloped hydropower capacity by site status................................................................. 28
7. Location of the majority of hydropower sites by state, reported as a percentage of the total number of sites......................................................................................................................... 29
TABLES
1. Valuation of environmental attributes........................................................................................... 11
2. Suitability factors by dam status for environmental attributes...................................................... 12
3. Overall project suitability factor computation............................................................................... 13
4. Hydropower capacity summary modeled by HES ........................................................................ 17
5. The percent of the original undeveloped hydropower capacity that remains after HES is applied. 29
x
U.S. Hydropower Resource Assessment Final Report
INTRODUCTION
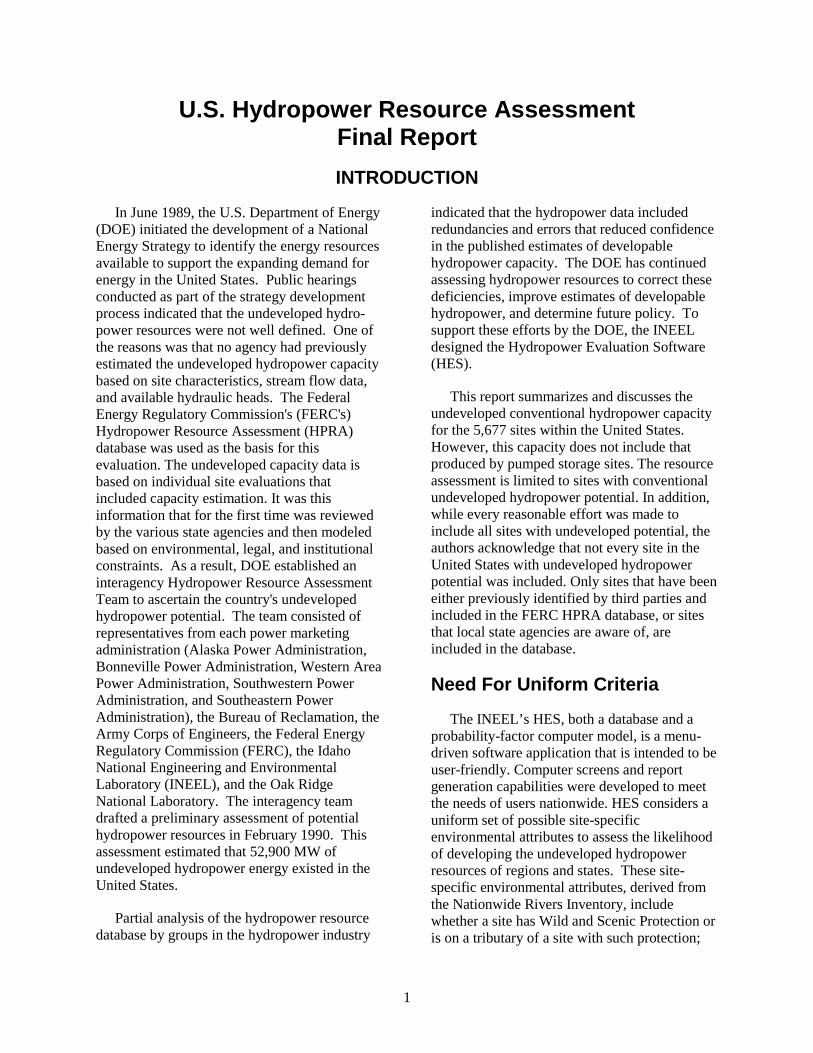
In June 1989, the U.S. Department of Energy (DOE) initiated the development of a National Energy Strategy to identify the energy resources available to support the expanding demand for energy in the United States. Public hearings conducted as part of the strategy development process indicated that the undeveloped hydro-power resources were not well defined. One of the reasons was that no agency had previously estimated the undeveloped hydropower capacity based on site characteristics, stream flow data, and available hydraulic heads. The Federal Energy Regulatory Commission's (FERC's) Hydropower Resource Assessment (HPRA) database was used as the basis for this evaluation. The undeveloped capacity data is based on individual site evaluations that included capacity estimation. It was this information that for the first time was reviewed by the various state agencies and then modeled based on environmental, legal, and institutional constraints. As a result, DOE established an interagency Hydropower Resource Assessment Team to ascertain the country's undeveloped hydropower potential. The team consisted of representatives from each power marketing administration (Alaska Power Administration, Bonneville Power Administration, Western Area Power Administration, Southwestern Power Administration, and Southeastern Power Administration), the Bureau of Reclamation, the Army Corps of Engineers, the Federal Energy Regulatory Commission (FERC), the Idaho National Engineering and Environmental Laboratory (INEEL), and the Oak Ridge National Laboratory. The interagency team drafted a preliminary assessment of potential hydropower resources in February 1990. This assessment estimated that 52,900 MW of undeveloped hydropower energy existed in the United States.
Partial analysis of the hydropower resource database by groups in the hydropower industry
indicated that the hydropower data included redundancies and errors that reduced confidence in the published estimates of developable hydropower capacity. The DOE has continued assessing hydropower resources to correct these deficiencies, improve estimates of developable hydropower, and determine future policy. To support these efforts by the DOE, the INEEL designed the Hydropower Evaluation Software (HES).
This report summarizes and discusses the undeveloped conventional hydropower capacity for the 5,677 sites within the United States. However, this capacity does not include that produced by pumped storage sites. The resource assessment is limited to sites with conventional undeveloped hydropower potential. In addition, while every reasonable effort was made to include all sites with undeveloped potential, the authors acknowledge that not every site in the United States with undeveloped hydropower potential was included. Only sites that have been either previously identified by third parties and included in the FERC HPRA database, or sites that local state agencies are aware of, are included in the database.
Need For Uniform Criteria
The INEEL’s HES, both a database and a probability-factor computer model, is a menu-driven software application that is intended to be user-friendly. Computer screens and report generation capabilities were developed to meet the needs of users nationwide. HES considers a uniform set of possible site-specific environmental attributes to assess the likelihood of developing the undeveloped hydropower resources of regions and states. These site-specific environmental attributes, derived from the Nationwide Rivers Inventory, include whether a site has Wild and Scenic Protection or is on a tributary of a site with such protection;
1

whether cultural, historical, fishery, geologic, recreational, scenic, or wildlife attributes are present; and whether threatened or endangered fish or wildlife are present. The attributes are based on the potential project's location, including whether the site is within a national park, national grasslands, national wildlife refuge, or other federal lands. HES’s use of uniform criteria allows personal computer users nationwide to identify environmental attributes present at sites with undeveloped hydropower capacity, calculate development suitability factors for each site based on the attributes present, and generate uniform reports based on these factors.
HES was developed as a tool for use by regional power marketing administrations and state energy agencies, because they are the most likely to need accurate hydropower information. HES was not intended to provide precise development factors for individual sites, but to provide regional or state capacity totals. Because the software was developed as a generic measurement tool encompassing national issues, regional and state totals must be considered judiciously; various local issues may skew hydropower capacity totals. Employing HES as a national measurement tool will smooth any local anomalies.
Model Development
HES uses environmental attribute data to generate an overall project suitability factor between 0.1 and 0.9, with 0.1 representing the lowest possibility of development and 0.9 representing the least impediment to development. A combination of attributes results in a lower suitability factor because multiple environmental considerations reduce the likelihood that a site may be developed to its physical capacity.
HES was developed with input from Oak Ridge National Laboratory, which provided the essential environmental evaluation support (Sale 1990). The INEEL also received valuable assistance from the Southwestern Power
Administration, which helped defined the database requirements and the reporting capabilities required by a power marketing administration, and valuable managerial assistance from the Association of Dam Safety Officials.
Model Validation
The INEEL used the HES to assess the undeveloped hydropower capacity in the Southwestern Power Administration area during the HES testing stage. The states in this area include Arkansas, Kansas, Louisiana, Missouri, Oklahoma, and Texas. HES identified about 250 sites with undeveloped hydropower capacity. After the HES computer model analysis was completed, the estimated Southwestern Power Administration hydropower resources were reduced 33.5%. This reduction resulted from the influence of various environmental attributes on the reality of successfully developing a hydropower site.
After successfully developing and testing HES in conjunction with the Southwestern Power Administration, the interagency team recognized that a process was necessary to successfully integrate the evaluation process between the individual states and the DOE's Hydropower Program. With administrative relationships already in place with the individual states, the team believed that using the DOE's Support Offices to coordinate the assessment process might prove to be a practical method to assess the entire United States. The Denver Support Office coordinated the assessments of the individual states within their administrative region (Colorado, Montana, North Dakota, South Dakota, Utah, and Wyoming), as did the Boston Support Office (Connecticut, Maine, Massachusetts, New Hampshire, Rhode Island, and Vermont), the Kansas Support Office (Iowa), and the Chicago Support Office (Indiana). The test assessments, including obtaining individual state input, proved to be a viable method that could be used to assess hydropower capacity throughout the United States.
2
Modeling Process
The basic modeling process incorporated the following steps:
1. The FERC HPRA database was used for basic site information such as site name, river, county, state, if a dam or power plant was previously developed, and the undeveloped hydropower potential.
2. This data was reviewed by the INEEL for redundancy and accuracy and entered into the HES model.
3. The National Rivers Inventory data, containing environmental, institutional, and legal attributes, was entered into the HES by the INEEL for those undeveloped sites that are located on river reaches containing NRI-listed attributes.
4. Wild and Scenic information was obtained from several sources and this information was also entered by the INEEL into the HES for those undeveloped sites that are located on river reaches with either wild and scenic designation or river reaches being considered for wild and scenic designation.
5. The HES containing the above information for each respective state was then sent to the
individual states agencies for review and input.
6. After the state information was entered into the HES, the INEEL generated individual state reports for public dissemination via published reports and the internet (http://www.inel.gov/national/ hydropower/state/stateres.htm)
Model Goal
The goal of HES is to ensure that a set of uniform criteria is used to determine the viable national hydropower capacity. This undeveloped hydropower is not limited to that which could be produced at new sites; it also includes the hydropower that could be produced at sites that currently produce hydropower but are not developed to their full capacity. This undeveloped hydropower is a source of nonpolluting, renewable energy available to meet the growing power needs of the United States. HES has helped to make this goal obtainable and ensured the use of uniform criteria during the national assessment process.
The HES is not intended to be a static assessment, as sites can be added and changes can be made to the modeling dynamics if the need for additional renewable sites becomes such that the influence of the attributes changes in the future.
3
DATA SOURCES
Primary Data Sources
The Federal Energy Regulatory Commission's (FERC’s) HPRA database and the National Park Service's Nationwide Rivers Inventory database are the two main information databases used for hydropower site data. State input is used to validate the HES-modeled results.
Hydropower Resource Assessment Database. This database is maintained by FERC and contains the best available national inventory of undeveloped hydropower capacity. It contains information about all sites that have been subject to any FERC hydropower licensing action and information on project sites that have been identified by FERC, or other agencies, as having development capacity even if no licensing action has taken place. This database lists project sites and corresponding basic site data. Approximately 5,700 sites with undeveloped hydropower capacity are listed in the HPRA database.
Nationwide Rivers Inventory Database. The Nationwide Rivers Inventory was initially completed in 1982 by the National Park Service and has been periodically updated since that time. Park Service regional offices systematically collected information on rivers and identified those with outstanding resources. Uniform procedures for identifying rivers for the Nationwide Rivers inventory, including field and map verification of each river's values, were applied throughout the country. Specific outstanding resources were identified for those river reaches selected for inclusion in the Nationwide Rivers Inventory. Reaches were identified if outstanding fisheries, wildlife, geologic features, historical resources, cultural resources, recreation resources, scenic values, or other resources were present. The Nationwide Rivers Inventory also indicates the presence of threatened and endangered species (classified as fish or terrestrial wildlife) and whether the reach is part of, or considered for, inclusion in a state or federal wild and scenic rivers program.
Although the National Park Service used uniform procedures to consider rivers throughout the United States for inclusion in the Nationwide Rivers Inventory, it would be incorrect to assume that if a potential site is not on a reach listed in the Nationwide Rivers Inventory there would be few environmental impediments to development: significant changes, such as new fisheries or increased recreational use, may have occurred since the Nationwide Rivers Inventory was last updated.
State Resource and Energy Agencies. After the information contained in FERC's HPRA database and the National Park Service's Nationwide Rivers Inventory database were entered into HES, the modeled results were presented to the natural resource departments or energy offices. Each state was then able to provide input, validate, and in many cases update the environmental and physical attributes present at each of the undeveloped hydropower sites. Additionally, the individual states were able to add previously unlisted sites that were known to state agencies as having undeveloped hydropower capacity.
State input is often the result of coordinated canvassing between several state agencies within each state. For instance, water management agencies may identify sites with undeveloped hydropower capacity that were not listed in FERC's HPRA database. Or, state agencies may be aware of state historical sites such as archeological sites of early Indian societies or other historical values that would impact the probability of developing a hydropower site. This state input often results in an adjustment of a site's overall project suitability value. In the case of the addition of previously unidentified sites with undeveloped hydropower capacity, a state's sum of undeveloped hydropower capacity may be increased. The value of state input to the modeling of undeveloped hydropower capacity cannot be overstated. Based on site visits such as dam safety inspections, wildlife field work, and cultural assessments, each state is the best source of local site knowledge.
4

Secondary Data Sources on streams with high ratings in these categories will have greater environmental concerns.
Other data sources can also be used to identify project locations and to assign environmental attributes to these locations. Some of these data sources are national in coverage, while others are available only for smaller areas such as individual states. Each additional database used will need to be obtained from its source, and the environmental attributes it lists will need to be extracted.
Power Marketing Administrations . Power marketing administrations possess significant information that is of primary importance to the successful application of HES. Each power marketing administration can verify any outside sources of data that are used; but, of greater importance, each power marketing administration can provide significant information about anything affecting potential hydropower development within its region. Power marketing administrations will be aware of possible state opposition and any local action regarding a specific project.
State Environmental Databases. Many states keep inventories of aquatic and riparian resources. These inventories can include lists of high-quality and possibly protected streams, natural areas, and recreational resources. State data is often very useful for determining the environmental feasibility of hydropower sites, but the data may require a great deal of manipulation before it can be incorporated into a regional database for hydropower evaluation. Because little state information is available in digital format, it is difficult to input state data into the HES database.
An example of a state database is the California Department of Fish and Game Wild Trout Program inventory, which lists streams identified as outstanding trout fisheries; such streams are protected from development under California law. As another example, the state of Utah has rated each of its streams by the following categories: (a) type of fishery, (b) productivity, (c) reproductive success, (d) spawning habitat, and (e) aesthetics. Projects
American Rivers Outstanding Rivers List. During 1988, an organization named American Rivers published its Outstanding Rivers List. This list is a comprehensive, nationwide compilation of rivers that possess some outstanding ecological, recreational, natural, cultural, or scenic values. Rivers protected by legislation and rivers currently unprotected are included. The list contains an estimated 15,000 river reaches, totaling about 300,000 river miles. Each river reach is described in terms such as its upriver and downriver end points, its total length, its significance, and the source of information. Some of this information is redundant with the Nationwide Rivers Inventory, which is included within the Outstanding River List, but much of it is additional information.
Northwest Power Planning Council. Streams under the jurisdiction of the Bonneville Power Administration have been studied by area states and rated by the Northwest Power Planning Council for the suitability of additional hydropower development. Streams were rated for values such as anadromous fish presence, resident fish populations, wildlife, natural features, cultural features, and recreation. In 1987, the Northwest Power Planning Council published a list of streams deemed unsuitable for hydropower development, which generally includes all streams containing anadromous fisheries. For projects proposed in the Bonneville Power Administration marketing area, the stream ratings are an important source of environmental attributes.
Wetlands Inventories. The presence of wetlands that could be affected by a potential hydropower project is an important environmental attribute because wetlands are protected under the Clean Water Act. The U.S. Fish and Wildlife Service has inventoried wetlands in some regions, and maps of these inventoried wetlands are available. Wetland inventories are also available from some states.
5

Data Sources for Threatened and Endangered Species
U.S. Fish and Wildlife Service Threatened and Endangered Species Database. Geographic information in this database is given by county and hydrologic unit and sometimes at finer resolutions. Species information includes locations of species, life histories of species, legal histories of the designation as threatened and endangered species, habitat use, bibliographies, contact
people, and key words that identify species as aquatic, wetland, or riparian species. The database has been in transition between in-house development and contracted management (by the Nature Conservancy) for several years. It appears that a wealth of information exists but may be difficult to access.
Nature Conservancy. The Nature Conservancy has a national database of all species that identifies threatened and endangered species. This database organizes geographic information by county.
6

SITE ATTRIBUTES AND SUITABILITY FACTOR DETERMINATION
Environmental, Legal, and Institutional Attribute Definitions
The INEEL derived the following 19 environmental attributes from the Nationwide Rivers Inventory. The corresponding suitability factors are fully explained in the Suitability Factor Determination section below.
Wild/Scenic Protection. This attribute identifies project sites that are included in the federal wild and scenic rivers system, under consideration for inclusion in the federal system, included in a state river protection program, in a designated wilderness area, or protected from development under another program. Relatively few sites have this status, but those that do are highly unlikely to be developed. Projects at undeveloped sites on state or federally protected wild and scenic rivers, or in wilderness areas, must be assumed to be legally protected from hydropower development. Also, projects at sites under consideration for protection are highly likely to be opposed by state and federal resource agencies, and protection will be approved at many such sites before hydropower development could occur. Since it is possible, but highly unlikely, that development could occur at a site with wild and scenic river protection, the suitability factor assigned to all such projects at undeveloped sites is 0.1.
It is highly unlikely that a project at an existing dam would be on a wild and scenic river since rivers are usually designated as wild and scenic only if they are free of developments such as dams. A suitability factor of 0.5 is assigned for such unusual cases.
Wild and Scenic Tributary or Upstream or Downstream of a Wild and Scenic Location. This attribute is assigned to a project if it is at the upstream or downstream end of a wild and scenic river reach or is on a tributary of a wild and scenic river. A project at
a developed site would affect a downstream wild and scenic river if additional alterations to the flow regime resulted. A suitability factor of 0.75 is assigned for such projects. Projects at undeveloped sites are highly likely to alter the flow regime and may cause changes in downstream water quality, so a suitability factor of 0.5 is assigned to undeveloped sites.
Cultural and Historic Values. Project impacts on cultural and historic resources can often be mitigated (for example, by excavating archeological sites or relocating historic structures). Projects at existing dams are unlikely to affect such resources unless an increase in reservoir pool elevation occurs or major new structures are built. A suitability factor of 0.75 is assigned to such projects. Development of undeveloped sites is more likely to affect cultural and historic resources, so a suitability factor of 0.5 is assigned.
Fish Presence Value. A stream reach may or may not have legally protected fisheries. In either case, however, strong state opposition to new development must be expected if a valuable fishery resource exists. Relatively high instream flow release requirements can mitigate the impact on fisheries, but a high instream flow release would reduce the economic viability of the project. Projects at developed sites could have some impact, such as increased turbine mortality. A suitability factor of 0.75 is assigned to projects at developed sites. Development at undeveloped sites could have a major impact on aquatic habitat through inundation, migration blockage, turbine mortality, water quality, and altered flows. Some of these can be mitigated, but such mitigation could be expensive. A suitability factor of 0.25 is assigned to undeveloped sites.
Geologic Value . Geologic values such as rock formations are rarely protected legally and are not generally affected by small projects. Development at existing sites is not affected by
7
geologic resources, so a suitability factor of 0.9 is assigned. Development at undeveloped sites may inundate geologic features, so a suitability factor of 0.5 is assigned.
Recreation Value. River recreation users tend to be effective opponents of hydropower development. Development at any storage dam would affect recreation by altering flow releases; mitigation typically includes higher flow releases during periods of high recreation use. Such releases can be made through turbines, but higher flow releases tend to occur when power demands are low. Projects at existing dams would have little effect on recreation besides flow alterations, so they are assigned a suitability factor of 0.75. Projects at undeveloped sites would inundate reaches, block the passage of boats, and reduce aesthetics. Because projects at undeveloped sites are likely to be strongly opposed, a suitability factor of 0.25 is assigned.
Scenic Value. Scenic values are not legally protected but must be considered in assessing the impact of a project. Scenic values are also important to recreational river users. The addition of power to existing dams would alter scenic values only through the addition of new structures and perhaps by reducing visually attractive spillage, so a suitability factor of 0.9 is assigned. New projects at undeveloped sites would have important effects on scenic resources because views would be altered by the project. Undeveloped projects are assigned a suitability factor of 0.5.
Wildlife Value. Terrestrial wildlife and wildlife habit are protected by fish and game agencies that are influential in determining mitigation requirements for hydropower projects. Development at existing sites would have little effect on wildlife unless reservoir pool elevations are altered or construction of major facilities is required. A suitability factor of 0.75 is assigned for projects at existing sites. Development at undeveloped sites could inundate wildlife habitat, and construction would cause a great deal of disturbance. It is difficult to mitigate for such impacts, so opposition to such a project could be strong.
Undeveloped projects are assigned a suitability factor of 0.25.
Other Value. The effects of other values, such as the presence of rare wetland communities or consideration for wilderness designation, are assigned by using the most commonly assigned suitability factor for the other values. For projects at developed sites, the suitability factor is 0.75. For projects at undeveloped sites, the suitability factor is 0.5.
Threatened and Endangered Fish or Wildlife. The presence of threatened and endangered species near a project site requires additional consultations with wildlife agencies and can result in additional studies and mitigation requirements. The presence of threatened and endangered fish species may preclude development of new storage projects because new projects can involve the greatest alteration of aquatic habitat. Terrestrial threatened and endangered species are unlikely to be highly affected by run-rivers projects, but storage reservoirs could affect terrestrial habitat. For existing sites, a suitability factor of 0.75 is assigned when threatened and endangered species are present. For projects at undeveloped sites, a suitability factor of 0.5 is assigned when threatened and endangered species are present.
Federal Land Code 103: National Park, Monument, Lakeshore, Parkway, Battlefield, Or Recreation Area. These lands are legally protected from development. A suitability factor of 0.1 is assigned for such projects.
Federal Land Code 104: National Forest or Grassland . These lands are not legally protected from development, but the managing agency has the right to impose additional mitigation requirements on projects. A suitability factor of 0.75 is assigned to projects at existing sites, since these projects typically have fewer impacts. A suitability factor of 0.5 is assigned for undeveloped sites.
Federal Land Code 105: National Wildlife Refuge, Game Preserve, or Fish Hatchery. These lands are managed for fish
8

and wildlife habitats, and hydropower development would almost always be incompatible. A suitability factor of 0.1 is assigned for such projects.
Federal Land Code 106: National Scenic Waterway or Wilderness Area. These lands are legally protected from development. A suitability factor of 0.1 is assigned for such projects.
Federal Land Code 107: Indian Reservation. These lands are not legally protected from development, but Indian tribes have the right to impose additional mitigation requirements on projects. A suitability factor of 0.75 is assigned for projects at developed sites, and a suitability factor of 0.5 is assigned for projects at undeveloped sites.
Federal Land Code 108: Military Reservation. These lands are not legally protected from development, but the managing agency has the right to impose additional mitigation requirements on projects. A suitability factor of 0.75 is assigned for projects at developed sites, and a suitability factor of 0.5 is assigned for projects at undeveloped sites.
Federal Land Code 198: Not on Federal Land. This variable indicates that the project is not on federal land, so there are not any development constraints based on Federal Land Codes. The value for this variable is 0.9.
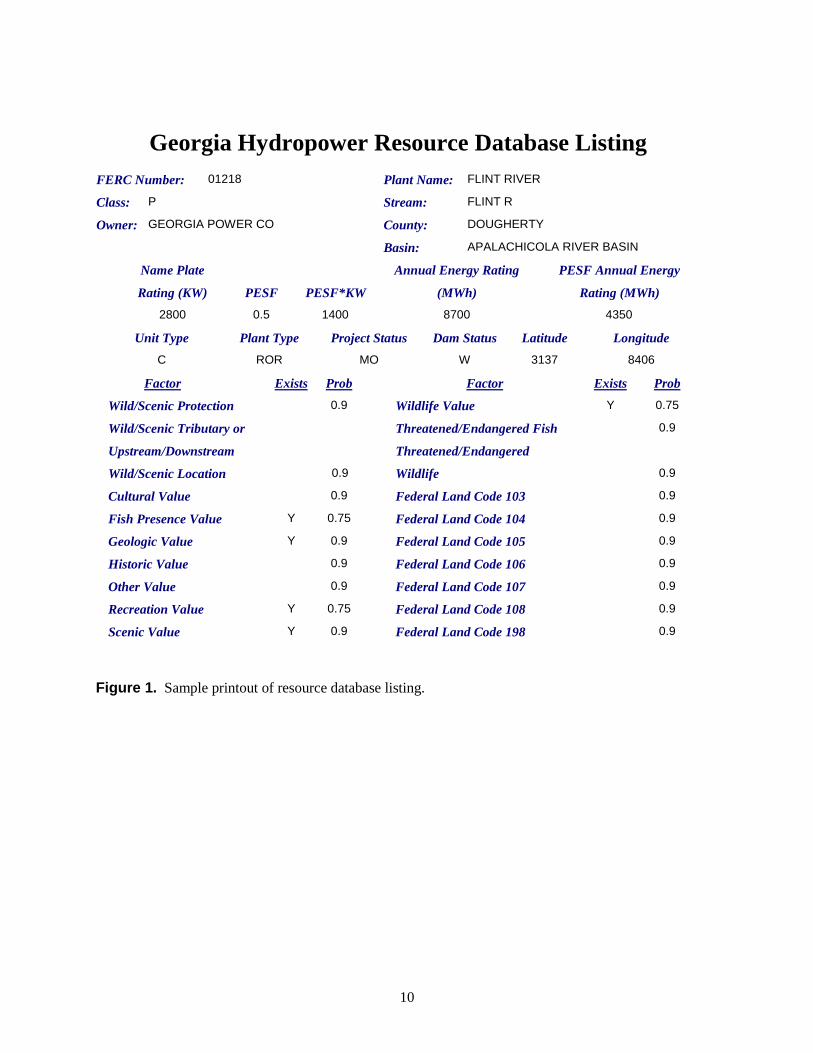
Figure 1 illustrates all of the data requirements presented above in a report printout from HES. The cultural, fish presence, historic, and scenic values combine to give the sample site a project suitability factor (PESF) of 0.5.
9
Georgia Hydropower Resource Database Listing
FERC Number: 01218 Plant Name: FLINT RIVER
Class: P Stream: FLINT R
Owner: GEORGIA POWER CO County: DOUGHERTY
Basin: APALACHICOLA RIVER BASIN
Name Plate Annual Energy Rating PESF Annual Energy
Rating (KW) PESF PESF*KW (MWh) Rating (MWh)
2800 0.5 1400 8700 4350
Unit Type Plant Type Project Status Dam Status Latitude Longitude
C ROR MO W 3137 8406
Factor Exists Prob Factor Exists Prob
Wild/Scenic Protection 0.9 Wildlife Value Y 0.75
Wild/Scenic Tributary or Threatened/Endangered Fish 0.9
Upstream/Downstream Threatened/Endangered
Wild/Scenic Location 0.9 Wildlife 0.9
Cultural Value 0.9 Federal Land Code 103 0.9
Fish Presence Value Y 0.75 Federal Land Code 104 0.9
Geologic Value Y 0.9 Federal Land Code 105 0.9
Historic Value 0.9 Federal Land Code 106 0.9
Other Value 0.9 Federal Land Code 107 0.9
Recreation Value Y 0.75 Federal Land Code 108 0.9
Scenic Value Y 0.9 Federal Land Code 198 0.9
Figure 1. Sample printout of resource database listing.
10

Suitability Factor Values
Suitability factors depend on the environmental attributes of the potential project site. They reflect the probability that environmental considerations can make a project site unacceptable, prohibiting its development. The suitability factors were developed in conjunction with Oak Ridge National Laboratory staff who are experienced in hydropower licensing cases. Five potential values were selected, as shown in Table 1. These suitability factors are appropriate only for the regional analysis of overall hydropower development capacity and are not useful for determining the ultimate viability of developing a specific project site.
Dam Status
The effects of environmental attributes vary by dam status. The dam status classifications follow FERC standard, which is
W = Developed hydropower site with power.
W/O = Developed site without power generation (the site has some type of developed impoundment or diversion structure).
Table 1. Valuation of environmental attributes.
U = Undeveloped site (the site does not have power generation capability, no developed impoundment, nor a diversion structure).
Undeveloped sites do not have any power or civil structures in place; developed sites without power do not have any power generation capability but do have some type of civil structure such as a dam or water diversion structure; and developed sites with power have current generation and a civil structure onsite with additional, undeveloped hydropower capacity.
The best way to explain the influence dam status has on a project's environmental suitability factor is to provide an example: development at an undeveloped site will have a greater impact on recreation than additional development at an existing site. So if a recreation value is present at an undeveloped site, a probability of 0.25 is assigned to reflect the decreased likelihood of development. If a recreation value is present at a developed site (either with or without power), then a value of 0.75 is assigned because additional development of a site already having a structure, either with or without power, is less likely to be impacted by any recreation value. These factors and all the other factors used are shown in Table 2.
Effect of Environmental Attribute Value of Suitability Factor
Least impediment to development 0.90
Minor reduction in likelihood of development 0.75
Likelihood of development reduced by half 0.50
Major reduction in likelihood of development 0.25
Development prohibited or highly unlikely 0.10
11
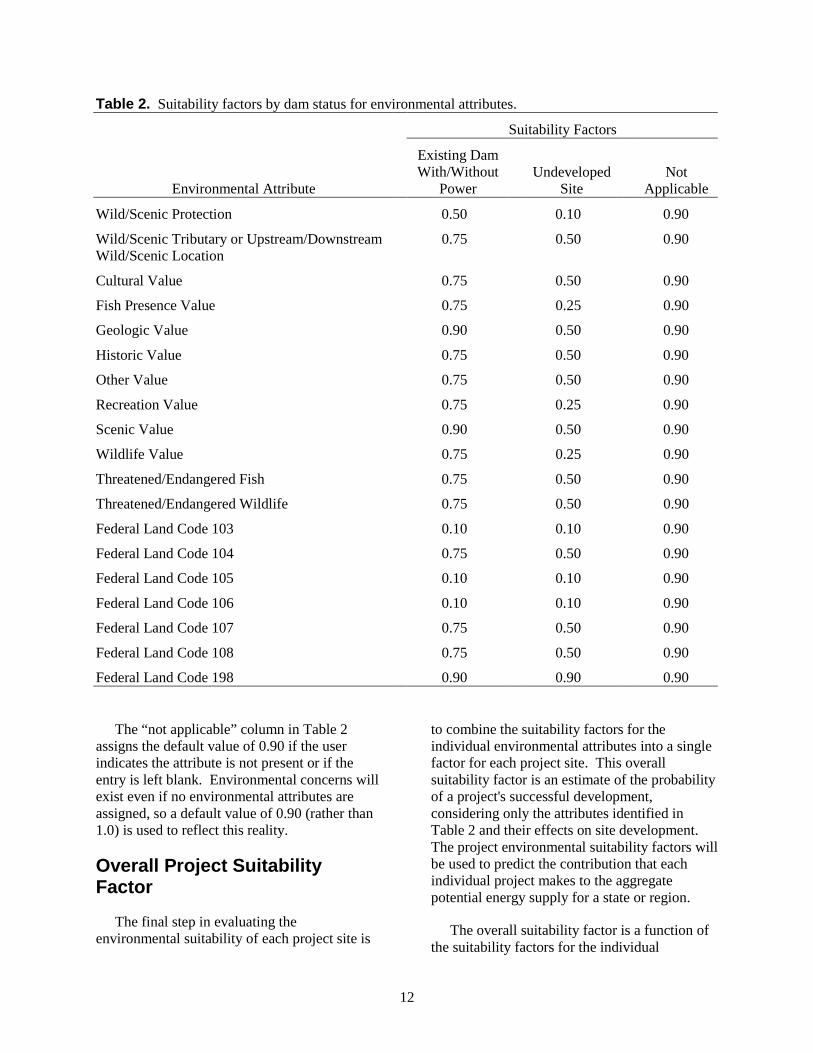
Table 2. Suitability factors by dam status for environmental attributes.
Suitability Factors
Existing Dam With/Without Undeveloped Not
Environmental Attribute Power Site Applicable
Wild/Scenic Protection 0.50 0.10 0.90
Wild/Scenic Tributary or Upstream/Downstream 0.75 0.50 0.90 Wild/Scenic Location
Cultural Value 0.75 0.50 0.90
Fish Presence Value 0.75 0.25 0.90
Geologic Value 0.90 0.50 0.90
Historic Value 0.75 0.50 0.90
Other Value 0.75 0.50 0.90
Recreation Value 0.75 0.25 0.90
Scenic Value 0.90 0.50 0.90
Wildlife Value 0.75 0.25 0.90
Threatened/Endangered Fish 0.75 0.50 0.90
Threatened/Endangered Wildlife 0.75 0.50 0.90
Federal Land Code 103 0.10 0.10 0.90
Federal Land Code 104 0.75 0.50 0.90
Federal Land Code 105 0.10 0.10 0.90
Federal Land Code 106 0.10 0.10 0.90
Federal Land Code 107 0.75 0.50 0.90
Federal Land Code 108 0.75 0.50 0.90
Federal Land Code 198 0.90 0.90 0.90
The “not applicable” column in Table 2 assigns the default value of 0.90 if the user indicates the attribute is not present or if the entry is left blank. Environmental concerns will exist even if no environmental attributes are assigned, so a default value of 0.90 (rather than 1.0) is used to reflect this reality.
Overall Project Suitability Factor
The final step in evaluating the environmental suitability of each project site is
to combine the suitability factors for the individual environmental attributes into a single factor for each project site. This overall suitability factor is an estimate of the probability of a project's successful development, considering only the attributes identified in Table 2 and their effects on site development. The project environmental suitability factors will be used to predict the contribution that each individual project makes to the aggregate potential energy supply for a state or region.
The overall suitability factor is a function of the suitability factors for the individual
12

environmental attributes. The presence of more than one environmental attribute means that more than one environmental concern affects a project. The overall suitability factor should obviously be no greater than the lowest factor for individual attributes, and it should be less than the lowest factor if multiple significant environmental constraints are present. For example, if an undeveloped project has both fish values (suitability factor = 0.25) and recreation values (suitability factor = 0.25), the cumulative effects of these two concerns will make its overall suitability even less than 0.25; so an overall suitability factor of 0.1 is assigned.
If the environmental suitability factors for individual environmental attributes were truly the probability of the project's being developed, then the overall probability of development could be mathematically calculated. And, if the individual suitability factors were true and independent probabilities, then the probability of
Table 3. Overall project suitability factor computation.
developing the project site because of environmental concerns would be equal to the product of all the individual factors. However, FERC's licensing process is not a statistical probability function, and it cannot be assumed that suitability factors can be handled as independent probabilities (for example, there is a strong correlation between the scenic, recreational, and fishing values of a stream). In addition, environmental attributes not considered by HES would bias the value of the overall suitability factor if it were calculated as a probability.
The procedure outlined in Table 3 is used for assigning overall suitability factors. This procedure assumes that the lowest suitability factor dominates the likelihood of a project's development. However, it also considers the reduced likelihood of development resulting from the occurrence of multiple low suitability factors.
Project Suitability Individual Environmental Suitability Factors Factors
No environmental attributes assigned 0.90
Lowest individual factor(s) = 0.90 0.90
Lowest individual factor = 0.75 0.75
Two or more lowest individual factors = 0.75 0.50
Lowest individual factor = 0.50 0.50
Two or more lowest individual factors = 0.50 0.25
Lowest individual factor = 0.25 0.25
Two or more lowest individual factors = 0.25 0.10
Lowest individual factor(s) = 0.10 0.10
13

LIMITATIONS AND APPLICABILITY
HES is not intended to model the likelihood of development of any specific hydropower project. To perform this function, HES would have had to encompass the many site-specific factors affecting a distinctive site. With so many unique sites in the nation, an unmanageable number of single-site-specific attributes would be required, the database and software would become burdensome and unmanageable, and it would fail to provide a uniform nationwide evaluation. In the Pacific Northwest, for instance, if HES incorporated single-site-specific criteria it would have included any outcomes from the “Salmon Summit,” the attempt to aid the migration of salmon and steelhead. This consideration would have been unique to the Northwest area only, not to the majority of the United States. Additionally, if a single state decreed that there would be no additional hydropower development within its boundaries, HES would fail in its mission if it included an
attribute unique to that single state but not pertinent to the remaining 49 states. If there is significant state opposition, it will most likely be based on factors such as fish and recreation values, which HES is designed to model; and if the site is undeveloped and fish and recreation values are present, then HES would assign an overall project suitability factor of 0.1. Tests conducted with the Southwestern Power Administration, and through them several states, indicated that HES does satisfactorily model local concerns affecting hydropower development when environmental, legal, and institutional constraints to development are present. The model provides a uniform evaluation of hydropower capacity, and it should be used to accumulate regional capacity, not individual project capacity. Summing the regional totals provides a national total of the undeveloped hydropower resources available.
14
ASSESSMENT PROCESS AND ASSUMPTIONS
The assessment process uses a logical extraction of data from the two primary data sources discussed previously: the Nationwide Rivers Inventory and the HPRA databases. The basic site data is relatively easy to download. However, extracting the environmental attributes data is somewhat tedious because of the cross-referencing needed between the two database sources and the interpretation of narrative descriptions of outstanding environmental attributes.
Environmental attributes for sites on river reaches listed in the Nationwide Rivers Inventory can be assigned several ways. The first and simplest is to assign the environmental attributes of a Nationwide Rivers Inventory reach to any undeveloped hydropower project that is located in the same state and county and on the same river that is listed in the Nationwide Rivers Inventory. This method relies on the state, county, and river identifiers in the HPRA database for location; these identifiers are unlikely to be inaccurate.
A second method for assigning Nationwide Rivers Inventory attributes to projects is to (a) use the river mile designations for Nationwide Rivers Inventory reaches to locate the reaches on FERC river basin maps, (b) use the Geographic Information System to map the projects at the same scale, and (c) overlay the
project maps on the Nationwide Rivers Inventory reach maps to see which projects fall on Nationwide Rivers Inventory reaches. This method is potentially more accurate since only the projects actually on the Nationwide Rivers Inventory reach would be identified. Sites within a specified distance upstream or downstream of the Nationwide Rivers Inventory reach could also be identified and assigned the environmental attributes of the Nationwide Rivers Inventory reach. The main disadvantage of this method is that it uses the latitude-longitude coordinates of projects from the HPRA database, which are occasionally missing or inaccurate. For this and other reasons, the first method was used. The first method also ensures that any upstream or downstream impacts from development are also considered.
The application of suitability factors is straightforward once all of the environmental attributes have been identified. One simply follows the specifications in Table 2.
The underlying assumption in the evaluation process is that the suitability factors being assigned to environmental attributes represent the degree to which these attributes will decrease the likelihood of developing a site. One must also assume that the combination of suitability factors is not multiplicative but can be represented by the weighing scheme shown in Table 3.
15

SUMMARY OF COMPLETED HYDROPOWER RESOURCE ASSESSMENT
This status report discusses the undeveloped hydropower capacity within the United States. The hydropower resource assessment utilized the Hydropower Evaluation Software (HES).
As stated in the Abstract, the Southwestern Power Administration was used for model testing. The six states in this power marketing administration are Arkansas, Kansas, Louisiana, Missouri, Oklahoma, and Texas. The remaining 44 states have also been assessed. The information for the resource assessment was obtained primarily from FERC’s Hydroelectric Power Resources Assessment database and the National Park Service’s National Rivers Inventory database. Input was also obtained from individual state agencies regarding the undeveloped hydropower capacity and the natural resources present within their respective states. Note, Delaware was not asked to participate due to only one site reported in Delaware.
The goal of HES is to ensure that a set of uniform criteria is used to determine the viable national hydropower capacity. Undeveloped hydropower is not limited to that which could be developed at new sites; it also includes power that could be produced at sites that currently have hydropower but are not developed to their full capacity. This criterion includes environmental, legal, and institutional attributes. These attributes can include (1) scenic, cultural, historical, and geological values; (2) Federal and state land-use, which includes parks, wildlife preserves, recreation areas, forests, wilderness areas, scenic waterways, and military or Indian reservations; and (3) legal protection issues such as Wild and Scenic legislation, and Threatened or Endangered Fish and Wildlife legislative protection.
The amount that each attribute affects the likelihood of development depends on the physical state of a site. HES assumes that a site
can have one of three development states. These are (a) completely undeveloped with no structures present; (b) developed site without power—some type of civil structure such as a dam, weir, or abandoned power plant may be present, but there is no power being generated; or (c) ongoing power generation with additional undeveloped capacity.
Using the hydropower summary report menu feature of HES, the 50 states are summarized in Table 4. Figures 2 through 7 elaborate on the capacity adjustments presented in Table 4. The figures show that HES will adjust the undeveloped capacity downward due to the effects of environmental, legal, and institutional attributes. The figures also demonstrate the wide variation in the number of sites and the undeveloped capacities that are unique to each state.
Figures 2 and 3 summarize the number of potential hydropower sites in each of the 50 states, based on environmental and legal conditions existing as of 1998 or earlier. The number of sites does not change after HES adjustments are made. California has the highest total number of sites (763) and the most undeveloped sites (463), and Delaware has the fewest sites (1). Wisconsin has the largest number of developed sites (46) that also have additional undeveloped hydropower capacity. While Delaware, Florida, Louisiana, Mississippi, New Hampshire, New Jersey, Rhode Island, Tennessee, West Virginia, and Wyoming do not have any sites with existing power production that are not already developed to their full capacity. The total number of sites for the 50 states is 5,677. Developed sites with existing power (389) account for about 7% of the total number of sites while there are 2,527 developed sites without power, and 2,761 undeveloped sites.
16
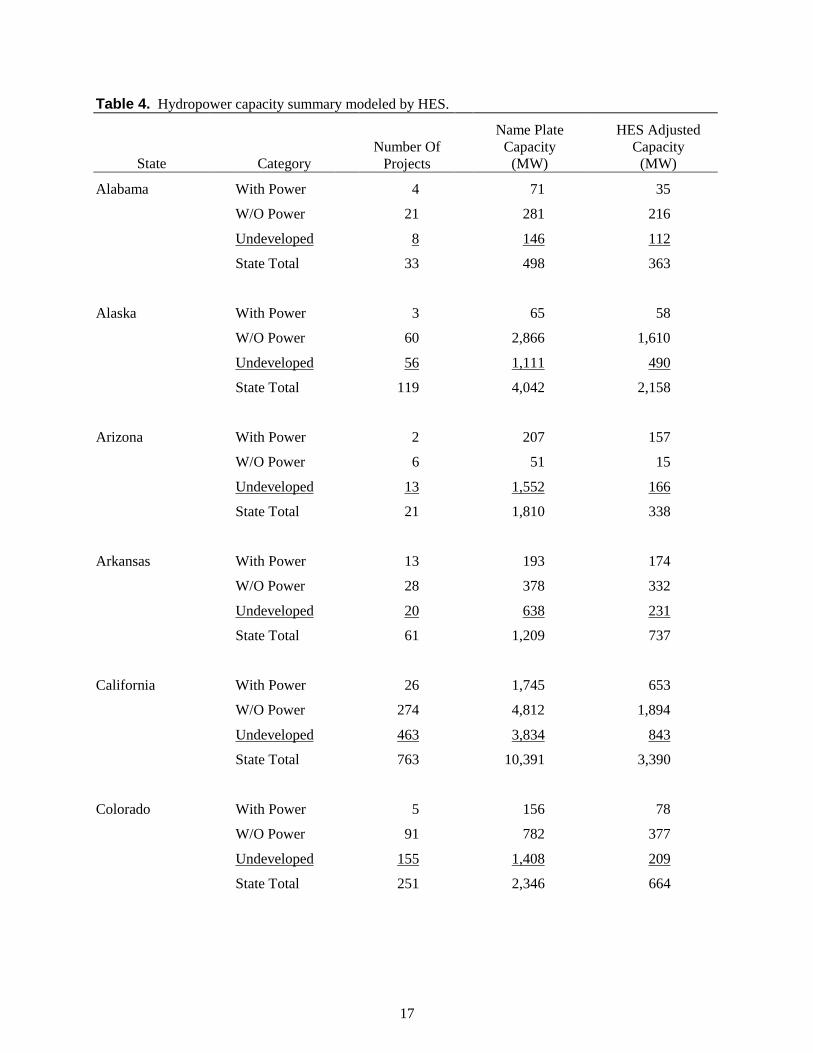
Table 4. Hydropower capacity summary modeled by HES.
State
Alabama
Category
With Power
W/O Power
Undeveloped
State Total
Number Of Projects
4
21
8
33
Name Plate Capacity (MW)
71
281
146
498
HES Adjusted Capacity (MW)
35
216
112
363
Alaska With Power
W/O Power
Undeveloped
State Total
3
60
56
119
65
2,866
1,111
4,042
58
1,610
490
2,158
Arizona With Power
W/O Power
Undeveloped
State Total
2
6
13
21
207
51
1,552
1,810
157
15
166
338
Arkansas With Power
W/O Power
Undeveloped
State Total
13
28
20
61
193
378
638
1,209
174
332
231
737
California With Power
W/O Power
Undeveloped
State Total
26
274
463
763
1,745
4,812
3,834
10,391
653
1,894
843
3,390
Colorado With Power
W/O Power
Undeveloped
State Total
5
91
155
251
156
782
1,408
2,346
78
377
209
664
17
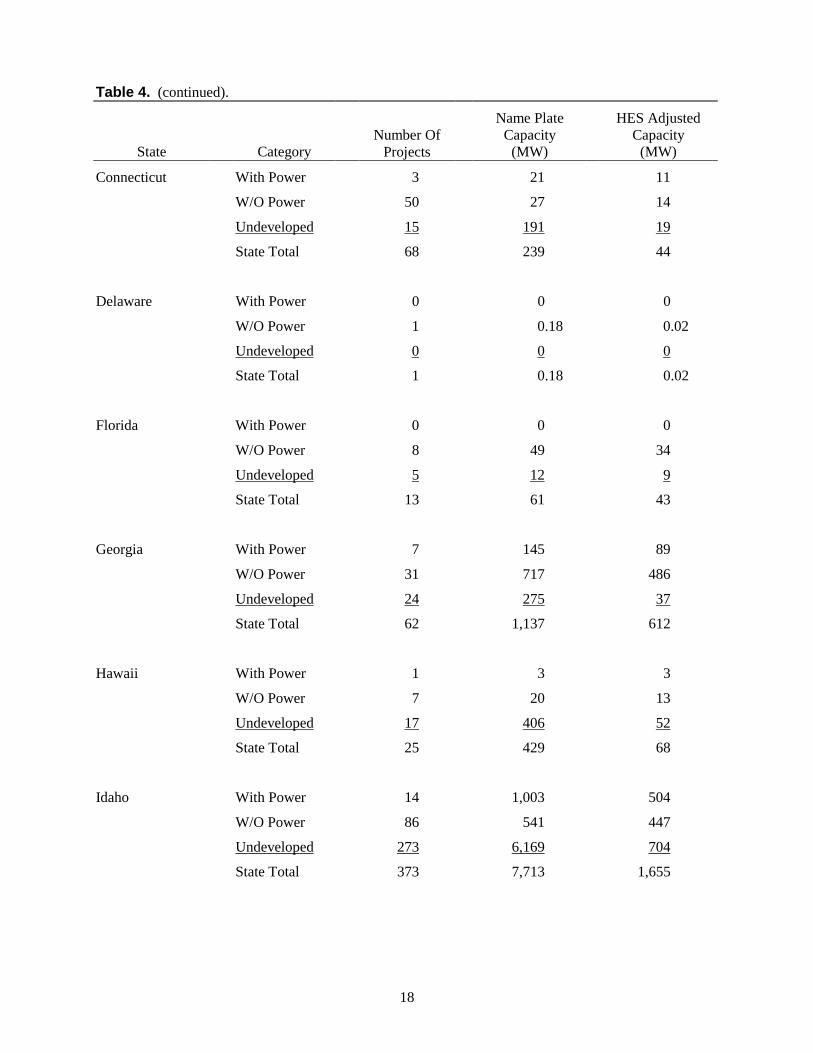
Table 4. (continued).
Name Plate HES Adjusted Number Of Capacity Capacity
State Category Projects (MW) (MW)
Connecticut With Power 3 21 11
W/O Power 50 27 14
Undeveloped 15 191 19
State Total 68 239 44
Delaware With Power 0 0 0
W/O Power 1 0.18 0.02
Undeveloped 0 0 0
State Total 1 0.18 0.02
Florida With Power 0 0 0
W/O Power 8 49 34
Undeveloped 5 12 9
State Total 13 61 43
Georgia With Power 7 145 89
W/O Power 31 717 486
Undeveloped 24 275 37
State Total 62 1,137 612
Hawaii With Power 1 3 3
W/O Power 7 20 13
Undeveloped 17 406 52
State Total 25 429 68
Idaho With Power 14 1,003 504
W/O Power 86 541 447
Undeveloped 273 6,169 704
State Total 373 7,713 1,655
18

Table 4. (continued).
State
Illinois
Category
With Power
W/O Power
Undeveloped
State Total
Number Of Projects
9
35
5
49
Name Plate Capacity (MW)
80
457
58
595
HES Adjusted Capacity (MW)
41
242
18
301
Indiana With Power
W/O Power
Undeveloped
State Total
3
24
3
30
16
51
17
84
8
34
2
44
Iowa With Power
W/O Power
Undeveloped
State Total
7
69
3
79
115
310
30
455
61
219
25
305
Kansas With Power
W/O Power
Undeveloped
State Total
1
12
5
18
0.06
53
100
153
0.03
45
38
83
Kentucky With Power
W/O Power
Undeveloped
State Total
1
46
4
51
19
851
43
913
10
425
4
439
Louisiana With Power
W/O Power
Undeveloped
State Total
0
14
8
22
0
78
148
226
0
67
133
200
19

Table 4. (continued).
State
Maine
Category
With Power
W/O Power
Undeveloped
State Total
Number Of Projects
24
74
269
367
Name Plate Capacity (MW)
83
1,069
554
1,706
HES Adjusted Capacity (MW)
47
768
227
1,042
Maryland With Power
W/O Power
Undeveloped
State Total
1
32
3
36
196
32
1
229
20
10
0.10
30
Massachusetts With Power
W/O Power
Undeveloped
State Total
12
87
31
130
28
118
179
325
14
62
56
132
Michigan With Power
W/O Power
Undeveloped
State Total
11
53
22
86
25
459
129
613
17
354
18
389
Minnesota With Power
W/O Power
Undeveloped
State Total
12
21
7
40
98
73
55
226
72
51
14
137
Mississippi With Power
W/O Power
Undeveloped
State Total
0
13
6
19
0
81
47
128
0
62
29
91
20

Table 4. (continued).
State
Missouri
Category
With Power
W/O Power
Undeveloped
State Total
Number Of Projects
6
12
11
29
Name Plate Capacity (MW)
116
203
378
697
HES Adjusted Capacity (MW)
104
181
38
323
Montana With Power
W/O Power
Undeveloped
State Total
7
72
79
158
470
1,129
2,073
3,672
235
502
277
1,014
Nebraska With Power
W/O Power
Undeveloped
State Total
3
23
19
45
46
117
182
345
28
62
59
149
Nevada With Power
W/O Power
Undeveloped
State Total
9
48
124
181
5
41
80
126
4
31
32
67
New Hampshire With Power
W/O Power
Undeveloped
State Total
0
63
34
97
0
51
65
116
0
25
7
32
New Jersey With Power
W/O Power
Undeveloped
State Total
0
9
3
12
0
6
5
11
0
5
4
9
21
Table 4. (continued).
State
New Mexico
Category
With Power
W/O Power
Undeveloped
State Total
Number Of Projects
2
12
8
22
Name Plate Capacity (MW)
11
48
31
90
HES Adjusted Capacity (MW)
6
24
5
35
New York With Power
W/O Power
Undeveloped
State Total
44
212
96
352
286
754
1,079
2,119
162
495
652
1,309
North Carolina With Power
W/O Power
Undeveloped
State Total
6
57
30
93
16
594
848
1,458
14
369
125
508
North Dakota With Power
W/O Power
Undeveloped
State Total
2
10
2
14
86
13
0.04
99
43
7
0.04
50
Ohio With Power
W/O Power
1
33
2
183
1
138
Undeveloped
State Total
9
43
57
242
44
183
Oklahoma With Power
W/O Power
Undeveloped
State Total
9
18
6
33
274
78
190
542
179
68
94
341
22

Table 4. (continued).
Name Plate HES Adjusted Number Of Capacity Capacity
State Category Projects (MW) (MW)
Oregon With Power 3 45 11
W/O Power 101 2,549 1,916
Undeveloped 118 950 318
State Total 222 3,544 2,245
Pennsylvania With Power 5 207 105
W/O Power 67 310 187
Undeveloped 32 1,701 411
State Total 104 2,218 703
Rhode Island With Power 0 0 0
W/O Power 27 12 10
Undeveloped 3 2 1
State Total 30 14 11
South Carolina With Power 2 6 3
W/O Power 31 855 444
Undeveloped 16 273 33
State Total 49 1,134 480
South Dakota With Power 5 569 285
W/O Power 25 548 405
Undeveloped 3 6 5
State Total 33 1,123 695
Tennessee With Power 0 0 0
W/O Power 11 20 10
Undeveloped 11 476 128
State Total 22 496 138
23

Table 4. (continued).
State
Texas
Category
With Power
W/O Power
Undeveloped
State Total
Number Of Projects
23
26
40
89
Name Plate Capacity (MW)
56
164
1,014
1,234
HES Adjusted Capacity (MW)
46
140
832
1,018
Utah With Power
W/O Power
Undeveloped
State Total
8
69
245
322
48
900
990
1,938
8
414
472
894
Vermont With Power
W/O Power
Undeveloped
State Total
29
70
50
149
69
261
90
420
32
130
12
174
Virginia With Power
W/O Power
Undeveloped
State Total
9
52
27
88
16
690
544
1,250
12
376
229
617
Washington With Power
W/O Power
Undeveloped
State Total
11
238
313
562
1,033
3,373
3,069
7,475
875
1,777
762
3,414
West Virginia With Power
W/O Power
Undeveloped
State Total
0
27
10
37
0
1,597
328
1,925
0
1,002
147
1,149
24

Table 4. (continued).
State
Wisconsin
Category
With Power
Number Of Projects
46
Name Plate Capacity (MW)
190
HES Adjusted Capacity (MW)
111
W/O Power
Undeveloped
State Total
35
21
102
53
210
453
16
26
153
Wyoming With Power
W/O Power
Undeveloped
State Total
0
36
36
72
0
920
708
1,628
0
487
317
804
Totals With Power
W/O Power
Undeveloped
Grand Total
389
2,527
2,761
5,677
7,820
29,625
32,452
69,897
4,316
16,998
8,466
29,780
0
100
200
300
400
500
600
700
800
Undeveloped sites
Developed sites without power
Developed sites with power
Figure 2. Number of sites with undeveloped hydropower capacity by state for Alabama through Missouri.
25
0
100
200
300
400
500
600
Undeveloped sites
Developed sites without power
Developed sites with power
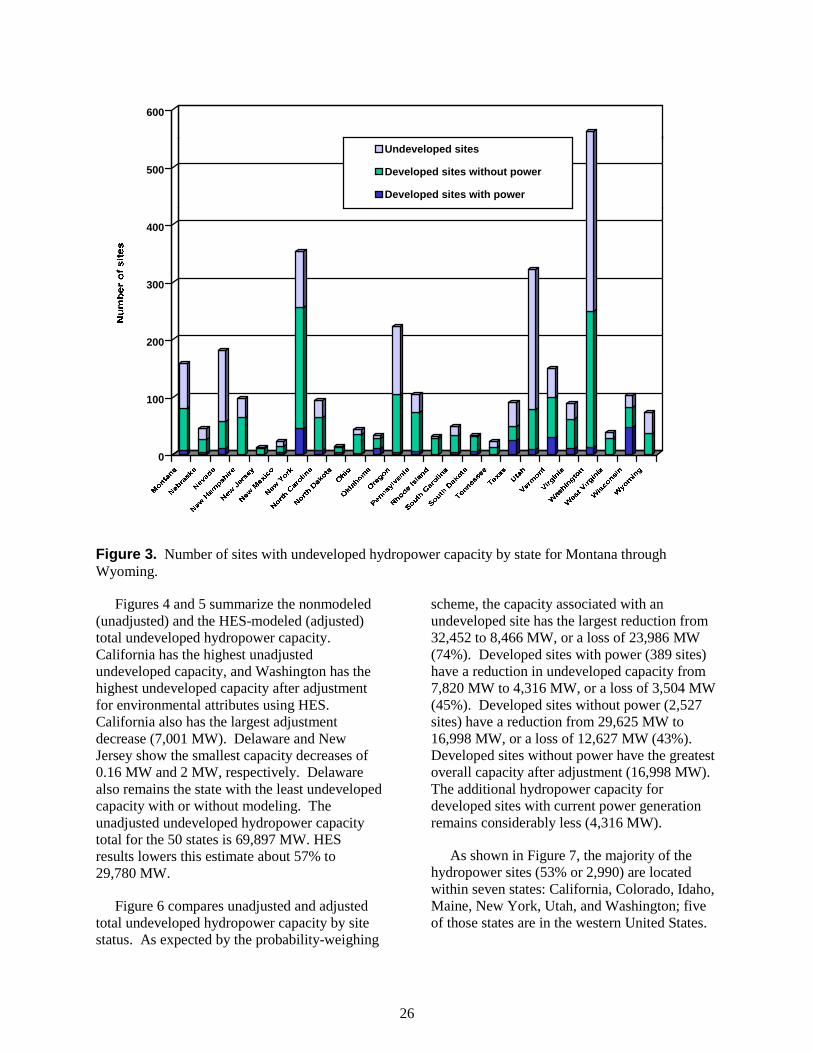
Figure 3. Number of sites with undeveloped hydropower capacity by state for Montana through Wyoming.
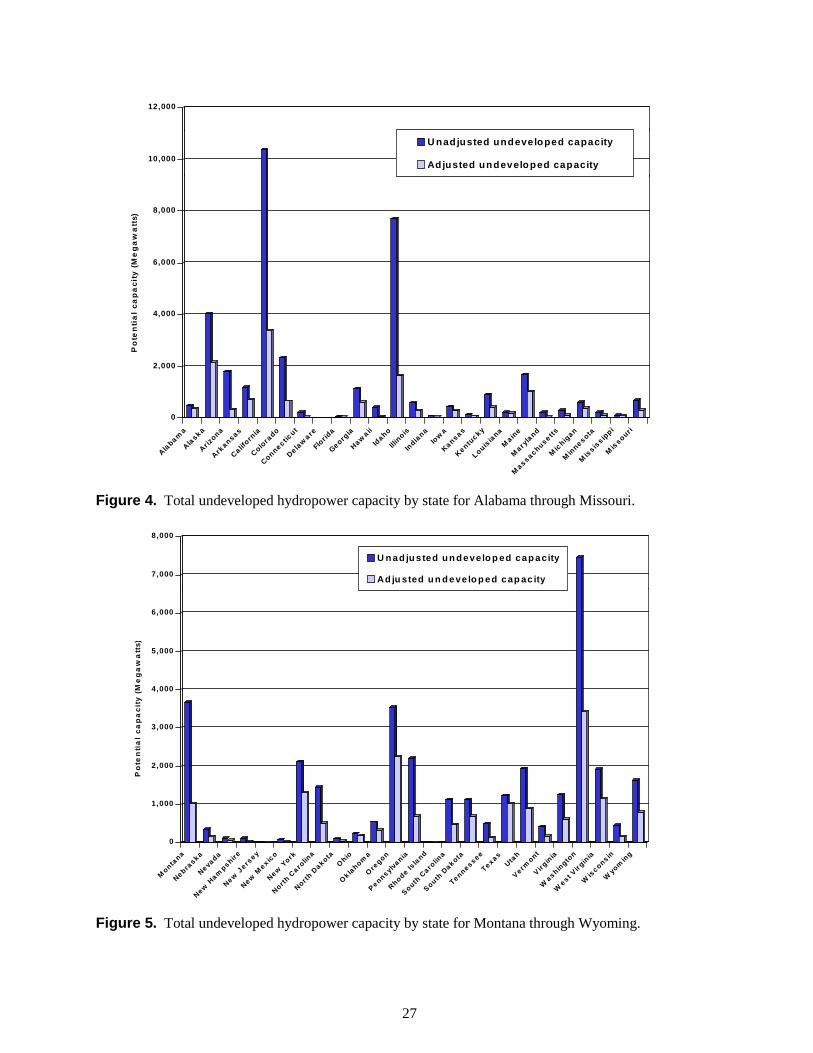
Figures 4 and 5 summarize the nonmodeled (unadjusted) and the HES-modeled (adjusted) total undeveloped hydropower capacity. California has the highest unadjusted undeveloped capacity, and Washington has the highest undeveloped capacity after adjustment for environmental attributes using HES. California also has the largest adjustment decrease (7,001 MW). Delaware and New Jersey show the smallest capacity decreases of 0.16 MW and 2 MW, respectively. Delaware also remains the state with the least undeveloped capacity with or without modeling. The unadjusted undeveloped hydropower capacity total for the 50 states is 69,897 MW. HES results lowers this estimate about 57% to 29,780 MW.
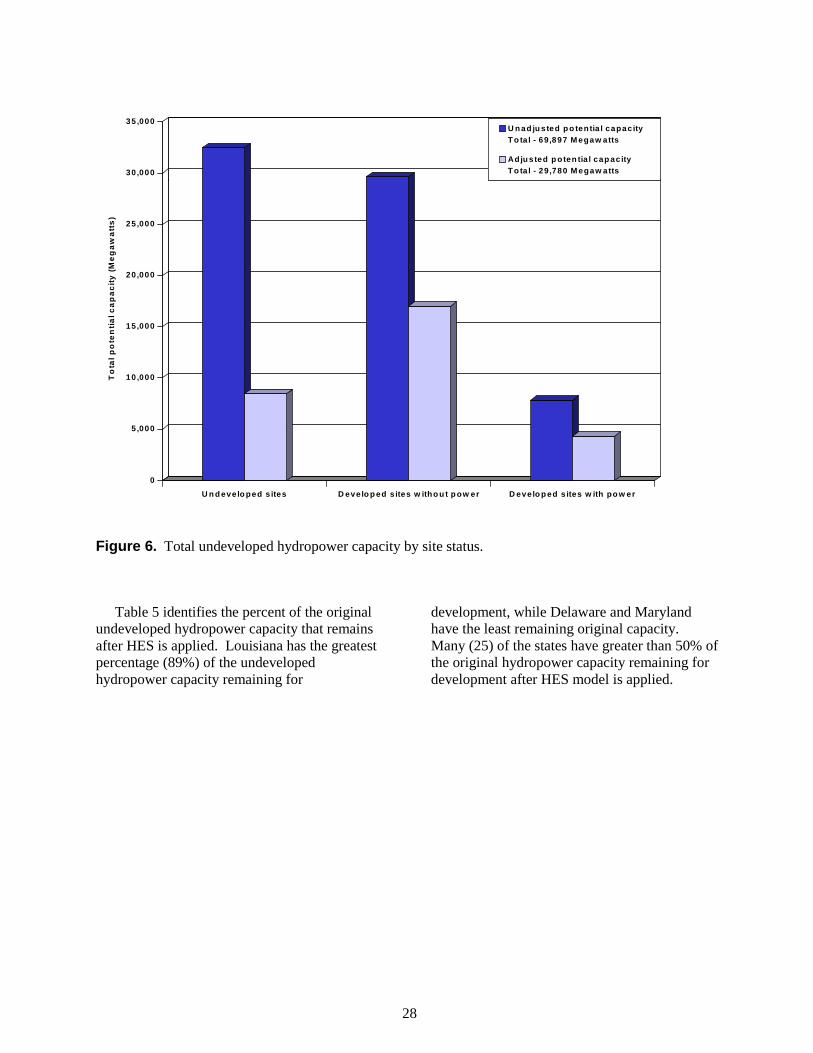
Figure 6 compares unadjusted and adjusted total undeveloped hydropower capacity by site status. As expected by the probability-weighing
scheme, the capacity associated with an undeveloped site has the largest reduction from 32,452 to 8,466 MW, or a loss of 23,986 MW (74%). Developed sites with power (389 sites) have a reduction in undeveloped capacity from 7,820 MW to 4,316 MW, or a loss of 3,504 MW (45%). Developed sites without power (2,527 sites) have a reduction from 29,625 MW to 16,998 MW, or a loss of 12,627 MW (43%). Developed sites without power have the greatest overall capacity after adjustment (16,998 MW). The additional hydropower capacity for developed sites with current power generation remains considerably less (4,316 MW).
As shown in Figure 7, the majority of the hydropower sites (53% or 2,990) are located within seven states: California, Colorado, Idaho, Maine, New York, Utah, and Washington; five of those states are in the western United States.
26
Alabam
a
Alaska
Ar izona
Arkansas
Ca liforn
ia
Colora
do
Connec ticut
De law
a re
Flor id
a
Georgia
Hawa ii
Idaho
Illinois
India
na
Iow
a
Kansas
Kentuc ky
Louisia
na
Ma in
e
Mary
land
Massachuse tts
Mic
higan
Min
nesota
Mis
s iss ip
pi
Mis
sour i
Monta
na
Nebraska
Nevada
New H
ampshire
New J
e rsey
New M
ex ico
New Y
ork
Nor th C
a rolin
a
Nor th D
akota
Ohio
Ok la
homa
Ore
gon
Pennsylvania
Rhode Isla
nd
South C
a rolin
a
South D
akota
Tennessee
Texas
Utah
Ve rmont
V irgin
ia
Washin
gton
Wes t V
irgin
ia
Wis
cons in
Wyo
min
g
12,000
10,000
8,000
6,000
4,000
2,000
0
U n ad j u st ed u n d eve l o p e d ca p a c i t y
A d j u s t e d unde v e l ope d c a pa c i t y
Po
ten
tia
l ca
pa
city
(M
eg
aw
att
s)
Figure 4. Total undeveloped hydropower capacity by state for Alabama through Missouri.
8,000
U n ad j u s t ed u n d eve l o p e d cap ac i t y
A d j u s t e d u n d e v e l o p e d c a p a c i t y 7,000
6,000
5,000
4,000
3,000
2,000
1,000
0
Po
ten
tia
l c
ap
ac
ity
(Me
ga
wa
tts
)
Figure 5. Total undeveloped hydropower capacity by state for Montana through Wyoming.
27
0
5 ,000
10 ,000
15 ,000
20 ,000
25 ,000
30 ,000
35 ,000 T
ota
l po
ten
tial c
ap
ac
ity (
Me
ga
wa
tts
)
U n ad ju s ted p o ten tia l capac ity T o ta l - 69,897 M egaw atts
Ad ju s ted p o ten tia l cap ac ity T o ta l - 29,780 M egaw atts
U n d eve lo ped s ites D eve lo p ed s ites w itho u t p ow er D eve lo p ed s ites w ith po w er
Figure 6. Total undeveloped hydropower capacity by site status.
Table 5 identifies the percent of the original development, while Delaware and Maryland undeveloped hydropower capacity that remains have the least remaining original capacity. after HES is applied. Louisiana has the greatest Many (25) of the states have greater than 50% of percentage (89%) of the undeveloped the original hydropower capacity remaining for hydropower capacity remaining for development after HES model is applied.
28
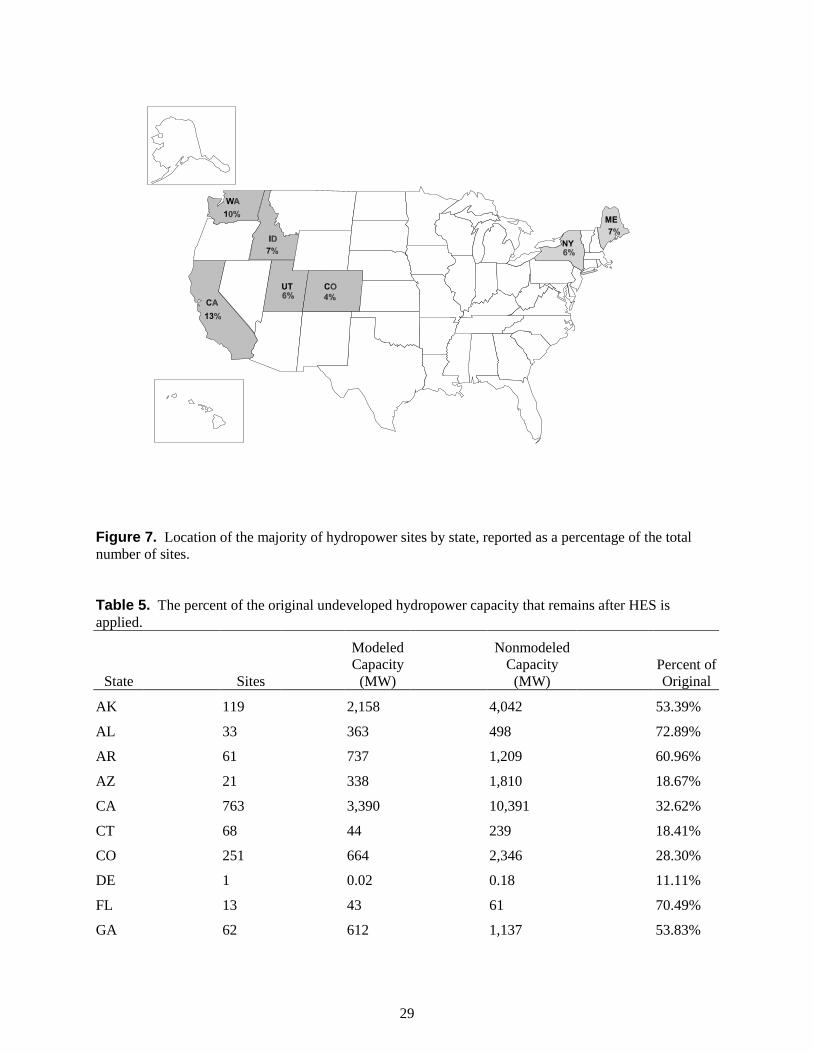
Figure 7. Location of the majority of hydropower sites by state, reported as a percentage of the total number of sites.
Table 5. The percent of the original undeveloped hydropower capacity that remains after HES is applied.
Modeled Nonmodeled Capacity Capacity Percent of
State Sites (MW) (MW) Original
AK 119 2,158 4,042 53.39%
AL 33 363 498 72.89%
AR 61 737 1,209 60.96%
AZ 21 338 1,810 18.67%
CA 763 3,390 10,391 32.62%
CT 68 44 239 18.41%
CO 251 664 2,346 28.30%
DE 1 0.02 0.18 11.11%
FL 13 43 61 70.49%
GA 62 612 1,137 53.83%
29

Table 5. (continued).
Modeled Nonmodeled Capacity Capacity Percent of
State Sites (MW) (MW) Original
HI 25 68 429 15.85%
IA 79 305 455 67.03%
ID 373 1,655 7,713 21.46%
IL 49 301 595 50.59%
IN 30 44 84 52.38%
KS 18 83 153 54.25%
KY 51 439 913 48.08%
LA 22 200 226 88.50%
MA 130 132 325 40.62%
MD 36 30 229 13.10%
ME 367 1,042 1,706 61.08%
MI 86 389 613 63.46%
MN 40 137 226 60.62%
MO 29 323 697 46.34%
MS 19 91 128 71.09%
MT 158 1,014 3,672 27.61%
NC 93 508 1,458 34.84%
ND 14 50 99 50.51%
NE 45 149 345 43.19%
NH 97 32 116 27.59%
NJ 12 9 11 81.82%
NM 22 35 90 38.89%
NV 181 67 126 53.17%
NY 352 1,309 2,119 61.77%
OH 43 183 242 75.62%
OK 33 341 542 62.92%
OR 222 2,245 3,544 63.35%
PA 104 703 2,218 31.70%
RI 30 11 14 78.57%
SC 49 480 1,134 42.33%
SD 33 695 1,123 61.89%
TN 22 138 496 27.82%
30
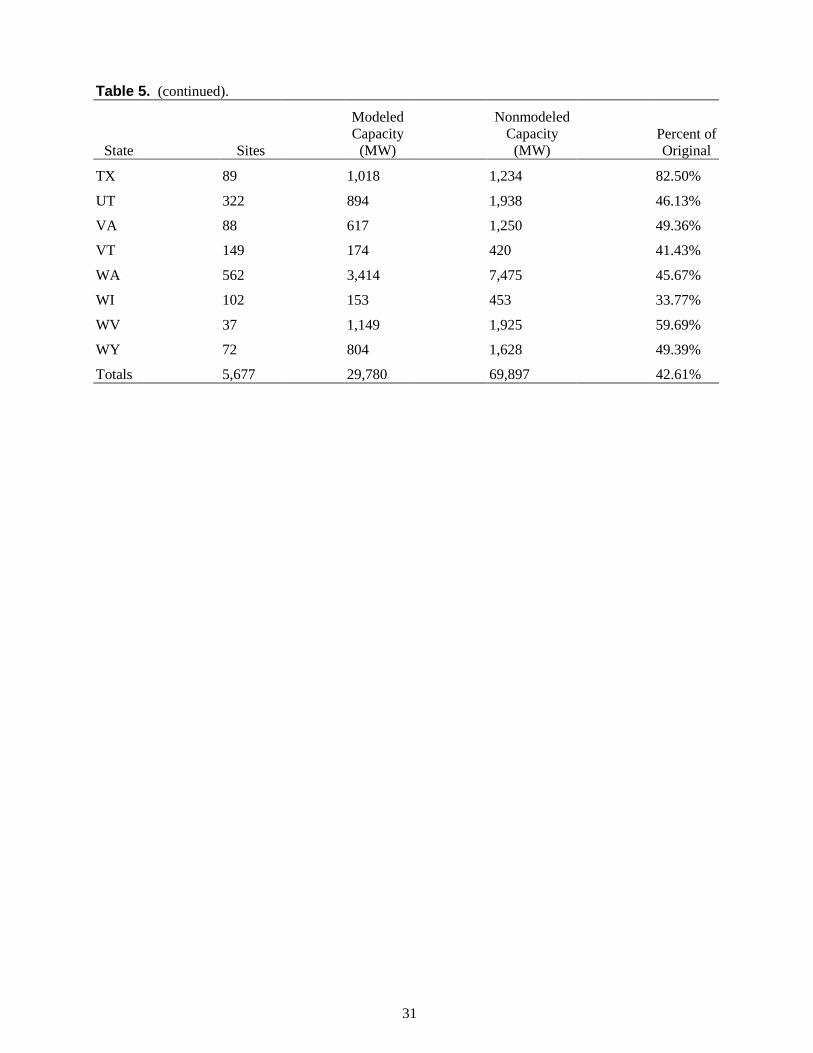
Table 5. (continued).
Modeled Nonmodeled Capacity Capacity Percent of
State Sites (MW) (MW) Original
TX 89 1,018 1,234 82.50%
UT 322 894 1,938 46.13%
VA 88 617 1,250 49.36%
VT 149 174 420 41.43%
WA 562 3,414 7,475 45.67%
WI 102 153 453 33.77%
WV 37 1,149 1,925 59.69%
WY 72 804 1,628 49.39%
Totals 5,677 29,780 69,897 42.61%
31
CONCLUSIONS
The trend for hydropower development is downward because of current environmental attributes and legal and institutional constraints. After loading hydropower data for the states into HES and checking the data with the respective states, the analysis indicates that undeveloped hydropower capacity will drop by about 43%. The greatest decrease for any state is always at undeveloped sites. However, with the development of new technologies (e.g., environmentally friendly turbines, ultra-low head turbines), or changes in the energy picture (e.g., another oil crisis), hydropower production could increase.
The results of the HES are obtained in a viable, low-cost manner and can be used by
developers as a preliminary means for identifying developable sites. These results provide a peerless means for identifying the undeveloped hydropower capacity essential for continued energy growth, which in turn is necessary for the continued economic strength of the United States.
Application of HES to current data significantly reduces state and regional totals for undeveloped hydropower capacity. However, an abundance of potential sites remain that are likely to be developed, given the current environmental awareness and geopolitical constraints. Strategies may need to be formulated to further assess those sites with the most potential for development.
32

OBTAINING INDIVIDUAL STATE INFORMATION
The HES results for the 49 statesa can be obtained by accessing DOE’s Hydropower Program homepage on the Internet at www.inel.gov/national/ hydropower/index.html, writing or calling the authors, or calling the National Technical Information Service (NTIS). Hydropower Evaluation Software can be obtained by contacting the authors. Reports of DOE-sponsored projects or reports received on foreign exchange agreements can be ordered from Oak Ridge, Tennessee. Reports are available in paper, microfiche, computer disks, and magnetic tape formats.
Telephone Orders. (703) 487-4650. NTIS sales desk and customer services are available between 8:30 a.m. and 5:00 p.m., Eastern Standard Time.
Fax. (703) 321-8547. Customers may fax their orders to NTIS. These orders may be charged to an NTIS deposit account, American Express, VISA, or MasterCard.
Email. Customers mail email their requests to [email protected].
Mail Orders. Mail orders should be sent to National Technical Information Service, Document Sales, 5285 Port Royal Road, Springfield, VA 22161. Call the sales desk [(703)487-4650] for prices before placing an order.
Method of Payment. Customers may pay for reports (and other NTIS products and services) by (a) credit card (American
Express, Visa, or MasterCard); (b) check or money order on a United States bank payable to NTIS; (c) an NTIS deposit account; or (d) in the United States, Canada, and Mexico, by asking to be billed (add $7.50 per order).
Handling Fee. A $3.00 handling fee per total order applies to orders from the United States, Canada, and Mexico. Handling charges do not apply to rush order service or pick-up orders.
Postage and Shipping. Orders are shipped first class mail, or equivalent, to addresses in the United States, Canada, and Mexico.
Order Turnaround Time. Technical reports are generally shipped within 2 to 8 days after the order is received. For faster service, NTIS offers rush order service.
Rush Order Service. Call 1-800-533-NTIS. In Virginia, Canada, and Mexico call (703) 487-4700. For NTIS rush order service add $15.00 per item. This guarantees that an order will be processed through NTIS within 24 hours of its receipt. These orders receive immediate, individual attention. The items ordered are delivered by first class mail. Call NTIS for information on rush order service for computer products.
For Help Tracing an Order. Call (703)487-4650 and request the customer service option.
a Delaware was not included because of few hydropower resources.
33

ADDITIONAL HYDROPOWER EVALUATION SOFTWARE INFORMATION
Additional information concerning HES can be obtained by contacting Alison Conner, Jim Francfort, or Ben Rinehart at the addresses provided below. Copies of the software and the User's Manual may also be obtained from these individuals.
Alison Conner Idaho National Engineering and Environmental Laboratory P. O. Box 1625, MS 3634 Idaho Falls, ID 83415-3634 phone: (208) 526-7799 fax: (208) 526-8861
Jim Francfort Idaho National Engineering and Environmental Laboratory P.O. Box 1625, MS 3830 Idaho Falls, ID 83415-3830 phone: (208) 526-6787 fax: (208) 526-0969
Ben Rinehart, Project Manager Idaho National Engineering and Environmental Laboratory P.O. Box 1625, MS 3830 Idaho Falls, ID 83415-3830 phone: (208) 526-1002 fax: (208) 526-0969
34

REFERENCES
Conner, Alison M., James E. Francfort, 1998, U.S. Hydropower Resource Assessment for Alabama, Idaho National Engineering and Environmental Laboratory, DOE/ID-10430(AL).
Conner, Alison M., James E. Francfort, 1997, U.S. Hydropower Resource Assessment for Alaska, Idaho National Engineering and Environmental Laboratory, DOE/ID-10430(AK).
Conner, Alison M., James E. Francfort, 1997, U.S. Hydropower Resource Assessment for Arizona, Idaho National Engineering and Environmental Laboratory, DOE/ID-10430(AZ).
Conner, Alison M., James E. Francfort, 1998, U.S. Hydropower Resource Assessment for California, Idaho National Engineering and Environmental Laboratory, DOE/ID-10430(CA).
Conner, Alison M., James E. Francfort, 1998, U.S. Hydropower Resource Assessment for Florida, Idaho National Engineering and Environmental Laboratory, DOE/ID-10430(FL).
Conner, Alison M., James E. Francfort, 1997, U.S. Hydropower Resource Assessment for Georgia, Idaho National Engineering and Environmental Laboratory, DOE/ID-10430(GA).
Conner, Alison M., James E. Francfort, 1996, U.S. Hydropower Resource Assessment for Hawaii, Idaho National Engineering Laboratory, DOE/ID-10430(HI).
Conner, Alison M., James E. Francfort, 1997, U.S. Hydropower Resource Assessment for Idaho, Idaho National Engineering and Environmental Laboratory, DOE/ID-10430(ID).
Conner, Alison M., James E. Francfort, 1997, U.S. Hydropower Resource Assessment for Illinois, Idaho National Engineering Laboratory, DOE/ID-10430(IL).
Conner, Alison M., James E. Francfort, 1997, U.S. Hydropower Resource Assessment for Kentucky, Idaho National Engineering and Environmental Laboratory, DOE/ID-10430(KY).
Conner, Alison M., James E. Francfort, 1997, U.S. Hydropower Resource Assessment for Maryland, Idaho National Engineering and Environmental Laboratory, DOE/ID-10430(MD).
Conner, Alison M., James E. Francfort, 1998, U.S. Hydropower Resource Assessment for Michigan, Idaho National Engineering and Environmental Laboratory, DOE/ID-10430(MI).
Conner, Alison M., James E. Francfort, 1996, U.S. Hydropower Resource Assessment for Minnesota, Idaho National Engineering Laboratory, DOE/ID-10430(MN).
Conner, Alison M., James E. Francfort, 1997, U.S. Hydropower Resource Assessment for Mississippi, Idaho National Engineering and Environmental Laboratory, DOE/ID-10430(MS).
Conner, Alison M., James E. Francfort, 1997, U.S. Hydropower Resource Assessment for Nebraska, Idaho National Engineering Laboratory, DOE/ID-10430(NE).
Conner, Alison M., James E. Francfort, 1997, U.S. Hydropower Resource Assessment for Nevada, Idaho National Engineering and Environmental Laboratory, DOE/ID-10430(NV).
35
Conner, Alison M., James E. Francfort, 1996, U.S. Hydropower Resource Assessment for New Jersey, Idaho National Engineering Laboratory, DOE/ID-10430(NJ).
Conner, Alison M., James E. Francfort, 1997, U.S. Hydropower Resource Assessment for New Mexico, Idaho National Engineering Laboratory, DOE/ID-10430(NM).
Conner, Alison M., James E. Francfort, 1997, U.S. Hydropower Resource Assessment for New York, Idaho National Engineering and Environmental Laboratory, DOE/ID-10430(NY).
Conner, Alison M., James E. Francfort, 1997, U.S. Hydropower Resource Assessment for North Carolina, Idaho National Engineering Laboratory, DOE/ID-10430(NC).
Conner, Alison M., James E. Francfort, 1997, U.S. Hydropower Resource Assessment for Ohio, Idaho National Engineering and Environmental Laboratory, DOE/ID-10430(OH).
Conner, Alison M., James E. Francfort, 1998, U.S. Hydropower Resource Assessment for Oregon, Idaho National Engineering and Environmental Laboratory, DOE/ID-10430(OR).
Conner, Alison M., James E. Francfort, 1997, U.S. Hydropower Resource Assessment for Pennsylvania, Idaho National Engineering and Environmental Laboratory, DOE/ID-10430(PA).
Conner, Alison M., James E. Francfort, 1997, U.S. Hydropower Resource Assessment for South Carolina, Idaho National Engineering Laboratory, DOE/ID-10430(SC).
Conner, Alison M., James E. Francfort, 1997, U.S. Hydropower Resource Assessment for Tennessee, Idaho National Engineering and Environmental Laboratory, DOE/ID-10430(TN).
Conner, Alison M., James E. Francfort, 1996, U.S. Hydropower Resource Assessment for Vermont, Idaho National Engineering Laboratory, DOE/ID-10430(VT).
Conner, Alison M., James E. Francfort, 1997, U.S. Hydropower Resource Assessment for Virginia, Idaho National Engineering and Environmental Laboratory, DOE/ID-10430(VA).
Conner, Alison M., James E. Francfort, 1997, U.S. Hydropower Resource Assessment for Washington, Idaho National Engineering and Environmental Laboratory, DOE/ID-10430(WA).
Conner, Alison M., James E. Francfort, 1998, U.S. Hydropower Resource Assessment for West Virginia, Idaho National Engineering and Environmental Laboratory, DOE/ID-10430(WV).
Conner, Alison M., James E. Francfort, 1996, U.S. Hydropower Resource Assessment for Wisconsin, Idaho National Engineering Laboratory, DOE/ID-10430(WI).
Conner, Alison M., James E. Francfort, and Ben N. Rinehart, 1996, Uniform Criteria for U.S. Hydropower Resource Assessment, Hydropower Evaluation Software Status Report--II, Idaho National Engineering Laboratory, DOE/ID-10430.1.
Francfort, James E., Scott D. Matthews, and Bennie N. Rinehart, 1991, Hydropower Evaluation Software User's Manual, Idaho National Engineering Laboratory, DOE/ID-10338.
36

Francfort, James E., 1993, U.S. Hydropower Resource Assessment for Arkansas, Idaho National Engineering Laboratory, DOE/ID-10430(AR).
Francfort, James E., 1994, U.S. Hydropower Resource Assessment for Colorado, Idaho National Engineering Laboratory, DOE/ID-10430(CO).
Francfort, James E., 1995, U.S. Hydropower Resource Assessment for Connecticut, Idaho National Engineering Laboratory, DOE/ID-10430(CT).
Francfort, James E., 1995, U.S. Hydropower Resource Assessment for Indiana, Idaho National Engineering Laboratory, DOE/ID-10430(IN).
Francfort, James E., 1995, U.S. Hydropower Resource Assessment for Iowa, Idaho National Engineering Laboratory, DOE/ID-10430(IA).
Francfort, James E., 1993, U.S. Hydropower Resource Assessment for Kansas, Idaho National Engineering Laboratory, DOE/ID-10430(KS).
Francfort, James E., 1993, U.S. Hydropower Resource Assessment for Louisiana, Idaho National Engineering Laboratory, DOE/ID-10430(LA).
Francfort, James E., 1995, U.S. Hydropower Resource Assessment for Maine, Idaho National Engineering Laboratory, DOE/ID-10430(ME).
Francfort, James E., 1995, U.S. Hydropower Resource Assessment for Massachusetts, Idaho National Engineering Laboratory, DOE/ID-10430(MA).
Francfort, James E., 1993, U.S. Hydropower Resource Assessment for Missouri, Idaho National Engineering Laboratory, DOE/ID-10430(MO).
Francfort, James E., 1993, U.S. Hydropower Resource Assessment for Montana, Idaho National Engineering Laboratory, DOE/ID-10430(MT).
Francfort, James E., 1995, U.S. Hydropower Resource Assessment for New Hampshire, Idaho National Engineering Laboratory, DOE/ID-10430(NH).
Francfort, James E., 1993, U.S. Hydropower Resource Assessment for North Dakota, Idaho National Engineering Laboratory, DOE/ID-10430(ND).
Francfort, James E., 1993, U.S. Hydropower Resource Assessment for Oklahoma, Idaho National Engineering Laboratory, DOE/ID-10430(OK).
Francfort, James E., 1995, U.S. Hydropower Resource Assessment for Rhode Island, Idaho National Engineering Laboratory, DOE/ID-10430(RI).
Francfort, James E., 1993, U.S. Hydropower Resource Assessment for South Dakota, Idaho National Engineering Laboratory, DOE/ID-10430(SD).
Francfort, James E., 1993, U.S. Hydropower Resource Assessment for Texas, Idaho National Engineering Laboratory, DOE/ID-10430(TX).
37

Francfort, James E., 1993, U.S. Hydropower Resource Assessment for Utah, Idaho National Engineering Laboratory, DOE/ID-10430(UT).
Francfort, James E., 1993, U.S. Hydropower Resource Assessment for Wyoming, Idaho National Engineering Laboratory, DOE/ID-10430(WY).
Sale, M. J., 1990, Hydropower Resources Study--Environmental Evaluation (Draft), Oak Ridge National Laboratory, Environmental Sciences Division, Oak Ridge, Tennessee.
38

Appendix A Basic Site Data
A-1

A-2
Appendix A Basic Site Data
The INEEL obtained the basic site data for each of the undeveloped sites from FERC's Hydropower Resource Assessment database. The following data fields were copied into HES from the FERC database for each site. The names used are the actual structural names assigned to each field in the database. (Note: “_” is used in dBASE as a separator character.)
PROJNUM. The number assigned to each project by FERC. When a PROJNUM is not assigned for a project, the user is strongly encouraged to provide a pseudo number (see HES User's Manual).
PLANT_NM. Name of the project.
STREAM. Name of the stream where the project is located.
STATE_NM. Name of the state where the project is located.
LAT_U. The latitude of the site.
LONG_U. The longitude of the site.
CLASS_C. The owner class code:
C = Cooperative
F = Federal
I = Industrial
M = Municipal and other nonfederal
P = Private utility
R = Private nonutility.
OWNER_NM. Name of the project owner.
KWRATE_P. The estimated potential nameplate rating (kW) of the project assigned by the Hydropower Resource Assessment database. This is not the current capacity at a developed site. It is the undeveloped capacity at a site or the additional capacity of a site that already has power generation capability.
GEN_AA_P. The potential Average Annual Generation (MWh) of a site estimated by Hydropower Resource Assessment database. This is not the current average annual generation at a developed site but the undeveloped capacity average annual generation at a site or the additional average annual generation of a site that already has power generation capability.
UNITYP_P. Type of unit:
C = Conventional
R = Reversible
A-3
Z = Missing.
PLANTTYP. The project type or type of operation:
CMB = Combined conventional and reversible units
DIV = Gravity diversion (powerhouse on different stream)
PDV = Pumped diversion (one-way pumped storage)
PMP = Pure (recycled) pump storage
RES = Reservoir only
ROR = Run-of-river (dam 10 ft high with minimal storage)
RRG = Reregulating
STG = Storage, conventional (dam > 10 ft high with significant storage)
TID = Tidal conventional hydropower.
STATUS_C. Project status code:
DJ = Disclaimer of FERC jurisdiction
EA = Exemption applied for
FA = Federally authorized
FR = Federally recommended
LE = License exception
LJ = Lack of FERC jurisdiction
MA = FERC major license application
MO = FERC major license outstanding
NA = FERC minor license application
NO = FERC minor license outstanding
PA = FERC preliminary permit application
PO = FERC preliminary permit outstanding
XX = No status
YO = FERC minor part license outstanding
A-4

ZZ = Missing.
BASIN_NM. The river basin where the project is located.
CNTY_NM. The county where the project is located.
Not all of the above 15 variables are present for each site in the Hydropower Resource Assessment database, and the information the database provided was not always accurate. Various state agencies and INEEL personnel reviewed the information in an effort to ensure the accuracy of the site information.
A-5