![Round schedule Notices issued by Ofcom under … · Airspan [REDACTED] EE [REDACTED] H3G [REDACTED] Telefonica [REDACTED] Vodafone [REDACTED] Bidder Eligibility events available (start](https://static.fdocuments.in/doc/165x107/5ba4d8c509d3f257608be093/round-schedule-notices-issued-by-ofcom-under-airspan-redacted-ee-redacted.jpg)
Us fsap stress testing wrap up 03 03-15 - redacted version
18
United States: 2015 Financial Sector Assessment Program Stress Testing (ST): Technical Wrap-up March 5, 2015 This presentation is intended as background for discussions with the U.S. stress testing experts in the context of the U.S. FSAP. The calculations and results included herein have not yet undergone a full internal review and should not be shared outside the technical team involved in the U.S. FSAP.
-
Upload
benjamin-huston -
Category
Data & Analytics
-
view
193 -
download
2
Transcript of Us fsap stress testing wrap up 03 03-15 - redacted version
United States:2015 Financial Sector Assessment Program
Stress Testing (ST): Technical Wrap-up
March 5, 2015
This presentation is intended as background for discussions with the U.S. stress testing experts in the context of the U.S. FSAP. The calculations and results included herein have not yet undergone a full
internal review and should not be shared outside the technical team involved in the U.S. FSAP.
Outline• Banks
– Bank solvency ST (“IMF top-down”)– Bank liquidity risk analysis– Big 6 bank network ST
• Market-price based network analysis and ST (banks and nonbanks)
• Other items covered in the Technical Note– Insurance ST (separate wrap-up)– Mutual fund liquidity risk analysis– Discussion of DFAST results (Fed, company-run)
2
Coverage etc.
3
[REDACTED]
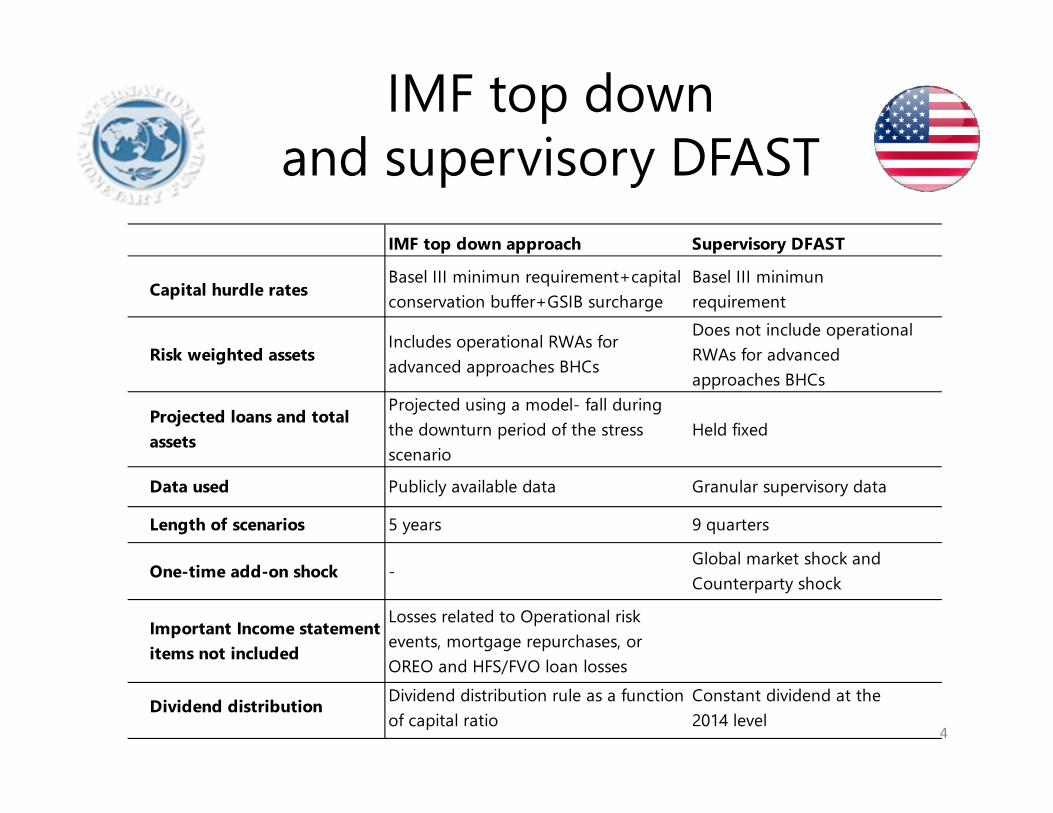
IMF top down and supervisory DFAST
IMF top down approach Supervisory DFAST
Capital hurdle ratesBasel III minimun requirement+capital conservation buffer+GSIB surcharge
Basel III minimun requirement
Risk weighted assetsIncludes operational RWAs for advanced approaches BHCs
Does not include operational RWAs for advanced approaches BHCs
Projected loans and total assets
Projected using a model- fall during the downturn period of the stress scenario
Held fixed
Data used Publicly available data Granular supervisory data
Length of scenarios 5 years 9 quarters
One-time add-on shock -Global market shock and Counterparty shock
Important Income statement items not included
Losses related to Operational risk events, mortgage repurchases, or OREO and HFS/FVO loan losses
Dividend distribution Dividend distribution rule as a function of capital ratio
Constant dividend at the 2014 level
4
IMF solvency stress test
5
[REDACTED]
IMF liquidity risk analysis
6
[REDACTED]
IMF liquidity ST-liquidity metric-
7
[REDACTED]

IMF liquidity ST-liquid assets and outflows-
8
[REDACTED]

“Big 6” network ST
9
[REDACTED]
Big 6 network ST
10
[REDACTED]

Big 6 network ST
11
[REDACTED]
Motivation• Market data: timely and forward‐looking information that can be used to
cross‐check or supplement other stress test findings;• Potentially more comprehensive treatment of direct and indirect linkages.Data • Contingent Claims Analysis (CCA)‐derived default probabilities of 210
institutions (US banks, insurers, NBFIs, asset managers, corporates and foreign banks and insurers).
• Daily data from 2004Q3 to 2014Q3.Models• Used GAMLSS models to explain DP/macro relationship and make
baseline and stress scenario projections (following Pillar II assumptions)
Market‐based network analysis and stress testing
12

Projections
13
[REDACTED]
Projections
14
[REDACTED]

Spillovers
15
[REDACTED]
*Connectivity measure for the U.S. financial system is based on 176 US institutions default probabilities(banks, insurers, asset managers, NBFIs, and corporates)
Connectivity
16
[REDACTED]
Summary of findings
17
[REDACTED]
Recommendations
18
[REDACTED]