U.S. Fish & Wildlife Service Maryland Stream Survey: Bankfull
42
Maryland Stream Survey: Bankfull Discharge and Channel Characteristics of Streams in the Allegheny Plateau and the Valley and Ridge Hydrologic Regions CBFO-S03-01 May 2003 U.S. Fish & Wildlife Service
Transcript of U.S. Fish & Wildlife Service Maryland Stream Survey: Bankfull
Maryland Stream Survey:
Bankfull Discharge and ChannelCharacteristics of Streams in theAllegheny Plateau and the Valleyand Ridge Hydrologic Regions
CBFO-S03-01May 2003
U.S. Fish & Wildlife Service

MARYLAND STREAM SURVEY: BANKFULL DISCHARGE AND CHANNEL CHARACTERISTICS OF STREAMS IN THE ALLEGHENY PLATEAU AND THE VALLEY AND RIDGE HYDROLOGIC REGIONS
By: Tamara L. McCandless
U.S. Fish and Wildlife Service Chesapeake Bay Field Office
CBFO-S03-01
Prepared in cooperation with:
Maryland State Highway Administration and
U.S. Geological Survey
Copies of this report are available at www.fws.gov/r5cbfo
Annapolis, MD 2003

Bankfull discharge and channel characteristics of streams in the AP/ VR hydrologic regions
ii
TABLE OF CONTENTS
EXECUTIVE SUMMARY iii ACKNOWLEDGEMENTS vi LIST OF FIGURES vii LIST OF TABLES viii SYMBOLS AND ABBREVIATIONS viii
INTRODUCTION 1
METHODS 1 Selection of Gage Sites 1
RESULTS AND DISCUSSION Summary of General Site Characteristics 4 Rosgen Stream Types 4 Bankfull Discharge 10
Indicators 10 By Drainage Area 12 Recurrence Interval 17
Cross-section Relationships 19 By Drainage Area 20 By Bankfull Discharge 23
Resistance Relationships 26 Shear Stress 28
CONCLUSIONS 30
APPLICATIONS Use of Regression Relationships for Design Purposes 31
LITERATURE CITED 32
APPENDIX A Site characteristics for selected USGS gage station survey sites in the Allegheny Plateau and Valley and Ridge physiographic provinces

Bankfull discharge and channel characteristics of streams in the AP/ VR hydrologic regions
iii
EXECUTIVE SUMMARY
As public demand increases for restoring the physical, biological, and aesthetic characteristics of degraded rivers, engineers and environmental managers are attempting to design in accordance with the natural tendencies of rivers in flood protection, channel stabilization, stream crossing, channel realignment, and watershed management projects. For these endeavors, designers need basic information to evaluate and predict the dimension, pattern, and profile of natural rivers.
Empirical relationships between dimensions of bankfull channel geometry (i.e., width, mean depth, cross-sectional area) and water discharge or drainage area have long been found useful as a first step in stream assessment and development of preliminary design concepts. The applicability of the derived predictive equations is limited to rivers similar to those providing the data. Thus, empirical relationships for channel geometry are applicable only for rivers in specific hydro-physiographic regions with relatively homogeneous climate, geology, and vegetation.
This report is the second in a series examining the relationship of stream dimensions versus drainage areas for several physiographic provinces within Maryland. The Maryland Stream Survey is a cooperative effort between the U.S. Department of Interior, Fish and Wildlife Service (Service), Maryland State Highway Administration (SHA), and the U.S. Geological Survey (USGS) with the short-term goal to determine appropriate relationships of stream characteristics on a statewide basis. The long-term goal is to provide the SHA and others with background information on stream geometry that may be used in developing hydraulic designs for culverts and small bridges that maintain, as much as possible, the natural bankfull channel dimensions.
For this report, we surveyed gaged streams in the Allegheny Plateau and the Valley and Ridge hydro-physiographic provinces to examine for relationships between: 1) Drainage area and bankfull discharge (the discharge that fills the active channel to bankfull
stage),2) Drainage area and bankfull stream dimensions (active channel dimensions at bankfull stage), 3) Bankfull discharge and stream dimensions, and 4) Relative roughness and total channel hydraulic resistance.
We also classified each reach according to the Rosgen classification system for natural rivers and considered the utility of the classification system in the development of explanations for the observed trends in the above relationships.
The database of stream characteristics will serve as a source of information on basic channel characteristics at the time of the surveys, for anyone involved with work affecting bankfull discharge and channel characteristics of streams in the Allegheny Plateau/Valley and Ridge (AP/VR) hydrologic region streams. The analyses from the stream surveys will provide regional channel geometry relationships useful for watershed management, emergency watershed protection, and other stream restoration and protection efforts.

Bankfull discharge and channel characteristics of streams in the AP/ VR hydrologic regions
iv
FINDINGS Bankfull DischargeBankfull discharge is significantly related to drainage area, with 99 percent of the variability in discharge explained by drainage area. Bankfull IndicatorsPhysical features of streams may indicate certain discharge events, most notably the bankfull discharge. Bankfull indicators include geomorphic features developed by the channel as well as distribution limits for vegetation. We found several indicators of bankfull stage in the AP/VR streams, and observed that the floodplain break was the dominant indicator associated with the bankfull discharge. Bankfull Discharge Recurrence IntervalThe recurrence intervals for the bankfull discharge associated with the dominant indicators range from 1.05 - 1.8 years, and average 1.48 years. Cross-section Relationships by Drainage AreaWidth, mean depth, and cross-sectional area are all significantly related to drainage area and bankfull discharge. Of the three parameters, cross-sectional area has the greatest percent of the variability in size explained by drainage area, followed by depth and width. Resistance RelationshipsThere is a negative but significant relationship between relative roughness (R/D84), and resistance expressed as Manning's "n". Rosgen ClassificationThe results of this survey support the applicability of the Rosgen classification system to AP/VR streams. However, the limited number of stream types observed prevents the examination of stream type to explain some of the observed variability in stream characteristics in this region.
CONCLUSIONS Allegheny Plateau/Valley and Ridge streams can be classified using the Rosgen stream classification system.
There is a well-defined relationship between drainage area and bankfull discharge in the main AP/VR region.
The AP/VR drainage area and bankfull discharge relationship is significantly different from the MD Piedmont region.
There are well-defined relationships for AP/VR streams between drainage area and bankfull channel dimensions.
The AP/VR streams have less bankfull cross-sectional area and less mean bankfull depth per unit drainage area than MD Piedmont streams.
The AP/VR streams have significantly higher width/depth ratios compared with the MD Piedmont streams.
Variability in the average flow resistance in the AP/VR as represented by the Manning “n” is fairly well explained by variability in relative roughness, expressed as R/D84.

Bankfull discharge and channel characteristics of streams in the AP/ VR hydrologic regions
v
APPLICATIONS Use of Regression Relationships for Design PurposesSeveral caveats exist for these relationships, and argue strongly against their use for detailed design specifications.
Relationships are representative of a restricted range of basin and reach characteristics (e.g., drainage area, geology, land use, etc.) and must be used with caution when applying to streams across the Allegheny Plateau/Valley and Ridge.
While we do not consider any of the reaches represented here to be in a state of rapid adjustment, we have no information about the relative rates of lateral or down-valley meander migration.
Relationships are not necessarily representative of “reference reach conditions”. These relationships provide no information about ecological parameters, and may not represent “good” habitat conditions.
The range of Rosgen stream types represented by the data is low, with the majority represented as C and B streams.
Given these caveats, the relationships presented here are recommended for use in stream assessments and are particularly useful in planning studies. The information can provide preliminary conceptual design parameters for streams with a similar range of discharge, sediment, slope, and entrenchment conditions. However, channel designers need to identify discrete project goals and objectives, with respect to both physical and biological desired conditions, and determine the appropriate design parameters for achieving those conditions. Additional field information is needed to determine appropriate design values for shear stress, critical shear stress and sediment transport relationships. In most cases the best guidance for finer scale aspects of channel design will come from carefully selected reference reaches that closely match the controlling conditions at the project reach, and exhibit those characteristics specifically identified as design objectives. The results of this study may best serve as a guide to the expected range of dimensions for bankfull channels at ungaged reaches.
Bankfull discharge and channel characteristics of streams in the AP/ VR hydrologic regions
vi
ACKNOWLEDGEMENTS The Maryland Stream Survey is a cooperative effort between the U.S. Department of Interior, Fish and Wildlife Service (Service), Maryland State Highway Administration (SHA), and the U.S. Geological Survey (USGS). Many people contributed to the effort represented by this report, however any errors are strictly the responsibility of the author. This survey and report would not be possible without the work of the Service’s Stream Habitat Assessment and Restoration Program personnel who spent many hours in all weather conditions surveying streams in the Allegheny Plateau and Valley and Ridge rivers, particularly Christopher Eng, Raymond Li, Mark Secrist, and Richard Starr. Eng and Secrist contributed greatly to the development of survey information, processing field data, and produced all plan view maps. The Service, Environmental Protection Agency, USGS, Federal Highway Administration, and SHA provided funding for this work.
Advisory Panel The Service and SHA have obtained the cooperation of the state and federal agencies involved in the review of stream projects through a formal Partnering Agreement and formation of a Maryland Stream Survey Advisory Panel. It is important that all interested agencies agree to the approach and objectives of the survey. The agencies agreed that, upon review and acceptance by the Advisory Panel, the information would provide a useful tool for evaluating the effects of proposed projects in channel, wetlands, and flood plains.
Maryland Department of the Environment, Water Management Administration Maryland Department of Natural Resources, Chesapeake and Coastal Watershed Service Maryland State Highway Administration Natural Resources Conservation ServiceU.S. Army Corps of Engineers, Baltimore District, Regulatory Branch U.S. Federal Highway Administration, Maryland Division U.S. Fish and Wildlife Service, Chesapeake Bay Field Office U.S. Forest Service

Bankfull discharge and channel characteristics of streams in the AP/ VR hydrologic regions
vii
LIST OF FIGURES
1. Approximate survey site locations (represented as closed circles) in the Allegheny Plateau and Valley and Ridge hydro-physiographic provinces.
2. AP/VR survey sites compared with Rosgen classification criteria (Rosgen 1996). 3. AP/VR meander width ratios compared to Rosgen stream types (Rosgen 1996). 4. AP/VR compared with Maryland Piedmont average values of Rosgen stream type delineative criteria (Rosgen 1996). 5. Typical bankfull indicators. 6. Percent of sites exhibiting primary bankfull indicators. 7. Percent of sites exhibiting geomorphic indicators of bankfull stage. 8. Bankfull discharge as a function of drainage area for AP/VR survey sites. 9. Two-year recurrence interval discharge as a function of drainage area, partitioned by AP/VR survey sites. 10. Comparison of bankfull discharge as a function of drainage area partitioned by AP/VR and
Maryland Piedmont survey sites. 11. Frequency of recurrence interval for field-estimated bankfull discharge. 12. Drainage area versus discharge: AP/VR field-determined bankfull and Bulletin 17-B 1.5-year
recurrence interval. 13. Bankfull channel dimensions as a function of drainage area for AP/VR survey sites (n = 14).14. Comparison of AP/VR with Maryland Piedmont survey sites for bankfull cross-sectional area by drainage area. 15. Comparison of AP/VR with Maryland Piedmont survey sites for bankfull mean depth by drainage area. 16. Comparison of AP/VR with Maryland Piedmont survey sites for bankfull width/depth ratio by drainage area. 17. Bankfull channel dimensions as a function of bankfull discharge for AP/VR survey sites (n =
14).18. Comparison of AP/VR with Maryland Piedmont survey sites for bankfull cross-sectional area by bankfull discharge. 19. Comparison of AP/VR with Maryland Piedmont survey sites for bankfull width/depth ratio by bankfull discharge. 20. Manning’s “n” as a function of relative roughness (R/D84) for AP/VR survey sites. 21. Resistance as a function of relative roughness. AP/VR survey sites compared with Limerinos
(1970). Samples outside range of Limerinos are labeled as solid triangles and not included in regression analysis.
22. Comparison of estimated average boundary shear stress and median particle size for the AP/VR and Maryland Piedmont (McCandless and Everett 2002) survey sites.

Bankfull discharge and channel characteristics of streams in the AP/ VR hydrologic regions
viii
LIST OF TABLES
1. USGS Gage Stations. 2. Summary of location and basin characteristics for study reaches. 3. Allegheny Plateau/Valley and Ridge survey sites – Rosgen stream classification delineative
values.4. Summary data for AP/VR and Maryland Piedmont study sites. 5. Bankfull discharge versus drainage area. 6. Comparison of bankfull discharge to drainage area relationships for the AP/VR and other nearby regions. 7. Cross-section dimensions vs. drainage area regression equations. 8. Cross-section dimensions vs. bankfull discharge. 9. Comparison of relationships between bankfull discharge and channel dimensions. 10. Flow resistance as a function of relative roughness.
SYMBOLS AND ABBREVIATIONS
Symbol Definition AP Allegheny Plateau cfs Cubic feet per second d Mean bankfull depth D50 Median particle size D84 Particle size at which 84 percent of sample is smaller DA Drainage area g Gravitational acceleration MWR Meander width ratio “n” Manning’s roughness coefficient p Probability Qbkf Bankfull discharge R Hydraulic radius RI Riffle interval s Second S Slope sd Standard deviation VR Valley and Ridge XS-Area Bankfull cross-sectional area W Bankfull width Wblt Beltwidth
s Density of particle w Density of water cr Critical shear stress o Average boundary shear stress c Dimensionless shear stress

Bankfull discharge and channel characteristics of streams in the AP/VR hydrologic region
1
INTRODUCTIONThis report is the second in a series examining the relationship of stream dimensions versus drainage areas for several physiographic provinces within Maryland. The Maryland Stream Survey is a cooperative effort between the U.S. Department of Interior, Fish and Wildlife Service (Service), Maryland State Highway Administration (SHA), and the U.S. Geological Survey (USGS) with the short-term goal to determine appropriate relationships of stream characteristics on a statewide basis. The long-term goal is to provide the SHA and others with the information needed to develop hydraulic designs for culverts and small bridges that maintain, as much as possible, the natural bankfull channel dimensions.
For this report, we surveyed gaged streams in the Allegheny Plateau and the Valley and Ridge hydro-physiographic provinces to examine for relationships between: 1. Drainage area and bankfull discharge (the discharge that fills the active channel to bankfull
stage),2. Drainage area and bankfull stream dimensions (active channel dimensions at bankfull stage), 3. Bankfull discharge and stream dimensions, and 4. Relative roughness and total channel hydraulic resistance.
We also classified each reach according to the Rosgen classification system for natural rivers and considered the utility of the classification system in the development of explanations for the observed trends in the above relationships.
METHODSDetailed discussions on site selection, analysis of gage records, bankfull definition and indicators, and data analysis are provided in the first report of the Maryland Stream Survey: Bankfull Discharge and Channel Characteristics in the Piedmont Hydrologic Region (McCandless and Everett 2002). Appendix B, Protocols for Field Surveys at Gage Stations, in the aforementioned report, provides detailed field survey methods used to collect data for these studies. The regional relationships are developed using multiple basins in the same physiographic region. The continuity equation (Q = XS-Area * u) is used to estimate velocity. The regional relationships are presented here using simple power functions and do not include information on additional boundary conditions which may influence and maintain stream shape, such as, sediment discharge, basin relief, and vegetation.
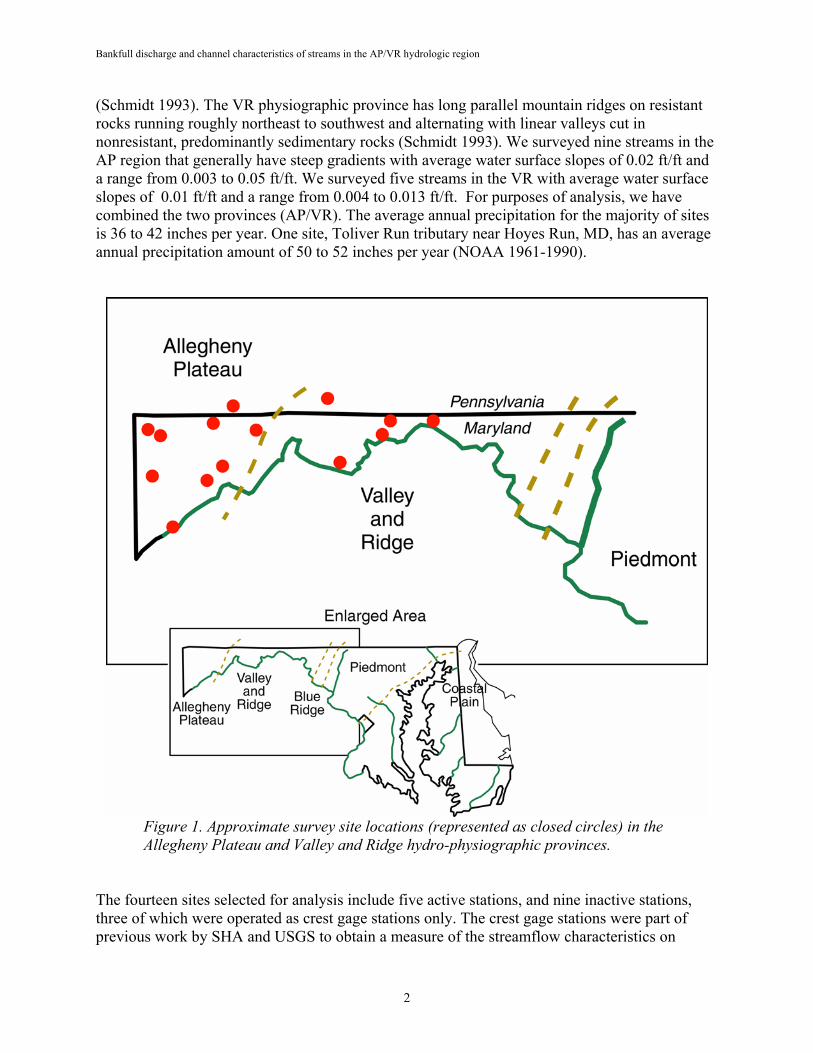
Selection of Gage SitesWe surveyed fourteen gage sites in the network of stations operated by the Maryland-Delaware-D.C. District of the USGS in the Allegheny Plateau (AP) and Valley and Ridge (VR) physiographic provinces (Figure 1). The westernmost site was Youghiogheny River tributary near Friendsville, MD, and the easternmost site was Ditch Run near Hancock, MD. The survey did not extend across the Great Valley or into the Blue Ridge. The results presented here would require verification at USGS gage stations in the Great Valley and Blue Ridge prior to use in those regions.
The Allegheny Plateau is the western-most province in Maryland with a high plateau and deep stream valleys and some ridges of resistant rock. The predominant rock type is sedimentary
Bankfull discharge and channel characteristics of streams in the AP/VR hydrologic region
2
(Schmidt 1993). The VR physiographic province has long parallel mountain ridges on resistant rocks running roughly northeast to southwest and alternating with linear valleys cut in nonresistant, predominantly sedimentary rocks (Schmidt 1993). We surveyed nine streams in the AP region that generally have steep gradients with average water surface slopes of 0.02 ft/ft and a range from 0.003 to 0.05 ft/ft. We surveyed five streams in the VR with average water surface slopes of 0.01 ft/ft and a range from 0.004 to 0.013 ft/ft. For purposes of analysis, we have combined the two provinces (AP/VR). The average annual precipitation for the majority of sites is 36 to 42 inches per year. One site, Toliver Run tributary near Hoyes Run, MD, has an average annual precipitation amount of 50 to 52 inches per year (NOAA 1961-1990).
Figure 1. Approximate survey site locations (represented as closed circles) in the Allegheny Plateau and Valley and Ridge hydro-physiographic provinces.
The fourteen sites selected for analysis include five active stations, and nine inactive stations, three of which were operated as crest gage stations only. The crest gage stations were part of previous work by SHA and USGS to obtain a measure of the streamflow characteristics on
Bankfull discharge and channel characteristics of streams in the AP/VR hydrologic region
3
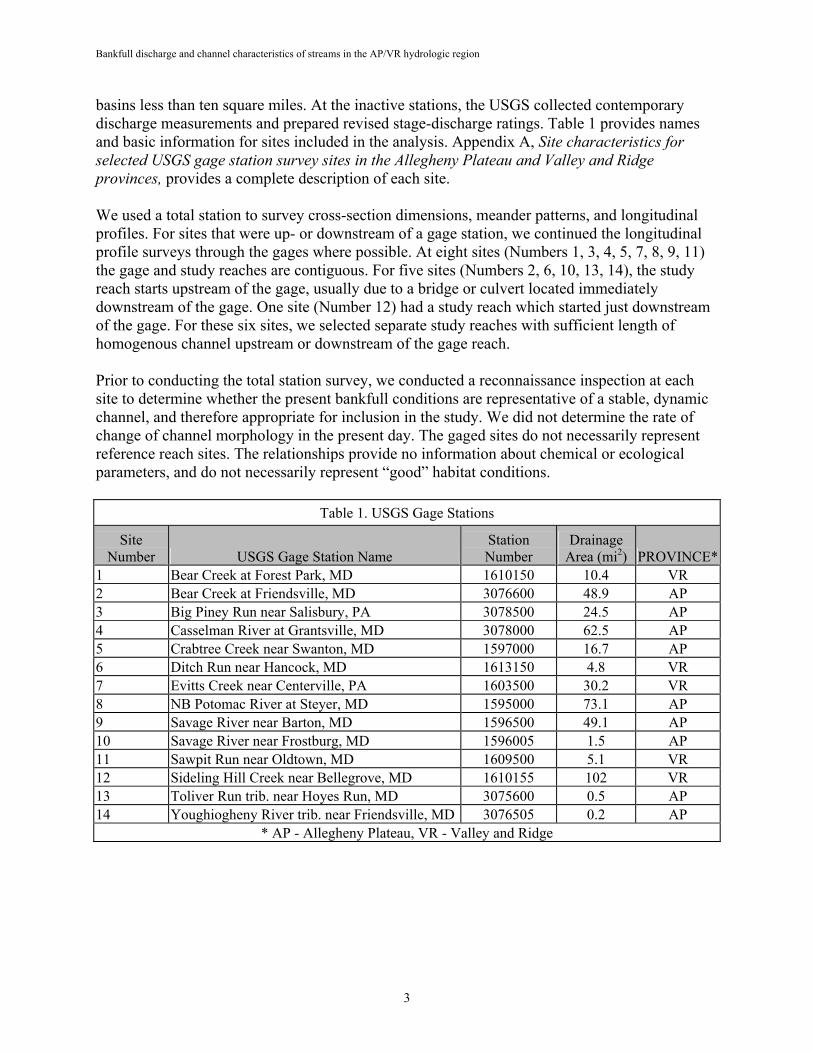
basins less than ten square miles. At the inactive stations, the USGS collected contemporary discharge measurements and prepared revised stage-discharge ratings. Table 1 provides names and basic information for sites included in the analysis. Appendix A, Site characteristics for selected USGS gage station survey sites in the Allegheny Plateau and Valley and Ridge provinces, provides a complete description of each site.
We used a total station to survey cross-section dimensions, meander patterns, and longitudinal profiles. For sites that were up- or downstream of a gage station, we continued the longitudinal profile surveys through the gages where possible. At eight sites (Numbers 1, 3, 4, 5, 7, 8, 9, 11) the gage and study reaches are contiguous. For five sites (Numbers 2, 6, 10, 13, 14), the study reach starts upstream of the gage, usually due to a bridge or culvert located immediately downstream of the gage. One site (Number 12) had a study reach which started just downstream of the gage. For these six sites, we selected separate study reaches with sufficient length of homogenous channel upstream or downstream of the gage reach.
Prior to conducting the total station survey, we conducted a reconnaissance inspection at each site to determine whether the present bankfull conditions are representative of a stable, dynamic channel, and therefore appropriate for inclusion in the study. We did not determine the rate of change of channel morphology in the present day. The gaged sites do not necessarily represent reference reach sites. The relationships provide no information about chemical or ecological parameters, and do not necessarily represent “good” habitat conditions.
Table 1. USGS Gage Stations
SiteNumber USGS Gage Station Name
StationNumber
DrainageArea (mi2) PROVINCE*
1 Bear Creek at Forest Park, MD 1610150 10.4 VR2 Bear Creek at Friendsville, MD 3076600 48.9 AP3 Big Piney Run near Salisbury, PA 3078500 24.5 AP4 Casselman River at Grantsville, MD 3078000 62.5 AP5 Crabtree Creek near Swanton, MD 1597000 16.7 AP6 Ditch Run near Hancock, MD 1613150 4.8 VR7 Evitts Creek near Centerville, PA 1603500 30.2 VR8 NB Potomac River at Steyer, MD 1595000 73.1 AP9 Savage River near Barton, MD 1596500 49.1 AP10 Savage River near Frostburg, MD 1596005 1.5 AP11 Sawpit Run near Oldtown, MD 1609500 5.1 VR12 Sideling Hill Creek near Bellegrove, MD 1610155 102 VR13 Toliver Run trib. near Hoyes Run, MD 3075600 0.5 AP14 Youghiogheny River trib. near Friendsville, MD 3076505 0.2 AP
* AP - Allegheny Plateau, VR - Valley and Ridge

Bankfull discharge and channel characteristics of streams in the AP/VR hydrologic region
4
RESULTS AND DISCUSSION Summary of General Site CharacteristicsDetailed summaries of surveyed characteristics for each study reach are in Appendix A. The fourteen study reaches are located throughout the Allegheny Plateau and Valley and Ridge hydro-physiographic provinces with all but two sites located in Maryland (Figure 1). Drainage basin sizes range from 0.22 mi2 - 102 mi2 (Table 1). The sites are located in four major river basins and five counties. Shreve stream magnitudes (1967) range from 1 - 121, and the percent imperviousness of the watersheds draining to the study reaches range from 0 - 1.7 (Table 2).
Table 2. Summary of site location and basin characteristics for study reaches.
River Basin No.Sites County
No.Sites
DrainageArea(mi2)
No.Sites
PercentImpervious
No.Sites
ShreveMag.
No.Sites
Monongahela 3 Allegany, MD 1 <10 5 0 - 1.7 10 0 - 20 7 N. Branch of the Potomac 1 Bedford, PA 1 10 - 40 4
Notavailable 4 20 - 40 3
Potomac 9 Garrett, MD 8 40 - 60 2 40 - 60 3 Ohio 1 Somerset, PA 1 60 - 90 2 60 - 121 1
Washington, MD 3 90 - 102 1
Past channelization or realignment may have altered many gage reaches at road crossings. We took precautions to survey the study reach and cross-section measurement locations away from the influence of these structures. While we do not consider any of the represented survey sites in a state of rapid adjustment, we have no information about the relative rates of vertical or lateral change.
Rosgen Stream TypesOne of the principle objectives of the survey required using the Rosgen stream classification system to classify the streams (Rosgen 1994). This system uses measured physical process-based attributes to delineate streams. We classified each reach according to the Rosgen classification system and examined the utility of the classification for explaining the observed variability in the regional relationships.
The survey sites partition into three Rosgen Level I type streams (Table 3). There are six C, six B, and two F type streams. The bed material, characterized using a modified Wolman pebble count, consists of bedrock, cobble, and gravel and combinations thereof. Eight (57 percent) sites had some bedrock present in the study reach. Seven (50 percent) had non-uniform reach-average pebble count distributions. In the case of non-uniform distributions, Rosgen (1996) recommends using the dominant size class sampled, rather than the reach average D50 , for classification. For the seven sites with non-uniform distributions, we used the dominant size class sampled or the D50 from the riffle sample for classification. Further information is provided for each site in Appendix A, Site characteristics for selected USGS gage station survey sites in the Allegheny Plateau/Valley and Ridge physiographic provinces.
Rosgen C type streams in the AP/VR have lower average entrenchment and width/depth values than the average values reported by Rosgen, with no overlap in entrenchment ranges for C4 type
Bankfull discharge and channel characteristics of streams in the AP/VR hydrologic region
5
streams (Figure 2). The B type streams, on the other hand, have similar average entrenchment with the B3 type streams having higher average width/depth values than the same stream types in Rosgen’s data set (Figure 2). The F3 AP/VR type streams had a similar entrenchment value but lower average width/depth ratio than that reported by Rosgen, although still within the range of reported values. With the exception of the F3 stream, all other stream types in the AP/VR had sinuosities within the range reported by Rosgen although the C streams tend to have lower averages than those reported for Rosgen. With the exception of the B3 type streams, all other stream types in the AP/VR have higher average slopes than averages reported by Rosgen (Figure 2).
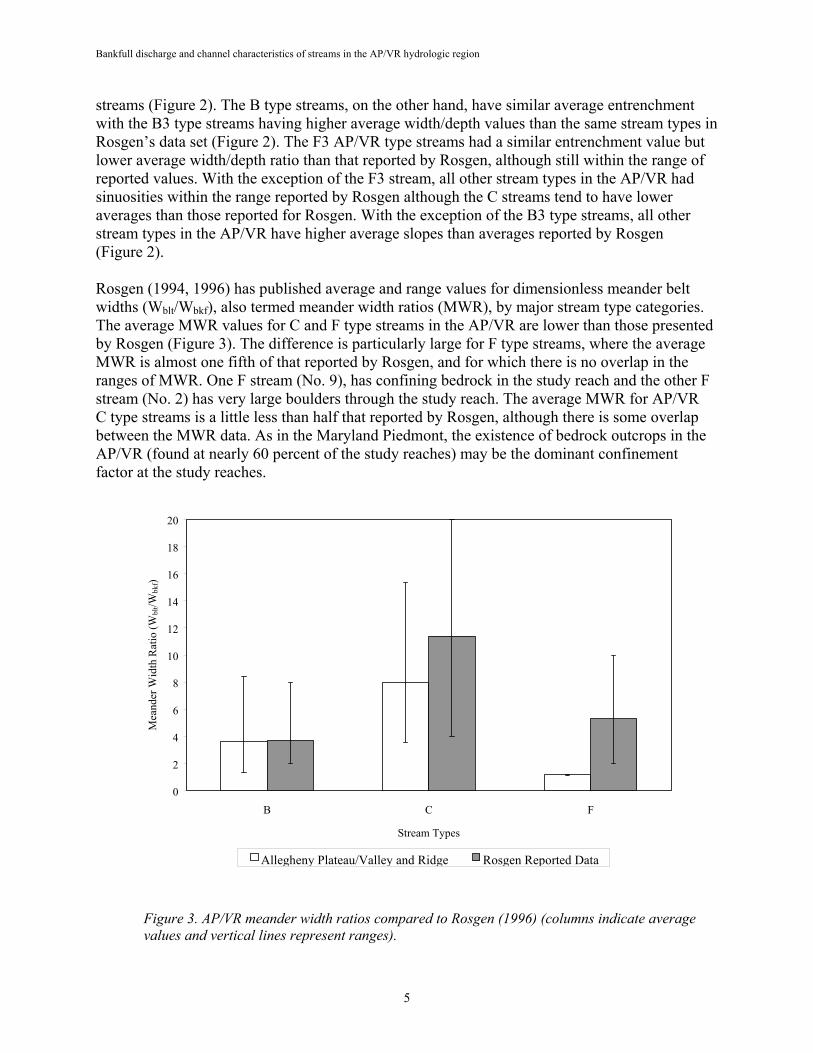
Rosgen (1994, 1996) has published average and range values for dimensionless meander belt widths (Wblt/Wbkf), also termed meander width ratios (MWR), by major stream type categories. The average MWR values for C and F type streams in the AP/VR are lower than those presented by Rosgen (Figure 3). The difference is particularly large for F type streams, where the average MWR is almost one fifth of that reported by Rosgen, and for which there is no overlap in the ranges of MWR. One F stream (No. 9), has confining bedrock in the study reach and the other F stream (No. 2) has very large boulders through the study reach. The average MWR for AP/VR C type streams is a little less than half that reported by Rosgen, although there is some overlap between the MWR data. As in the Maryland Piedmont, the existence of bedrock outcrops in the AP/VR (found at nearly 60 percent of the study reaches) may be the dominant confinement factor at the study reaches.
Figure 3. AP/VR meander width ratios compared to Rosgen (1996) (columns indicate average values and vertical lines represent ranges).
0
2
4
6
8
10
12
14
16
18
20
B C F
Stream Types
Mea
nder
Wid
th R
atio
(Wbl
t/Wbk
f)
Allegheny Plateau/Valley and Ridge Rosgen Reported Data
Bankfull discharge and channel characteristics of streams in the AP/VR hydrologic region
6
DiscussionLike the Maryland Piedmont, all the streams we surveyed classified to a specific Rosgen type stream, supporting the applicability of the Rosgen stream classification system in the AP/VR region. Because the majority of sites surveyed were C and B type streams, there were insufficient numbers of different type streams to allow examination of regional relationships partitioned by major Rosgen stream types. The streams ranged from entrenched to slightly entrenched and all the streams had moderate to high width/depth ratios. The entrenchment values distinguish the major type streams despite the low degree of variability in width/depth ratios.
Comparing AP/VR with Maryland Piedmont While the number of stream types surveyed in each physiographic region does not allow for a statistical comparison, an examination of the data provides some general information (Figure 4). Entrenchment ratios are lower (indicating greater entrenchment) for C type streams in the AP/VR (n = 6) compared to the Maryland Piedmont (n = 19) whereas width/depth ratios are higher. As expected, the slopes at the mountainous AP/VR survey sites are steeper compared to the streams in the foothills of the Maryland Piedmont. The lower entrenchment ratios and steeper slopes at the AP/VR streams is indicative of the steeper more confined landscape compared to the majority of Piedmont streams found in broader valleys with less slope.
Sinuosity appears slightly higher in the AP/VR survey sites than in the Maryland Piedmont. Two factors may influence this: most lowland streams have suffered from some type of alteration in the past, and/or this may be an artifact of slightly different measurement methods between the AP/VR and the Maryland Piedmont survey sites. We measured the Maryland Piedmont sinuosities on plan view maps derived from total station surveys over reach lengths of 20 - 40 bankfull widths, per Rosgen (1996). For six (43 percent) of the AP/VR sites, we extended the length of stream for the sinuosity measurement beyond the 20 - 40 widths using aerial photos. In the field, we found that parameters of the Rosgen classification system (entrenchment, width/depth, etc.) often change beyond the study reach, suggesting that measurements of planform characteristics from aerial photographs may include different stream types. The 20 - 40 bankfull-widths may be too short to examine planform characteristics such as sinuosity. A comparison of the study reach sinuosities from total station surveys over 20 - 40 widths with the stream sinuosities taken from aerial photographs of longer but encompassing reaches would be helpful in examining relationships between reach and overall stream pattern. The results would require field validation of stream types within the aerial photographed reaches.

Bankfull discharge and channel characteristics of streams in the AP/VR hydrologic region
7
Table 3. Allegheny Plateau/Valley and Ridge survey sites – Rosgen stream classification delineative values.
USGS Gage Site Entrenchment
RatioWidth/Depth
Ratio SinuosityWater Surface
SlopeMeander Width
RatioD50
(mm)Reach Average
ParticleRosgen
Stream Type
Bear Creek at Forest Park, MD 2.3 15.6 1.8 0.013 4.0 44 very coarse gravel C4/1
Bear Creek at Friendsville, MD 1.2 23.0 1.2 0.021 1.2 152 large cobble F3/1 Big Piney Run near Salisbury, PA 2.2 23.0 1.6 0.004 15.4 119 small cobble C3/1 Casselman River at Grantsville, MD 2.1 39.3 1.4 0.004 3.5 86 small cobble B3c Crabtree Creek near Swanton, MD 1.7 17.8 1.1 0.028 2.7 113 small cobble B3/1 Ditch Run near Hancock, MD 2.7 17.1 1.4 0.011 12.8 22 coarse gravel C4 Evitts Creek near Centerville, PA 5.5 18.6 1.2 0.006 6.1 114 small cobble C1 NB Potomac River at Steyer, MD 2.7 22.4 1.2 0.003 3.6 84 small cobble C3 Savage River near Barton, MD 1.1 22.2 1.5 0.003 1.1 222 large cobble F1 Savage River near Frostburg, MD 2.9 12.5 1.2 0.013 6.0 111 small cobble C3 Sawpit Run near Oldtown, MD 1.7 30.1 1.2 0.012 2.4 n/a bedrock B1c Sideling Hill Creek near Bellegrove, MD 1.6 23.9 1.9 0.004 1.3 51
very coarse gravel B4/1c
Toliver Run Trib. near Hoyes Run, MD 1.6 12.8 1.1 0.023 3.6 2 very fine gravel B4 Youghiogheny River Trib. near Friendsville, MD 2.0 13.0 1.3 0.047 8.4 29 coarse gravel B4

Bankfull discharge and channel characteristics of streams in the AP/VR hydrologic region
8
Figure 2. AP/VR survey sites compared with Rosgen classification criteria (columns represent average values and vertical lines represent range of values) (Rosgen 1996).
� Allegheny Plateau/Valley and Ridge Sites Rosgen Data** AP/VR sites are B3c & B3/1. ‡ AP/VR sites are C4 & C4/1. *** AP/VR sites are B4 & B4/1c. " AP/VR sites are F3/1. † AP/VR sites are C3 & C3/1. * No Rosgen B1, C1 or F1 data available.
A. Entrenchment
0
1
2
3
4
5
6
7
8
B1* B3** B4*** C1* C3† C4‡ F1* F3"
Rosgen Stream Types
Entre
nchm
ent
B. Width/Depth
0
10
20
30
40
B1* B3** B4*** C1* C3† C4‡ F1* F3"
Rosgen Stream Types
Wid
th/D
epth
C. Sinuosity
0
1
2
3
B1* B3** B4*** C1* C3† C4‡ F1* F3"
Rosgen Stream Types
Sinu
osity
D. Slope
0.0010
0.0060
0.0110
0.0160
0.0210
0.0260
B1* B3** B4*** C1* C3† C4‡ F1* F3"
Rosgen Stream Types
Slop
e

Bankfull discharge and channel characteristics of streams in the AP/VR hydrologic region
9
Figure 4. AP/VR compared with Maryland Piedmont average values of Rosgen stream type delineative criteria (Rosgen 1996)(columns represent average values).
� AP/VR Maryland Piedmont
0
2
4
6
8
10
12
14
16
18
20
B C E F
Rosgen Stream Types
Entre
nchm
ent
0
5
10
15
20
25
30
B C E F
Rosgen Stream Types
Wid
th/D
epth
0
1
2
B C E F
Rosgen Stream Types
Sinu
osity
0.000
0.005
0.010
0.015
0.020
0.025
B C E F
Rosgen Stream Types
Slop
e
Bankfull discharge and channel characteristics of streams in the AP/VR hydrologic region
10
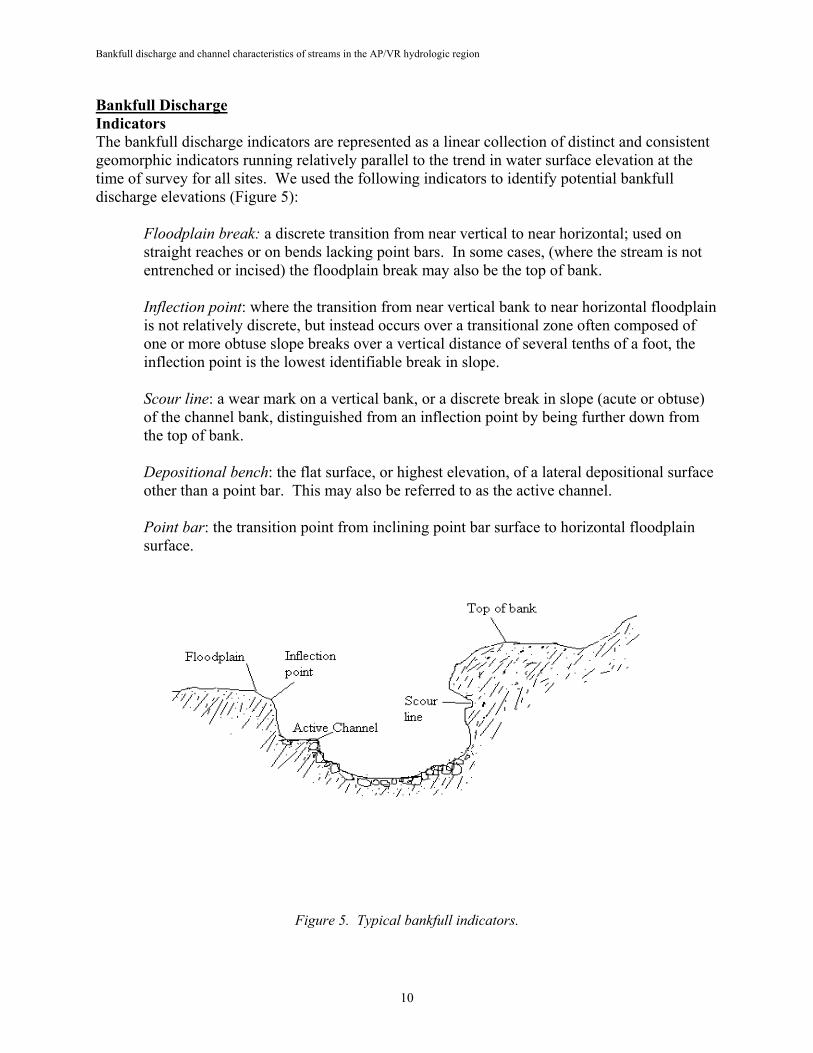
Bankfull DischargeIndicatorsThe bankfull discharge indicators are represented as a linear collection of distinct and consistent geomorphic indicators running relatively parallel to the trend in water surface elevation at the time of survey for all sites. We used the following indicators to identify potential bankfull discharge elevations (Figure 5):
Floodplain break: a discrete transition from near vertical to near horizontal; used on straight reaches or on bends lacking point bars. In some cases, (where the stream is not entrenched or incised) the floodplain break may also be the top of bank.
Inflection point: where the transition from near vertical bank to near horizontal floodplain is not relatively discrete, but instead occurs over a transitional zone often composed of one or more obtuse slope breaks over a vertical distance of several tenths of a foot, the inflection point is the lowest identifiable break in slope.
Scour line: a wear mark on a vertical bank, or a discrete break in slope (acute or obtuse) of the channel bank, distinguished from an inflection point by being further down from the top of bank.
Depositional bench: the flat surface, or highest elevation, of a lateral depositional surface other than a point bar. This may also be referred to as the active channel.
Point bar: the transition point from inclining point bar surface to horizontal floodplain surface.
Figure 5. Typical bankfull indicators.
Bankfull discharge and channel characteristics of streams in the AP/VR hydrologic region
11
For a detailed discussion on bankfull indicators, refer to the report Maryland Stream Survey: Bankfull Discharge and Channel Characteristics in the Piedmont Hydrologic Region(McCandless and Everett 2002).
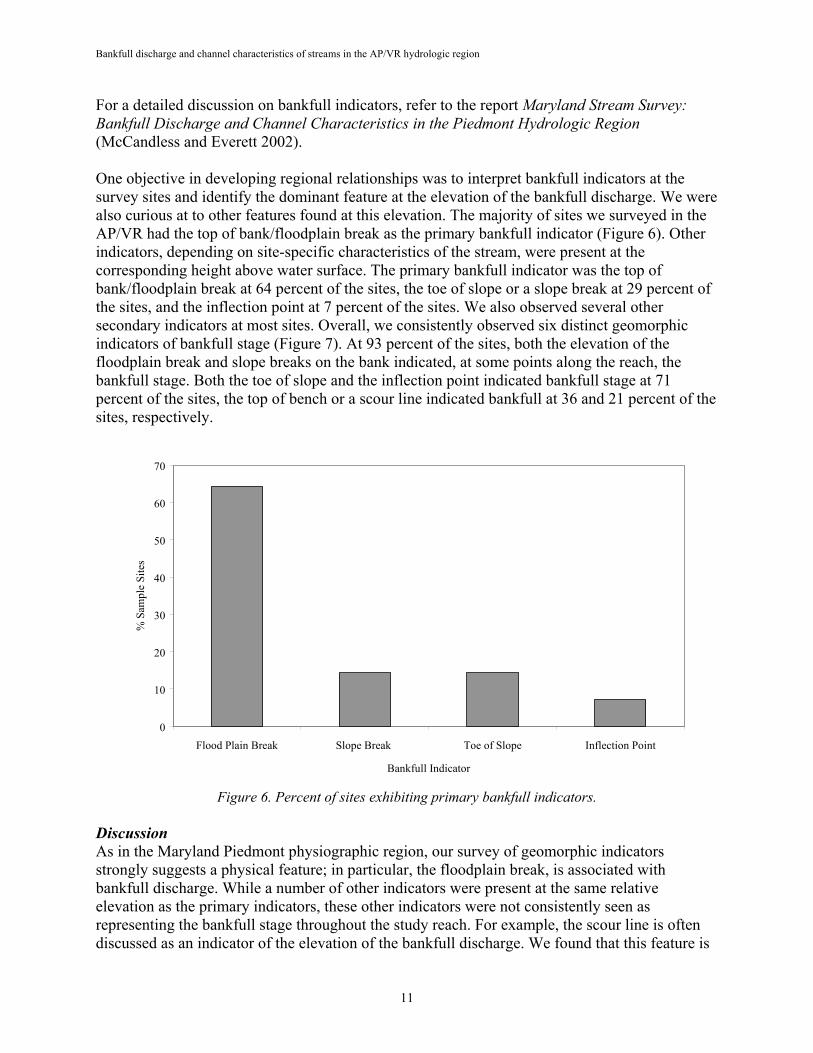
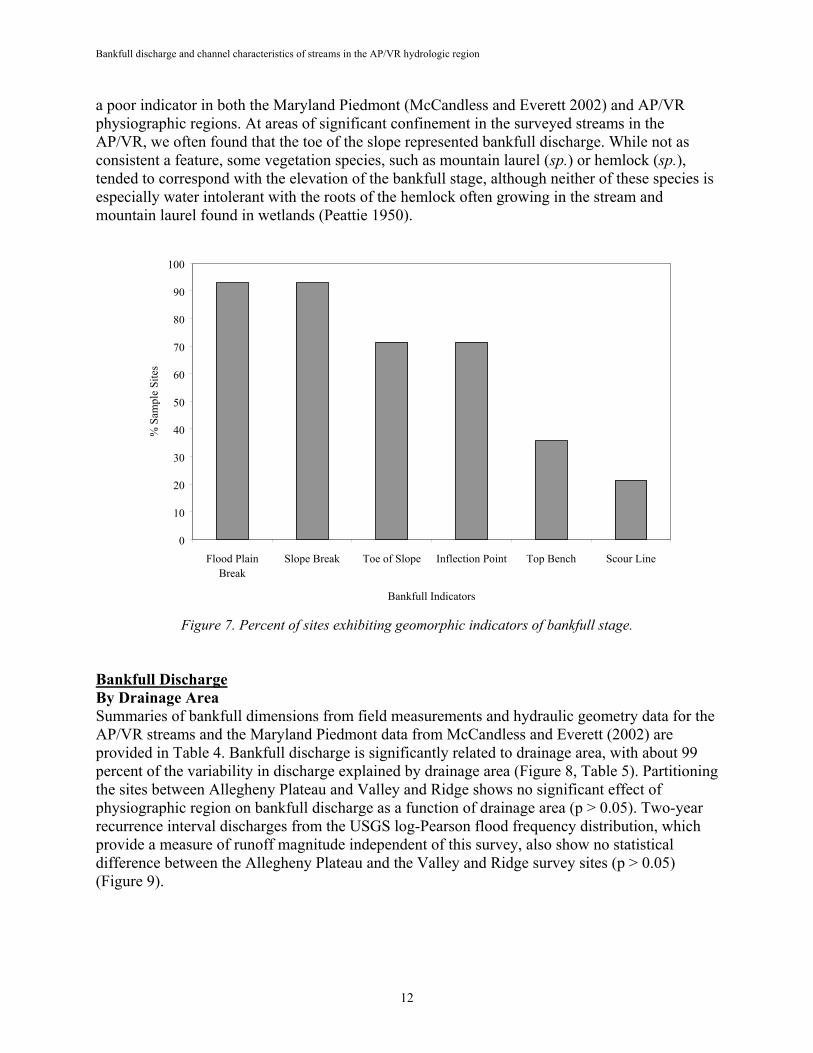
One objective in developing regional relationships was to interpret bankfull indicators at the survey sites and identify the dominant feature at the elevation of the bankfull discharge. We were also curious at to other features found at this elevation. The majority of sites we surveyed in the AP/VR had the top of bank/floodplain break as the primary bankfull indicator (Figure 6). Other indicators, depending on site-specific characteristics of the stream, were present at the corresponding height above water surface. The primary bankfull indicator was the top of bank/floodplain break at 64 percent of the sites, the toe of slope or a slope break at 29 percent of the sites, and the inflection point at 7 percent of the sites. We also observed several other secondary indicators at most sites. Overall, we consistently observed six distinct geomorphic indicators of bankfull stage (Figure 7). At 93 percent of the sites, both the elevation of the floodplain break and slope breaks on the bank indicated, at some points along the reach, the bankfull stage. Both the toe of slope and the inflection point indicated bankfull stage at 71 percent of the sites, the top of bench or a scour line indicated bankfull at 36 and 21 percent of the sites, respectively.
Figure 6. Percent of sites exhibiting primary bankfull indicators.
DiscussionAs in the Maryland Piedmont physiographic region, our survey of geomorphic indicators strongly suggests a physical feature; in particular, the floodplain break, is associated with bankfull discharge. While a number of other indicators were present at the same relative elevation as the primary indicators, these other indicators were not consistently seen as representing the bankfull stage throughout the study reach. For example, the scour line is often discussed as an indicator of the elevation of the bankfull discharge. We found that this feature is
0
10
20
30
40
50
60
70
Flood Plain Break Slope Break Toe of Slope Inflection Point
Bankfull Indicator
% S
ampl
e Si
tes
Bankfull discharge and channel characteristics of streams in the AP/VR hydrologic region
12
a poor indicator in both the Maryland Piedmont (McCandless and Everett 2002) and AP/VR physiographic regions. At areas of significant confinement in the surveyed streams in the AP/VR, we often found that the toe of the slope represented bankfull discharge. While not as consistent a feature, some vegetation species, such as mountain laurel (sp.) or hemlock (sp.),tended to correspond with the elevation of the bankfull stage, although neither of these species is especially water intolerant with the roots of the hemlock often growing in the stream and mountain laurel found in wetlands (Peattie 1950).
Figure 7. Percent of sites exhibiting geomorphic indicators of bankfull stage.
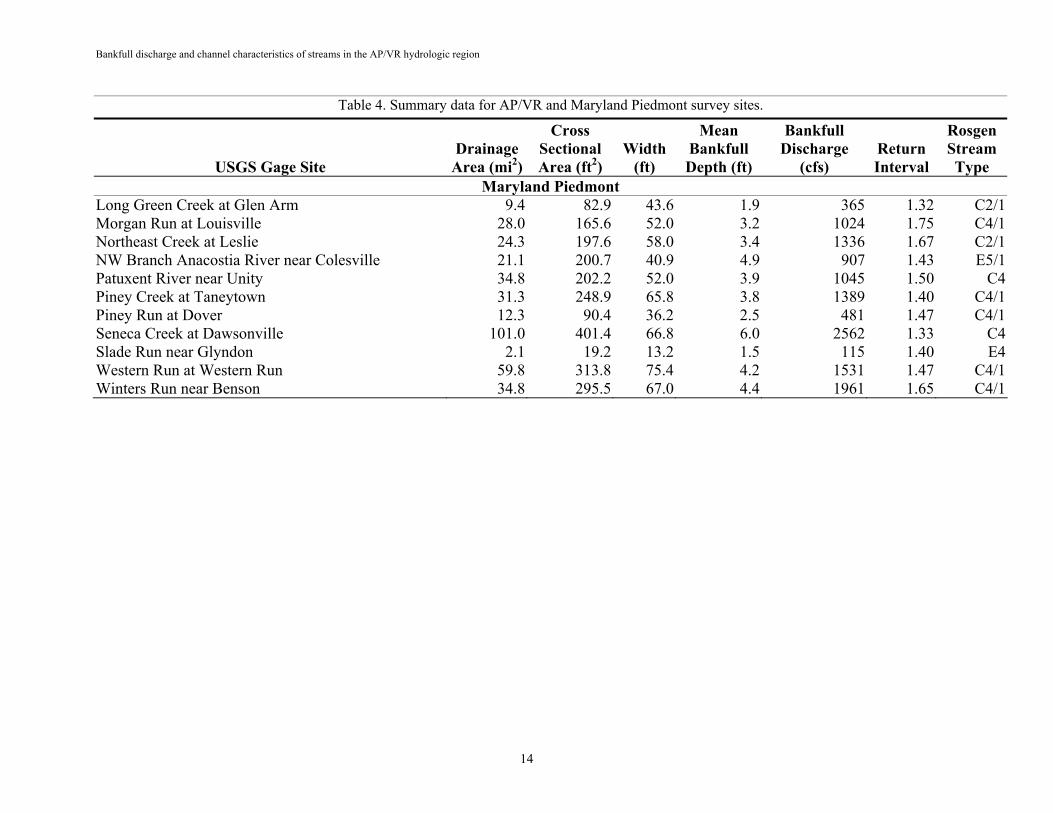
Bankfull DischargeBy Drainage Area Summaries of bankfull dimensions from field measurements and hydraulic geometry data for the AP/VR streams and the Maryland Piedmont data from McCandless and Everett (2002) are provided in Table 4. Bankfull discharge is significantly related to drainage area, with about 99 percent of the variability in discharge explained by drainage area (Figure 8, Table 5). Partitioning the sites between Allegheny Plateau and Valley and Ridge shows no significant effect of physiographic region on bankfull discharge as a function of drainage area (p > 0.05). Two-year recurrence interval discharges from the USGS log-Pearson flood frequency distribution, which provide a measure of runoff magnitude independent of this survey, also show no statistical difference between the Allegheny Plateau and the Valley and Ridge survey sites (p > 0.05) (Figure 9).
0
10
20
30
40
50
60
70
80
90
100
Flood PlainBreak
Slope Break Toe of Slope Inflection Point Top Bench Scour Line
Bankfull Indicators
% S
ampl
e Si
tes

Bankfull discharge and channel characteristics of streams in the AP/VR hydrologic region
13
Table 4. Summary data for AP/VR and Maryland Piedmont survey sites.
USGS Gage Site Drainage
Area (mi2)
CrossSectionalArea (ft2)
Width(ft)
MeanBankfullDepth (ft)
BankfullDischarge
(cfs) ReturnInterval
RosgenStreamType
Bear Creek at Forest Park, MD 10.4 42.3 25.7 1.7 256 1.40 C4/1 Bear Creek at Friendsville, MD 48.9 208.0 69.2 3.0 1132 1.40 F3/1 Big Piney Run near Salisbury, PA 24.5 176.4 63.7 2.8 766 1.49 C3/1 Casselman River at Grantsville, MD 62.5 402.3 125.8 3.2 1689 1.55 B3c Crabtree Creek near Swanton, MD 16.7 74.0 36.3 2.0 443 1.80 B3/1 Ditch Run near Hancock, MD 4.8 51.6 29.7 1.7 183 1.45 C4 Evitts Creek near Centerville, PA 30.2 88.9 40.7 2.2 598 1.33 C1 NB Potomac River at Steyer, MD 73.1 597.7 115.7 5.2 2714 1.55 C3 Savage River near Barton, MD 49.1 253.5 75.0 3.4 1276 1.55 F1 Savage River near Frostburg, MD 1.5 15.7 14.0 1.1 39 1.53 C3 Sawpit Run near Oldtown, MD 5.1 39.9 34.6 1.2 220 1.47 B1c Sideling Hill Creek near Bellegrove, MD 102.0 574.3 117.3 4.9 2726 1.53 B4/1c Toliver Run trib. near Hoyes Run, MD 0.5 7.2 9.6 0.8 24 1.60 B4 Youghiogheny River trib. near Friendsville, MD 0.2 7.3 9.7 0.8 7 1.05 B4
Maryland Piedmont Baisman Run at Broadmoor 1.5 31.3 18.9 1.7 115 1.55 C4 Basin Run at Liberty Grove 5.3 96.8 51.1 1.9 614 1.55 C4 Beaver Run near Finksburg 14.0 105.7 40.4 2.6 627 1.73 C4/1 Beaverdam Run at Cockeysville 20.9 162.0 43.2 3.8 663 1.26 C5/1c- Bennett Creek at Park Mills 62.8 398.0 83.2 4.8 1867 1.55 C4/1 Big Elk Creek at Elk Mills 52.6 341.7 77.5 4.4 2099 1.45 C4/1 Big Pipe Creek at Bruceville 102.0 518.7 86.2 6.0 2658 1.55 C4/1 Cattail Creek near Glenwood 23.0 210.7 45.2 4.7 1499 1.43 E4 Cranberry Branch near Westminster 3.4 31.1 19.1 1.6 162 1.57 C4 Deer Creek at Rocks 94.4 473.7 101.0 4.7 2614 1.37 B4/1c Hawlings River near Sandy Spring 27.0 179.3 44.8 4.0 1030 1.60 C5 Jones Falls at Sorrento 25.2 185.5 54.0 3.4 915 1.57 C4 Little Falls at Blue Mount 52.9 335.3 68.0 4.9 1674 1.45 C4 Little Patuxent River at Guilford 38.0 251.1 49.8 5.0 1024 1.48 E5
Bankfull discharge and channel characteristics of streams in the AP/VR hydrologic region
14
Table 4. Summary data for AP/VR and Maryland Piedmont survey sites.
USGS Gage Site Drainage
Area (mi2)
CrossSectionalArea (ft2)
Width(ft)
MeanBankfullDepth (ft)
BankfullDischarge
(cfs) ReturnInterval
RosgenStreamType
Maryland PiedmontLong Green Creek at Glen Arm Morgan Run at Louisville
9.428.0
82.9165.6
43.652.0
1.93.2
3651024
1.321.75
C2/1C4/1
Northeast Creek at Leslie 24.3 197.6 58.0 3.4 1336 1.67 C2/1 NW Branch Anacostia River near Colesville 21.1 200.7 40.9 4.9 907 1.43 E5/1 Patuxent River near Unity 34.8 202.2 52.0 3.9 1045 1.50 C4 Piney Creek at Taneytown 31.3 248.9 65.8 3.8 1389 1.40 C4/1 Piney Run at Dover 12.3 90.4 36.2 2.5 481 1.47 C4/1 Seneca Creek at Dawsonville 101.0 401.4 66.8 6.0 2562 1.33 C4 Slade Run near Glyndon 2.1 19.2 13.2 1.5 115 1.40 E4 Western Run at Western Run 59.8 313.8 75.4 4.2 1531 1.47 C4/1 Winters Run near Benson 34.8 295.5 67.0 4.4 1961 1.65 C4/1
Bankfull discharge and channel characteristics of streams in the AP/VR hydrologic region
15
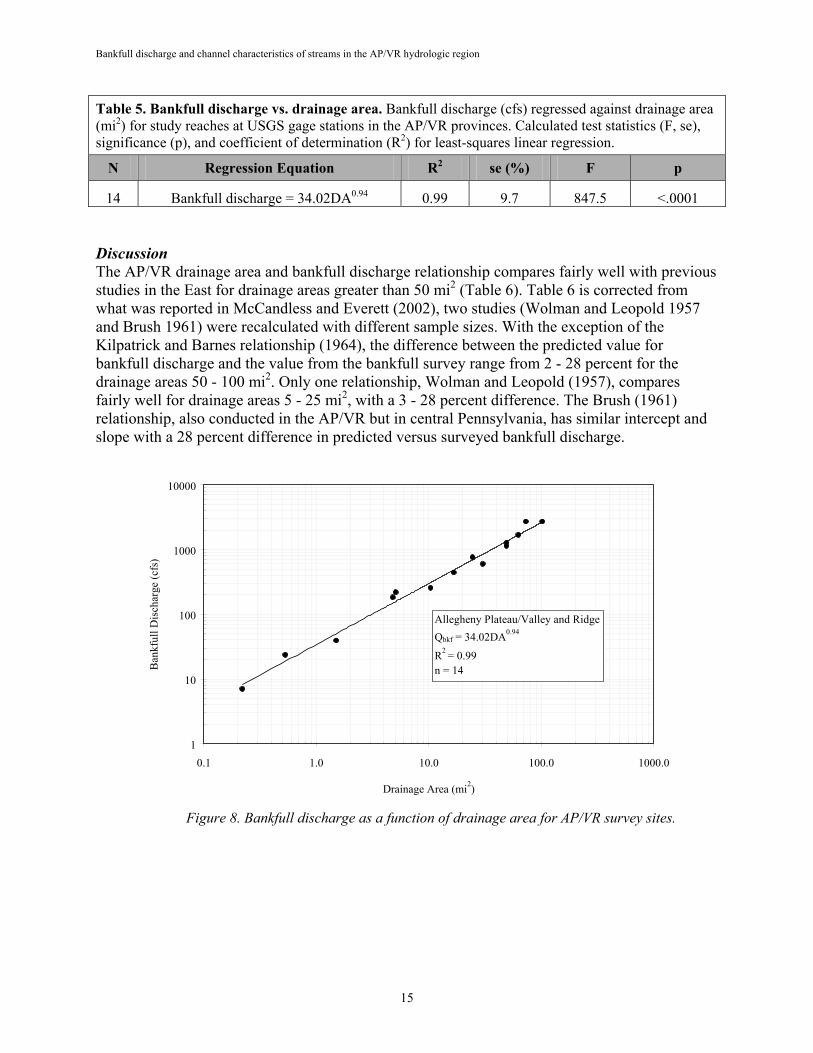
Table 5. Bankfull discharge vs. drainage area. Bankfull discharge (cfs) regressed against drainage area (mi2) for study reaches at USGS gage stations in the AP/VR provinces. Calculated test statistics (F, se), significance (p), and coefficient of determination (R2) for least-squares linear regression.
N Regression Equation R2 se (%) F p
14 Bankfull discharge = 34.02DA0.94 0.99 9.7 847.5 <.0001
DiscussionThe AP/VR drainage area and bankfull discharge relationship compares fairly well with previous studies in the East for drainage areas greater than 50 mi2 (Table 6). Table 6 is corrected from what was reported in McCandless and Everett (2002), two studies (Wolman and Leopold 1957 and Brush 1961) were recalculated with different sample sizes. With the exception of the Kilpatrick and Barnes relationship (1964), the difference between the predicted value for bankfull discharge and the value from the bankfull survey range from 2 - 28 percent for the drainage areas 50 - 100 mi2. Only one relationship, Wolman and Leopold (1957), compares fairly well for drainage areas 5 - 25 mi2, with a 3 - 28 percent difference. The Brush (1961) relationship, also conducted in the AP/VR but in central Pennsylvania, has similar intercept and slope with a 28 percent difference in predicted versus surveyed bankfull discharge.
Figure 8. Bankfull discharge as a function of drainage area for AP/VR survey sites.
1
10
100
1000
10000
0.1 1.0 10.0 100.0 1000.0
Drainage Area (mi2)
Ban
kful
l Dis
char
ge (c
fs)
Allegheny Plateau/Valley and Ridge Qbkf = 34.02DA0.94
R2 = 0.99n = 14

Bankfull discharge and channel characteristics of streams in the AP/VR hydrologic region
16
Figure 9. Two-year recurrence interval discharge as a function of drainage area, partitioned by AP and VR survey sites.
Table 6. Comparison of bankfull discharge to drainage area relationships for the AP/VR and other nearby regions. The relationships are all expressed as power functions of the form Qbkf = aDAb, where Qbkf is bankfull discharge in cubic feet per second and DA is drainage area in square miles. R2 is the regression coefficient of determination, n = number of observations.
Source a b n R2 Geographic Area
This Study 34.02 0.94 14 .99 Allegheny Plateau/Valley & Ridge
USFWS 2002 84.56 0.76 23 0.93 Maryland Piedmont
Wolman 1955 61 0.82 8 ? SE PA Piedmont Wolman & Leopold 1957 53.71 0.82 15 0.78 SC, NC, MD, PA, NY, CT
Brush 1961 24.64 0.95 4 0.99 Central PA Allegheny Plateau/Valley & Ridge
Kilpatrick & Barnes 1964 285 0.50 34 0.63 NC & SC, GA, AL Piedmont
1
10
100
1000
10000
0.1 1.0 10.0 100.0 1000.0
Drainage Area (mi2)
Dis
char
ge (c
fs)
Allegheny Plateau Valley and Ridge

Bankfull discharge and channel characteristics of streams in the AP/VR hydrologic region
17
Comparing AP/VR with Maryland Piedmont Comparison of the two regressions reveals that they are significantly different (p > 0.05), and that the AP/VR has less bankfull discharge per unit drainage area than the Maryland Piedmont (Figure 10). This is consistent with previous work by USGS (Dillow 1996) which developed regressional relationships between the Maryland physiographic regions for the 2-year through 500-year discharge events. Using the AP/VR and the Maryland Piedmont regression equations to calculate the bankfull discharge for drainage areas between 1 - 100 mi2 results in a difference of 3 - 148 percent. The percent difference decreases with increasing drainage area (Figure 10).
Figure 10. Comparison of bankfull discharge as a function of drainage area partitioned by AP/VR and Maryland Piedmont survey sites.
Bankfull DischargeRecurrence Interval Recurrence intervals for field-estimated bankfull discharges, calculated from the annual maximum discharge series following the Guidelines for Determining Flood Flow Frequency(Interagency Advisory Committee 1982), range from 1.05 - 1.8 years, and average 1.48 years (Figure 11). For some of the surveyed sites, USGS used a high-outlier adjustment (Interagency Advisory Committee 1982) and developed weighted peak estimates using regional regression equations (Dillow 1996) in the log-Pearson flood frequency analysis. The regression equations are used for comparing data from a particular station with stations in the region. Weighting the estimates between the station data and regression equation data is useful for stations with relatively short periods of record (discontinued crest gage sites), because it builds a regional component into the frequency estimate that often includes stations with longer periods of record. Appendix A provides the period of record and information on the log-Pearson analysis for each site.
1
10
100
1000
10000
0.1 1.0 10.0 100.0 1000.0
Drainage Area (mi2)
Ban
kful
l Dis
char
ge (c
fs)
Maryland Piedmont Allegheny Plateau/Valley and Ridge

Bankfull discharge and channel characteristics of streams in the AP/VR hydrologic region
18
Figure 11. Frequency of recurrence interval for field-estimated bankfull discharge.
Comparison of the field-estimated bankfull discharges with the Bulletin 17-B 1.5-year recurrence intervals shows very close correspondence (Figure 12). The average ratios of bankfull discharge to the Bulletin 17-B, 1.5 and 2-year recurrence interval discharges are 0.99 (sd = 0.11) and 0.77 (sd = 0.09), respectively. Comparison of the regression relationships by drainage area for the field-estimated bankfull and Bulletin 17-B estimated 1.5-year recurrence interval discharges (Figure 12), reveals no difference in either the intercepts (t = 0.62, n = 24, p > 0.05) or slopes (t = 0.21, n = 25, p > 0.05). This indicates that the overall relationships between drainage area and the field estimated bankfull and 1.5-year recurrence interval discharges are essentially the same.
DiscussionWolman and Miller (1960) developed the concept of effective discharge and showed that frequent, rather than rare, events were responsible for forming channels:
“…most of the work of moving sediment from the drainage basin is done by frequent flows of moderate magnitude. As used here, a “frequent” event recurs at least once each year or two and in many cases several or more times per year.”
Later, Leopold, Wolman and Miller (1964) characterized 1.5 years as a “good average” recurrence interval for bankfull discharge. Other field studies (Dury 1973, Woodyer 1968, Hey 1975) reached similar conclusions that the bankfull discharge has an average return period of about 1.5 years (indicating an average occurrence of about once a year). There is an assumed relationship between the annual hydrologic cycle and the bankfull discharge (Richards 1982) and the 1.5-year return period paradigm holds true for humid and semi-arid regions. Higher return periods for bankfull discharges, however, are found in streams that experience long periods of low or ephemeral flow with less-frequent, sharp flood peaks (Gregory and Walling 1973).
0
1
2
3
4
5
6
7
1-1.1
1.1-1.
2
1.2-1.
3
1.3-1.
4
1.4-1.
5
1.5-1.
6
1.6-1.
7
1.7-1.
8
1.8-1.
91.9
-2
Recurrence Interval
Freq
uenc
yMean = 1.48Median = 1.51Mode = 1.55Range = 1.05 - 1.8

Bankfull discharge and channel characteristics of streams in the AP/VR hydrologic region
19
While the range of bankfull discharge recurrence intervals is slightly greater for the AP/VR compared to the Maryland Piedmont (1.26 - 1.75), the average for each is essentially the same, 1.48 versus 1.5. In both regions, the bankfull discharge is also closely approximated by the Bulletin 17-B 1.5-year recurrence interval. One site in the AP/VR, has a recurrence interval of 1.05. This site, Youghiogheny River tributary near Friendsville, MD, is a discontinued crest gage with the smallest drainage area surveyed (0.22 mi2) at which the previous rating was approximated to the more recent discharge measurements by determining the elevation when the discharge would break out of the channel. The Bulletin 17-B 1.5-year discharge is 10 cfs, about a 30 percent difference from the survey. Sixty-one percent of the drainage is forest/brush cover with the remainder in agriculture/grassland, one of the highest in the data set for agriculture/grassland cover. Removing this from the analysis gives a recurrence interval range of 1.33 – 1.8 with an average of 1.51 (sd = 0.12).
Figure 12. Drainage area versus discharge: AP/VR field-determined bankfull and Bulletin 17-B 1.5-year recurrence interval.
Cross-section RelationshipsWe used data from the cross-section surveys to test for predictive relationships between the independent variables of drainage area and bankfull discharge and the dependent variables of width, mean depth, and cross-sectional area. We also tested for relationships between relative roughness (R/D84) and flow resistance calculated from the Manning equation (Manning’s “n”).
1
10
100
1000
10000
0 1 10 100 1000
Drainage Area (mi2)
Dis
char
ge (c
fs)
Bulletin 17-B 1.5-yearo Allegheny Plateau/Valley and Ridge

Bankfull discharge and channel characteristics of streams in the AP/VR hydrologic region
20
Cross-section RelationshipsBy Drainage Area We used data from the bankfull cross-section surveys to examine for relationships between drainage area and width, mean depth, and cross-sectional area. Width, mean depth, and cross-sectional area are all significantly related to drainage area (Figure 13, Table 7). Of the three parameters, cross-sectional area has the greatest percent of the variability in size explained by drainage area, followed closely by width and mean depth, as indicated by the regression coefficients of determination (R2 values).
Table 7. Cross-section dimensions vs. drainage area. Bankfull width (ft), mean depth (ft), and cross-sectional area (ft2) regressed against drainage area (mi2) for study reaches at USGS gage stations in the AP/VR provinces. Calculated test statistics (F, se), significance (p), and coefficient of determination (R2) for least-squares linear regression.
N Regression Equation R2 se (%) F p
14 Cross-sectional Area = 13.17DA0.75 0.93 17.3 169.4 <.0001
14 Width = 13.87DA0.44 0.92 11.5 129.7 <.0001
14 Mean Depth = 0.95DA0.31 0.91 8.4 123.7 <.0001
Figure 13. Bankfull channel dimensions as a function of drainage area for AP/VR survey sites (n = 14).
DiscussionThe results of this survey document significant relationships between all three bankfull cross-section parameters (area, width, and mean depth) and drainage area in streams of the AP/VR. As
XS-Area (ft2) = 13.17DA0.75
R2 = 0.93
Width (ft) = 13.87DA0.44
R2 = 0.92
Depth (ft) = 0.95DA0.31
R2 = 0.91
0.1
1.0
10.0
100.0
1000.0
0.1 1.0 10.0 100.0 1000.0
Drainage Area (mi2)
Ban
kful
l Cha
ract
eris
tics

Bankfull discharge and channel characteristics of streams in the AP/VR hydrologic region
21
the drainage area decreases, the difference between width and cross-sectional area decreases (Figure 12). The width/depth ratio for all streams are greater than 12 (the delineative cutoff in the Rosgen stream classification) with the smaller drainages having lower width/depth ratios.
Comparing AP/VR with Maryland PiedmontAs one would expect, given a smaller bankfull discharge per unit drainage area, the streams in the AP/VR have less bankfull cross-sectional area per unit drainage area compared to the Maryland Piedmont streams (Figure 14). The two regression lines have the same slopes but different intercepts (t = -5.17, n = 34, p > 0.05), indicating that the increase in area with increasing drainage area follows the same relationship in both regions. As with cross-sectional area, the regression lines for depth have the same slopes but different intercepts (t = -5.17, n = 34, p > 0.05), while there is no statistical difference between the regions with respect to bankfull width (Figure 15). Thus, for a given drainage area, measured AP/VR streams have larger width/depth ratios, since the widths are similar, but depths are less than in the Piedmont (t = 3.84, n = 34, p > 0.05) (Figure 16). These results are also paralleled by the results from the Rosgen stream type classification criteria. Removing the two smaller drainage basins (Site Numbers 13 and 14) outside the range of the Maryland Piedmont sample from the AP/VR data set does not change the results above.
Figure 14. Comparison of AP/VR with Maryland Piedmont (McCandless and Everett 2002) survey sites for bankfull cross-sectional area by drainage area.
1
10
100
1000
0.1 1.0 10.0 100.0 1000.0
Drainage Area (mi2)
Ban
kful
l Cro
ss-s
ectio
nal A
rea
(ft)
Maryland Piedmonto Allegheny Plateau/Valley & Ridge

Bankfull discharge and channel characteristics of streams in the AP/VR hydrologic region
22
Figure 15. Comparison of AP/VR with Maryland Piedmont survey sites for bankfull mean depth by drainage area.
Figure 16. Comparison of AP/VR with Maryland Piedmont survey sites for bankfull width/depth ratio by drainage area.
0.1
1.0
10.0
0.1 1.0 10.0 100.0 1000.0
Drainage Area (mi2)
Ban
kful
l Mea
n D
epth
(ft)
Maryland Piedmonto Allegheny Plateau/Valley & Ridge
1.0
10.0
100.0
0.1 1.0 10.0 100.0 1000.0
Drainage Area (mi2)
Ban
kful
l Wid
th/D
epth
Maryland Piedmonto Allegheny Plateau/Valley & Ridge

Bankfull discharge and channel characteristics of streams in the AP/VR hydrologic region
23
Cross-section RelationshipsBy Bankfull Discharge Width, mean depth, and cross-sectional area in the AP/VR streams are all significantly related to bankfull discharge (Figure 17). Comparison of the coefficients of determination (R2) show that, as with drainage area, discharge best explains the variability in cross-sectional area, followed in order by width and mean depth (Table 8).
Table 8. Cross-section dimensions vs. bankfull discharge. Bankfull width (ft), mean depth (ft), and cross-sectional area (ft2) regressed against bankfull discharge (cfs) for study reaches at USGS gage stations in the AP/VR. Calculated test statistics (F, se), significance (p), and coefficient of determination (R2) for least-squares linear regression.
N Regression Equation R2 se (%) F p
14 Cross-sectional Area = 0.79Qbkf0.8 0.95 15 230.3 <.001
14 Width = 2.65Qbkf0.47 0.94 9.6 191.3 <.001
14 Mean Depth = 0.3Qbkf 0.33 0.91 8.3 128.7 <.001
Figure 17. Bankfull channel dimensions as a function of bankfull discharge for AP/VR survey sites (n = 14).
XS-Area (ft2) = 0.79Qbkf
0.8
R2 = 0.95
Width (ft) = 2.65Qbkf
0.47
R2 = 0.94
Mean Depth (ft) = 0.3Qbkf
0.33
R2 = 0.910.1
1.0
10.0
100.0
1000.0
1.0 10.0 100.0 1000.0 10000.0
Bankfull Discharge (cfs)
Ban
kful
l Dim
ensi
ons

Bankfull discharge and channel characteristics of streams in the AP/VR hydrologic region
24
DiscussionThe power function equations determined in this study compare favorably with equations developed by other workers (Table 9). As in the Maryland Piedmont (McCandless and Everett 2002), this is particularly true for the exponents or slopes of the regressional analyses; which indicate the degree of change in a dimensional parameter for every unit change in bankfull discharge. As noted previously, cross-sectional area varies the least, indicating a more conservative parameter than either width or depth. Neither Leopold and Maddock (1953) nor Wolman (1955) provided coefficients for the relationships determined in their studies. The equations of this study and that of Nixon (1959) have dimensional units in feet, while that of Hey and Thorne (1986) is for metric units. One may compare the slope functions expressed by the dimensionless exponents directly; however, the coefficients, which represent the y-intercepts, must be converted for comparison. The converted (to feet) coefficient ranges provided by Hey and Thorne for width (7.12 - 13.06) and depth (0.52 - 0.65) suggest their study streams have greater width/depth ratios.
Table 9. Comparison of relationships between bankfull discharge and channel dimensions.Coefficients and exponents of power functions describing relationships between bankfull discharge and channel dimensions from selected channel geometry studies. Power functions have the form W = aQbkf
b, d = cQbkff and XS-Area = gQbkf
h. Superscripts: for Study 1 = units in feet, 2 = metric; for Area + = determined from mathematical relationship of hydraulic geometry equations wherein h=b+f. Hey & Thorne provide separate equations for different bank vegetation conditions, hence the range of coefficients.
Study Width (Wbkf) Depth (d) Area (A)
a b c f g hThis Study1 2.65 0.47 0.3 0.33 0.79 0.8 USFWS 20021 1.46 0.52 0.19 0.42 0.28 0.94 Leopold & Maddock 19531 0.50 0.40 0.90+
Hey & Thorne 19862 2.17-3.98 0.52 0.16-0.20 0.39 0.91+
Nixon 19591 1.65 0.50 0.55 0.33 0.9 0.83 Wolman 19551 0.42 0.45 0.87+
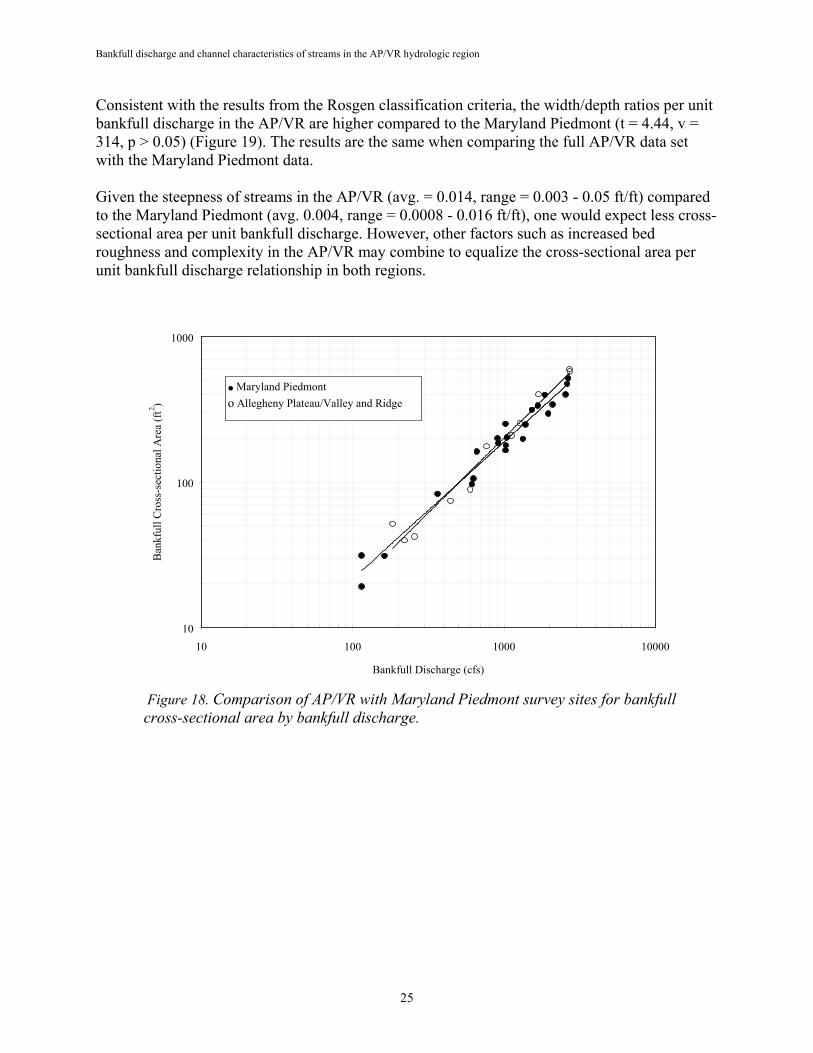
Comparing AP/VR with Maryland PiedmontThe streams in the AP/VR have similar cross-sectional area per unit bankfull discharge as the Maryland Piedmont streams (Figure 18). The two regression lines have similar slopes and elevations. Three sites (Site Numbers 10, 13, 14) from the AP/VR data set were outside the range of discharges found in the Maryland Piedmont and were excluded from this analysis.
Following the results from the bankfull dimensions by unit drainage area, the width and depth by unit bankfull discharge are significantly different between the AP/VR and the Maryland Piedmont. As one would expect, the streams in the AP/VR are wider (t = 4.24, n = 31, p > 0.05) and have less mean depth (t = -3.27, n = 31, p > 0.05) than the Maryland Piedmont streams.
Bankfull discharge and channel characteristics of streams in the AP/VR hydrologic region
25
Consistent with the results from the Rosgen classification criteria, the width/depth ratios per unit bankfull discharge in the AP/VR are higher compared to the Maryland Piedmont (t = 4.44, v = 314, p > 0.05) (Figure 19). The results are the same when comparing the full AP/VR data set with the Maryland Piedmont data.
Given the steepness of streams in the AP/VR (avg. = 0.014, range = 0.003 - 0.05 ft/ft) compared to the Maryland Piedmont (avg. 0.004, range = 0.0008 - 0.016 ft/ft), one would expect less cross-sectional area per unit bankfull discharge. However, other factors such as increased bed roughness and complexity in the AP/VR may combine to equalize the cross-sectional area per unit bankfull discharge relationship in both regions.
Figure 18. Comparison of AP/VR with Maryland Piedmont survey sites for bankfull cross-sectional area by bankfull discharge.
10
100
1000
10 100 1000 10000
Bankfull Discharge (cfs)
Ban
kful
l Cro
ss-s
ectio
nal A
rea
(ft2 )
Maryland Piedmonto Allegheny Plateau/Valley and Ridge

Bankfull discharge and channel characteristics of streams in the AP/VR hydrologic region
26
Figure 19. Comparison of AP/VR with Maryland Piedmont survey sites for bankfull width/depth ratio by bankfull discharge.
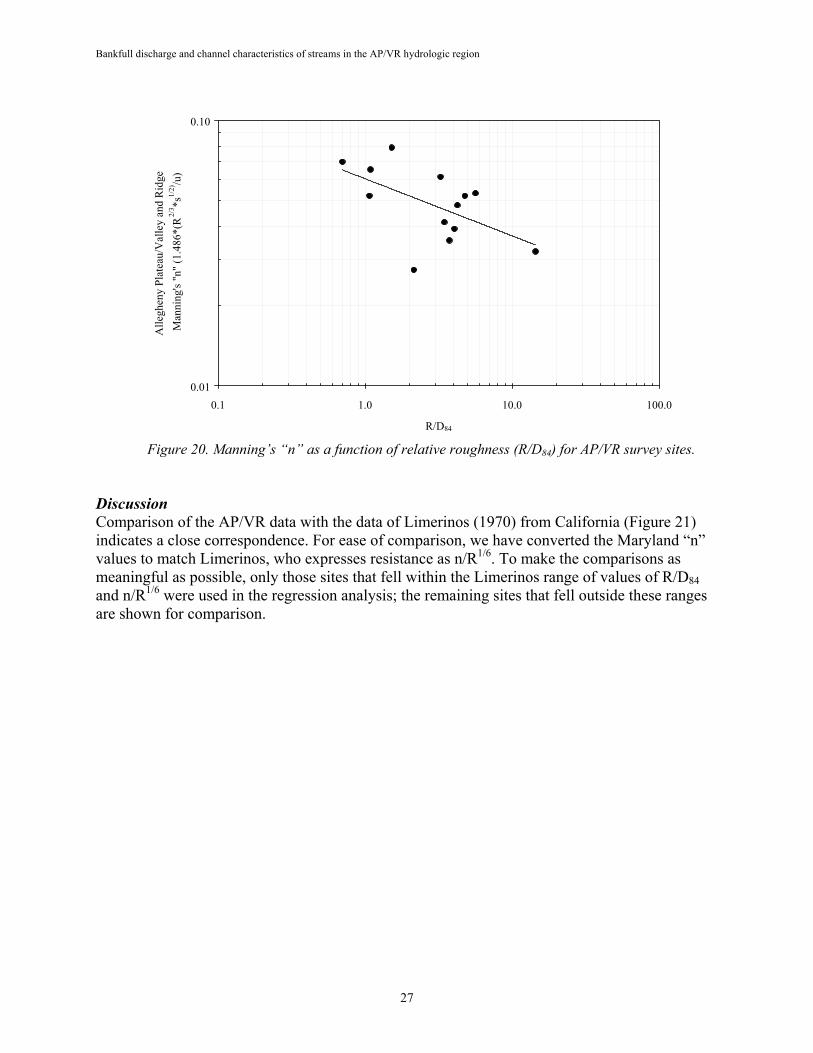
Resistance RelationshipsThere is a significant relationship between relative roughness (R/D84), and resistance expressed as Manning’s “n”, with about 31 percent of the variability in “n” values explained by the relative roughness of the bed material (Table 10, Figure 20). However, the derivation of both the dependent and independent variable includes the hydraulic radius. Youghiogheny River tributary near Friendsville, MD, is not included in this analysis. The Youghiogheny River Tributary gage is an outlier in the data set in many respects. It possesses the smallest drainage area (0.22 square miles), the highest average channel slope (4.7%), and the highest value of Manning’s “n” (0.25).Except for the value of Manning’s “n”, we find that there are not significant differences between relations developed that include the Youghiogheny River Tributary gage and those that do not.
Table 10. Flow resistance as a function of relative roughness. Average flow resistance expressed as Manning’s “n”, regressed against relative roughness, or R/D84. Calculated test statistics (F, se), significance (p), and coefficient of determination (R2) for least-squares linear regression.
N Regression Equation R2 se (%) F p
13 “n” = 0.06(R/D84)-0.22 0.31 1.3 6.1 <.001
1
10
100
10 100 1000 10000
Bankfull Discharge (cfs)
Ban
kful
l Wid
th/D
epth
Maryland Piedmonto Allegheny Plateau/Valley and Ridge
Bankfull discharge and channel characteristics of streams in the AP/VR hydrologic region
27
Figure 20. Manning’s “n” as a function of relative roughness (R/D84) for AP/VR survey sites.
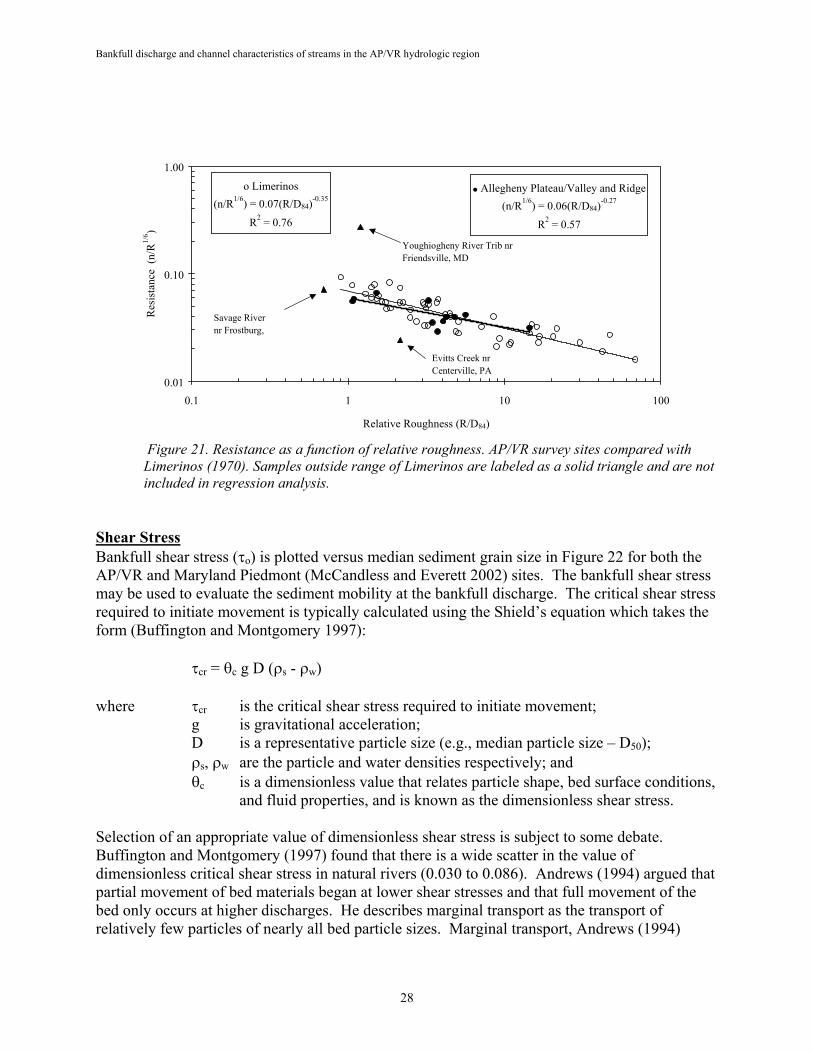
DiscussionComparison of the AP/VR data with the data of Limerinos (1970) from California (Figure 21) indicates a close correspondence. For ease of comparison, we have converted the Maryland “n” values to match Limerinos, who expresses resistance as n/R1/6. To make the comparisons as meaningful as possible, only those sites that fell within the Limerinos range of values of R/D84and n/R1/6 were used in the regression analysis; the remaining sites that fell outside these ranges are shown for comparison.
0.01
0.10
0.1 1.0 10.0 100.0
R/D84
Alle
ghen
y Pl
atea
u/V
alle
y an
d R
idge
Man
ning
's "n
" (1.
486*
(R2/
3 *s1/
2)/u
)
Bankfull discharge and channel characteristics of streams in the AP/VR hydrologic region
28
Figure 21. Resistance as a function of relative roughness. AP/VR survey sites compared with Limerinos (1970). Samples outside range of Limerinos are labeled as a solid triangle and are not included in regression analysis.
Shear StressBankfull shear stress ( o) is plotted versus median sediment grain size in Figure 22 for both the AP/VR and Maryland Piedmont (McCandless and Everett 2002) sites. The bankfull shear stress may be used to evaluate the sediment mobility at the bankfull discharge. The critical shear stress required to initiate movement is typically calculated using the Shield’s equation which takes the form (Buffington and Montgomery 1997):
cr = c g D ( s - w)
where cr is the critical shear stress required to initiate movement; g is gravitational acceleration; D is a representative particle size (e.g., median particle size – D50);
s, w are the particle and water densities respectively; and c is a dimensionless value that relates particle shape, bed surface conditions,
and fluid properties, and is known as the dimensionless shear stress.
Selection of an appropriate value of dimensionless shear stress is subject to some debate. Buffington and Montgomery (1997) found that there is a wide scatter in the value of dimensionless critical shear stress in natural rivers (0.030 to 0.086). Andrews (1994) argued that partial movement of bed materials began at lower shear stresses and that full movement of the bed only occurs at higher discharges. He describes marginal transport as the transport of relatively few particles of nearly all bed particle sizes. Marginal transport, Andrews (1994)
Allegheny Plateau/Valley and Ridge(n/R1/6) = 0.06(R/D84)
-0.27
R2 = 0.57
o Limerinos(n/R1/6) = 0.07(R/D84)
-0.35
R2 = 0.76
0.01
0.10
1.00
0.1 1 10 100
Relative Roughness (R/D84)
Res
ista
nce
(n/R
1/6 )
Youghiogheny River Trib nr Friendsville, MD
Savage River nr Frostburg,
Evitts Creek nr Centerville, PA

Bankfull discharge and channel characteristics of streams in the AP/VR hydrologic region
29
argued, occurs for dimensionless shear stress in the range of 0.030 to 0.047. General transport, when the bed is fully mobilized, occurs for a dimensionless shear stress in excess of 0.047.
To evaluate the sediment mobility of the survey sites at bankfull discharges while avoiding selection of a particular value of the dimensionless critical shear stress, Figure 22 shows the bankfull shear stress versus median grain diameter. We have also included the limits for Andrews (1994) threshold for the initiation of marginal bed load transport (qc = 0.020) and the threshold for significant bed load transport (qc = 0.060).
The figure shows that bankfull discharge in the AP/VR streams is capable (or very close to capable) of generating marginal bed load transport in all streams. Because of finer grain sizes, bankfull discharges in the Maryland Piedmont streams are generally capable of mobilizing the entire bed. The point of the exercise is simply to develop a coarse estimate of the degree to which the bed materials are likely subject to movement at or near the estimated bankfull stage. With these caveats, the comparison suggests that, for those sites plotting above the line of initiation of movement, bed materials are likely mobile at or near the bankfull stage.
Figure 22. Comparison of estimated average boundary shear stress and median particle size for the AP/VR and Maryland Piedmont (McCandless and Everett 2002) survey sites.
0.1
1.0
10.0
1.0 10.0 100.0 1000.0
Median Sediment Size, D50 (mm)
Shea
r Stre
ss, t
o = g
Rs (
lbs/
ft2 )
Allegheny Plateau / Valley & Ridge Signficant Bedload Transport, Andrews (1994): tc* = 0.060 Initiation of Movement, Andrews (1994): tc* = 0.020 MD Piedmont (2002)
Notes: 1) Sawpit Run nr Oldtown, MD not included --channel consists of loose substrate over bedrock
t

Bankfull discharge and channel characteristics of streams in the AP/VR hydrologic region
30
Discussion Most of the study sites had calculated shear stress at the bankfull stage greater than the boundary of marginal bed load transport. Three sites plot close to the line where marginal transport starts to occur. During the survey, there was nothing to suggest anything unusual about these sites. Savage River near Frostburg, MD, has about 1.7 percent impervious surface with the predominant land use/land cover of forest brush at about 65 percent. This site has a high percent of the watershed in the water/wetland land use/land cover category with 12 percent occupied by a large wetland complex upstream. Big Piney Run near Salisbury, PA, has less than 1 percent of its watershed in impervious surface with the dominant land use/land cover in forest/brush at 71 percent. Savage River near Barton, MD, is relatively isolated with less than 1 percent impervious surface and about 75 percent of the watershed in forest/brush. Bedrock sills throughout the study reach control the stream grade.
The low o for the observed particle size distribution does not strongly suggest that there may be an incipient shift in sediment transport dynamics at these sites. The two sites plotting with the greatest o are Bear Creek at Friendsville, MD and Crabtree Creek near Swanton, MD. Both of these sites have steep gradients, 2 and 3 percent respectively, and large bed material. The median particle diameter, or D50, for each site is 0.5 and 0.6 feet respectively, while the D84 and D95 are 1.9 and 1.8, and 3.2 and 4.6 feet, respectively. Carling (1988) has shown that steep channels with large, armored bed material are susceptible to general mobilization of bed clasts only at flows that significantly exceed bankfull.
CONCLUSIONSAP/VR survey sites can be classified using the Rosgen stream classification system, however, the limited number of independent observations of different stream types prevents us from examining the use of the classification in helping explain some of the observed variability in stream characteristics in these regions.
There is a well-defined relationship between drainage area and bankfull discharge in the AP/VR region.
The AP/VR relationship between drainage area and bankfull discharge is significantly different from the Maryland Piedmont region, with less bankfull discharge per unit drainage area for the former.
There are well-defined relationships for AP/VR streams between drainage area and bankfull channel dimensions. The most conservative relationship with drainage area is for cross-sectional area.
The AP/VR streams have less bankfull cross-sectional area and less mean bankfull depth per unit drainage area than MD Piedmont streams.
The AP/VR streams have significantly higher width/depth ratios compared with the MD Piedmont streams.
Bankfull discharge and channel characteristics of streams in the AP/VR hydrologic region
31
Variability in the average flow resistance in the AP/VR as represented by the Manning “n” is fairly well explained by variability in relative roughness, expressed as R/D84.
APPLICATIONSUse of Regression Relationships for Design PurposesSeveral caveats exist for these relationships, and argue strongly against their use for detailed design specifications.
Relationships are representative of a restricted range of basin and reach characteristics (e.g., drainage area, geology, land use, etc.) and must be used with caution when applying to streams across the Allegheny Plateau/Valley and Ridge.
While we do not consider any of the reaches represented here to be in a state of rapid adjustment, we have no information about the relative rates of lateral or down-valley meander migration.
Relationships are not necessarily representative of “reference reach conditions”. These relationships provide no information about ecological parameters, and may not represent “good” habitat conditions.
The range of Rosgen stream types represented by the data is low, with the majority represented as C and B streams.
Given these caveats, the relationships presented here are recommended for use in stream assessments and are particularly useful in planning studies. The information can provide preliminary conceptual design parameters for streams with a similar range of discharge, sediment, slope, and entrenchment conditions. However, channel designers need to identify discrete project goals and objectives, with respect to both physical and biological desired conditions, and determine the appropriate design parameters for achieving those conditions. Additional field information is needed to determine appropriate design values for shear stress, critical shear stress and sediment transport relationships. In most cases the best guidance for finer scale aspects of channel design will come from carefully selected reference reaches that closely match the controlling conditions at the project reach, and exhibit those characteristics specifically identified as design objectives.
The intent for developing regional bankfull discharge and channel characteristics is to provide a database for refining estimates of bankfull channel dimensions in ungaged streams. As such, the data is intended primarily for use in stream assessments and for guidance in identifying expected (average), natural channel dimensions in ungaged streams.
Bankfull discharge and channel characteristics of streams in the AP/VR hydrologic region
32
LITERATURE CITED
1. Andrews, E.B. 1994. Marginal bed load transport in a gravel bed stream, Sagehen Creek, California. Water Resources Research, Vol. 30, No. 7, p. 2241-2250.
2. Brush, L.M., Jr. 1961. Drainage basins, channels, and flow characteristics of selected streams in central Pennsylvania. U.S. Geological Survey Professional Paper 282-F. U.S. Government Printing Office. Washington, D.C. 181 pp.
3. Buffington, J.M. and D.R. Montgomery. 1997. A systematic analysis of eight decades of incipient motion studies, with special reference to gravel-bedded rivers. Water Resources Research, Vol. 33, No. 8, pp. 1993 - 2029.
4. Carling, P. 1988. The concept of dominant discharge applied to two gravel-bed streams in relation to channel stability thresholds. Earth Surface Processes and Landforms, 13: 355-367.
5. Dillow, J.A. 1996. Technique for estimating magnitude and frequency of peak flows in Maryland. USGS Water-Resources Investigations Report 95-4154, pp. 55.
6. Dury, G.H. 1973. Magnitude-frequency analysis and channel morphology, in Morisawa, M. (ed.) Fluvial Geomorphology, SUNY Binghamton, Publications in Geomorphology, pp. 91- 121.
7. Gregory, K.J. and D.E. Walling. 1973. Drainage Basin Form and Process. New York: Halsted Press.
8. Hey, R.D. 1975. Design discharges for natural channels, in Hey, R.D. and J.D. Davies (eds), Science and Technology in Environmental Management, Farnborough Saxon House, pp. 73- 88.
9. Hey, R.D. and C.R. Thorne. 1986. Stable channels with mobile gravel beds. Journal of Hydraulic Engineering, 112: 671-689.
10. Interagency Advisory Committee on Water Data. 1982. Guidelines for determining flood flow frequency. Water Resources Council Bulletin 17B, 28 pp.
11. Kilpatrick, F.A. and H.H. Barnes, Jr. 1964. Channel geometry of Piedmont streams as related to frequency of floods. U.S. Geological Survey Professional Paper 422-E. U.S. Government Printing Office. Washington, D.C. 10 pp.
12. Leopold, L.B. and T. Maddock, Jr. 1953. The hydraulic geometry of stream channels and some physiographic implications. U.S. Geological Survey Professional Paper No. 252. 57 pp.
13. Leopold, L.B., M.G. Wolman, and J.P. Miller. 1964. Fluvial Processes in Geomorphology. W.H. Freeman and Company, San Francisco, CA. 522 pp.
Bankfull discharge and channel characteristics of streams in the AP/VR hydrologic region
33
14. Limerinos, J.T. 1970. Determination of the Manning coefficient from measured bed roughness in natural channels. Geological Survey Water Supply Paper 1898-B. U.S. Government Printing Office. Washington, D.C. 47 pp.
15. McCandless, T.L. and R.A. Everett. 2002. Maryland stream survey: Bankfull discharge and channel characteristics in the Piedmont hydrologic region. U.S. Fish and Wildlife Service, Annapolis, MD. CBFO-S02-02. 41 pp.
16. Nixon, M.A. 1959. A study of the bankfull discharges of rivers in England and Wales. Institute of Civil Engineers Proceedings Paper No. 6322, pp. 157-174.
17. NOAA Cooperative (1961-1990) Station Normals. NRCS SNOTEL Station Normals, from PRISM Map on NRCS Web Site.
18. Peattie, D.C. 1950. A natural history of trees of eastern and central North America. Houghton Mifflin Company, Boston. 606 pp.
19. Richards, K.S. 1982. Rivers, Form and Processes in Alluvial Channels, Methuen, London. 358 pp.
20. Rosgen, D.L. 1994. A classification of natural rivers. Catena, 22, 169-199.
21. -----. 1996. Applied river morphology. Wildland Hydrology. Pagosa Springs, Colorado.
22. Schmidt, M.F. 1993. Maryland’s geology. Tidewater Publishers. Centreville, MD. 164 pp.
23. Shreve, R.L. 1967. Infinite topologically random channel networks. Journal of Geology, 75: 178-86.
24. Wolman, M.G. 1955. The natural channel of Brandywine Creek, Pennsylvania. U.S. Geological Survey Professional Paper 271. U.S. Government Printing Office. Washington, D.C. 56 pp.
25. Wolman, M.G. and L.B. Leopold. 1957. River flood plains: Some observations on their formation. U.S. Geological Survey Professional Paper 282-C. U.S. Government Printing Office. Washington, D.C. Pp. 87-109.
26. Wolman, M.G. and J.P. Miller. 1960. Magnitude and frequency of forces in geomorphic processes. The Journal of Geology, Vol. 68, No. 1., pp. 54-74.
27. Woodyer, K. D. 1968. Bankfull frequency in rivers. Journal of Hydrology, Vol. 6, pp. 114- 142.