Assessing Physical Habitat Condition in … 2. Biological Condition Land Use ... max mobile D...
36
California Aquatic Bioassessment Workgroup Meeting -- Nov 2006 Davis, California California Aquatic California Aquatic Bioassessment Bioassessment Workgroup Meeting Workgroup Meeting -- -- Nov 2006 Davis, California Nov 2006 Davis, California Phil Kaufmann --- USEPA, Corvallis, OR Phil Kaufmann Phil Kaufmann --- --- USEPA, USEPA, Corvallis, OR Corvallis, OR Assessing Physical Habitat Condition in Wadeable Streams and Rivers Using EMAP Style Protocols: Developing Indices of Habitat Condition Assessing Physical Habitat Condition in Assessing Physical Habitat Condition in Wadeable Wadeable Streams and Rivers Using EMAP Streams and Rivers Using EMAP Style Protocols: Style Protocols: Developing Indices of Habitat Condition Developing Indices of Habitat Condition 1 1
Transcript of Assessing Physical Habitat Condition in … 2. Biological Condition Land Use ... max mobile D...

California Aquatic Bioassessment Workgroup Meeting-- Nov 2006 Davis, CaliforniaCalifornia Aquatic California Aquatic BioassessmentBioassessment Workgroup MeetingWorkgroup Meeting---- Nov 2006 Davis, CaliforniaNov 2006 Davis, California
Phil Kaufmann --- USEPA, Corvallis, OR
Phil Kaufmann Phil Kaufmann ------ USEPA, USEPA, Corvallis, ORCorvallis, OR
Assessing Physical Habitat Condition in Wadeable Streams and Rivers Using EMAP
Style Protocols:
Developing Indices of Habitat Condition
Assessing Physical Habitat Condition in Assessing Physical Habitat Condition in WadeableWadeable Streams and Rivers Using EMAP Streams and Rivers Using EMAP
Style Protocols:Style Protocols:
Developing Indices of Habitat ConditionDeveloping Indices of Habitat Condition
11

Quantitative Measurements:
Channel Dimensions
Slope, Bearing
Substrate (“Pebble Count”)
Riparian Canopy Density
Visual Estimates/Tallys:
Fish Concealment Features
Woody Debris Tally
Embeddedness
Riparian Vegetation Cover
Riparian Veg. Structure
Human Disturbances
EMAP PHYSICAL HABITAT EMAP PHYSICAL HABITAT PROTOCOL:PROTOCOL:
22

Biological Condition
Land UseLand UseHuman DisturbanceHuman Disturbance
Natural Controls(stream size, elevation, slope)
Chemical Habitat Physical HabitatPhysical Habitat
Primary interpretation of condition from biota, but land use andPrimary interpretation of condition from biota, but land use and natural natural controls affect biota indirectly through their effect on habitatcontrols affect biota indirectly through their effect on habitat..
33

4
Habitat Assessments
• Raw Measurements• Habitat Characterization •• Habitat “Alteration”Habitat “Alteration”
–– of Particular Habitat Featuresof Particular Habitat Features–– of of IntegratedIntegrated Habitat MeasuresHabitat Measures
•• Habitat “Quality”Habitat “Quality”–– of Particular Habitat Featuresof Particular Habitat Features–– of of IntegratedIntegrated Habitat MeasuresHabitat Measures
• Multi-Dimensional Assessments• Multi-Scale Assessments
44

Habitat Indicators Reported in the Habitat Indicators Reported in the National National WadeableWadeable Streams AssessmentStreams Assessment
•• Streambed Excess Fine Sediments Streambed Excess Fine Sediments ------ scaling based scaling based on low end of RBS distribution in on low end of RBS distribution in EcoregionalEcoregional Ref Sites.Ref Sites.
•• Habitat Cover Complexity Habitat Cover Complexity ------ Sum of all types other than Sum of all types other than algae and trash,etc, (XFC_NAT) scaled by algae and trash,etc, (XFC_NAT) scaled by EcoregionalEcoregional Ref Sites. Ref Sites.
•• Riparian Vegetation Riparian Vegetation ------ Density and Complexity Density and Complexity meas’dmeas’d by by summed cover of 3 Layers of Woody Vegetation XCMGW summed cover of 3 Layers of Woody Vegetation XCMGW –– scaled scaled by by EcoregionalEcoregional Ref Sites.Ref Sites.
•• Riparian DisturbanceRiparian Disturbance ------ ProximityProximity--weighted human weighted human disturbance index (W1_Hall) disturbance index (W1_Hall) ---- values of 0.33 and 1.5 for low and values of 0.33 and 1.5 for low and high disturbance.high disturbance. 55
----
----
----
Grad
ient
Gr
adient
---
----
---
----
-->>
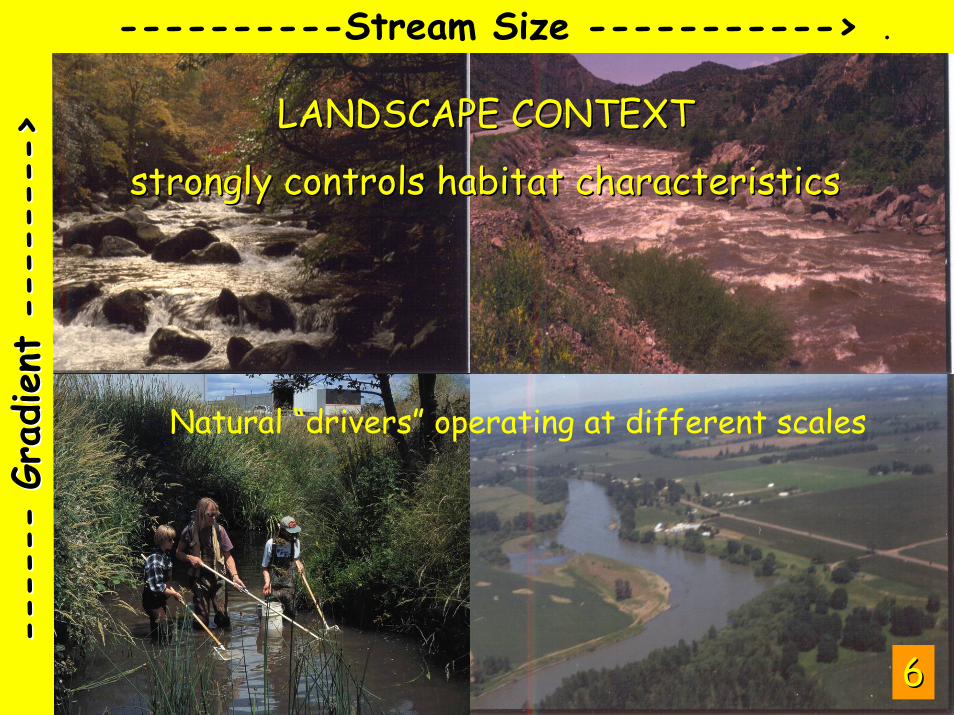
----------Stream Size -----------> .
LANDSCAPE CONTEXT LANDSCAPE CONTEXT
strongly controls habitat characteristicsstrongly controls habitat characteristics
Natural “drivers” operating at different scales
66

Relative Bed Stability and Excess FinesRelative Bed Stability and Excess Finesbased on mean particle diameter ratio: Observed/Mobile based on mean particle diameter ratio: Observed/Mobile
LRBS=Log(LRBS=Log(DDgmgm/D*/D*cbfcbf))
Dgm --- observed geometric mean diameter from field “pebble count”.
D*cbf : max mobile D “Critical D” at bankfull --- by equating bankfull and critical
shear stress: Bankfull Bed Shear Stress (pgR*
bfS), controlled by:+ Channel slope (S)+ Adjusted Bankfull Hydraulic Radius (R*
bf )+ Bankfull Depth,- Residual pool depth, - Form roughness,- Large wood volume
Critical Shear Stress θ(ρs-ρ)gD, influenced by:+ Particle Diameter (D) + mass density of particles in water (ρs-ρ). shape, exposure, size variance, turbulence, relative submergence (θ) 77

LRB
S =
Log(
DLR
BS
= Lo
g(D
gmgm/D
*/D
* cbfcb
f))
Basin + Riparian Disturbance IndexBasin + Riparian Disturbance Index
Relative Bed Substrate Stability vs DisturbanceRelative Bed Substrate Stability vs Disturbance(Coast Range Ecoregion (Coast Range Ecoregion –– OR and WA)OR and WA)
“Fining”
“Armoring”
Dgm=D*cbf
88

Is Relative Bed Stability important to fish and bugs ?
LRBS: Log(Dgm/D*cbf)
Fish
IBI
EPT
Taxa
Ric
hnes
s
x = Bedrock >20% x = Bedrock >20%
(Data from OR/WA Coast Range REMAP ’94-’95)
99

National Wadeable Streams Assessment: Extent and Relative Risk of Stressors to Biological Condition
Relative Risk relates stressor condition and biological condition by estimating the increased likelihood of poor biological condition when a given stressor is rated in poor condition. (This calculation treats each stressor independently and does not account for the effects of combinations of stressors.) 1010

One Approach for Setting RBS Criteria for Excess Fine Sediments
(Used in National Wadeable Streams Assessment for defining “good” and “poor” condition)
**No sediment or instream biota info used to define reference sites
(percentiles of ecoregional reference site distribution of RBS)
25th/10th XER, NPLXER, NPL, SPL,TPL, CPL, SAP, NAP
Ref sites Ref sites disturbeddisturbed
Higher quality Higher quality ref sitesref sites
WMT (PNW, SW NR,SR), UMW25th/5th
1111

Relative Bed Stability Relative Bed Stability ---- Excess Fines Excess Fines (low end of RBS)(low end of RBS)
RegionRegion “Good” “Good” “Poor”“Poor”Coastal PlainCoastal Plain > > --2.42.4 > > --3.13.1Northern Plains Northern Plains > > --2.02.0 > > --2.62.6Southern PlainsSouthern Plains > > --2.02.0 > > --2.62.6Temperate PlainsTemperate Plains > > --2.02.0 > > --2.62.6Upper MidwestUpper Midwest > > --1.31.3 > > --1.51.5S. AppalachiansS. Appalachians > > --0.60.6 > > --1.21.2N. AppalachiansN. Appalachians > > --0.90.9 > > --1.41.4N.RockiesN.Rockies > > --1.11.1 > > --1.81.8Pac NorthwestPac Northwest > > --0.70.7 > > --1.31.3Southwest Southwest MtsMts > > --0.90.9 > > --1.61.6S. RockiesS. Rockies > > --0.60.6 > > --1.31.3Xeric RegionsXeric Regions > > --0.90.9 > > --1.71.7
1212

Field Protocol ComponentField Protocol ComponentThalwegThalweg ProfileProfile X X XX X XSlopeSlope X XX XChannel/Bank XChannel/Bank X--SectsSects XXSubstrate PebbleSubstrate Pebble--CountCount XXWood TallyWood Tally XXFish Cover Fish Cover EstsEsts XXRiparian Riparian VegVeg CvrCvr & & StructStruct XXHuman Disturbance TallyHuman Disturbance Tally XX
RelBedStab
RelBedStab
HabComplex
HabComplex
RipVegRipVeg Stru
ctStru
ct
Rip Distu
rb
Rip Distu
rb
ResidResidPoo
lPoo
l
1313

% Variance Explained Using Different Habitat Assessment Approaches in MLR
0102030405060708090
Fish Spp IBI EPT_taxa HBI
RBP
PHab
Mid-Atlantic Region Streams (7/97)
1414

% Variance Explained Using Different Habitat Assessment Approaches in MLR
0102030405060708090
100
IBI Fish Spp EPT_taxa
WS+CH
WS+CH+RBP
WS+CH+PHab
Mid-Atlantic Lowland Streams1515

Habitat Quality
Inde
x o f
Bio
tic I n
teg r
ityMultivariate Index of Habitat QualityMultivariate Index of Habitat Quality
1616

Multimetric Habitat Quality Index, built from Habitat “Response Curves”
“QU
ALI
TY”
1
MODELLED RESPONSES :* Monotonic Increase
* Monotonic Decrease
* Threshold Response
-- Hi, Low, Both
* Hyperbolic
1
00
HABITAT MEASUREMENT1717

Hab
itat Q
ualit
y
Disturb, % Dry, Shear Stress, Fines
Ripar Veg Complexity
Most Hab Volume Var’s
Canopy CoverMost Fish Cover Var’s
1818
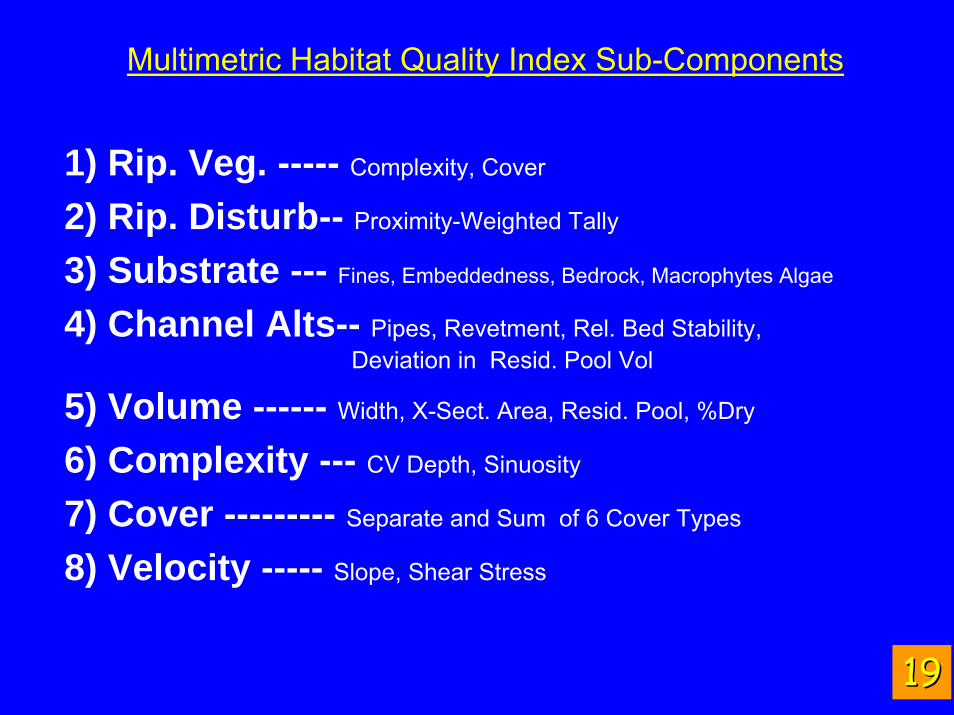
Multimetric Habitat Quality Index Sub-Components
1) Rip. Veg. ----- Complexity, Cover
2) Rip. Disturb-- Proximity-Weighted Tally
3) Substrate --- Fines, Embeddedness, Bedrock, Macrophytes Algae
4) Channel Alts-- Pipes, Revetment, Rel. Bed Stability, Deviation in Resid. Pool Vol
5) Volume ------ Width, X-Sect. Area, Resid. Pool, %Dry
6) Complexity --- CV Depth, Sinuosity
7) Cover --------- Separate and Sum of 6 Cover Types
8) Velocity ----- Slope, Shear Stress
1919

Multimetric Habitat Quality IndexCalculation
Component 1 = Mean of Subcomponents
Component 2 = Mean of Subcomponents
--- etc for 8 Components
Quality Index = (1 x 2 x 3 x 4 x 5 x 6 x 7 x 8)
= Geometric Mean of Subcomponents
(1/8)
2020

IBI vs Phab Correlations R7 Streams (Signif p<.05) Spearman r * >.10, ** >.20, *** >.30 etc.)
Rveg Rdist Sub ChAlt Vol Comp Cov Velo QTPH1====================================================================Whole Reg . * *** *** . * * * ****----------------------------------------------------------------------------------------------------E. Lowland * . *** **** . ** . ** ****
Uplands . . . . . ** . **** **
W. Plains . . *** *** . . . . ****-------------------------------------------------------------------------------------------------------------------
Width <5m . . *** ** . . . . ***
Width 5-32 . * **** ***** . **** * *** *****
Width >32 (**) **** (**) (***) (**) (**) (**) . (**) 2121

QUESTIONS?QUESTIONS?QUESTIONS?
2222


% Variance Explained Using Different Habitat Assessment Approaches in MLR
0102030405060708090
Fish Spp IBI EPT_taxa HBI
RBP
QPH
PHab
Mid-Atlantic Region Streams (7/97)

Algebra for Deriving Algebra for Deriving D*D*cbfcbf
•• Bankfull ShearBankfull Shear = = ρρgRgRbfbfSS•• Critical ShearCritical Shear = = θθ((ρρss--ρρ)gD)gD•• EquateEquate ρρgRgRbfbfS = S = θθ((ρρss--ρρ)gD)gD•• Rearrange:Rearrange:
D*D*cbfcbf = = ((ρρgRgRbfbfS) / [S) / [θθ((ρρss--ρρ)g])g]•• Substitute values:Substitute values:
D*D*cbfcbf = (0.604 / = (0.604 / θθ) ) RRbfbfSSif if θθ=0.044=0.044 D*D*cbfcbf = 13.7 = 13.7 RRbfbfSS

Expected Streambed Particle Size
Over time, streams adjust transport to match sediment supply.
Where transport limited by competence, Bed substrate Dgm in minimally disturbed streams should tend towards D*cbf, the size the stream is capable of moving as bedload at bankfull (RBS = DRBS = Dgmgm/D*/D*cbfcbf not not far from 1 in reference sites (Logfar from 1 in reference sites (Log1010RBS=0) RBS=0)
Where transport limited by capacity, Dgm in minimally disturbed streams should tend towards values lower than D*cbf, with reference RBS values considerably reference RBS values considerably lower than 1 (Loglower than 1 (Log1010RBS<0), but higher than in RBS<0), but higher than in streams of similar type, but having large streams of similar type, but having large anthopogenicanthopogenic sediment sources.sediment sources.

Hydrologic Alteration, which can result from:Hydrologic Alteration, which can result from:-- Change in precipitation or runoffChange in precipitation or runoff-- Water withdrawal or augmentationWater withdrawal or augmentation
Channel Incision Channel Incision –– a result of increase in sediment a result of increase in sediment transport relative to sediment supply:transport relative to sediment supply:
-- Increase in storm flows?Increase in storm flows?-- Decrease in bed and bank stability?Decrease in bed and bank stability?-- Decrease in sediment supply or size ?Decrease in sediment supply or size ?-- Change in channel slope/sinuosity/roughness ?Change in channel slope/sinuosity/roughness ?
Challenges for Future Assessments:Challenges for Future Assessments:

How has PHab been used to evaluate condition of streams?
EMAP-West Assessment:Regional Population Estimates of the relative extent of major stressors on stream condition and the relative risk of having poor fish biotic integrity, given stressor level at “most disturbed” condition (with 90% confidence intervals). Criterion for poor condition based on percentiles of ecoregionally-specific reference sites.

Fine particles fill spaces between larger particles, reducing waFine particles fill spaces between larger particles, reducing water ter circulation, habitat space and diversity for invertebrates, bentcirculation, habitat space and diversity for invertebrates, benthic hic fishes, and spawning habitat for other fishes.fishes, and spawning habitat for other fishes.
%Fines (<16mm)
EPT like coarse substrate
EP
T R
ichn
ess
(OR
WA
)

Observed = Critical
Observed = Critical
Bed Surface Particle DBed Surface Particle Dgmgm vs Adjusted D*vs Adjusted D*cbf cbf (104 Oregon and Washington Coast Range Streams)(104 Oregon and Washington Coast Range Streams)
“Armoring”
“Fining”LowMediumHigh
Riparian Disturbance

LRB
S =
Log(
DLR
BS
= Lo
g(D
gmgm/D
*/D
* cbfcb
f))
Basin + Riparian Disturbance IndexBasin + Riparian Disturbance Index
Relative Bed Substrate Stability vs DisturbanceRelative Bed Substrate Stability vs Disturbance(Coast Range Ecoregion (Coast Range Ecoregion –– OR and WA)OR and WA)
“Fining”
“Armoring”
Dgm=D*cbf

LRB
S: L
og(D
gm/D
cbf)
Riparian Condition Class
Relative Bed Substrate Stability (RBS)responsive in many regions
EMAP-West (n=900, 12 States) Mid Atlantic Ridge (X) Valley (.)(n=84)
Basin Land Use Disturbance (%)
Riparian Disturbance:Low Med High

How has RBS been used to evaluate condition of streams?
Mid-Atlantic Highlands Assessment and draft Mid Atlantic Integrated Assessment:Regional Population Estimates of the relative extent of major stressors on stream condition. Each bar represents the proportion of stream length in poor condition for that stressor, with 90% confidence intervals around each estimate. Criterion for poor condition: RBS < 1st percentile of ecoregionally-specific reference sites.
( in Piedmont/Coastal Plain: -2.0; in remainder of Region, -0.9 )
RBS
RB
S

Stressor Extent
0 10 20 30 40 50 60
Non-native Fish
Bank/Riparian Condition
Total Phosphorus
Excess Sediment
Total Nitrogen
Percent Stream Length
REMAP Results: “Condition of WarmREMAP Results: “Condition of Warm--Water, Perennial Water, Perennial Streams in the Eastern Plains of Montana” T. Johnson et al. Streams in the Eastern Plains of Montana” T. Johnson et al.
(2005 DRAFT) (2005 DRAFT)
LRBS Values:> -2.2 “good”-2.7 to -2.1 “fair”< -2.8 “poor”

EMAP/WSA Physical Habitat EMAP/WSA Physical Habitat Protocol for Protocol for WadeableWadeable StreamsStreams
•• Randomized Reach LocationRandomized Reach Location
•• Length 40 x Wetted WidthLength 40 x Wetted Width
•• Measurements spaced Measurements spaced systematicallysystematically
•• Several levels of resolution Several levels of resolution

Reg7 IBI vs Habitat Quality Index(Red=Uplands, Blue=E.Lowlands, Green=W.Plains)