US ETF Primer, SIFMA Insights · The Baskin Robbins of Choices ... 15 Growth In The US ETF ... its...
38
Executive Summary SIFMA Insights Page | 1 SIFMA Insights: US ETF Primer September 2018
Transcript of US ETF Primer, SIFMA Insights · The Baskin Robbins of Choices ... 15 Growth In The US ETF ... its...

Executive Summary
SIFMA Insights Page | 1
SIFMA Insights: US ETF Primer
September 2018

Executive Summary
SIFMA Insights Page | 2
Contents
Executive Summary ................................................................................................................................................................................... 4
Defining Exchange-Traded Funds .............................................................................................................................................................. 5
ETFs Are One Type of ETP ........................................................................................................................................................................ 5
The History of ETFs ................................................................................................................................................................................... 5
The Baskin Robbins of Choices ................................................................................................................................................................. 5
ETF versus Other Investment Products...................................................................................................................................................... 7
ETF Legal Structures ............................................................................................................................................................................... 10
ETF Regulation ........................................................................................................................................................................................ 11
History and Required Exemptive Relief .................................................................................................................................................... 11
Current and Proposed Regulations .......................................................................................................................................................... 12
Global ETP and US ETF Landscapes ...................................................................................................................................................... 15
Growth In The US ETF Market ................................................................................................................................................................. 18
Growth in AUM by Type of ETF ................................................................................................................................................................ 19
Growth in Number of ETFs by Type ......................................................................................................................................................... 20
Net Inflows by Type of ETF ...................................................................................................................................................................... 22
ETF Net Inflows and MF Net New Cash Flow .......................................................................................................................................... 24
ETF Creation/Redemption Process .......................................................................................................................................................... 25
Thoughts on ETF Liquidity........................................................................................................................................................................ 28
Secondary Market Volumes ..................................................................................................................................................................... 29
Market Share Overview ............................................................................................................................................................................ 32
Market Shares Across Exchange and Off-Exchange Trading .................................................................................................................. 32
Market Share by Providers ....................................................................................................................................................................... 33
Appendix .................................................................................................................................................................................................. 34
Appendix: Mutual Funds Statistics for Comparison .................................................................................................................................. 34
Appendix: Closed-End Funds Statistics for Comparison .......................................................................................................................... 35
Appendix: Unit Investment Trusts Statistics for Comparison .................................................................................................................... 36
Appendix: Terms to Know ........................................................................................................................................................................ 37
Authors ..................................................................................................................................................................................................... 38

Executive Summary
SIFMA Insights Page | 3
Disclaimer: This document is intended for general informational purposes only and is not intended to serve as investment
advice to any individual or entity.
SIFMA is the leading trade association for broker-dealers, investment banks and asset managers operating in the U.S. and global
capital markets. On behalf of our industry’s nearly 1 million employees, we advocate on legislation, regulation and business policy,
affecting retail and institutional investors, equity and fixed income markets and related products and services. We serve as an industry
coordinating body to promote fair and orderly markets, informed regulatory compliance, and efficient market operations and resiliency.
We also provide a forum for industry policy and professional development. SIFMA, with offices in New York and Washington, D.C., is
the U.S. regional member of the Global Financial Markets Association (GFMA). For more information, visit http://www.sifma.org.
This report is subject to the Terms of Use applicable to SIFMA’s website, available at http://www.sifma.org/legal.
Copyright © 2018
SIFMA Insight Primers
The SIFMA Insights primer series is a reference tool that goes beyond a typical 101 series. By illustrating important technical and regulatory nuances, SIFMA Insights primers provide a fundamental understanding of the marketplace and set the scene to address complex issues arising in today’s markets.
The SIFMA Insights primer series, and other Insights reports, can be found at: https://www.sifma.org/insights
Guides for retail investors can be found at http://www.projectinvested.com//markets-explained

Executive Summary
SIFMA Insights Page | 4
Executive Summary
Exchange-traded funds (ETFs) are pooled investment vehicles holding an underlying basket of securities, whether it
be equities, bonds, commodities, currencies or hybrids. They trade intraday on exchanges and other trading venues
(similar to single stocks) and are priced based on market demand for their shares, typically driven by the underlying
securities’ prices1. ETFs can be broken out by asset class, region, investment style, or a number of other
classifications, providing investors a multitude of choices to meet many different investment objectives.
ETFs differ from mutual funds (MFs) in a variety of ways, in particular increased price transparency and intraday
liquidity2 from being traded on exchanges. ETFs may also provide greater tax efficiencies and, in general, lower total
expense ratios (albeit this can vary by fund), compared to MFs with similar investment strategies. Morningstar
estimates ETFs cost one-third the price of an average MF and carry one-half of the tax expense of the average
actively managed MF (as of FY17; this can vary by fund). In light of their general cost efficiency, ETFs have shown
strong demand from individual and institutional investors, both of which are cost sensitive. Although most ETFs are
structured similarly, they can come in varying legal structures which can impact capital distributions (dividends) and
have tax implications. While there has always been individual investor appeal, ETF usage by institutional investors
in portfolio management strategies continues to grow as well.
U.S. domiciled ETFs have seen significant growth since 2000, growing at a 24.5% CAGR for the total market to $3.4
trillion as of FY17. Yet, the U.S. domiciled ETF market is still small compared to other U.S. markets – fixed income
markets are 11.6x greater then ETFs; equities are 9.4x ETFs; and MFs are 5.5x ETFs. A truer parallel can be drawn
between investment products, ETF and MFs, as well as to the growth experienced in the development of the MF
industry. Since 2000, ETFs grew at a 25% CAGR, versus 6% for MFs.
What makes ETFs unique is the creation/redemption process, which increases or decreases the number of ETF
shares available to the market, based on investor demand. As detailed in this report, authorized participants (APs
deliver a specified basket of underlying securities (creation basket; APs may also provide cash) to the ETF – the
primary market. The ETF will then provide the AP with a fixed amount of ETF shares (creation units; large blocks of
shares, typically ranging from 25,000 to 200,000), increasing the supply of ETF shares in the market. (The reverse
is done by buying back a redemption basket from the ETF, which then takes back creation units to decrease the
supply of ETF shares in the market.) APs can sell all or part (they may hold some for their own inventory) of the
creation units on exchanges and other trading venues – the secondary market. Responding to supply and demand
imbalances in the market – when the price of an ETF share does not equal the price of the underlying securities –
APs add to (or reduce) the number of ETF shares available. This arbitrage process keeps the ETF share price close
to net asset value, which is primarily determined by the market prices of the securities held in the ETF’s portfolio,
and meets market liquidity needs.
1 Throughout this report, we use the terminology underlying securities to include a broad category of potential assets, such as: stocks, bonds, commodities and other investments. 2 Liquidity is defined as ease with which an asset (ETF shares, MF shares or single stocks) can be quickly and efficiently bought or sold in the market without significantly affecting its price.

Defining Exchange-Traded Funds
SIFMA Insights Page | 5
Defining Exchange-Traded Funds
ETFs Are One Type of ETP
Exchange-traded products (ETPs) are portfolio exposure investment products which trade on exchanges. The most
common ETPs include exchange-traded funds (ETFs) and exchange-traded notes (ETNs). ETFs are pooled
investment vehicles holding an underlying basket of securities, whether it be equities, bonds, commodities,
currencies or hybrids. They trade intraday on exchanges and other trading venues (similar to single stocks) and are
priced based on market demand for their shares, typically driven by the underlying securities’ prices. ETNs differ
from ETFs in that they are structured investment products issued as senior unsecured debt notes and backed by the
creditworthiness of their issuer, i.e. ETNs possess credit risk.
The History of ETFs
The first attempt at a pseudo ETF can be traced back to the 1989 launch of Index Participation Shares for the S&P
500 (these were eventually deemed similar to futures contracts and ordered to trade on futures exchanges). Then in
1990, the Toronto Stock Exchange launched Toronto 35 Index Participation Units (TIPs 35), which were a
warehouse receipt-based instrument tracking the TSE-35 Index.
Finally, State Street launched the first true ETF in the U.S. in 1993, the S&P 500 Trust ETF (SPY).
The Baskin Robbins of Choices
ETFs provide investors with a multitude of choices to meet many different investment objectives. (There are several
hundred categories listed on etf.com.) Common language used when analyzing ETFs and types of ETFs (or the
ETF may be a combination of types) include, but are not limited to:
• Index-Based – According to Investment Company Institute FY17 data, 97% of all U.S. domiciled ETFs are
index-based. Index-based ETFs track the performance of a reference index, with portfolio holdings (typically)
fully transparent (daily disclosure of basket securities or portfolio holdings). These ETFs can replicate every
security in the index, investing all of its assets proportionately. Or, the ETFs can sample an index by holding
a representative selection of index securities (or non-index securities with similar performance attributes)
and/or weighting its holdings differently. Sampling is often more practical for large indexes, such as total
stock market or bond indexes.
• Actively Managed – Actively managed ETFs pursue an investment objective and policy – for example,
follow a specific sector in the stock market – with the securities selected by a portfolio manager. As they do
not follow a specific index, style drift can occur with actively managed ETFs, whereby the fund strays from
its investment objective either due to market cap appreciation or a change in portfolio managers, etc.
(meaning an investor may not be investing in the strategy they thought they were). While this most common
in actively managed MFs, it may potentially occur in actively managed ETFs.

Defining Exchange-Traded Funds
SIFMA Insights Page | 6
• Non 1940 Act ETFs – These are funds not registered with the SEC under the Investment Company Act of
1940.
• Funds of Funds – An investment strategy where an ETF invests in other funds.
• Asset Class – Equities, fixed income, commodities, currency or alternatives; with each broad category
having multiple sub categories as well.
• Region – Based on the broad market of domestic securities only; based on a sector of domestic securities
only; international securities; country specific (U.S., Australia, U.K, etc.); or regional groupings (developed,
emerging, BRICs, etc.).
• Sectors/Groups/Industries – Financials, healthcare, retail, infrastructure, merger arbitrage, trend following,
environment, artificial intelligence, etc.
• Investment Style – These can include, among others:
o Broad market (attempts to represent 100% of total market cap)
o Market cap (large, mid, small)
o High dividend yield
o Volatility (linked to volatility futures, the VIX)
o Smart beta (rules-based strategies aiming to deliver better risk-adjusted returns than traditional
market-cap-weighted indexes)
o Alpha seeking (attempt to outperform the market)
o Leveraged3 – Use derivatives and debt to produce a return that is a multiple of the underlying index
o Inverse3 – Use derivatives to profit from a decline in the value of an underlying benchmark (similar to
a short position on a stock)
3 Most leveraged and inverse ETFs reset daily, i.e. they are designed to achieve their stated objectives on a daily basis, or another specified time period.

ETF versus Other Investment Products
SIFMA Insights Page | 7
ETF versus Other Investment Products Investors have many types of products to choose from – stocks versus bonds; individual securities versus
exchange-traded funds (ETFs), closed-end funds (CEFs), unit investment trusts (UITs) or mutual funds (MFs); style
of a select fund, based on investment objective; etc. In addition to fund specific factors, there are many moving
pieces that go into an investment decision. Investors look not just at the investment product itself. Rather, they think
through their own objectives in totality, and different investors will need unique investment products to meet their
own individual needs. In this report, we assess similarities and differences between ETFs and MFs (among the most
common investment vehicles in the U.S.), showing comparisons to single stocks where applicable.
• Similarities – Both ETFs and MFs hold baskets of underlying securities and are most commonly structured
as open-end funds. They both post mark-to-market NAVs at the end of the trading day.
• Differences – ETFs differ from MFs in a variety of ways, in particular increased price transparency and
intra-day liquidity4 from being traded on exchanges. ETFs may also provide greater tax efficiencies and, in
general, lower total expense ratios (albeit this can vary by fund), compared to MFs with similar investment
strategies. Morningstar estimates ETFs cost one-third the price of an average MF and carry one-half of the
tax expense of the average actively managed MF (as of FY17; this can vary by fund).
Common similarities and differences between ETFs and MFs are summarized below:
(These are generalizations, and some types of funds within each category could stray from these points. For example: there are no-
load MFs, some MFs do not have redemption fees and some MFs may not have investment minimums.)
Note: MFs do not trade on exchanges and therefore do not have trading commissions as defined in this table; they do have other sales charges/loads.
Tax efficiencies can be dependent upon fund structure (discussed in more detail below).
4 Liquidity is defined as ease with which an asset (ETF shares, MF shares or single stocks) can be quickly and efficiently bought or sold in the market without significantly affecting its price.
ETF MF
Single
Stock
Ability to Track Index X X
Diversification X X
Provide Investment Product Options X X
Professional Management X X
Exchange Traded X X
Price Transparency, as defined by:
Intraday Trading X X
Intraday Pricing X X
Total Expenses
Sales Charges/Loads X
Investment Minimums X
Operating Expenses (management fees, other) X X
Redemption Fees X
Tax Efficiency X X
Trading Commissions (secondary market) X X

ETF versus Other Investment Products
SIFMA Insights Page | 8
Further details on similarities and differences between ETFs and MFs include:
(These are generalizations, and some types of funds within each category could stray from these points.)
• Strategy – Both are a collection of underlying securities, built around a specific investment objective or
strategy. Actively managed ETFs and MFs strive to utilize a manger’s expertise to outperform market
benchmarks or select index(s). Most MFs (and some ETFs) are actively managed, requiring an investment
style objective (albeit managers have some leeway in security selection). Conversely, index-based ETFs
and MFs seek to match, or track, benchmark performance as close to exactly as possible.
• Diversification – Investors can get diversification in their portfolio via MFs or ETFs, which differs from
investing in single individual stocks (albeit, a portfolio or basket of stocks can provide diversification).
• Transparency – ETFs are traded intraday on exchanges or other trading venues (similar to stocks), which
brings increased price transparency through intraday pricing and trading capabilities, and most are required
to disclose portfolio holdings daily. MFs are not traded on an exchange, and their shares are only issued at
the current day’s closing price, or NAV, with holdings generally disclosed quarterly. Given the lengthy
disclosure time horizon, managers of actively managed mutual funds can experience style drift, or a
divergence from a fund’s investment style or objective.
• Pricing – ETF shares are traded intraday on exchanges or other trading venues (secondary market), like
individual stocks, whereas MFs are purchased through the fund company or financial intermediaries
(primary market). MFs are forward priced – all orders received during the day are transacted at the same
price, the NAV (which is reset only when it is next computed, typically 4:00 PM ET to match the close of U.S.
equities trading). In the primary market, ETFs operate similarly to MFs, via authorized participants
(discussed later in this report). Yet, ETF shares (secondary market) are continuously traded on exchanges
and other trading venues and priced at market-determined rates. Investors may transact at different prices,
which may vary from end-of-day NAV.
• Liquidity – Liquidity can be described as the ease with which an asset (ETF shares, MF shares, stocks) can
be quickly and efficiently bought or sold in the market without significantly affecting its price, which is
enhanced by price transparency and ease of execution (speed, ability to fill the entire order). With increased
price transparency and continuous pricing brought on by intraday exchange trading, ETFs are typically
considered more liquid than MFs on an intraday basis (MFs have end of day liquidity).
• Total Expenses – Part of an investment decision will be around costs, and total expenses may vary widely
among both types of funds and within each category of funds. Some ETF transactions include trading
commissions (transaction costs), like a stock, which are paid directly by investors to the broker. MFs do not
have trading commissions. Rather, MF expenses may include sales charges (loads) or redemption fees,
paid directly by investors. ETFs and MFs have expense ratios, equal to operating costs divided by the
average dollar AUM. This ratio is calculated annually at the fund’s fiscal year end, with the largest and most

ETF versus Other Investment Products
SIFMA Insights Page | 9
variable piece typically representing the management fee. Both MFs and ETFs have management fees.
Other fees in the expense ratio include (not every ETF or MF will have all these fees): custodial and
administrative, index licensing, legal and accounting, marketing (12b-1 fees), acquired fund fees if investing
in other funds, etc. The expense ratio is subtracted from the fund itself, lowering the return on investment.
Typically, actively managed funds carry higher expense ratios than index-based strategies, which is why
ETFs generally have lower expense ratios (97% of ETFs are index-based).
• Taxes5 – For investments held in taxable accounts, ETFs can be more tax efficient than MFs. As almost all
ETFs are index-based, there is generally less turnover of the underlying securities which generates fewer
taxable capital gains than actively managed funds (which most MFs are). Since ETFs generally utilize an in-
kind creation/redemption process, investors exchange ETF shares for a basket of securities, rather than
cash, from the ETF. ETF managers do not have to sell holdings to meet redemptions, sales which could
trigger net capital gains that could be allocated to fund shareholders. ETF investors with taxable accounts
can incur taxable capital gains when the ETF creates and redeems shares to rebalance its holdings. ETFs
(and stocks) may also generate taxable capital gains when an investor sells shares.
MF investors redeem shares directly from the fund, sometimes requiring the manager to sell appreciated
securities to meet the redemption, and potentially incurring net capital gains. Net gains are passed to other
current investors, even if the gains are attributed to prior periods of ownership. These general guidelines are
not universal. MFs can be tax efficient if the fund contains built-in losses or its managers minimize turnover,
and ETF shareholders can’t avoid capital gains taxes on the overall appreciation of their investment. The
difference is ETFs have more tools available to manage and minimize taxable capital gains that are passed
to ETF holders. However, ETFs have a structural advantage by virtue of the in-kind creation and redemption
process.
5 This document is intended for general informational purposes only and is not intended to serve as tax advice to any individual or entity. Readers are strongly urged to consult with a qualified tax professional before taking action based on the information presented here. In considering your investment options, it is important to keep in mind that the tax impact on an individual investor will depend on many factors, including the presence of other losses, and whether you are investing through a tax favored retirement account. It’s important to consult a tax advisor before making decisions based on tax considerations.

ETF Legal Structures
SIFMA Insights Page | 10
ETF Legal Structures
ETFs can come in varying legal structures, which can impact capital distributions (dividends) and tax implications.
The common types of legal structures include:
• Open-End Funds (OEFs) – The vast majority of ETFs are structured this way. Dividends and interest
received by the ETF can be immediately reinvested; derivatives, portfolio sampling, and (sometimes)
securities lending can be utilized.
• Unit Investment Trusts (UITs) – Used by a small number of ETFs tracking broad asset classes, these
ETFs generally hold a static investment portfolio and must fully replicate the indexes they track. There are
no boards of directors or investment advisors managing the portfolio, and these funds have less investment
flexibility than open-end ETFs. UITs do not reinvest dividends and are not permitted to lend securities in the
portfolios or use derivatives.
• Grantor Trusts – These ETFs typically invest in physical commodities or currencies. Grantor trusts must
hold a fixed portfolio and consider investors direct shareholders in the underlying basket of investments.
• Partnerships – One of the least common types of ETFs, these structures are unincorporated business
entities (similar to statutory trusts or limited partnerships) electing to be taxed as a partnership. These ETFs
can include different types of investments, such as futures, providing exposure to currencies or commodities
that are hard to store physically (ex: natural gas, oil).

ETF Regulation
SIFMA Insights Page | 11
ETF Regulation
History and Required Exemptive Relief
All of the ETF legal structures discussed above are regulated by the SEC and subject to the Securities Act of 1933
and the Securities Exchange Act of 1934. Only OEFs and UITs are also regulated under the Investment Company
Act of 1940 (‘40 Act). On the commodities side, partnerships are usually regulated as commodity pools by the
CFTC, while grantor trusts are not regulated by the CFTC.
The majority of ETFs are registered with the SEC and operate under the same rules as MFs. In order to register
under the ‘40 Act, ETFs must first receive exemptive relief from certain provisions which apply to other funds, such
as MFs. MFs can only sell and redeem shares at NAV and must redeem any shares presented by a shareholder
(not exchange traded). ETFs operate differently and therefore need exemptive relief from certain provisions of the
‘40 Act, including:
• Creation and Redemption (discussed in detail later in this report) – ETFs need relief to enable the
creation/redemption process. ETFs only redeem securities (a) to authorized participants (APs), not
shareholders; and (b) in creation units, not individual shares.
Under the ‘40 Act, redeemable securities can be redeemed by any shareholder for the share of the issuer’s
current net assets.
• Exchange Trading – ETF shares trade on exchanges at market prices rather than NAV. Relief is granted
only to ETFs complying with conditions facilitating the arbitrage process (daily disclosure of portfolio
holdings, intraday indicative value disclosure, listed on an exchange, etc.).
Under the ‘40 Act, redeemable securities must be sold at NAV.
• In-Kind Transactions with Affiliates – ETFs require relief to enable the creation/redemption process.
Otherwise, APs for an early-stage ETF could be considered affiliated persons, triggering certain prohibitions.
Under the ‘40 Act, affiliated persons (own at least 5% of the issuer’s outstanding voting securities) of a fund
are prohibited from buying securities from or selling them to a fund.
• Redemption Proceeds Delivery Time – ETFs require relief when trading in foreign markets, given
differences in market hours and potential market holiday schedules.
Under the ‘40 Act, funds cannot postpone the completion of redemption requests for greater than seven
days.
• Additionally, most ETFs have obtained exemptive relief to permit other funds to invest in ETFs in excess of
prescribed limits.

ETF Regulation
SIFMA Insights Page | 12
The core investor protections on risks and conflicts of interest under the ‘40 Act still apply to ETFs. ETFs must also
seek relief from certain Securities Exchange Act rules (for example, activities of broker-dealers related to the
distribution of ETF shares). Section 19(b) of the Securities Exchange Act requires an exchange to obtain SEC
approval to list or trade a new ETF. The SEC has approved rules for many exchanges allowing index-based and
actively managed ETFs meeting SEC-approved generic listing requirements to be listed without SEC approval.
Until 2008, exemptive relief was only granted for index-based ETFs. After 2008, some actively managed ETFs
received exemptive relief, if they were fully transparent and met certain requirements (daily disclosures on their
public website listing the securities in the fund with their weights).
Current and Proposed Regulations
Securities Act of 1933
http://legcounsel.house.gov/Comps/Securities%20Act%20Of%201933.pdf
Catalyst: The stock market crash of 1929
Objective: (1) Ensure transparency in financial statements to assist investors in making informed decisions; (2)
prohibit deceit, misrepresentation and other fraud in the sale of securities
Details:
Also known as the Securities Act or Truth in Securities Act, this was the first federal law used to regulate the stock
market and the first major law on the sale of securities, which had historically been governed by state laws.
Importantly, the act created a uniform set of rules to protect investors against fraud.
The Securities Act required companies to register with the SEC prior to going public, providing relevant financial and
other information in a prospectus and registration statement. Information required included: corporate description of
properties and businesses; management information; financial statements certified by an independent account; and
a description of the security being offered. Some exemptions from the registration requirement existed (private
offerings to a limited number of persons or institutions; offerings of limited size; intrastate offerings; and securities of
municipal, state and federal governments).
Securities Exchange Act of 1934
http://legcounsel.house.gov/Comps/Securities%20Exchange%20Act%20Of%201934.pdf
Catalyst: The stock market crash of 1929
Objective: (1) Create the SEC to regulate the securities industry; (2) establish self regulation; (3) regulate
trading of securities

ETF Regulation
SIFMA Insights Page | 13
Details:
Also known as the Exchange Act, this law empowered the SEC with broad authority over all aspects of the
securities industry. It tasked the agency to register, regulate and oversee brokerage firms, transfer agents, and
clearing agencies as well as the nation's securities self-regulatory organizations (SROs). This act identified and
prohibited certain types of conduct and provided the SEC with disciplinary powers over regulated entities and
persons associated with them. The Exchange Act also enabled the SEC to require periodic reporting of information
by publicly traded companies. Further, the act established supervised exchange self regulation, with direct and
flexible requirements for exchanges. On the direct side, exchanges must: register with the SEC; restrict broker-
dealer borrowing; and prohibit manipulative practices. Additionally, exchanges have discretion in monitoring their
markets, relying on self-regulation (the flexible aspect).
Investment Company Act of 1940
http://legcounsel.house.gov/Comps/Investment%20Company%20Act%20Of%201940.pdf
Catalyst: The stock market crash of 1929
Objective: (1) Require investment company registration; (2) regulate product offerings issued by investment
companies in public markets
Details:
Also known as the ‘40 Act, this act regulates the organization of companies, including mutual funds, engaging
primarily in investing, reinvesting and trading in securities, whose own securities were offered to the investing public.
The regulation was designed to minimize conflicts of interest by requiring disclosure of these companies’ financial
condition and investment policies to investors when stock is initially sold, and on a regular basis thereafter. The
focus of the disclosures is on: fund details; investment objectives; and investment company structure and
operations.
Proposed Rule 6c-11
https://www.sec.gov/news/press-release/2018-118
Catalyst: A need to modernize regulations to match changes in the markets
Objective: Permit ETFs to operate within the Investment Company Act of 1940 without an exemptive order
Details:
In June 2018, the SEC proposed Rule 6c-11 of the Investment Company Act of 1940 to permit ETFs satisfying
certain requirements to organize and operate without the expense and delay of obtaining an exemptive order. The
objective is to ease regulatory burdens of bringing ETFs to market and create a level playing field for ETF sponsors.

ETF Regulation
SIFMA Insights Page | 14
This includes: rescinding prior exemptive orders; allowing custom creation/redemption baskets; and eliminating the
classification between index-based and actively managed ETFs (the rule does not create a distinction between
actively managed and index-based products).
Highlights of conditions in the proposed rule include:
• Transparency – ETF sponsors would be required to post portfolio holdings on their website daily.
• Custom Baskets Policies and Procedures – An ETF sponsor may use custom baskets (those not
reflecting a pro-rata representation of the fund’s portfolio or differing from other baskets used in transactions
on the same business day) if they have written policies and procedures for custom basket construction and
parameters.
• Website Disclosure – The proposed rule would require website disclosures (historical premiums/discounts,
bid-ask spreads and information on creation/redemption baskets).
Proposed rule 6c-11 would be available to ETFs organized as open-end funds. ETFs organized as UITs, ETFs
structured as a share class of a multi-class fund and leveraged or inverse ETFs would not be able to rely on the
proposed rule.

Global ETP and US ETF Landscapes
SIFMA Insights Page | 15
Global ETP and US ETF Landscapes
As of December 2017, there was $4.8 trillion in global ETP AUM and a total number of 6,354 ETPs, increasing 5%
and 36% Y/Y respectively. $633 billion in assets flowed into global ETPs in 2017, a 67% increase Y/Y. The majority
of ETPs are in equity products, and the U.S. dominates the ETP landscape:
Source: BlackRock Global ETP Landscape, SIFMA estimates
Note: As of FY17. EU = European Union inclusive of the U.K. LatAm = Latin America; MENA = Middle East and Africa; AsiaPac = Asia Pacific
As over 97% of the total ETP landscape consists of ETFs and 72% of total ETPs are U.S. domiciled, this report
focuses on U.S. domiciled ETFs. The U.S. domiciled ETF market can be broken out as follows:
Source: Investment Company Institute (includes data from Strategic Insight Simfund), SIFMA estimates
Note: As of FY17. Other = non 1940 act (not SEC registered). Commodities = commodities, currencies and futures plus hybrids. Domestic-broad =
correlated with an entire market; domestic-sector = sector specific. Firms may have data that differs from this publicly available source, as they have
their own proprietary trading data.
Equities, 79%
Fixed Income,
16%
Other, 4%
Global ETP Landscape
US, 72%
EU, 16%
AsiaPac, 9%
Canada, 2%
MENA, 0.2% LatAm,
0.1%
Global ETP Landscape
Index, 97%
Other, 2% Active, 1%
US ETF Landscape
Equities, 81%
Bonds, 16%
Commodities, 2%
US ETF Landscape
Domestic -Broad, 58%
Domestic -Sector, 14%
International, 29%
Equity ETF Landscape

Global ETP and US ETF Landscapes
SIFMA Insights Page | 16
This U.S. ETF market can be further broken out to show management style and asset class allocations:
Source: Investment Company Institute (includes data from Strategic Insight Simfund), SIFMA estimates
Note: As of FY17. Commodities = commodities, currencies and futures. Firms may have data that differs from this publicly available source, as they
have their own proprietary trading data.
While there has been significant growth in the U.S. ETF market, the market is still small compared to other U.S.
markets. For example:
• Fixed income markets are 11.6x greater then ETFs
• Equities are 9.4x ETFs
• MFs are 5.5x ETFs
Source: Bank for International Settlements, World Federation of Exchanges,
Investment Company Institute (includes data from Strategic Insight Simfund), SIFMA estimates
Note: As of FY17
Total Indexed Active
Non-
1940 Act Equities Bonds Commodities Hybrid
AUM ($B) 3,400.7 3,288.5 44.9 67.3 2,770.7 553.3 68.9 7.8
% of Total 96.7% 1.3% 2.0% 81.5% 16.3% 2.0% 0.2%
Number 1,832 1,569 194 69 1,399 309 91 33
% of Total 85.6% 10.6% 3.8% 76.4% 16.9% 5.0% 1.8%
39.3
32.1
18.7
3.4
0.1 0
5
10
15
20
25
30
35
40
Fixed Income Equity MF ETF UIT
Comparison of US Markets ($T)

Global ETP and US ETF Landscapes
SIFMA Insights Page | 17
While we wanted to show the size of U.S. ETF market in comparison to other markets, a truer parallel can be drawn
between investment products, ETF and MFs, as well as to the growth experienced in the development of the MF
industry.
We observed the following:
• Since the start of each market (the start of the data set: 1996 for ETFs, 1940 for MFs), ETFs grew at a 39%
CAGR, versus 15% for MFs
• Since 2000, ETFs grew at a 25% CAGR, versus 6% for MFs
• Since the financial crisis in 2008, ETFs recovered at a 20% CAGR, versus 7% for MFs
Source: Investment Company Institute (includes data from Strategic Insight Simfund), SIFMA estimates
3.5
6.8
12.0
15.0
18.7
0.002 0.1 0.6
1.0 2.0
3.4
0
2
4
6
8
10
12
14
16
18
20
199
6
199
7
199
8
199
9
200
0
200
1
200
2
200
3
200
4
200
5
200
6
200
7
200
8
200
9
201
0
201
1
201
2
201
3
201
4
201
5
201
6
201
7
Growth in ETF versus Mutual Fund AUM ($T)
MF ETF

Growth In The US ETF Market
SIFMA Insights Page | 18
Growth In The US ETF Market
ETFs have experienced significant growth since the early 2000s, given increased interest in low-cost index-based
investing strategies. ETFs hold many characteristics to meet this objective, including: intraday tradability, price
transparency, tax efficiency, (generally) lower total costs and the ability to gain access to markets or an asset class.
While there has always been individual investor appeal, institutional investors have adopted ETFs into portfolio
construction, adjustments and general strategy. Some market participants now discuss ETF investing more as an
active portfolio management strategy versus passive investing. Investors across the board are cost sensitive,
whether institutional or individual. On the individual investor side, financial advisors have seen an increase in clients
paying fees based on AUM (versus brokerage commissions). Advisors have adopted the use of ETFs to keep costs
down and assist in asset allocation strategies.
In addition to managing their portfolios, institutional investors use ETFs to decrease risk associated with single
security exposure or gain exposure to a country or region. Further, much has been written on the ability of ETFs to
provide liquidity to underlying securities in certain asset classes. Examples of use cases for ETFs include:
• As liquidity declined in certain fixed income markets, investors turned to ETFs to access more liquid
instruments, especially for large transactions. AUM in bond ETFs have grown at a 36.3% CAGR since
2000.
• Around 25% of today’s developed markets have a negative yield. While emerging markets present higher
yields, they can be hard to access. ETFs help investors access these markets and generate higher returns.
In light of this increase in demand by investors of all types, ETFs grew at a 24.5% CAGR from 2000 to 2017. We
assess ETF CAGRs by type and asset class:
Source: Investment Company Institute (includes data from Strategic Insight Simfund), SIFMA estimates
Note: As of FY17. Commodities = commodities, currencies and futures
This compares to the following CAGRs for other investment products (shown for AUM and then number): MFs 5.7%
and -0.1%; CEFs 3.7% and 0.5%; UITs 4.9% and -2.7%. (Please see the Appendix for more details on MFs, CEFs
and UITs.)
The following pages show growth in AUM and number of ETFs by: management type, asset class and specific
equity sectors.
Total Indexed Active
Non-
1940 Act Equities Bonds Commodities Hybrid
AUM 24.5% 24.3% 68.4% 38.6% 23.1% 36.3% 38.9% 46.3%
Number 19.0% 18.0% 31.0% 42.3% 17.2% 25.7% 45.6% 18.7%

Growth In The US ETF Market
SIFMA Insights Page | 19
Growth in AUM by Type of ETF
Source: Investment Company Institute (includes data from Strategic Insight Simfund), SIFMA estimates
Note: Other = non 1940 act (not SEC registered). Commodities = commodities, currencies and futures plus hybrids. Firms may have data that differs
from this publicly available source, as they have their own proprietary trading data.
151 226 296408
580 495702
888 934
1,207
1,597
1,9012,029
2,434
3,288
1
3 5
10
14
17
23
29
45
15
2936
75
101 109
120
64
57
48
62
67
66 83 102 151228
301423
608531
777
992 1,048
1,337
1,675
1,9752,101
2,524
3,401
0
500
1,000
1,500
2,000
2,500
3,000
3,500
2000 2001 2002 2003 2004 2005 2006 2007 2008 2009 2010 2011 2012 2013 2014 2015 2016 2017
US ETF AUM ($B) by Management Type
Index Active Other Total
66 83 98 146 218 281
387 545
438 595
753 754 973
1,363
1,618 1,707
2,030
2,771
9 15
21
35 57
107
138 184
243
246
296 340
427
553
29 36
75
101 110
121
66
60 53
68
77
66 83 102 151 226
296 408
608 531
777
992 1,048
1,337
1,675
1,975 2,101
2,524
3,401
0
500
1,000
1,500
2,000
2,500
3,000
3,500
2000 2001 2002 2003 2004 2005 2006 2007 2008 2009 2010 2011 2012 2013 2014 2015 2016 2017
US ETF AUM ($B) by Asset Class
Equities Bonds Commodities Total
Growth In The US ETF Market
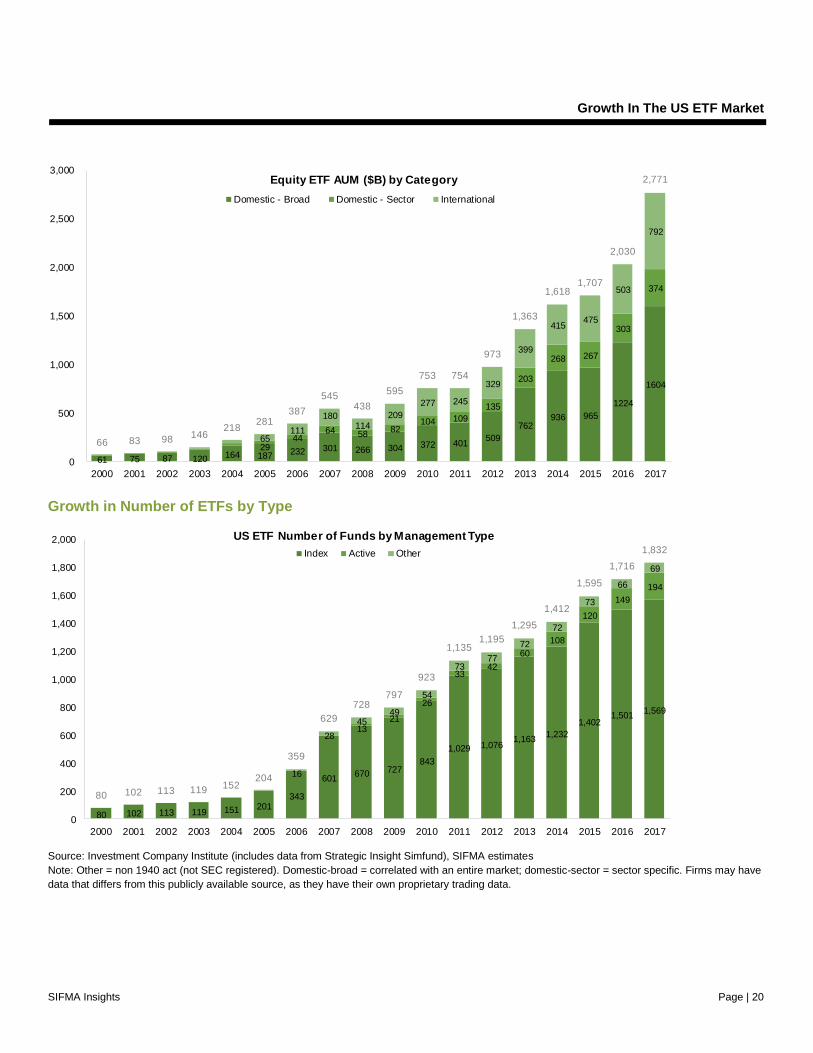
SIFMA Insights Page | 20
Growth in Number of ETFs by Type
Source: Investment Company Institute (includes data from Strategic Insight Simfund), SIFMA estimates
Note: Other = non 1940 act (not SEC registered). Domestic-broad = correlated with an entire market; domestic-sector = sector specific. Firms may have
data that differs from this publicly available source, as they have their own proprietary trading data.
61 75 87 120 164 187 232 301 266 304 372 401509
762936 965
1224
1604
2944
64 5882
104 109
135
203
268 267
303
374
65111
180114
209
277 245
329
399
415475
503
792
66 83 98146
218281
387
545438
595
753 754
973
1,363
1,6181,707
2,030
2,771
0
500
1,000
1,500
2,000
2,500
3,000
2000 2001 2002 2003 2004 2005 2006 2007 2008 2009 2010 2011 2012 2013 2014 2015 2016 2017
Equity ETF AUM ($B) by Category
Domestic - Broad Domestic - Sector International Total
80 102 113 119 151 201343
601670 727
843
1,029 1,0761,163
1,232
1,4021,501
1,569
1321
26
3342
60
108
120
149
194
16
28
4549
54
7377
72
72
73
66
69
80 102 113 119 152204
359
629
728797
923
1,1351,195
1,295
1,412
1,595
1,716
1,832
0
200
400
600
800
1,000
1,200
1,400
1,600
1,800
2,000
2000 2001 2002 2003 2004 2005 2006 2007 2008 2009 2010 2011 2012 2013 2014 2015 2016 2017
US ETF Number of Funds by Management Type
Index Active Other Total

Growth In The US ETF Market
SIFMA Insights Page | 21
Source: Investment Company Institute (includes data from Strategic Insight Simfund), SIFMA estimates
Note: Commodities = commodities, currencies and futures plus hybrids. Domestic-broad = correlated with an entire market; domestic-sector = sector
specific. Firms may have data that differs from this publicly available source, as they have their own proprietary trading data.
80 102 105 113 145 195 337
547 615 645
734
885 901 966
1,047
1,219 1,329
1,399
6
6
49
6298
128
168202
238
264
274
285
309
33
51 54
61
82 92
91
101
102
102
124
80 102 113 119 152
204
359
629
728 797
923
1,135 1,195
1,295
1,412
1,595
1,716
1,832
0
200
400
600
800
1,000
1,200
1,400
1,600
1,800
2,000
2000 2001 2002 2003 2004 2005 2006 2007 2008 2009 2010 2011 2012 2013 2014 2015 2016 2017
US ETF Number of Funds by Asset Class
Equity Bonds Commodities Total
29 34 34 39 60 81133
197 204 222 243288 275 293 317
361 396472
26 34 32 3342
65
119
191 186 179193
229 222235
236
266304
298
25 34 39 4143
49
85
159 225 244
298
368 404438
494
592
629
629
80 102 105 113145
195
337
547
615645
734
885 901
966
1,047
1,219
1,329 1,399
0
200
400
600
800
1,000
1,200
1,400
2000 2001 2002 2003 2004 2005 2006 2007 2008 2009 2010 2011 2012 2013 2014 2015 2016 2017
Equity ETF Number of Funds by Category
Domestic - Broad Domestic - Sector International Total

Growth In The US ETF Market
SIFMA Insights Page | 22
Net Inflows by Type of ETF
2017 saw significant net issuance, up 66% Y/Y. Looking within categories, the data shows the shift to using ETFs as
part of an active portfolio management strategy, as investors allocate across styles and asset classes to generate
higher returns. Examples of this include:
• Active was up 147% Y/Y, versus 71% for index
• Within equities, domestic broad-based (correlating with an entire market) was only up 6% Y/Y, versus +50%
for sector specific and +691% for international (or around a 120% increase versus a more normalized 2013-
2015 average, since 2016 was a down year).
• Bonds were up 45%
Of note, recent fund flows turned negative (organic growth) for actively managed MFs and ETFs. Market
commentary indicates this is a sign of clients shifting funds among asset classes and products as they de-risk and
rebalance, rather than an indicator of a long-term fund flow trend out of ETFs.
Source: Investment Company Institute (includes data from Strategic Insight Simfund), SIFMA estimates
Note: Other = non 1940 act (not SEC registered). Firms may have data that differs from this publicly available source, as they have their own proprietary
trading data.
43 31 45 16
55 54 66
142 166
87 108 112
171 205
240 222 266
454
5
5
3
7
6
15
1 3 8
9
11
28 8 3
9
(30) (2)
2
11
1
43 31
45
16
56 57 74
151
177
116 118 118
185 180
241 231
284
471
(50)
50
150
250
350
450
550
2000 2001 2002 2003 2004 2005 2006 2007 2008 2009 2010 2011 2012 2013 2014 2015 2016 2017
US ETF Net Inflows ($B) by Management Type
Index Active Other Total

Growth In The US ETF Market
SIFMA Insights Page | 23
Source: Investment Company Institute (includes data from Strategic Insight Simfund), SIFMA estimates
Note: Commodities = commodities, currencies and futures plus hybrids. Domestic-broad = correlated with an entire market; domestic-sector = sector
specific. Firms may have data that differs from this publicly available source, as they have their own proprietary trading data.
43 31 4215
51 47 60
128 144
4280 69
124
197 190 173 188
346
4 4 76
13
23
46
30 46
52
1251
55
83
121
1 38
9
11
288 3
9
-29
0.23
13
4
43 31 45
16
56 5774
151
177
116 118 118
185180
241 231
284
471
(100)
0
100
200
300
400
500
2000 2001 2002 2003 2004 2005 2006 2007 2008 2009 2010 2011 2012 2013 2014 2015 2016 2017
US ETF Net Inflows ($B) by Asset Class
Equities Bonds Commodities Total
41 27 35
6 29 17 22
61 88
(12)
28 35 58
100 102
50
148 156
7 7 10
18
30
14
10 10
14
34 41
13
20 30
16 23 28
49
25
40
42 24
52
63 47
110
20
160
43 31
42
15
51 47 60
128 144
42
80 69
124
197 190 173
188
346
(50)
0
50
100
150
200
250
300
350
400
2000 2001 2002 2003 2004 2005 2006 2007 2008 2009 2010 2011 2012 2013 2014 2015 2016 2017
Equity ETF Net Inflows ($B) by Category
Domestic - Broad Domestic - Sector International Total

Growth In The US ETF Market
SIFMA Insights Page | 24
ETF Net Inflows and MF Net New Cash Flow
While not a perfect apples-to-apples comparison – types of funds within each category may experience different
trends than the total group – we look at ETF net new issuance and MFs net new cash flow. In 2015 and 2016, MFs
saw outflows as net issuance increased for ETFs. In 2017, MFs recovered, but the upswing was not nearly as
significant as for ETFs.
Source: Investment Company Institute (includes data from Strategic Insight Simfund), SIFMA estimates
Note: Firms may have data that differs from this publicly available source, as they have their own proprietary trading data.
229
129
121
216
210
192
227
224
(211)
393
244
28
200
162
98
(122)
(197)
67
43
31
45
16
56
57
74
151
177
116
118
118
185
180
241
231
284
471
2000
2001
2002
2003
2004
2005
2006
2007
2008
2009
2010
2011
2012
2013
2014
2015
2016
2017
US ETF Net Issuance versus US MF Net New Cash Flow ($B)
ETF MF

ETF Creation/Redemption Process
SIFMA Insights Page | 25
ETF Creation/Redemption Process
In this section, we describe the ETF creation/redemption process. APs will create/redeem shares to: facilitate client
trades (access additional liquidity in ETF shares outside of the secondary market, i.e. the authorized participant (AP;
typically a broker-dealer) will create ETF units to allow the client to purchase more ETF shares); capitalize on an
arbitrage opportunity; etc.
To set the scene for this discussion, we lay out some useful terminology:
• Primary Market – The creation/redemption process between the AP and the ETF increases or decreases
the number of ETF shares available to the market based on investor demand, i.e. primary market activity.
This process is done one time per day, priced at net asset value (NAV).
• Secondary Market – ETF shares then trade on exchanges and other trading venues as with single stock
equities, i.e. secondary market activity. Trading is intraday, and prices fluctuate based on market supply and
demand characteristics. Intraday ETF share prices may vary from end-of-day NAV. Most individual investors
transact here, never interacting with the ETF itself. Investors (individual and institutional) interact with each
other, with an AP, via their broker or a through a market maker6 to trade shares. Investors pay the spread
between the bid (offer to buy) and ask (price a seller will accept), plus the broker commission.
• Arbitrage Process – When the price of an ETF share does not equal its NAV, which is primarily determined
by the market prices of the securities held in the ETF’s portfolio, a premium/discount exists. APs will buy/sell
ETF creation units and capture the profit, i.e. the arbitrage process.
To manage the number of ETF shares outstanding, those available for trading in the secondary market, an AP will
deliver a specified basket of underlying securities (creation basket; APs may also provide cash) to the ETF – the
primary market. The ETF will then provide the AP with a fixed amount of ETF shares (creation units; large blocks of
shares, typically ranging from 25,000 to 200,000), increasing the supply of ETF shares in the market. APs can sell
all or part (they may hold some for their own inventory) of the creation units on exchanges and other trading venues
– the secondary market.7 The reverse is APs buy back a specified basket of underlying securities (redemption
basket) from the ETF. The ETF then takes back creation units, thereby decreasing the supply of ETF shares in the
market.
In the secondary market, the price of an ETF share is a function of supply and demand. A supply/demand imbalance
can occur, causing the price of the ETF share to deviate somewhat from the price per share of its underlying
securities (large deviations tend to be short lived).8 This creates a premium/discount in the ETF shares. When this
6 A market maker can also be an AP, but it does not have to be the AP on the ETF it is trading in the secondary market. 7 APs do not receive compensation from the ETF sponsor and are not legally obligated to create or redeem shares. This differs from the role of a market maker in single-stock equities, who has legal obligations to consistently take the other side of a trade. 8 The difference in values between the ETF and its underlying securities can also be created by timing differences. For example, with non-U.S. stock
ETFs, market hours to buy/sell the underlying securities can vary from the U.S. stock market where the ETFs trade. Or, in the case of bond ETFs, the
underlying bond is valued at the bid whereas the ETF can be valued at the bid, ask or anywhere in between.

ETF Creation/Redemption Process
SIFMA Insights Page | 26
premium/discount exists, APs will buy/sell ETF creation units and capture the profit (the arbitrage process). This
changes the price of and therefore demand for ETF shares and the underlying securities. This price change narrows
the price gap between the ETF share and the price of the underlying securities.
• Premium – If the ETF is trading at a premium to the price of the underlying securities, investors can sell
shares in the ETF and/or buy the underlying securities. This should reduce the ETF share price and/or raise
the price of the underlying securities.
• Discount – If the ETF is trading at a discount to the price of the underlying securities, investors can buy
shares in the ETF and/or sell the underlying securities. This should increase the ETF share price and/or
lower the price of the underlying securities.
For the most part, the price of an ETF share remains similar to its NAV, which is primarily determined by the market
prices of the securities held in the ETF’s portfolio. Part of this is attributed to the transparency around ETF portfolio
holdings (daily disclosure of basket securities or portfolio holdings). A portfolio composition file (PCF) is published
each business day, describing the makeup of the creation/redemption baskets. It specifically lists the names and
quantity of each underlying security in the basket. These details provide transparency to market participants, who
can follow price movements of the ETF shares and compare this to the price of the underlying securities.
Additionally, intraday trading consistently shows changes in the ETF share price, allowing investors to attempt to
profit from discrepancies between the price of the ETF share and price of the underlying securities. Intraday
indicative values (IIV) are calculated real time, estimating ETF values. These are disseminated regularly during the
day, and APs, market makers or institutional investors can also make their own real time assessments.
The visibility of portfolio holdings or basket securities and the arbitrage process keeps ETF shares trading close to
NAV, which is primarily determined by the market prices of the securities held in the ETF’s portfolio.

ETF Creation/Redemption Process
SIFMA Insights Page | 27
Primary Market
Securities BasketETF
ETF Shares
Authorized Participant
Cre
ati
on
Re
de
mp
tio
n
Securities BasketETF
ETF Shares
Authorized Participant
Secondary Market
Exchanges
Buy Sell
Authorized Participant
Other Brokers
Other Brokers
End Users

ETF Creation/Redemption Process
SIFMA Insights Page | 28
Thoughts on ETF Liquidity
Liquidity can be described as the ease with which an asset can be quickly and efficiently bought or sold in the
market without significantly affecting its price. In single-stock equities, liquidity is about the breadth and depth of
trading volumes, which is enhanced by price transparency and ease of execution (speed, ability to fill the entire
order). As an ETF is not a common stock, liquidity requires a different discussion than one just on volumes. ETFs
are highly liquid, but liquidity is not just measured by volumes on exchanges or other trading venues. Understanding
liquidity requires understanding the unique nature of and interaction between the ETF primary and secondary
markets and the key participants in each.
In the secondary market, where the price of an ETF share traded on exchanges is a function of supply and demand
determining market value, liquidity is associated with volumes of ETF shares. However, in the primary market
function as described above, an AP is incentivized by the arbitrage process to meet investor demand, which can
inherently increase volumes. Liquidity, therefore, is associated with the efficiency of the creation/redemption
process9, or the ease and cost of aggregating a creation basket. This process is more representative of the price of
the underlying securities, which are delivered in baskets to create ETF shares as shown above, rather than the ETF
shares themselves.
Liquidity in these two markets is not equal nor indicative of the other. Yet, the two have a direct relationship. The
easier an AP can access and trade the underlying securities, the more efficiently it can create/redeem ETF shares
to meet investor demand, increasing volumes. While there can be over 40 registered APs for an ETF10, on average
five will be active (less for smaller or niche funds). Should an AP cease to create/redeem ETF shares, another AP
may enter the market seeking the potential profit from the arbitrage process described above. In the unlikely
scenario all APs stop acting for an ETF, the supply of ETF shares becomes fixed in the short run (the
creation/redemption process halts), and the ETF trades similarly to CEFs11. The ETF share price would still be
determined on exchanges and other trading venues, based on supply and demand characteristics, and the ETF may
trade at a premium/discount to the price of the underlying securities. This creates an incentive for APs to jump back
in the process to capitalize on the arbitrage opportunity. APs again begin the process of changing the supply of ETF
shares.
As shown by this cycle, APs generally keep the arbitrage process functioning efficiently to meet market demand and
liquidity needs.
9 The majority of ETFs do not have any primary market activity on most trading days; some larger ETFs have daily creations and redemptions, but these ETFs generally have more active APs. 10 According to an Investment Company Institute 2015 report: average 34 APs for all ETFs, with an average of 5 active APs; average 38 APs for ETFs >$790M AUM, with an average of 9 active APs; average 31 APs for ETFs $27M AUM and less, with an average of 2 active APs. 11 A CEF is a pooled investment fund which raises a fixed number of shares only once through an IPO and is then traded like a stock on an exchange.

Secondary Market Volumes
SIFMA Insights Page | 29
Secondary Market Volumes
As ETF shares trade on the U.S. equity markets in the secondary market – as do the underlying stocks used to
create equity ETFs – please see SIFMA Insights: US Equity Market Structure Primer for details on drivers of
volumes, market structure, order routing and regulations.
As shown on the following page, ETF shares ADV was 1.1 billion in August 2018, up from 0.8 in 2016. The low was
0.8 billion in June 2016, with a high of 2.0 billion in February 2018. ADV averaged 1.3 billion for each of the last 12
and 24 months. The six month average was 1.4 billion given the February peak noted above, as volatility increased
significantly over inflation and other economic concerns (similar to single stock equity volumes increases on VIX
moves).
ETF shares are a sub sector of total equities volumes. ETF share volumes as a percent of total equities averaged
18.5% to 18.9% over the last 12 to 24 months. The seven month average was 19.4%, in light of the volatility spike in
February. Similar to single-stock equities, ETF share volumes are often correlated with volatility, which spiked in
February of this year to 19.85 (FY17 average 11.05).

Secondary Market Volumes
SIFMA Insights Page | 30
Source: Cboe Global Markets, SIFMA estimates (as of August 2018)
751
1,720
1,295
971
1,970
1,130
0
200
400
600
800
1,000
1,200
1,400
1,600
1,800
2,000
Ju
n-1
6
Ju
l-1
6
Au
g-1
6
Se
p-1
6
Oct-
16
Nov-1
6
Dec-1
6
Ja
n-1
7
Fe
b-1
7
Ma
r-17
Ap
r-17
Ma
y-1
7
Ju
n-1
7
Ju
l-1
7
Au
g-1
7
Se
p-1
7
Oct-
17
Nov-1
7
Dec-1
7
Ja
n-1
8
Fe
b-1
8
Ma
r-18
Ap
r-18
Ma
y-1
8
Ju
n-1
8
Ju
l-1
8
Au
g-1
8
ETF Average Daily Volume Shares Traded (M)
Total Trendline
9.9% 21.7% 17.2% 15.9% 23.5% 18.3%
0%
10%
20%
30%
40%
50%
60%
70%
80%
90%
100%
Ju
n 1
6
Ju
l 16
Au
g 1
6
Se
p 1
6
Oct
16
Nov 1
6
Dec 1
6
Ja
n 1
7
Fe
b 1
7
Ma
r 1
7
Ap
r 1
7
Ma
y 1
7
Ju
n 1
7
Ju
l 17
Au
g 1
7
Se
p 1
7
Oct
17
Nov 1
7
Dec 1
7
Ja
n 1
8
Fe
b 1
8
Ma
r 1
8
Ap
r 1
8
Ma
y 1
8
Ju
n 1
8
Ju
l 18
Au
g 1
8
ETFs as a Percent of Total Equities ADV
Single Stock ETFs

Secondary Market Volumes
SIFMA Insights Page | 31
Source: Cboe Global Markets, Bloomberg, SIFMA estimates (as of August 2018)
751
1,720
1,389
971
1,970
1,130
15.63 17.06
12.92
9.51
19.97
12.86
0
5
10
15
20
25
0
200
400
600
800
1,000
1,200
1,400
1,600
1,800
2,000
Ju
n-1
6
Ju
l-1
6
Au
g-1
6
Se
p-1
6
Oct-
16
Nov-1
6
Dec-1
6
Ja
n-1
7
Fe
b-1
7
Ma
r-17
Ap
r-17
Ma
y-1
7
Ju
n-1
7
Ju
l-1
7
Au
g-1
7
Se
p-1
7
Oct-
17
Nov-1
7
Dec-1
7
Ja
n-1
8
Fe
b-1
8
Ma
r-18
Ap
r-18
Ma
y-1
8
Ju
n-1
8
Ju
l-1
8
Au
g-1
8
ETF ADV (M) versus VIX (#)
ETF VIX (RHS)
6,855
6,199
5,507 5,137
6,416
5,014
15.63
17.06
12.92
9.51
19.97
12.86
0
5
10
15
20
25
0
1,000
2,000
3,000
4,000
5,000
6,000
7,000
Ju
n-1
6
Ju
l-1
6
Au
g-1
6
Se
p-1
6
Oct-
16
Nov-1
6
Dec-1
6
Ja
n-1
7
Fe
b-1
7
Ma
r-17
Ap
r-17
Ma
y-1
7
Ju
n-1
7
Ju
l-1
7
Au
g-1
7
Se
p-1
7
Oct-
17
Nov-1
7
Dec-1
7
Ja
n-1
8
Fe
b-1
8
Ma
r-18
Ap
r-18
Ma
y-1
8
Ju
n-1
8
Ju
l-1
8
Au
g-1
8
Single Stock ADV (M) versus VIX (#)
Shares VIX (RHS)

Market Share Overview
SIFMA Insights Page | 32
Market Share Overview
Market Shares Across Exchange and Off-Exchange Trading
Within trading on exchanges, the top two exchange groups hold a 25%/21% market share in aggregate across all
their individual exchanges, followed by 17.5% at the number three exchange group. Market share can vary within
each exchange group’s individual exchanges, as shown in the following charts. Off-exchange trading represents
around 37% of the total.
Source: Cboe Global Markets, SIFMA estimates
Note: Market share – exchange = as of August 2018 for CHX, IEX and May 2018 for all others. Market share – parent company = as of August 2018.
Intercontinental Exchange (ICE) owns the NYSE exchanges, as well as other exchanges and clearing houses across the globe, and completed its
acquisition of the Chicago Stock Exchange (CHX) in July 2018. Total exchange trading, as shown in these charts, represents ~63% of total volumes;
numbers may not sum up due to different time periods and rounding.
0.2%
0.9%
1.1%
1.4%
1.6%
2.0%
2.5%
5.7%
6.5%
8.3%
12.2%
21.1%
NYSE American
NYSE
CHX
IEX
NASDAQ PSX
Cboe EDGA
NASDAQ BX
Cboe BYX
Cboe EDGX
Cboe BZX
NASDAQ
NYSE Arca
Market Share - Exchange
NYSE, 25.2%
Cboe, 20.6%
Nasdaq, 17.5%
IEX, 1.4%
Market Share - Parent Company

Market Share Overview
SIFMA Insights Page | 33
Source: Cboe Global Markets, SIFMA estimates (as of August 2018)
Note: As of August 2018. NYSE completed its acquisition of CHX in July 2018
Market Share by Providers
Regarding market share for ETF providers, three firms hold 82% of the total AUM. After the next few players, market
shares drop off quickly. We counted 98 providers on etf.com, meaning the other 10% shown in the following chart -
which is less than market share held by each of the top three firms – is aggregate AUM for 93 firms.
Source: etf.com, SIFMA estimates (as of June 2018)
20.6%
17.5%
25.2%
1.3%1.4%
35.4%
0%
5%
10%
15%
20%
25%
30%
35%
40%
45%
Ju
n-1
6
Ju
l-1
6
Au
g-1
6
Se
p-1
6
Oct-
16
Nov-1
6
Dec-1
6
Ja
n-1
7
Fe
b-1
7
Ma
r-17
Ap
r-17
Ma
y-1
7
Ju
n-1
7
Ju
l-1
7
Au
g-1
7
Se
p-1
7
Oct-
17
Nov-1
7
Dec-1
7
Ja
n-1
8
Fe
b-1
8
Ma
r-18
Ap
r-18
Ma
y-1
8
Ju
n-1
8
Ju
l-1
8
Au
g-1
8
Exchange Market Share by Parent Group
Cboe NASDAQ NYSE CHX IEX Off-Exchange
BlackRock39%
Vanguard25%
State Street18%
Invesco5%
Schwab3% Other
10%
ETF Provider Market Share

Appendix
SIFMA Insights Page | 34
Appendix
Appendix: Mutual Funds Statistics for Comparison
Source: Investment Company Institute, SIFMA estimates
7.0 7.0 6.4
7.4 8.1
8.9
10.4
12.0
9.6
11.1 11.8 11.6
13.1
15.0 15.9 15.7 16.3
18.7
8.2
8.3 8.2
8.1
8.0
8.0
8.1
8.0 8.0
7.7
7.6 7.6 7.6
7.7
7.9 8.1
8.1
8.0
7.0
7.2
7.4
7.6
7.8
8.0
8.2
8.4
0.0
2.0
4.0
6.0
8.0
10.0
12.0
14.0
16.0
18.0
20.0
2000 2001 2002 2003 2004 2005 2006 2007 2008 2009 2010 2011 2012 2013 2014 2015 2016 2017
US Mutual Funds AUM and Number of Funds
$ Trillion # Thousands (RHS)
0.0005 0.1 1.1
2.2
6.8
12.0
15.0
18.7
0
2
4
6
8
10
12
14
16
18
20
194
0
195
0
196
0
197
0
197
6
197
8
198
0
198
2
198
4
198
6
198
8
199
0
199
2
199
4
199
6
199
8
200
0
200
2
200
4
200
6
200
8
201
0
201
2
201
4
201
6
Growth in Mutual Fund AUM ($T)

Appendix
SIFMA Insights Page | 35
Appendix: Closed-End Funds Statistics for Comparison
Source: Investment Company Institute, SIFMA estimates
143.1 141.2
158.7
213.8
253.4
275.9
297.2 312.4
184.2
222.9 237.8 242.4
263.6 279.4
289.3
261.0 262.6
275.2
481 489
543
581
618 634 645
662 642
627 624 632 602 599
568
559 532 530
0
100
200
300
400
500
600
700
0
50
100
150
200
250
300
350
2000 2001 2002 2003 2004 2005 2006 2007 2008 2009 2010 2011 2012 2013 2014 2015 2016 2017
Closed-End Funds AUM and Number of Funds
$ Billion # (RHS)

Appendix
SIFMA Insights Page | 36
Appendix: Unit Investment Trusts Statistics for Comparison
Source: Investment Company Institute, SIFMA estimates
74.2
49.2
36.0 35.8 37.340.9
49.7 53.0
28.5
38.3
50.6
59.9
71.7
86.5
101.1
94.1
84.6 84.9
10.1
9.3
8.3
7.2
6.56.0 5.9 6.0 6.0 6.0 6.0 6.0 5.8
5.6 5.4 5.2 5.1 5.0
0
2
4
6
8
10
12
0
20
40
60
80
100
2000 2001 2002 2003 2004 2005 2006 2007 2008 2009 2010 2011 2012 2013 2014 2015 2016 2017
Unit Trusts AUM and Number of Funds
$ Billion # Thousands (RHS)

Appendix
SIFMA Insights Page | 37
Appendix: Terms to Know
FINRA Financial Industry Regulatory Authority
SEC Securities and Exchange Commission
SRO Self-Regulatory Organization
AP Authorized Participant
PCF Portfolio Composition File
NAV Net Asset Value
IIV Intraday Indicative Value
MF Mutual Fund
OEF Open-End Fund
CEF Closed-End Fund
UIT Unit Investment Trust
ADV Average Daily Trading Volume
ATS Alternative Trading System
AUM Assets Under Management
Best Ex Best Execution
Dark Pool Private trading venues, not accessible by the public
ECN Electronic Communication Network
EMS Equity Market Structure
ETF Exchange-Traded Fund
ETP Exchange-Traded Product
HFT High-Frequency Trading
IOI Indication of Interest
IPO Initial Public Offering
MM Market Maker
OTC Over-the-Counter
PFOF Payment For Order Flow
SI Systematic Internaliser
Tick Size Minimum price movement of a trading instrument
Bid An offer made to buy a security
Ask, Offer The price a seller is willing to accept for a security
Spread The difference between the bid and ask price prices for a security, an indicator of supply (ask) and demand (bid)
NBBO National Best Bid and Offer
Locked Market A market is locked if the bid price equals the ask price
Crossed Market A bid is entered higher than the offer or an offer is entered lower than the bid
Opening Cross To determine the opening price of a stock, accumulating all buy and sell interest a few minutes before the market open
Closing Cross To determine the closing price of a stock, accumulating all buy and sell interest a few minutes before the market close
Order Types
AON All or none; an order to buy or sell a stock that must be executed in its entirety, or not executed at all
Block Trades with at least 10,000 shares in the order
Day Order is good only for that trading day, else cancelled
FOK Fill or kill; must be filled immediately and in its entirety or not at all
Limit An order to buy or sell a security at a specific price or better
Market An order to buy or sell a security immediately; guarantees execution but not the execution price
Stop (or stop-loss) An order to buy or sell a stock once the price of the stock reaches the specified price, known as the stop price
CAGR Compound Annual Growth Rate
RHS Right hand side
Y/Y Year over year
Investors
Institutional Asset managers, endowments, pension plans, foundations, mutual funds, hedge funds, family offices, insurance companies,
banks, etc.; fewer protective regulations as assumed to be more knowledgeable and better able to protect themselves
Individual Self-directed or advised investing; some considered accredited investors: income > $200K ($300K with spouse) in each of the
prior 2 years or net worth >$1M, excluding primary residence

Authors
SIFMA Insights Page | 38
Authors
SIFMA Insights
Katie Kolchin, CFA
Senior Industry Analyst
Asset Management Group
Timothy W. Cameron, Esq.
Managing Director, Head of Asset Management Group
Equities
T.R. Lazo
Managing Director, Associate General Counsel