THE TOURISM INDUSTRY - NOAA - NOAA National Marine Sanctuaries
Upload
duongtuyenCategory
view
214download
0
U.S. DEPARTMENT OF COMMERCE
NATIONAL OCEANIC AND ATMOSPHERIC ADMINISTRATION NATIONAL OCEAN SERVICE
Data Acquisition & Processing Report
Type of Survey NAVIGABLE AREA
Project Number S-E937-NRT5-12
Time Frame DECEMBER
LOCALITY
State: MARYLAND
General Locality Potomac River
2012
CHIEF OF PARTY
LTJG DANIEL D. SMITH, NOAA
LIBRARY & ARCHIVES
DATE
19 MARCH 2013
NOAA NRT-5 S-E937-NRT5-12 DAPR
2
NOAA FORM 77-28 U.S. DEPARTMENT OF COMMERCE (11-72) NATIONAL OCEANIC AND
ATMOSPHERIC ADMINISTRATION
HYDROGRAPHIC TITLE SHEET
PROJECT NUMBER:
S-E937-NRT5-12
INSTRUCTIONS: The Hydrographic Sheet should be accompanied by this form, filled in as completely as possible, when the sheet is forwarded to the Office.
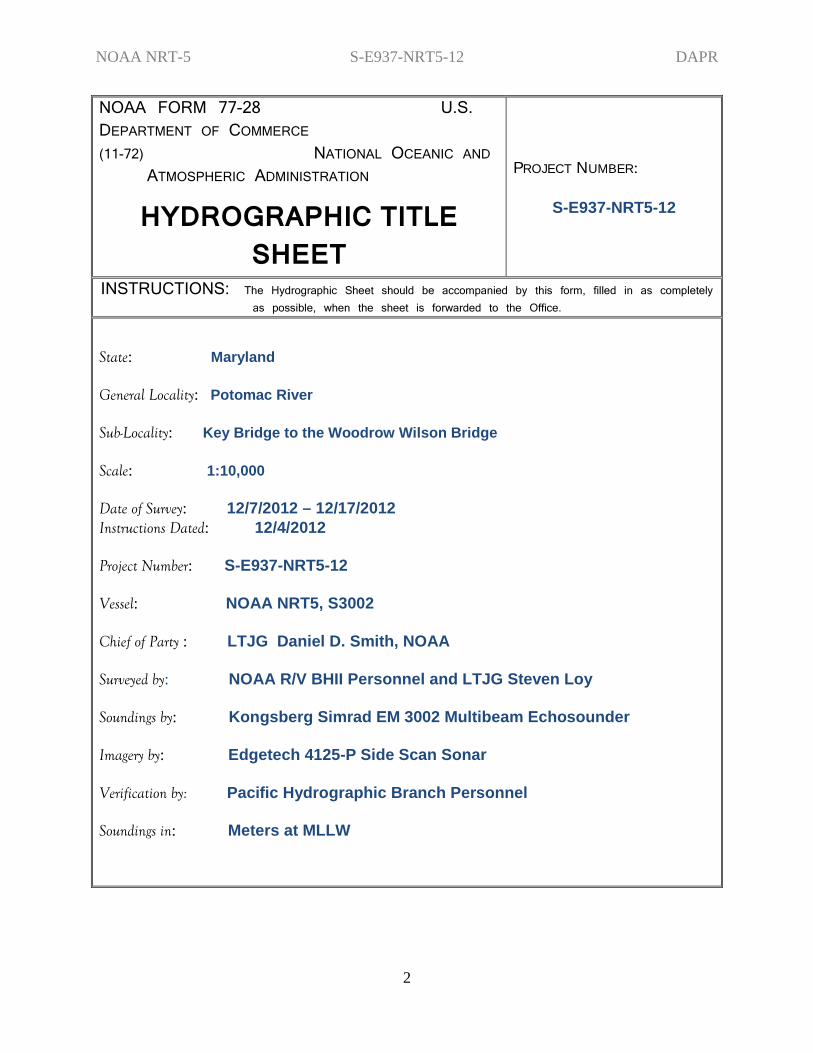
State: Maryland General Locality: Potomac River Sub-Locality: Key Bridge to the Woodrow Wilson Bridge Scale: 1:10,000 Date of Survey: 12/7/2012 – 12/17/2012 Instructions Dated: 12/4/2012 Project Number: S-E937-NRT5-12 Vessel: NOAA NRT5, S3002 Chief of Party : LTJG Daniel D. Smith, NOAA Surveyed by: NOAA R/V BHII Personnel and LTJG Steven Loy Soundings by: Kongsberg Simrad EM 3002 Multibeam Echosounder Imagery by: Edgetech 4125-P Side Scan Sonar Verification by: Pacific Hydrographic Branch Personnel Soundings in: Meters at MLLW

NOAA NRT-5 S-E937-NRT5-12 DAPR
3
Remarks: 1) All Times are UTC. 2) Projection is UTM Zone 18N.
Table of Contents A. EQUIPMENT ......................................................................................................................... 5
A.1. Vessels .............................................................................................................................. 5
A.1.1. S3002 ........................................................................................................................ 5
A.2. Depth Measurement Equipment ....................................................................................... 5
A.2.1. Kongsberg Simrad EM3002 Multibeam Echosounder ............................................. 5
A.3. Vessel Position and Orientation Equipment .................................................................... 6
A.3.1. POS/MV Position & Orientation Sensor .................................................................. 6
A.3.2. Trimble DSM212L DGPS Receiver ......................................................................... 7
A.4. Side Scanning Imagery Sonar .......................................................................................... 7
A.4.1. Edgetech 4125 ........................................................................................................... 7
A.5. Sound Speed Equipment .................................................................................................. 8
A.5.1. Odom Digibar Pro – Surface Sound Speed............................................................... 8
A.5.2. Seabird SBE19+ CTD Profiler ................................................................................. 9
A.5.3. Calibration & Configuration ..................................................................................... 9
A.6. Data Acquisition Software ............................................................................................... 9
A.6.1. Hypack Hysweep ...................................................................................................... 9
A.6.2. Applanix PosView .................................................................................................... 9
A.6.3. Kongsberg SIS-Seafloor Information System .......................................................... 9
A.6.4. Discover II ................................................................................................................ 9
A.7. Data Processing Software............................................................................................... 10
A.7.1. Caris HIPS .............................................................................................................. 10
A.7.2. Caris SIPS ............................................................................................................... 10
A.7.3. Caris Bathy DataBASE ........................................................................................... 10
A.7.4. Velocipy .................................................................................................................. 10
A.7.5. Pydro ....................................................................................................................... 10

NOAA NRT-5 S-E937-NRT5-12 DAPR
4
B. QUALITY CONTROL ......................................................................................................... 10
B.1. Multibeam Echosounder Data ........................................................................................ 10
B.1.1. Acquisition Operations ........................................................................................... 10
B.1.2. MBES Processing Workflow .................................................................................. 10
B.2. Sidescan Sonar Data ....................................................................................................... 13
B.2.1. SSS Processing Workflow ...................................................................................... 13
B.3. Feature Data ................................................................................................................... 15
C. CORRECTIONS TO ECHO SOUNDINGS ........................................................................ 15
C.1. Vessel Correctors ........................................................................................................... 15
C.1.1. Static Offsets ........................................................................................................... 16
C.1.2. Dynamic Offsets ..................................................................................................... 16
C.1.3. Patch Test Biases .................................................................................................... 18
C.2. Sound Speed ................................................................................................................... 19
C.3. Water Level Corrections ................................................................................................ 19
Figure 1: NOAA S3002 (NRT5).................................................................................................... 5 Figure 2: POS/MV Antenna Installation........................................................................................ 6 Figure 3: IMU Installation ............................................................................................................. 7 Figure 4: Surface Sound Speed Digibar Installation...................................................................... 9 Figure 5: Multibeam Processing Workflow ................................................................................. 11 Figure 6: Device Conversion Parameters .................................................................................... 11 Figure 7: SSS Processing Workflow............................................................................................ 13 Figure 8: Caris Conversion Wizard ............................................................................................. 14 Figure 9: Digitizing Towfish Height............................................................................................ 14 Figure 10: Static Draft Measurement ........................................................................................... 16 Figure 11: Dynamic Draft Optical Level Setup ........................................................................... 17 Figure 12: Dynamic Draft Plot .................................................................................................... 18 Figure 13: Patch Test Location (Charted depths are in feet) ........................................................ 19 Table 1: Edgetech 4125 Specifications ........................................................................................... 8 Table 2: TPU Values ..................................................................................................................... 12 Table 3: 2012 Dynamic Draft Values ........................................................................................... 17 Table 4: Patch Test Values ........................................................................................................... 19 APPENDICES Appendix I System Tracking Appendix II Vessel Reports, Offsets, and Diagrams Appendix III Calibration Appendix IV Electronic Appendix
NOAA NRT-5 S-E937-NRT5-12 DAPR
5
DATA ACQUISITION & PROCESSING REPORT
S-E937-NRT5-12
NOAA Navigation Response Team 5 LTJG Steven Loy, Team Lead
LTJG Daniel Smith, Lead Processing and Submittal A. EQUIPMENT
A.1. Vessels
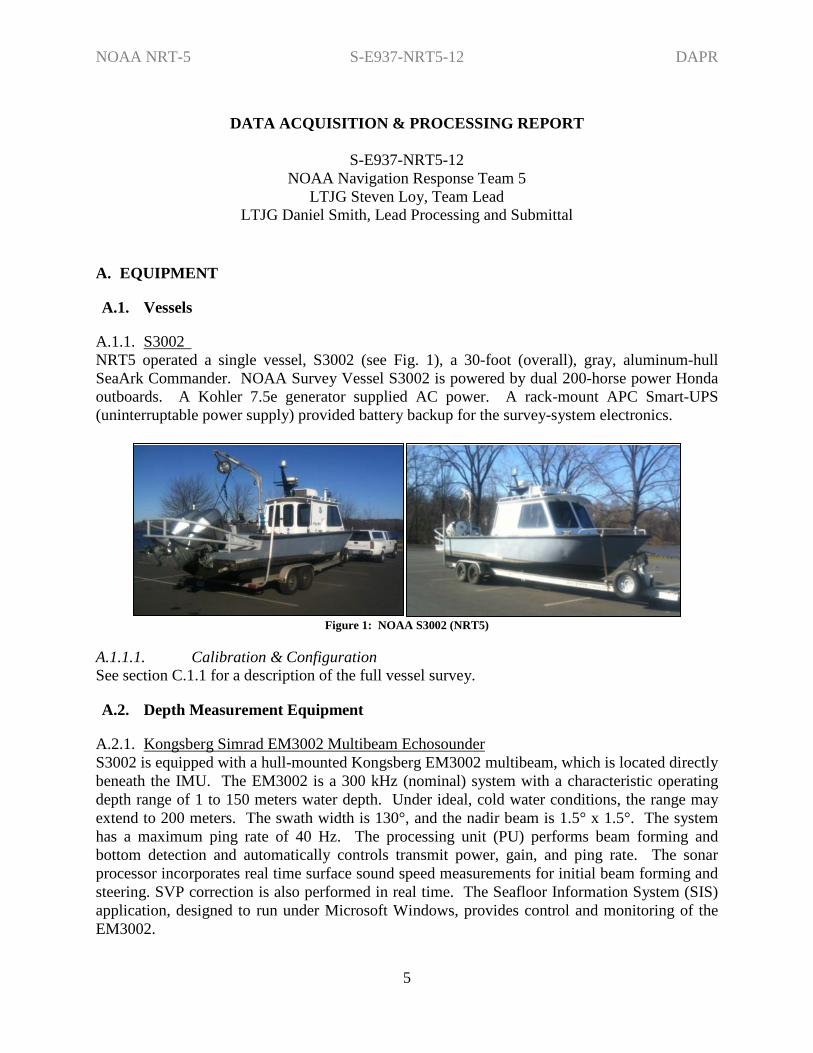
A.1.1. S3002 NRT5 operated a single vessel, S3002 (see Fig. 1), a 30-foot (overall), gray, aluminum-hull SeaArk Commander. NOAA Survey Vessel S3002 is powered by dual 200-horse power Honda outboards. A Kohler 7.5e generator supplied AC power. A rack-mount APC Smart-UPS (uninterruptable power supply) provided battery backup for the survey-system electronics.
Figure 1: NOAA S3002 (NRT5)
A.1.1.1. Calibration & Configuration See section C.1.1 for a description of the full vessel survey.
A.2. Depth Measurement Equipment
A.2.1. Kongsberg Simrad EM3002 Multibeam Echosounder S3002 is equipped with a hull-mounted Kongsberg EM3002 multibeam, which is located directly beneath the IMU. The EM3002 is a 300 kHz (nominal) system with a characteristic operating depth range of 1 to 150 meters water depth. Under ideal, cold water conditions, the range may extend to 200 meters. The swath width is 130°, and the nadir beam is 1.5° x 1.5°. The system has a maximum ping rate of 40 Hz. The processing unit (PU) performs beam forming and bottom detection and automatically controls transmit power, gain, and ping rate. The sonar processor incorporates real time surface sound speed measurements for initial beam forming and steering. SVP correction is also performed in real time. The Seafloor Information System (SIS) application, designed to run under Microsoft Windows, provides control and monitoring of the EM3002.

NOAA NRT-5 S-E937-NRT5-12 DAPR
6
A.2.1.1. Calibration & Configuration The installation and runtime parameter configuration files are included in Appendix IV (Electronic Appendix). See section C.1.3 for a description of the calibration patch test.
A.3. Vessel Position and Orientation Equipment
A.3.1. POS/MV Position & Orientation Sensor S3002 is equipped with an Applanix POS/MV 320 version 4. The POS/MV serial# 3793 consists of dual Trimble BD960 GPS receivers (with corresponding Zephyr antennas), an inertial motion unit (IMU), and a POS computer system (PCS). This POS/MV was used for Day Numbers 342, 343, 344, and 345. The POS/MV serial# 3793 was replaced with POS/MV serial# 2034 due to a malfunctioning primary GPS receiver. The POS/MV serial# 2034 consists of dual BD950 GPS receivers (with corresponding Zephyr antennas), an inertial motion unit (IMU), and a POS computer system (PCS) and was used for Day Numbers 347, 349, 350, 351, and 352. The same Zephyr antennas and IMU were used for both POS computer systems. The two antennas are mounted approximately 1.5 meters apart atop the launch cabin (see Fig. 2). The primary receiver (on the port side) is used for position and velocity, and the secondary receiver is used to provide heading information as part of the GPS azimuthal measurement sub-system (GAMS).
Figure 2: POS/MV Antenna Installation
The IMU contains three solid-state linear accelerometers and three solid state gyros, which together provide a full position and orientation solution. The IMU is mounted on the top of the sonar housing, beneath a removable deck plate (see Fig. 3).
Primary GPS Antenna

NOAA NRT-5 S-E937-NRT5-12 DAPR
7
Figure 3: IMU Installation
A.3.1.1. Calibration & Configuration A GAMS calibration was performed on 6/19/2012, prior to data acquisition. The GAMS calibration report is included in Appendix II. The POS/MV is configured, operated, and monitored via the POS/MV controller software, which is installed on the S3002 acquisition computer. The primary GPS-to-reference point lever arm was accounted for in the POS/MV controller. A POS/MV configuration file detailing lever arms, input/output settings, and operational settings is contained in Appendix IV (Electronic Appendix).
A.3.2. Trimble DSM212L DGPS Receiver The POS/MV receives differential (RTCM) correctors from a Trimble DSM212L GPS receiver that includes a dual-channel low-noise MSK beacon receiver, capable of receiving U.S. Coast Guard (USCG) differential correctors. The DSM212L can also accept RTCM messages from an external source such as a user-established DGPS reference station, however, no such stations were established for S-E937-NRT5-12.
A.3.2.1. Calibration & Configuration Trimble’s TSIP Talker was used to configure the DSM212L. The DGPS receiver was set to receive corrections from Hagerstown, MD (307 kHz). The DSM212L is configured to go off-line if the age of DGPS correctors exceeds 20 seconds, and to exclude satellites with an altitude below eight degrees.
A.4. Side Scanning Imagery Sonar
A.4.1. Edgetech 4125
NOAA NRT-5 S-E937-NRT5-12 DAPR
8
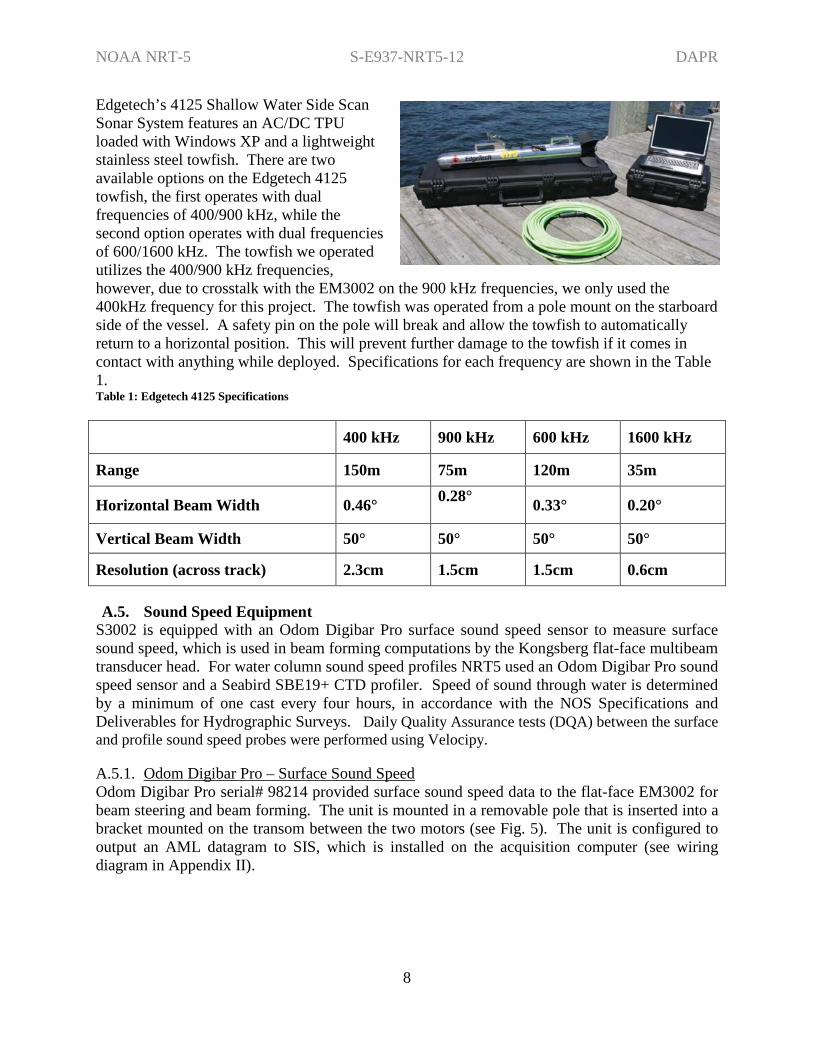
Edgetech’s 4125 Shallow Water Side Scan Sonar System features an AC/DC TPU loaded with Windows XP and a lightweight stainless steel towfish. There are two available options on the Edgetech 4125 towfish, the first operates with dual frequencies of 400/900 kHz, while the second option operates with dual frequencies of 600/1600 kHz. The towfish we operated utilizes the 400/900 kHz frequencies, however, due to crosstalk with the EM3002 on the 900 kHz frequencies, we only used the 400kHz frequency for this project. The towfish was operated from a pole mount on the starboard side of the vessel. A safety pin on the pole will break and allow the towfish to automatically return to a horizontal position. This will prevent further damage to the towfish if it comes in contact with anything while deployed. Specifications for each frequency are shown in the Table 1. Table 1: Edgetech 4125 Specifications
A.5. Sound Speed Equipment S3002 is equipped with an Odom Digibar Pro surface sound speed sensor to measure surface sound speed, which is used in beam forming computations by the Kongsberg flat-face multibeam transducer head. For water column sound speed profiles NRT5 used an Odom Digibar Pro sound speed sensor and a Seabird SBE19+ CTD profiler. Speed of sound through water is determined by a minimum of one cast every four hours, in accordance with the NOS Specifications and Deliverables for Hydrographic Surveys. Daily Quality Assurance tests (DQA) between the surface and profile sound speed probes were performed using Velocipy.
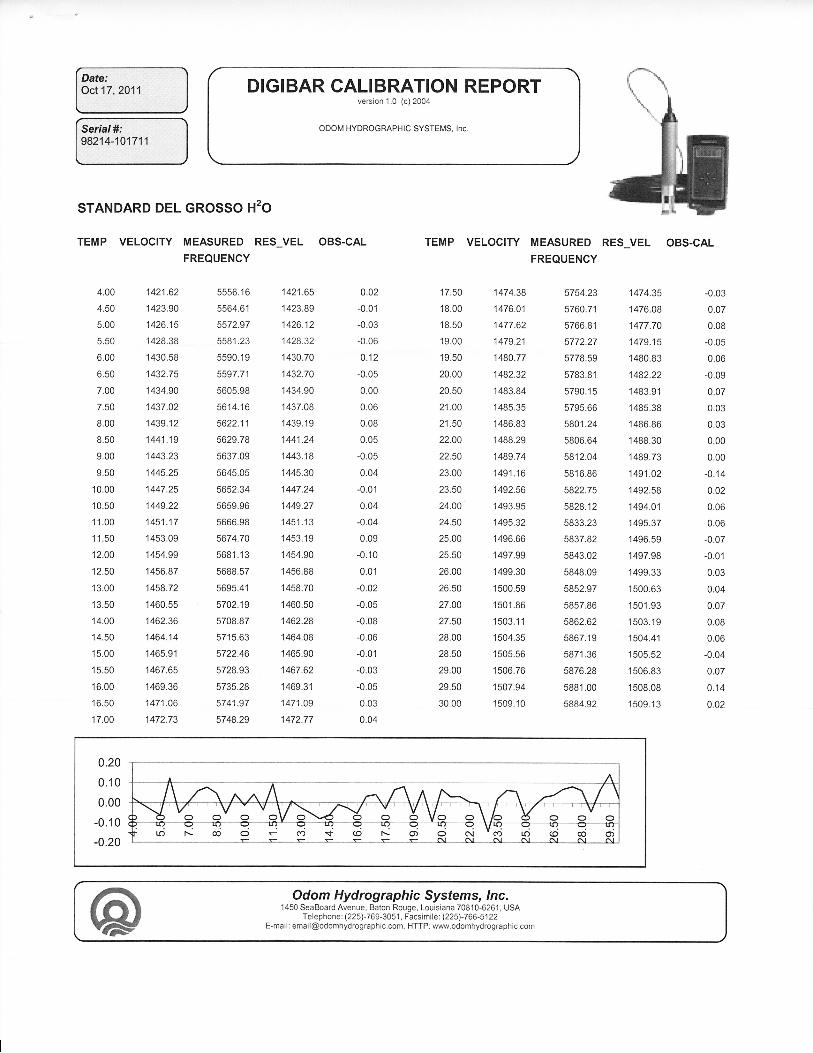
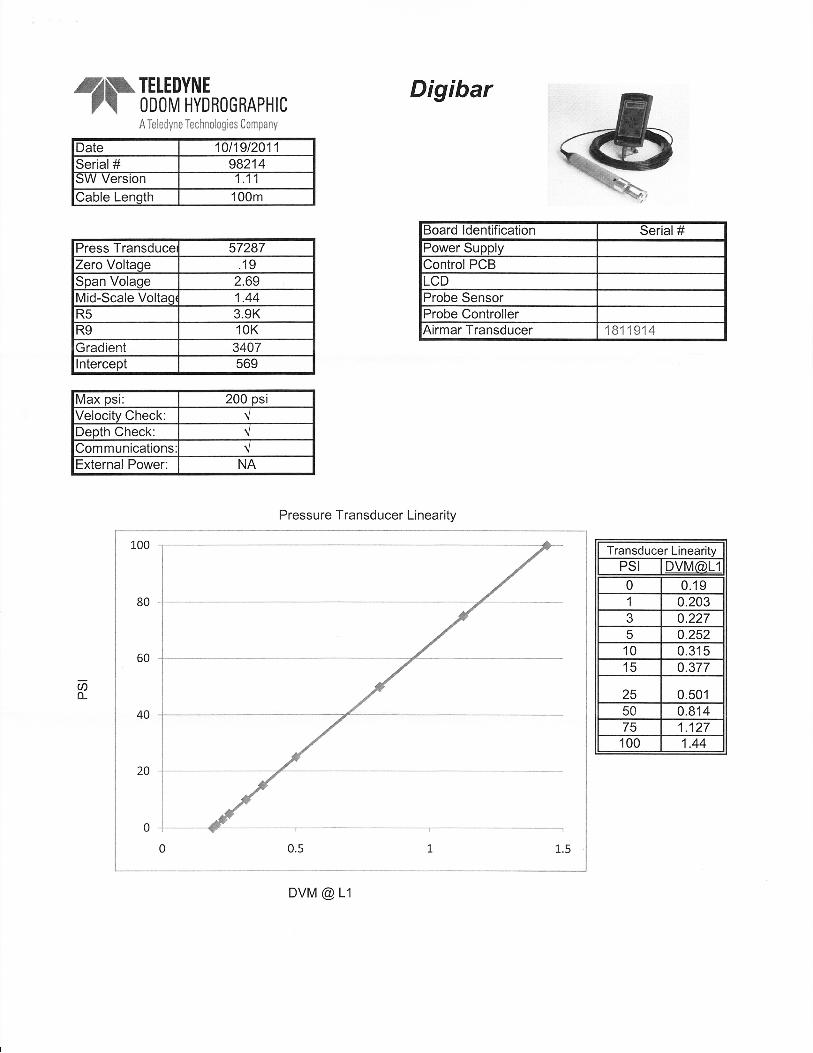
A.5.1. Odom Digibar Pro – Surface Sound Speed Odom Digibar Pro serial# 98214 provided surface sound speed data to the flat-face EM3002 for beam steering and beam forming. The unit is mounted in a removable pole that is inserted into a bracket mounted on the transom between the two motors (see Fig. 5). The unit is configured to output an AML datagram to SIS, which is installed on the acquisition computer (see wiring diagram in Appendix II).
400 kHz 900 kHz 600 kHz 1600 kHz
Range 150m 75m 120m 35m
Horizontal Beam Width 0.46° 0.28° 0.33° 0.20°
Vertical Beam Width 50° 50° 50° 50°
Resolution (across track) 2.3cm 1.5cm 1.5cm 0.6cm

NOAA NRT-5 S-E937-NRT5-12 DAPR
9
Figure 4: Surface Sound Speed Digibar Installation
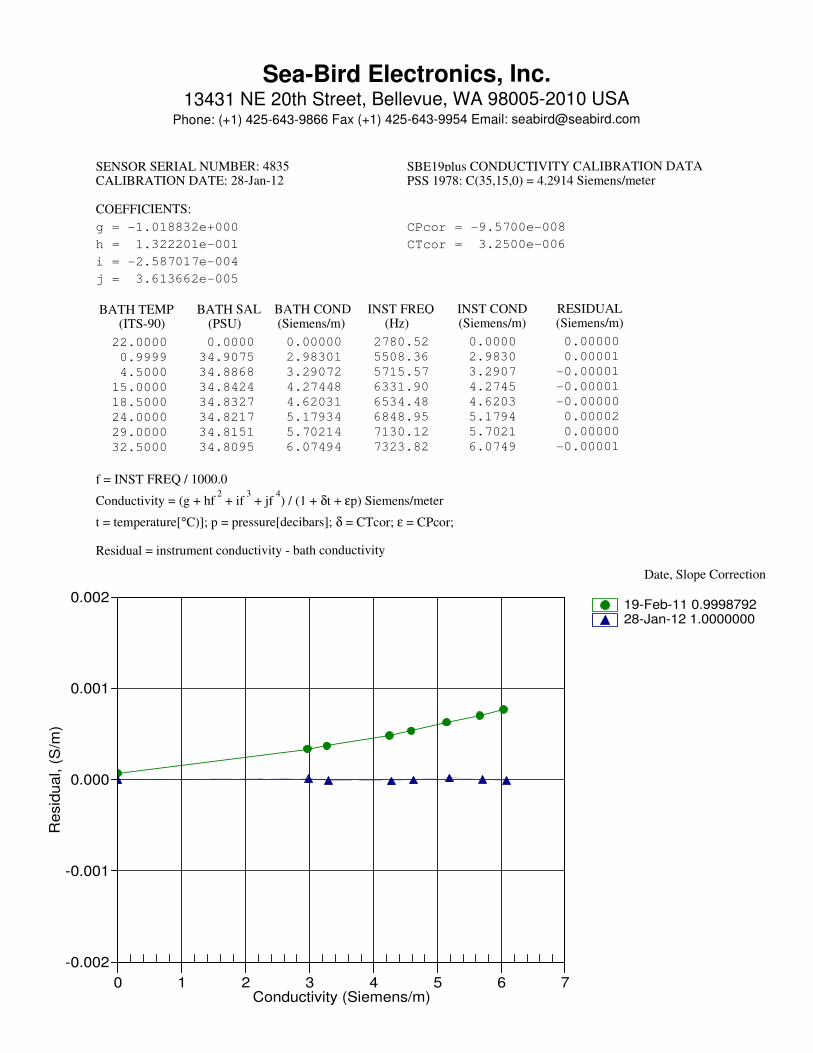
A.5.2. Seabird SBE19+ CTD Profiler Seabird SBE19+ serial #4835 is used to obtain sound speed profiles. The raw profile data file is uploaded and processed with the acquisition computer using the NOAA Velocipy software. Velocipy generates an *.asvp file, which is loaded into SIS for real-time ray tracing, and an *.svp file which is used for post processing in Caris.
A.5.3. Calibration & Configuration Calibration reports for both sound speed sensors are included in Appendix III.
A.6. Data Acquisition Software A complete list of software and versions is included in Appendix I.
A.6.1. Hypack Hysweep Hypack Hysweep was used for real-time data display and navigation.
A.6.2. Applanix PosView The Applanix POSView software was used to configure and monitor the Applanix PosMV, and to log PosPac files. The PosMV configuration file, which is created using POSView, is located in Appendix IV (Electronic Appendix).
A.6.3. Kongsberg SIS-Seafloor Information System SIS was used to control the EM3002 MBES and for acquisition of .all files.
A.6.4. Discover II Discover II was used to for the acquisition of all Edgetech 4125 SSS data and also logged towfish position and altitude.

NOAA NRT-5 S-E937-NRT5-12 DAPR
10
A.7. Data Processing Software
A.7.1. Caris HIPS Caris HIPS was used to process all MBES data including tide correction, SVP correction, merging with navigation data, TPU calculation, data cleaning, and CUBE BASE surface creation. The Caris HVF file, which contains offsets and correctors applied in Caris, is located in Appendix IV (Electronic Appendix).
A.7.2. Caris SIPS Caris SIPS was used to process all SSS data, including towfish height, slant range correction, recomputing towfish navigation, and selecting contacts. The Caris HVF file, which contains offsets and correctors applied in Caris, is located in Appendix IV (Electronic Appendix).
A.7.3. Caris Bathy DataBASE Caris Bathy Data BASE was used for feature management and quality assurance.
A.7.4. Velocipy Velocipy was used to process SVP casts and for DQA tests. The .asvp files created by Velocipy were applied to the MBES data in real-time using SIS software.
A.7.5. Pydro Pydro was used for feature management, DTON report generation, and tides requests.
B. QUALITY CONTROL
B.1. Multibeam Echosounder Data
B.1.1. Acquisition Operations Mainscheme multibeam data were acquired concurrently with SSS data using planned lines at a spacing determined to achieve 100% SSS. When gaps in coverage were found, holiday line plans were created using Mapinfo and exported as Hypack line files. Sound speed casts were acquired as per HSSD section 5.2.3.3.
B.1.2. MBES Processing Workflow Multibeam processing for S-E937-NRT5-12 was based on the BASE surface/directed-editing paradigm described in FPM section 5.2, Bathymetry Processing. The multibeam processing workflow had four main components: conversion, preliminary processing, surface generation, and surface review/data cleaning (see Fig. 6). Note that the surface generation and surface review/data cleaning steps are iterative.

NOAA NRT-5 S-E937-NRT5-12 DAPR
11
B.1.2.1. Conversion Raw multibeam .ALL data were converted to HDCS format in Caris HIPS. Device conversion parameters are shown in Figure 7.
Figure 6: Device Conversion Parameters
B.1.2.2. Preliminary Processing After conversion, preliminary processing consisted of applying True Heave, tide, SVP Correction, merging, and computing total propagated uncertainty (TPU). Loading True Heave True Heave was loaded for each day of data. Applying Tides Tide correction was performed using discrete tidal zoning. The tidal zones are defined in E937NRT52013CORP.zdf. See section C.3 for a detailed description of the tide correctors for S-E937-NRT5-12.
Conversion to Caris
Preliminary Processing
Surface Generation
Surface Review/ Data Cleaning
• Evaluate coverage (gaps & density)
• Evaluate systematic & non-systematic errors
• Designate soundings
• Specify CUBE parameters
• Finalize
• Load True Heave • Apply tides • SVP Correction • Merge • Compute TPU
• Specify devices
Figure 5: Multibeam Processing Workflow
Raw Data
Final Surface

NOAA NRT-5 S-E937-NRT5-12 DAPR
12
SVP Correction SVP post processing was performed in Caris using the Simrad “intersection of cones” algorithm. Typically, the “Nearest in distance within time” option was used, with a time limit of 4 hours, unless a different method was warranted. True Heave was applied during this correction. Merging The merge process in Caris combines the observed depths (created during conversion) with the loaded tide file, the navigation data, the HVF draft sensor (containing dynamic draft values), and the HVF swath1 sensor (containing patch test biases) to compute the final processed depths. No smoothed sensors were applied during the merge process. Computing TPU The TPU computation process assigns each sounding a horizontal and vertical uncertainty, or estimate of error, based on the uncertainties of the various data components, such as position, sound speed, and loading conditions. Table 1 lists the HVF TPU values used for S-E937-NRT5-12. Table 2: TPU Values
Data Component TPU Value Data Component TPU Values Motion Gyro 0.02° X, Y, & Z Offsets 0.01 m Heave % Amplitude 5% Vessel Speed 0.03 m/s Heave 0.05 m Loading 0.01 m Roll 0.02° Draft 0.03 m Pitch 0.02° Delta Draft 0.03 m Position Nav 1 m MRU Align StdDev gryo 0.2° Timing Transducer 0.01 s MRU Align StdDev Roll/Pitch 0.2° Nav Timing 0.01 s Sound Speed Surface 0.5 m/s Gyro Timing 0.01 s Sound Speed Profile 4.0 m/s Heave Timing 0.01 s Tide measured 0.01 Pitch Timing 0.01 s Tide zoning .045* Roll Timing 0.01 s *Note: The tide zoning uncertainty includes the estimated gauge measurement uncertainty.
B.1.2.3. Surface Generation The multibeam sounding data were modeled using the CUBE BASE surface algorithm implemented in Caris HIPS. CUBE BASE surfaces were generated using the parameters outlined in Hydrographic Surveys Technical Directive 2009-02 (CUBE Parameters). Due to the shallow depth of water and high density of MBES data, the only finalized surface was at the 0.5m resolution.
B.1.2.4. Surface Review/Data Cleaning Rather than a traditional line-by-line review and a full subset-cleaning, the data cleaning/quality review process for S-E937-NRT5-12 consisted of a combination of the directed-editing approach described in FPM section 4.2.4.3, and a full subset-review (not full subset-cleaning). All the sounding data were viewed in subset, but unlike in the traditional workflow, where every sounding deemed to be “noise” is rejected, only the soundings that negatively impacted the

NOAA NRT-5 S-E937-NRT5-12 DAPR
13
CUBE surface were rejected. Surface review also consisted of evaluating achieved coverage and sounding density, checking for systematic errors, and designating soundings. Sounding designation was in accordance with Specs and Deliverable section 5.2.1.2.
B.2. Sidescan Sonar Data
B.2.1. SSS Processing Workflow SSS processing for S-E937-NRT5-12 was performed using Caris SIPS.
B.2.1.1. Data Conversion The JSF lines logged by Discover II were brought into Caris SIPs using the Conversion wizard. Parameters selected are shown in the figure below.
Conversion to Caris
Preliminary Processing
Line Review for Contacts
Mosaic creation/ Coverage Review
• Create Geobars and generate Mosaic for 100% coverage
• Check for gaps in coverage
• Select all significant contacts.
• Review MBES for designated soundings if needed
• Review/edit towfish
height • Slant Range Correct • Recompute towfish
navigation
• Import JSF Files
Figure 7: SSS Processing Workflow
Raw Data

NOAA NRT-5 S-E937-NRT5-12 DAPR
14
Figure 8: Caris Conversion Wizard
B.2.1.2. Towfish height Digitization The towfish bottom tracking was reviewed for each line, and redigitized where needed.
Figure 9: Digitizing Towfish Height
B.2.1.3. Recompute Towfish Navigation
NOAA NRT-5 S-E937-NRT5-12 DAPR
15
Along with the sidescan imagery, Discover II logs towfish navigation and altitude. Recompute towfish navigation combines these sensors to compute the position of the towfish in relation to the vessel. The process is needed for accurate positioning of contacts and georeferencing of mosaics.
B.2.1.4. Slant Range Correct and Geobar Creation All SSS lines were slant range corrected and then geobars were created. Once slant range corrected, the geographical position of contacts can be determined in Sidescan Editor.
B.2.1.5. Line Review and Contact Selection Each line of SSS data was reviewed for possible contacts by a primary reviewer and they re-reviewed by a secondary reviewer. Significant contacts were selected for investigation and line plans were made for multibeam developments.
B.2.1.6. Creation of Mosaics Mosaics were generated from the geobars and were reviewed to determine areas that required additional coverage.
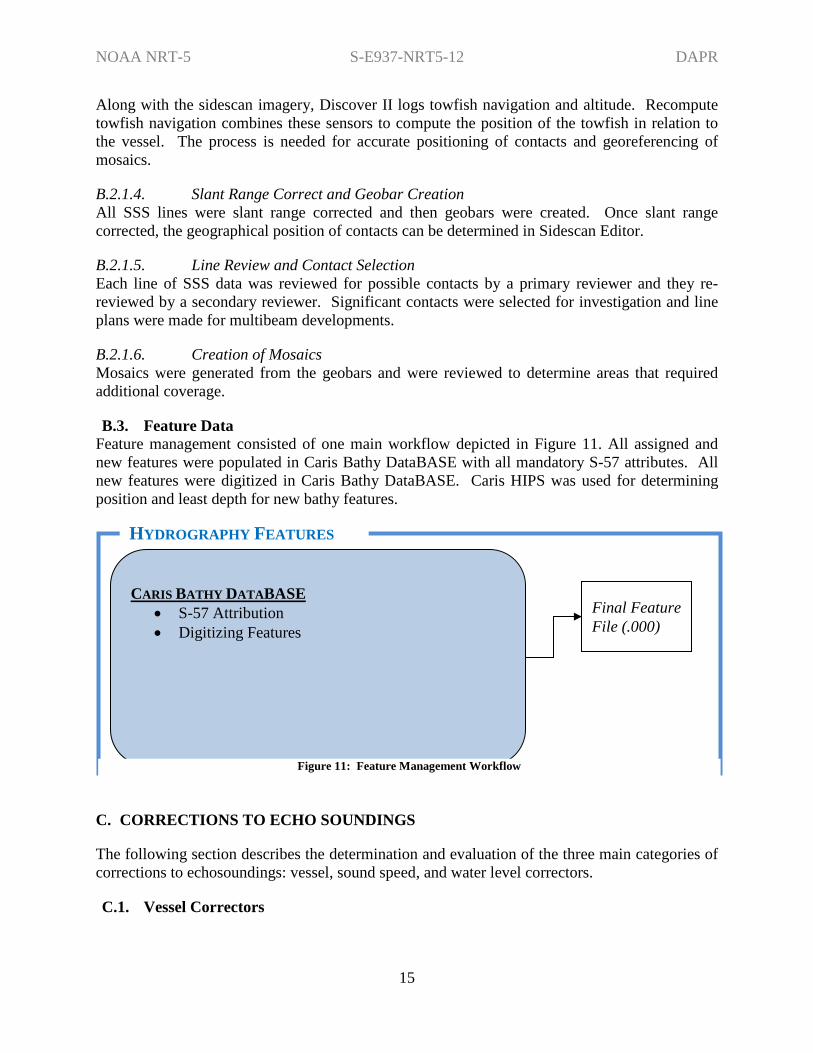
B.3. Feature Data Feature management consisted of one main workflow depicted in Figure 11. All assigned and new features were populated in Caris Bathy DataBASE with all mandatory S-57 attributes. All new features were digitized in Caris Bathy DataBASE. Caris HIPS was used for determining position and least depth for new bathy features.
C. CORRECTIONS TO ECHO SOUNDINGS
The following section describes the determination and evaluation of the three main categories of corrections to echosoundings: vessel, sound speed, and water level correctors.
C.1. Vessel Correctors
Final Feature File (.000)
HYDROGRAPHY FEATURES
CARIS BATHY DATABASE
• S-57 Attribution • Digitizing Features
Figure 11: Feature Management Workflow

NOAA NRT-5 S-E937-NRT5-12 DAPR
16
Vessel correctors include static offsets, dynamic offsets, and patch test biases. The various correctors are applied to echo soundings at different points throughout the data pipeline, which is detailed in the sections below.
C.1.1. Static Offsets
C.1.1.1. Vessel Lever-Arms The National Geodetic Survey conducted a full vessel survey on 8/4-8/5/09 in Middletown, RI (see Appendix II for the NGS report). The primary-GPS-to-Reference-Point lever arm is accounted for in the POS/MV controller. The Reference-Point-to-Multibeam-Transducer lever arm is accounted for in the Caris HVF.
C.1.1.2. Static Draft A static draft measurement was performed in June 2012 in New York Harbor, NY. To determine the static draft (i.e., the height of the waterline above/below the reference point), a straight rod long enough to overhang the boat on each side was laid across the gunwales directly above the IMU. Measurements were taken with a tape measure from the rod to the water line on each side of the boat, and from the rod to the top of the IMU (RP). The port and starboard water line measurements were averaged, and then subtracted from the rod-to-IMU measurement to determine the separation between the reference point and water line.
Figure 10: Static Draft Measurement
C.1.2. Dynamic Offsets The dynamic draft values were obtained on 6/19/2012 prior to data acquisition. The dynamic draft measurements were obtained with an optical level positioned on shore using the methods

NOAA NRT-5 S-E937-NRT5-12 DAPR
17
described in section 1.4.2.1.2.1 of the NOAA Field Procedures Manual. Two independent tests conducted with different observers. The two tests showed excellent correlation, and the average of the two tests were taken as the final values. The dynamic correctors are summarized in Table 2. A positive draft corrector implies that the boat moved down.
Figure 11: Dynamic Draft Optical Level Setup
Table 3: 2012 Dynamic Draft Values
Speed (m/s) Draft Correction (m) 1.132 0.000 1.582 0.012 2.829 0.021 3.614 0.042 4.257 0.069 5.556 0.014

NOAA NRT-5 S-E937-NRT5-12 DAPR
18
Figure 12: Dynamic Draft Plot
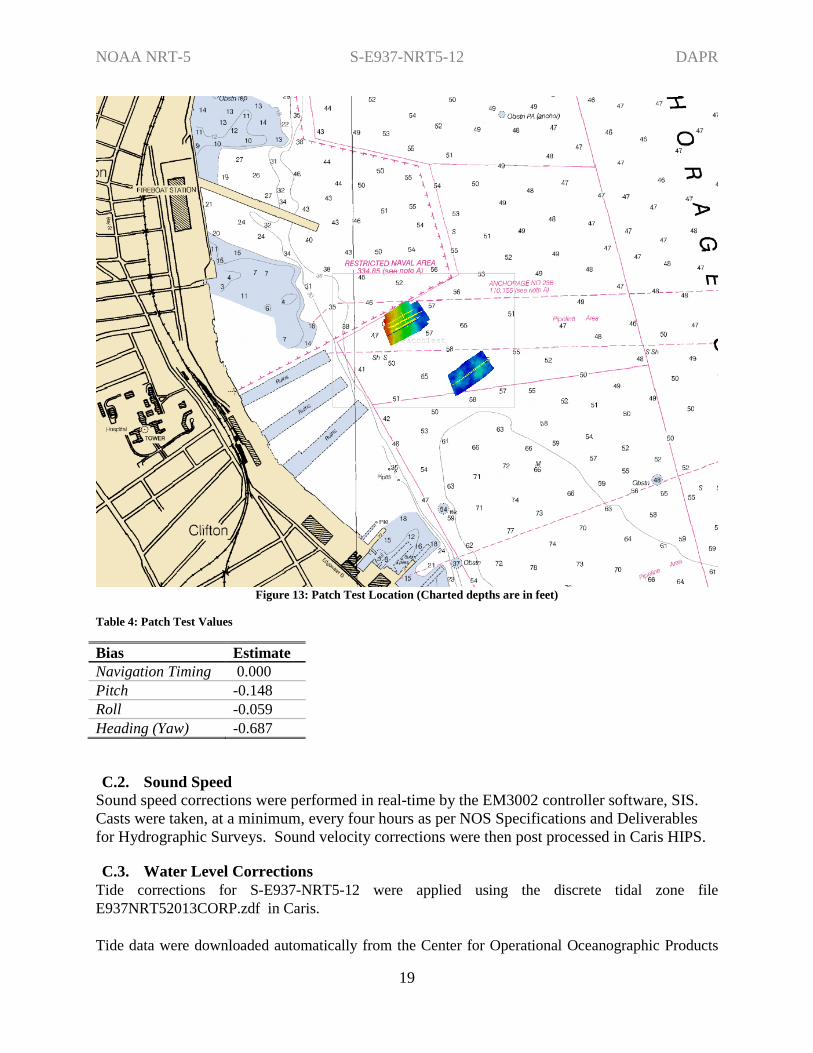
C.1.3. Patch Test Biases A patch test was performed on 6/20/12 (DN 172), in New York Harbor, 1.4 nm north of the Verrazano-Narrows Bridge (see Fig. 16). A charted obstruction in 50 ft of water was located and used as the calibration target. A pair of roll bias lines was collected in a flat area 350 meters to the southwest. The timing offset was determined using the conventional method, rather than the “precise timing” method. The derived biases (summarized in Table 3), were entered into the Swath1 sensor of the Caris HVF and therefore were applied to the data during the merge step of post-processing.
-30-20-10
01020304050607080
0 2 4 6 8 10 12
Dyna
mic
Dra
ft (m
illim
eter
s, p
ositi
ve d
own)
Speed (Knots)
Dynamic Draft 2012
Observation 1
Observation 2
Final Curve
2011_Dynamic_Draft
NOAA NRT-5 S-E937-NRT5-12 DAPR
19
Figure 13: Patch Test Location (Charted depths are in feet)
Table 4: Patch Test Values
Bias Estimate Navigation Timing 0.000 Pitch -0.148 Roll -0.059 Heading (Yaw) -0.687
C.2. Sound Speed Sound speed corrections were performed in real-time by the EM3002 controller software, SIS. Casts were taken, at a minimum, every four hours as per NOS Specifications and Deliverables for Hydrographic Surveys. Sound velocity corrections were then post processed in Caris HIPS.
C.3. Water Level Corrections Tide corrections for S-E937-NRT5-12 were applied using the discrete tidal zone file E937NRT52013CORP.zdf in Caris. Tide data were downloaded automatically from the Center for Operational Oceanographic Products

NOAA NRT-5 S-E937-NRT5-12 DAPR
20
and Services (CO-OPS) using the Fetch Tides utility, and applied to the Caris Hips PVDL lines.

NOAA NRT-5 S-E937-NRT5-12 DAPR
21
APPROVAL SHEET
Data Acquisition & Processing Report
Navigation Response Team 5
As Chief of Party, I have ensured that surveying and processing procedures were conducted in accordance with the Field Procedures Manual and that the submitted data meet the standards contained in the 2012 Hydrographic Surveys Specifications and Deliverables. I acknowledge that all of the information contained in this report is complete and accurate to the best of my knowledge. Respectfully,
LTJG Daniel D. Smith Officer-in-Charge, NOAA R/V Bay Hydro II

Appendices

Appendix I – System Tracking


Hydrographic Personnel Roster Field Unit: NRT-5 Effective Date: December 5, 2012 Updated Through: December 18, 2012 Team Members Name & Grade Current Position Years of hydro Experience Notes Michael Davidson, LT Chief NRB 7.0 Steven Loy, LTjg Team Lead 3.5 Daniel Smith, LTjg Team Lead 3.0 Robert Mowery, NOAA PST 5.5 Nicole Trenholm Contractor 3.0

Appendix II - Vessel Reports, Offsets, and Diagrams

S3002 Dynamic Draft Test 19 June 2012 LT(jg) Steve Loy
Background: NRT-5 is capable of acquiring both bathymetry data and side scan sonar imagery. Accuracy in data
processing is in part dependent on the determination of the change in vessel draft in relation to vessel
speed through the water. This test empirically determines the dynamic draft of S3002 using an optical
level.
Location, Date, and Personnel: The Dynamic Draft values were obtained using the optical method as described in the NOAA Field
Proceedures Manual, section 1.4.2.1.2.1.
Figure 1: Setup Site

Figure 2: Overview of work site
Location of Optical
level and observer
Trackline of Survey
Vessel for speed runs.

Equipment: Applanix POS/MV version 4
DSM 212L DGPS receiver Optical Level
Procedure: Data Acquisition:
The optical level was setup on stone rip rap at the end of an earthen wharf extending approximately 130
meters from shore. This site was chosen because the rip rap was low to the water, stable, and in a
protected canal with adequate. A leveling rod was positioned aboard the vessel near the known center of
rotation so that the vertical displacement would only be affected by settlement and not squat (The terms
settlement and squat are used as they are defined in the NOAA Field Procedures Manual).
Measurements on the rod were taken with the vessel at rest, and at six speeds, ranging from
approximately 2 knots to 10.5 knots with the vessel moving directly away from the reader. Each reading
was taken at the same range to minimize collimation error; this was accomplished by notifying the reader
via hand held VHF when the vessel reached a predetermined target position in Hypack. Readings were
also taken with the vessel at rest between each speed run to compensate for any tidal variation over the
course of the test. The vessel speed was read from the PosMV viewer on each run. The vessel speed on
the reciprocal course was also recorded to account for any current. The test was then repeated with a
different observer.
Data Processing:
To determine the dynamic draft (vertical displacement) values the at-rest reading before and after each
speed run were interpolated to the time of the measurement, and subtracted from the reading at speed.
The speed value associated with each dynamic draft value was determined by averaging the speed on
reciprocal courses for each run. The final set of values was obtained by averaging the results from the
two trials. The values are tabulated below:
Table 1
Note: * - Reading was ignored due because the setup was found to be disturbed.

Table 2
Note: * - Reading was ignored due because the setup was found to be disturbed.
Figure 3: Plot of Dynamic Draft Curve
-30
-20
-10
0
10
20
30
40
50
60
70
80
0 2 4 6 8 10 12
Dyn
amic
Dra
ft (
mill
ime
ters
, p
osi
tive
do
wn
)
Speed (Knots)
Dynamic Draft 2012
Observation 1
Observation 2
Final Curve
2011_Dynamic_Draft

Conclusions:
The excellent correlation between the two trials gives a high level of confidence in the testing methods
employed. It is our conclusion that the dynamic draft values obtained from this test are accurate, and
suitable for use through the 2012 field season, assuming no major modifications are made to the survey
vessel.

U.S. Department of Commerce National Oceanic & Atmospheric Administration
National Ocean Service National Geodetic Survey Field Operations Branch
NOAA Boat – S 3002 IMU and MULTI-BEAM Component Spatial Relationship Survey
Field Report
Kevin Jordan August, 2009

NOAA Boat – S 3002 IMU and MULTI-BEAM Survey PURPOSE The intention of this survey was to accurately position the Inertial Measuring Unit (IMU) and MULTI-BEAM (MBES) components that have been installed onboard the NOAA Boat S 3002. PROJECT DETAILS This survey was conducted on August 4 & 5, 2009 near the Naval Education and Training Center in Middletown, RI. The Boat was on a trailer and attached to a towing vehicle. The weather was clear and sunny on the day of the survey. Reconnaissance was conducted, and control marks CL 1, BM 1, BM 2, and BM 3 were found as described. CL 2 and BM 4 were searched for, but were not recovered. INSTRUMENTATION The TOPCON GPT 3000 Series Total Station was used to make all measurements.
A SECO 25 mm Mini Prism System configured to have a zero mm offset was used as target sighting and distance measurements.
SOFTWARE AND DATA COLLECTION
ADL Ver. 2.0.11 was used for data collection
ForeSight DXM Ver. 3.2.2 was used for post processing.
PERSONNEL
Kevin Jordan NOAA/NOS/NGS/Field Operations Branch 757-441-3603
Steve Holdorff NOAA/NOS/NGS/Field Operations Branch 757-441-3603

NOAA Boat – S 3002 IMU and MULTI-BEAM Survey SURVEY PROCEDURES Establishing the Centerline To conduct this survey a local coordinate reference frame was established, where the X axis runs along the centerline of the boat and is positive from the primary reference point towards the bow of the boat. The Y axis is perpendicular to the centerline of the boat (X axis), and is positive from the primary reference point towards the right, when looking at the boat from the stern. The Z axis is positive in an upward direction from the primary reference point. A temporary centerline mark (TCL) was established to align horizontally with CL 1. This was performed by measuring between the two benchmarks at the stern (BM 2 and BM 3) and placing a single punch mark on the deck halfway between them. An assumed distance of 3 meters was entered into NGS Program FORWARD.exe to produce a coordinate along the X axis to enter into the data collector to start the survey (initial azimuth). The instrument was setup on TCL and an assumed elevation of 100 ft was entered into the data collector. A prism was set above CL 1 and an azimuth of 0° 00’ 00” was entered into the data collector while aimed at CL 1. From this station, temporary control points (TP 1 and TP 2) were set off the boat on steady ground. Setup 1 TP 1 – While occupying TP 1 the instrument was set to initialize on TCL. After initialization was conducted, angular and distance measurements were taken to collect the following points: VBES (SINGLE-BEAM center point), GPS STAR (Starboard GPS Receiver), GPS PORT (Port GPS Receiver), DGPS (Differential GPS Receiver), BM 1, IMU, and BM 3. Setup 2 TP 2 – Occupying TP 2 the instrument was set to initialize on TCL. After initialization was conducted, angular and distance measurements were taken to collect the following points: MBES (MULTI-BEAM center point), BM 2, and SSS TP (SIDE SCAN SONAR TOW POINT), and CL 1 OBS*. Coordinate checks were made to the following previously established points:

BM 3 X, Y = 0.008(m) Z = 0.005(m) IMU X, Y = 0.020(m) Z = 0.005(m) DGPS X, Y = 0.005(m) Z = 0.005(m) GPS PORT X, Y = 0.010(m) Z = 0.002(m) GPS STAR X, Y = 0.000(m) Z = 0.002(m) BM 1 X, Y = 0.027(m) Z = 0.009(m) * CL 1 OBS was positioned, but was determined later to have a bad elevation after review of field work later that day. Survey operations were conducted on the following day to correct this bad elevation. Setup 3 Occupying TP 1 the instrument was set to initialize on TCL. After initialization was conducted, angular and distance measurements were taken to collect the following point: TP 4 During this observation, a coordinate check was made to: BM 2 X, Y = 0.002(m) Z = 0.002(m)

Setup 4 TP 4 – Occupying TP 1 the instrument was set to initialize on TCL. After initialization was conducted, angular and distance measurements were taken to collect the following point: CL 1 OBS During this observation, a coordinate check was made to: TP 1 X, Y = 0.001(m) Z = 0.009(m) POST PROCESSING Since the project was initialized using assumed positions and elevations, the collected points needed to be translated to a referenced coordinate system. Using ForeSight DXM, our observed CL 1 OBS was translated N 0.000(m), E 0.000(m), and Elev 0.000(m). See table 1 The same adjustment was made for the IMU as the reference point of N 0.000(m), E 0.000(m), and Elev 0.000(m). See table 1 DISCUSSION All sensor/benchmark coordinates are contained in spreadsheet “S3002 2009.xls.” The positions given for all GPS antenna are to the top center of the antenna. As stated from the previous 2005 survey by Kendall L. Fancher:
“To correct the Z value contained in the spreadsheet for each antenna to the electronic phase center, I recommend the following steps be taken;
1) Measure the total height of each antenna type. This information is probably located on the antenna or with equipment documentation. 2) Investigate to find the electronic phase center offset of the antenna. This information is probably located on the antenna or with equipment documentation. This value may also be available at the NGS website for antenna modeling.

3) Subtract the total height of the antenna from the spreadsheet Z value for each antenna. This will give you a Z value for the ARP (antenna reference point) 4) Then add to this value the electronic phase center offset value.”
NOAA BOAT S 3002
∆ Reference Point
CL1 ∆ Reference Point
IMU
POINT Name ∆x (m)
∆y (m)
∆z (m)
∆x (m)
∆y (m)
∆z (m)
CL1 OBS CENTERLINE POINT 1 0.000 0.000 0.000 2.070 0.001 -0.427
TCL TEMPORARY CENTERLINE -3.159 0.004 1.128 -1.089 0.004 0.701
BM1 BENCH MARK 1 4.477 0.022 1.497 6.547 0.022 1.070
BM2 BENCH MARK 2 -3.143 -1.129 1.256 -1.073 -1.128 0.829
BM3 BENCH MARK 3 -3.157 1.140 1.233 -1.087 1.141 0.806
IMU IMU -2.070 -0.001 0.427 0.000 0.000 0.000
DGPS GPS NAVIGATION ANTENNA -0.608 0.013 3.607 1.462 0.014 3.180
GPS PORT IMU GPS PORT SIDE 1.125 -0.756 2.827 3.195 -0.755 2.400
GPS STAR IMU GPS STARBOARD SIDE 1.137 0.782 2.825 3.207 0.783 2.398
MBES MULTIBEAM REFERENCE POINT -1.913 0.057 -0.112 0.158 0.058 -0.539
VBES SINGLE BEAM REFERENCE POINT 0.179 -0.163 -0.026 2.249 -0.162 -0.453
SSS TP SIDE SCAN SONAR TOW POINT -2.826 1.646 2.915 -0.756 1.647 2.488
Table 1. - NRT S 3002 survey August 2009

CONTROL INVERSE COMPARISON (HORIZONTAL ONLY)
2005 SURVEY IN METERS 2009 SURVEY IN METERS DIFFERENCE IN METERS
CL1 TO BM1 4.433 4.477 -0.044
CL1 TO BM2 3.371 3.399 -0.028
CL1 TO BM3 3.378 3.357 0.021
BM1 TO BM2 7.693 7.706 -0.013
BM1 TO BM3 7.699 7.719 -0.020
BM2 TO BM3 2.265 2.269 -0.004
Table 2. – NRT S 3002 Control network inverse comparison.

DIGIBARPRO
DIGIBARPRO
Position *9600,N,8,1,N
CrossoverPatch
Serial
Key
Philip SparrRev 1.0
SBE 19plus
CTD
COM 4COM 1
LAN 2 – EM3002
LAN
CO
M 6
(P0)
CO
M 7
(P1)
CO
M 8
(P2)
CO
M 9
(P3)
CO
M 1
0 (P
4)
CO
M 1
1 (P
5)
CO
M 1
2 (P
6)
CO
M 1
3 (P
7)
Attitude**19200,N,8,1,N
COM 2
157.237.2.62
205.156.4.3:5602
LAN 1 – POSMV 205.156.4.1
LINKSYS SWITCHPOS/MV &
Odom
* POS/MV COM 1 Position Data: 9600,N,8,1,NONE; GGA, HDT, ZDA, VTG; 1Hz** POS/MV COM 2 Attitude Data: SIMRAD 1000 Tate-Bryant, 25Hz
COM 5
Acquisition PC/Hypack
KONGSBERG EM3002Processing Unit (PU)
COM 1
COM 2
157.237.2.61:16103
POS/MV 320 V4
SSS/KLEIN TPU
3CHODOM EchoTrac CV
TRIMBLEDSM212L
PORT BPORT A
Dynapar Cable
Counter
CTD Download & Init9600,N,8,1,NONE
DELPH TO SSS PC (cable out)2400,N,7,1,NONE
PPS toEM3002
4800,N,8,1,NONE
DIG
IBAR
Sou
nd S
peed
Cas
t Dow
nloa
d96
00,N
,8,1
,NO
NE
Tran
sduc
er S
ound
Spe
ed (H
ypac
k)96
00,N
,8,1
,NO
NE
Debug9600,N,8,1,N
AIS NMEA IN38400,N,8,1,N
AIS Transponder
NMEA OUT GGA,GGT,UTC4800,N,8,1,Hardware Ctrl
RadarVHF
COM 3RTCM IN
9600,N,8,1,N
192.9.0.100LAN 3 - SSS
TSIP Talker Control9600,N,8,1,NONE
Launch S3002 Wire Diagram
5/5/2011

Appendix III – Calibration

SEA-BIRD ELECTRONICS, INC.13431 NE 20th Street Bellevue, Washington 98005 USA
Phone: (425) 643-9866 Fax: (425) 643-9954 www.seabird.com
Conductivity Calibration Report
Conductivity sensors are normally calibrated 'as received', without cleaning or adjustments, allowing a determination of
sensor drift. If the calibration identifies a problem or indicates cell cleaning is necessary, then a second calibration is
performed after work is completed. The 'as received' calibration is not performed if the sensor is damaged or non-
functional, or by customer request.
Customer: NOAA-NAVIGATION RESPONSE BRANCH
Job Number: 67534
Model Number SBE 19Plus
Date of Report: 1/30/2012
Serial Number: 19P39974-4835
An 'as received' calibration certificate is provided, listing the coefficients used to convert sensor frequency to
conductivity. Users must choose whether the 'as received' calibration or the previous calibration better represents the
sensor condition during deployment. In SEASOFT enter the chosen coefficients. The coefficient 'slope' allows small
corrections for drift between calibrations (consult the SEASOFT manual). Calibration coefficients obtained after a
repair or cleaning apply only to subsequent data.
'AS RECEIVED CALIBRATION' PerformedPerformedPerformedPerformed Not PerformedNot PerformedNot PerformedNot Performed
Date:Date:Date:Date: 1/28/2012 Drift since last cal:Drift since last cal:Drift since last cal:Drift since last cal: -0.00030 PSU/month*PSU/month*PSU/month*PSU/month*
Comments:Comments:Comments:Comments:
'CALIBRATION AFTER CLEANING & REPLATINIZING' PerformedPerformedPerformedPerformed Not PerformedNot PerformedNot PerformedNot Performed
Date:Date:Date:Date: Drift sinceDrift sinceDrift sinceDrift since PSU/month*PSU/month*PSU/month*PSU/month*
Comments:Comments:Comments:Comments:
Cell cleaning and electrode replatinizing tend to 'reset' the conductivity sensor to its original condition. Lack of drift in
post-cleaning-calibration indicates geometric stability of the cell and electrical stability of the sensor circuit.
*Measured at 3.0 S/m
Last cal:Last cal:Last cal:Last cal:

Sea-Bird Electronics, Inc.13431 NE 20th Street, Bellevue, WA 98005-2010 USA
Phone: (+1) 425-643-9866 Fax (+1) 425-643-9954 Email: [email protected]
SENSOR SERIAL NUMBER: 4835
CALIBRATION DATE: 28-Jan-12
SBE19plus TEMPERATURE CALIBRATION DATA
ITS-90 TEMPERATURE SCALE
ITS-90 COEFFICIENTS
a0 = 1.267279e-003
a1 = 2.593243e-004
a2 = 5.041887e-007
a3 = 1.341580e-007
BATH TEMP INSTRUMENT INST TEMP RESIDUAL
(ITS-90) OUTPUT(n) (ITS-90) (ITS-90)
0.9999 600974.254 0.9999 -0.0000
4.5000 533092.610 4.5000 0.0000
15.0000 365259.746 14.9999 -0.0001
18.5000 320328.508 18.5001 0.0001
24.0000 259412.424 24.0000 0.0000
29.0000 213095.051 28.9999 -0.0001
32.5000 185134.542 32.5001 0.0001
MV = (n - 524288) / 1.6e+007
R = (MV * 2.900e+009 + 1.024e+008) / (2.048e+004 - MV * 2.0e+005)
Temperature ITS-90 = 1/{a0 + a1[ln(R)] + a2[ln2
(R)] + a3[ln3
(R)]} - 273.15 (°C)
Residual = instrument temperature - bath temperature
Date, Delta T (mdeg C)
-0.02
-0.01
0.00
0.01
0.02
-5 0 5 10 15 20 25 30 35
Re
sid
ua
l, (
De
gre
es C
)
Temperature, Degrees C
19-Feb-11 -0.30
28-Jan-12 0.00

Sea-Bird Electronics, Inc.13431 NE 20th Street, Bellevue, WA 98005-2010 USA
Phone: (+1) 425-643-9866 Fax (+1) 425-643-9954 Email: [email protected]
SENSOR SERIAL NUMBER: 4835
CALIBRATION DATE: 26-Jan-12
SBE19plus PRESSURE CALIBRATION DATA
160 psia S/N 7813
COEFFICIENTS:
PA0 = -3.956919e-003
PA1 = 4.871780e-004
PA2 = -3.560781e-012
PTEMPA0 = -6.075336e+001
PTEMPA1 = 5.327189e+001
PTEMPA2 = 3.924029e-003
PTCA0 = 5.240192e+005
PTCA1 = 1.090882e+000
PTCA2 = -8.473146e-002
PTCB0 = 2.512200e+001
PTCB1 = -2.000000e-003
PTCB2 = 0.000000e+000
PRESSURE SPAN CALIBRATION THERMAL CORRECTION
PRESSURE INST THERMISTOR COMPUTED ERROR TEMP THERMISTOR INST
PSIA OUTPUT OUTPUT PRESSURE %FSR ITS90 OUTPUT OUTPUT
14.77 554243.0 1.6 14.75 -0.01 32.50 1.75 555177.34
30.01 585545.0 1.6 30.02 0.01 29.00 1.69 555194.76
60.03 647111.0 1.6 60.03 -0.00 24.00 1.59 555213.03
95.03 718964.0 1.6 95.01 -0.01 18.50 1.49 555225.29
125.02 780674.0 1.6 125.03 0.00 15.00 1.42 555226.36
160.04 852730.0 1.6 160.05 0.00 4.50 1.23 555238.11
125.05 780712.0 1.6 125.05 0.00 1.00 1.16 555233.68
95.05 719044.0 1.6 95.05 -0.00
60.06 647175.0 1.6 60.06 -0.00 TEMP(ITS90) SPAN(mV)
30.07 585695.0 1.6 30.09 0.01 -5.00 25.13
14.77 554273.0 1.6 14.77 -0.00 35.00 25.05
y = thermistor output; t = PTEMPA0 + PTEMPA1 * y + PTEMPA2 * y2
x = pressure output - PTCA0 - PTCA1 * t - PTCA2 * t2
n = x * PTCB0 / (PTCB0 + PTCB1 * t + PTCB2 * t2
)
pressure (psia) = PA0 + PA1 * n + PA2 * n2
Date, Avg Delta P %FS
-0.50
-0.25
0.00
0.25
0.50
0 25 50 75 100 125 150 175
Re
sid
ua
l, (
% F
SR
)
Pressure (PSIA)
26-Jan-12 -0.00
Sea-Bird Electronics, Inc.13431 NE 20th Street, Bellevue, WA 98005-2010 USA
Phone: (+1) 425-643-9866 Fax (+1) 425-643-9954 Email: [email protected]
SENSOR SERIAL NUMBER: 4835
CALIBRATION DATE: 28-Jan-12
SBE19plus CONDUCTIVITY CALIBRATION DATA
PSS 1978: C(35,15,0) = 4.2914 Siemens/meter
COEFFICIENTS:
g = -1.018832e+000
h = 1.322201e-001
i = -2.587017e-004
j = 3.613662e-005
CPcor = -9.5700e-008
CTcor = 3.2500e-006
BATH TEMP BATH SAL BATH COND INST FREQ INST COND RESIDUAL
(ITS-90) (PSU) (Siemens/m) (Hz) (Siemens/m) (Siemens/m)
22.0000 0.0000 0.00000 2780.52 0.0000 0.00000
0.9999 34.9075 2.98301 5508.36 2.9830 0.00001
4.5000 34.8868 3.29072 5715.57 3.2907 -0.00001
15.0000 34.8424 4.27448 6331.90 4.2745 -0.00001
18.5000 34.8327 4.62031 6534.48 4.6203 -0.00000
24.0000 34.8217 5.17934 6848.95 5.1794 0.00002
29.0000 34.8151 5.70214 7130.12 5.7021 0.00000
32.5000 34.8095 6.07494 7323.82 6.0749 -0.00001
f = INST FREQ / 1000.0
Conductivity = (g + hf2
+ if3
+ jf4
) / (1 + δt + εp) Siemens/meter
t = temperature[°C)]; p = pressure[decibars]; δ = CTcor; ε = CPcor;
Residual = instrument conductivity - bath conductivity
Date, Slope Correction
-0.002
-0.001
0.000
0.001
0.002
0 1 2 3 4 5 6 7
Resid
ual, (
S/m
)
Conductivity (Siemens/m)
19-Feb-11 0.9998792
28-Jan-12 1.0000000

Customer: NOAA-NAVIGATION RESPONSE BRANCH
Job Number: 67534
Model Number SBE 19Plus
Date of Report: 1/30/2012
Serial Number: 19P39974-4835
'AS RECEIVED CALIBRATION' PerformedPerformedPerformedPerformed Not PerformedNot PerformedNot PerformedNot Performed
Date:Date:Date:Date: 1/28/2012 Drift since last cal:Drift since last cal:Drift since last cal:Drift since last cal: +0.00032 Degrees Celsius/yearDegrees Celsius/yearDegrees Celsius/yearDegrees Celsius/year
Comments:Comments:Comments:Comments:
'CALIBRATION AFTER REPAIR' PerformedPerformedPerformedPerformed Not PerformedNot PerformedNot PerformedNot Performed
Date:Date:Date:Date: Drift sinceDrift sinceDrift sinceDrift since Degrees Celsius/yearDegrees Celsius/yearDegrees Celsius/yearDegrees Celsius/year
Comments:Comments:Comments:Comments:
Last cal:Last cal:Last cal:Last cal:
Temperature sensors are normally calibrated 'as received', without adjustments, allowing a determination sensor drift.
If the calibration identifies a problem, then a second calibration is performed after work is completed. The 'as received'
calibration is not performed if the sensor is damaged or non-functional, or by customer request.
An 'as received' calibration certificate is provided, listing coefficients to convert sensor frequency to temperature. Users
must choose whether the 'as received' calibration or the previous calibration better represents the sensor condition
during deployment. In SEASOFT enter the chosen coefficients. The coefficient 'offset' allows a small correction for
drift between calibrations (consult the SEASOFT manual). Calibration coefficients obtained after a repair apply only to
subsequent data.
SEA-BIRD ELECTRONICS, INC.13431 NE 20th St. Bellevue, Washington 98005 USA
Phone: (425) 643-9866 Fax: (425) 643-9954 www.seabird.com
Temperature Calibration Report
Date:ad17.2011
Serial#:98214-101711
STANDARD DEL GROSSO H2O
TEMP VELOCITY MEASURED RES-VEL
FREQUENCY
DTGTBAR cALlP,TfIloN REPoRT
ODOM HYDROGRAPHIC SYSTEMS. lnc.
VELOCITY MEASURED RES-VEL OBS-CAL
FREQUENCY
4.00
4.50
5.00
5.50
6.00
6.50
7.00
7.50
8.00
8.50
9.00
9.50
'10.00
10.50
11.00
11.50
12.00
12.50
13.00
13.50
14.00
14.50
15.00
15.50
16.00
IO.JU
17.00
1421.62
1423.90
1426.15
1428.38
1 430.58
1432.75
1 434.90
1437.02
1439.12
1441.19
1443.23
1445.25
1447.25
1449.22
1451.17
'1453.09
1 454.99
1456.87
1458.72
1460.55
1462.36
1464.14
146s.91
1 467.65
1 469.36
t4l I .UO
1472.73
5556.1 6
5564.61
5572.97
5581.23
5590.1 I5597.71
5605.98
561 4.16
5622.11
5629.78
5637.09
5645.05
5652.34
5659.96
5666.98
5674.70
5681.13
5688.57
5695.41
5702.19
5708.87
5715.63
5722.46
5728.93
5735.28
5741.97
5748.29
1421.65
1423.89
1426.12
1428.32
1430.70
1432.70
1434.90
1437.08
1 439.1 I1441 .24
1443.18
1445.30
1447.24
1449.27
1451.13
1 453.1 I1454.90
1 456.88
1 458.70
1 460.50
1462.28
'1464.08
'1465.90
1467.62
1469.31
1471.09
1472.77
0.02
-0.0'l
-0.03
-0.06
0.12
-0.05
0.00
0.06
0.08
0.05
-0.05
0.04
-0.01
0.04
-0.04
0.09
-0.1 0
0.01
-0.02
-0.05
-0.08
-0.06
-0.01
-0.03
-0.05
0.03
0.04
1474.38
1476.01
1477.62
1475.21
1480.77
1482.32
1483.84
1485.35
1486.83
1488.29
1489.74
1491.16
1492.56
'1493.95
1495.32
1496.66
1497.99
1499.30
1 500.59
1501 .86
1 503.1 1
1 504.35
1 505.56
'1506.76
'1507.94
1 509.1 0
5754.23
5760.71
5766.81
5772.27
5778.59
5783.81
5790. 1 5
5795.66
5801.24
5806.64
5812.04
5816.86
5822.75
5828.12
5833.23
5837.82
5843.02
5848.09
5852.97
5857.86
5862.62
5867.1 9
5871.36
s876.28
5881.00
5884.92
1474.35
1476.08
1477.70
1479.15
1 480.83
1482.22
1483.91
1485.38
1486.86
1488.30
1489.73
1491.02
1 492.58
1494.01
1495.37
1 496.59
1497.98
1499.33
1 500.63
1501 .93
1 503.1 I1504.41
1 505.52
1 506.83
1 508.08
1 509.1 3
-0.03
0.07
0.08
-0.05
0.06
-0.09
0.07
0.03
0.03
0.00
0.00
-0.14
0.02
U.Ub
U.Ub
-0.07
-0.01
0.03
0.04
0.07
0.08
0.06
-0.04
0.07
0.14
0.02
OBS-CAL TEMP
17.50
18.00
18.50
19.00
19.50
20.00
20.50
21.00
21.50
22.00
22.50
23.00
23.50
24.00
24.50
25.00
25.50
26.00
26.50
27.00
27.50
28.00
28.50
29.00
29.50
30.00
0.20
0.10
0.00
-0.10
-0.20
@Odom Hydrographic Systems, lnc.
1450 SeaBoard Avenue, Baton Rouge, Louisiana 70810-6261, USATelephone: (225)-769-305 1 , Facsimile: i.225)-766-5122
E-mail : [email protected], HTTP: w.odomhydrographic.com

Date:Oct 17,2011
Serial#:98214-10171'l
DIGIBAR CALIBRATION REPORTversion 1.0 (c) 2004
ODOM HYDROGRAPHIC SYSTEMS. Inc.
Burn these numbers to EPROM: Gradientlntercept
The instruments used in this calibration have been calibrated to the published manufacturer specifications using standards traceable toNIST, to consensus standards, to ratio methods, or to acceptable values of natural physical constants that meets the requirements ofANSI/NCSL 2540-1,ISO 9001, ISO 10012 and ISO 17025. Certificateitraceability numbers: 0002-2655.00-23491-001,0002-2655.00-23491 -002. lD#'s:294,295,7 62,1 7 2,56
@Odom Hydrographic Systems, lnc.
1450 SeaBoard Avenue, Baton Rouge, Louisiana 70810-6261, USATelephone: (225)-769-3051, Facsimile: 1225)-7 66-51 22
E-mail: [email protected], HTTP: w.odomhydrographic.com
3407569
Calibration Graph
TEMPERATURE (CENTIGRADE)
2.OO
oe,tuh 1.oo
=.ouJ
I o.oofo
9ff -r.oo
tUJooo
-z.oo
7\t I'o tt^?tT5 Ro G RAP H I cA Teledyne Technologies Company
Date 1011912011
Serial# 982145W Versron
Cable Lenqth 100m
a(L
Digibar
Pressure Transducer Linearity
Press Transduce 57287Zero Voltaoe 19Soan Volaoe 2.69Mid-Scale Voltaq 1.44R5 3.9KR9 10KGradient 3407lntercept 569
3oard ldentification Serial#rower Supply3ontrol PCBCD
)robe Sensorrrobe Controller\irmar Transducer 1811914
Max osi: 200 osiVelocitv Check:Depth Check:CommunicationsExternal Power: NA
Transducer LinearitvPSI DVM(o11
0 0.191 0.2033 0.2275 0.25210 0.315't5 0.377
25 0.50150 o.81475 1.127
100 1.44
DVM @ Ll

Date:Jan 16.2012
Serial#:98212-011612
STANDARD DEL GROSSO H2O
TEMP VELOCITY MEASURED RES-VEL
FREQUENCY
DIGIBAR CALIBRATION REPORTversionl.0 (c)2004
ODOM HYDROGRAPHIC SYSTEMS, lnc
VELOCIry MEASURED RES-VEL
FREQUENCY
4.00
4.50
5.00
5.50
6.00
6.50
7.00
7.50
8.00
8.50
9.00
9.50
10.00
10.50
1 1.00
1 1.50
12.00
12.50
13.00
13.50
14.00
14.50
15.00
15.50
16.00
16.50
17.00
1421.62
1423.90
1426.15
1428.38
1 430.58
1432.75
1 434.90
1437.02
1439.12
1441.19
1443.23
1445.25
1447.25
1449.22
1451.17
1 4s3.09
1 454.99
1 456.87
1458.72
1 460.55
1462.36
1464.14
1465.91
'1467.65
1469.36
1471.06
1472.73
5549.1 1
5557.24
5565.58
5573.64
5582.27
5590.1 I5598.38
5606.47
5614.59
30zz-50
5630.33
5637.59
5644.98
5652.34
5659.77
5666.91
5674.01
5681 .1 3
5687.69
5695.22
5701.69
5708.49
5714.80
5721.63
5728.22
5734.13
5740.55
1421.71
1423.87
1426.O9
1428.24
1430.54
1432.65
1434.83
1436.99
1 439.1 5
1441.22
1443.34
1445.28
1447.25
1449.21
1451.19
1453.09
1454.98
1456.88
1458.63
1460.63
1462.35
1464.17
1465.85
1467.67
1469.42
1471.00
1472.71
0.09
-0.03
-0.06
-0.14
-0.04
-0.10
-0.07
-0.03
0.03
0.03
0.11
0.02
0.00
-0.02
0.02
-0.01
-0.01
0.01
-0.10
0.08
-0.01
0.02
-0.06
0.02
0.06
-0.06
4.02
1474.38
1476.01
1477.62
1479.21
1480.77
1482.32
1483.84
1485.35
1486.83
1488.29
1489.74
'1491.16
1492.56
1493.95
1495.32
1496.66
1497.99
1499.30
1 500.59
1501 .86
'1503.11
1 504.35
1 505.56
'1506.76
'1507.94
I 509.1 0
5747.13
5753.20
5758.89
5765.12
5770.97
5776.70
5782.83
5788.45
5793.63
5799.07
5804.66
5810.00
5815.60
5820.23
5825.66
5830.71
5835.96
5840.55
5845.22
5850.02
5854.64
5859.60
5863.96
5868.67
5873.04
5877.49
1474.46
1476.08
1477.59
1479.25
1480.81
1482.34
1483.97
1485.47
1486.85
1488.30
1489.79
1491.21
1492.70
1493.93
1495.38
1 496.73
1 498.1 3
1499.35
1500.59
1501 .87
1 503.1 0
1504.42
1505.58
1506.84
1508.00
1 509.1 I
0.08
0.07
-o.o2
0.05
0.04
0.02
0.13
0.12
0.02
0.00
0.05
0.05
o.14
-0.02
0.07
0.07
0.14
0.05
0.01
0.01
-0.01
0.08
0.02
0.08
0.06
0.09
OBS-CAL TEMP
17.50
18.00
18.50
19.00
19.50
20.00
20.50
21.00
21.50
22.00
22.50
23.00
23.50
24.00
24.50
25.00
25.50
26.00
26.50
27.00
27.50
28.00
28.50
29.00
29.50
30.00
OBS-CAL
0.20
0.10
0.00
-0.10
-0.20
@Odom Hydrographic Systems, lnc.
1450 SeaBoard Avenue, Baton Rouge, Louisiana 70810-6261, USATelephone: (225)-769-3051, Facsimile: (225)-7 66-5122
E-mail: [email protected], HTTP: M.odomhydrographic.com

Date:Jan 16,2Q12
Serial#:98212-011612
Burn these numbers to EPROM:
DIGIBAR CALIBRATION REPORTv€rsion1.0 (c)2004
OOOM HYDROGRAPHIC SYSTEMS, lnc.
Gradientlntercept
3410566
Calibration Graph
rioN
TEMPERATURE (CENTIGRADE)
2.OO
6tLll
h 1.oo
3oIIJ
J o.oo:)o
Iff -r.oo
tEIamo
-z.oooqo
Oqro
oqo
oqrON
Oco(eOqlJ)(9
The instruments used in this calibration have been calibrated to the published manufacturer specifications using standards traceable toNIST, to consensus standards, to ratio methods, or to acceptable values of natural physical constants that meets the requirements ofANSI/NCSL 2540-1,lSO 9001, ISO 10012 and ISO 17025. Certificate/traceability numbers: 0002-2655.00-23491-001, 0002-2655.00-23491 -002. lD#'s:294,295,7 62,1 7 2,56
@Odom Hydrographic Systems, Inc.
1 450 SeaBoard Avenue, Baton Rouge, Louisiana 7081 0-6261, USATelephone: (225)-769-3051, Facsimile: 1225)-766-5122
E-mail: [email protected], HTTP: M.odomhydrographic.com
7\t ltt"t^lttT5 R o G RA P H I cA Teledyne Technologies Company
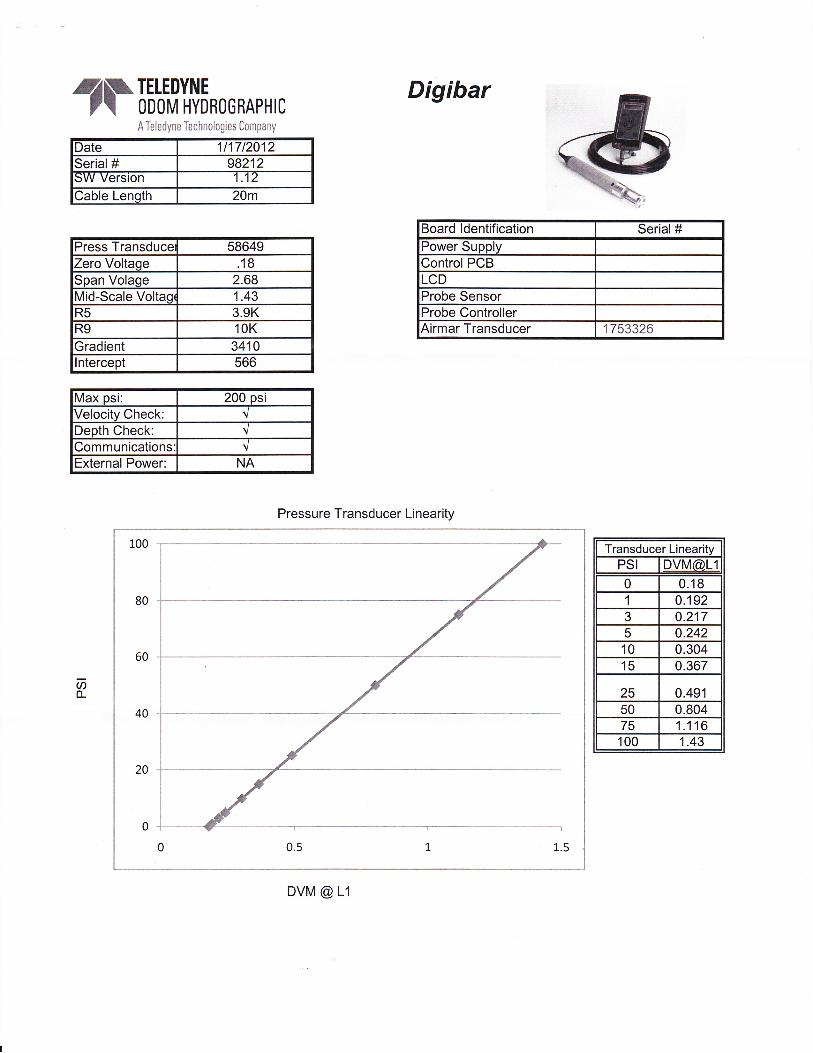
)ate 1t17t2012Serial# 98212iw verston 'tz
3able Length 20m
Digibar
rress Transduce 58649Zero Voltaqe 1B
Span Volage 2.68Vlid-Scale Voltaq 1.43R5 3.9KR9 10K
3radient 3410ntercept 566
Board ldentification Serial#Power SupplyOontrolPCBLCDProbe SensorProbe ControllerAirmar Transducer 1753326
Max psi: 200 osiy'elocitv Check: {Jepth uhecK:lommunicationslxternal Power: NA
Pressure Transducer Linearity
100
80
60
40
20
0
Transducer LinearitvPSI DVM@11
0 0.181 0.1923 0.2175 0.24210 0.30415 0.367
25 0.49150 0.80475 1.116100 1.43
U)TL
DVM @ L1

Appendix IV – Electronic Appendix
The Electronic Appendix contains digital files meant to accompany the report body. It is
submitted as a .zip file located in the Appendix4-ElectronicAppendix folder.