)URP³ …€¦ · The basic annotations for the mock up shells i s been done. The programmer uses...
13
1 PharmaSUG 2014 - Paper IB07 From “Just Shells” to a Detailed Specification Document for Tables, Listings and Figures Supriya Dalvi, InVentiv Health Clinical, Mumbai, India ABSTRACT We are assigned a new study. We go through the protocol, the statistical analysis plan, the mock up shells and start programming. The basic annotations for the mock up shells is been done. The programmer uses this as a specification document for generating the outputs; similarly the validator uses it for QC of the outputs. There are some differences in understanding between the two as the shells are not “clear enough” leading to discussions amongst them , also involving the statistician at several times .At the time of Statistical review, it is observed there are inconsistencies in the layout of the reports, date formats, visit orders, treatment group information, common derivations etc… The result: a lot of rework on correcting these issues, loss of time, confusions and a question mark on the quality of the reports. Could this have been avoided if the mock up shells were given some more attention than what they got? May be Yes…How? Let’s try to understand… BUILDING THE BASE FOR A GOOD SPECIFICATION DOCUMENT The Shell for the tables, figures and sometimes listings are usually attached to the SAP (Statistical Analysis Plan). If not, it could be provided as a separate document also. Step by Step process for creating the specifications: 1. The SAP is the most important document for a statistical programmer since all deliverables from the statistical programmer are defined in this document. A careful review of the SAP text and the TFL shells is a must before starting the annotations. A few examples are given below: Are the TFLs mentioned in the shells, also mentioned in the SAP text? E.g. Shell contains AE tables by intensity, relation ship. But is it mentioned in the SAP too? Are the TFLs mentioned in the SAP text, explained in the same manner in the shells as well? E.g. The SAP mentions to display an Overall treatment group for all tables, does the shell has the layout in similar fashion? The SAP mentions to display the listings by Treatment group and Visit, is this reflected in the layout for the listings in the listing shells? In case of a mismatch between shell TFLs and SAP text, “it is always more important what is written in the SAP and not in the shells”. In such cases, get things clarified first hand with the study statistician. 2. Once you have verified the shells for consistency with the SAP, make note of the points below from the SAP: Key endpoints for the study. (Safety / Efficacy parameters). The TFLs for any study are mostly based on the key endpoints for that study. Having a handy list of these endpoints while annotating the specs, will help one re-confirm the correctness of the shell with the SAP. No. of treatments, their order and format. Shells for all reports should show analysis for only those treatments which are mentioned in the SAP. Also their sort order and display format should be consistent with the SAP across all reports. Similar case with the No. of scheduled visits and their format. The Analysis Populations and their relevance to the reports. E.g. it could be mentioned in the SAP to use only ITT population for Efficacy reports. This should be reflected in the specs too. Statistical methods to be used – e.g. summary statistics of subject data, statistical tests (analysis of variance, t-tests…) Data handling rules – e.g. imputation rules for partial dates, handling of missing values, LOCF etc. These points will form the base for creating detailed programming notes at the beginning of the specs for consistency across the reports.
Transcript of )URP³ …€¦ · The basic annotations for the mock up shells i s been done. The programmer uses...

1
PharmaSUG 2014 - Paper IB07
From “Just Shells” to a Detailed Specification Document for Tables, Listings and Figures
Supriya Dalvi, InVentiv Health Clinical, Mumbai, India
ABSTRACT
We are assigned a new study. We go through the protocol, the statistical analysis plan, the mock up shells and start programming. The basic annotations for the mock up shells is been done. The programmer uses this as a specification document for generating the outputs; similarly the validator uses it for QC of the outputs. There are some differences in understanding between the two as the shells are not “clear enough” leading to discussions amongst them , also involving the statistician at several times .At the time of Statistical review, it is observed there are inconsistencies in the layout of the reports, date formats, visit orders, treatment group information, common derivations etc… The result: a lot of rework on correcting these issues, loss of time, confusions and a question mark on the quality of the reports. Could this have been avoided if the mock up shells were given some more attention than what they got? May be Yes…How? Let’s try to understand…
BUILDING THE BASE FOR A GOOD SPECIFICATION DOCUMENT
The Shell for the tables, figures and sometimes listings are usually attached to the SAP (Statistical Analysis Plan). If not, it could be provided as a separate document also.
Step by Step process for creating the specifications:
1. The SAP is the most important document for a statistical programmer since all deliverables from the statistical programmer are defined in this document. A careful review of the SAP text and the TFL shells is a must before starting the annotations. A few examples are given below:
Are the TFLs mentioned in the shells, also mentioned in the SAP text? E.g. Shell contains AE tables by intensity, relation ship. But is it mentioned in the SAP too?
Are the TFLs mentioned in the SAP text, explained in the same manner in the shells as well? E.g.
The SAP mentions to display an Overall treatment group for all tables, does the shell has the layout in similar fashion? The SAP mentions to display the listings by Treatment group and Visit, is this reflected in the layout for the listings in the listing shells?
In case of a mismatch between shell TFLs and SAP text, “it is always more important what is written in the SAP and not in the shells”. In such cases, get things clarified first hand with the study statistician.
2. Once you have verified the shells for consistency with the SAP, make note of the points below from the SAP:
Key endpoints for the study. (Safety / Efficacy parameters). The TFLs for any study are mostly based on the key endpoints for that study. Having a handy list of these endpoints while annotating the specs, will help one re-confirm the correctness of the shell with the SAP.
No. of treatments, their order and format. Shells for all reports should show analysis for only those treatments which are mentioned in the SAP. Also their sort order and display format should be consistent with the SAP across all reports.
Similar case with the No. of scheduled visits and their format. The Analysis Populations and their relevance to the reports. E.g. it could be mentioned in the SAP
to use only ITT population for Efficacy reports. This should be reflected in the specs too.
Statistical methods to be used – e.g. summary statistics of subject data, statistical tests (analysis of variance, t-tests…)
Data handling rules – e.g. imputation rules for partial dates, handling of missing values, LOCF etc.
These points will form the base for creating detailed programming notes at the beginning of the specs for consistency across the reports.

From “Just Shells” to a Detailed Specification Document for Tables, Listings and Figures, continued
2
3. Copy the shells from the SAP in separate documents precisely 3 separate documents – SPECSUM (For Summary), SPECLIS (For Listing), and SPECFIG (For Figures). Also create a TOC (Table of contents) at the beginning of each of the mentioned documents. Each report number in the TOC should be hyperlinked with its corresponding shell in the document for ease of finding the relevant outputs.
4. After you have created the TOC, add a section for General Notes. In any study there are certain
programming aspects that are common for all reports and it is advised to follow a consistent approach in all programs where any common rules apply. A table of general notes at the beginning of the shells will help:
The programming lead to create any general macros, formats for common derivations which are used more than once for the TFL programming of the given study.
Will keep all programmers working on the study to be on the same page at any point of time.
Any modification with respect to the overall layout, formats etc of the reports can be mentioned at
one place as the study progresses rather than changing it for each and every report.
Given below is an example of a good “General Notes” Section:
Rule Details
Orientation Landscape
Margins Top/Bottom/Left/Right: 1 inch
Font Courier New 8pt (font size may be adjusted as necessary, but not at the expense of clarity)
Headers
Sponsor name and Protocol number (left)
Page X of Y (right)
Footers Program Name: xxx.sas output: xxxxx.rtf Status: Blinded/Unblinded Run Date: DDMMMYYYY:HH:MM
Date format Date format for all presentations will be ‘DDMMMYYYY’.
Listing Sort Order Sort by treatment group, study site, and subject identifier.
Treatment format
Treatment format for all presentations will be :
‘TRTAFMT’ for Actual Treatment.
‘TRTPFMT’ for Planned Treatment.
(Format names as created by the lead for the study.)
Visit Format Visit format for all presentations will be ‘VISFOR’
(Format name as created by the lead for the study.)
Spacing Leave no space line right below the top border lines and above/below bottom boarder line.
Decimal points
Mean and median will be displayed to one more decimal place than the original value; min and max will keep the same number of decimal places. SD/SE will be displayed to two more decimal places than the original value.
For all categorical summary tables, all percentages will be reported to one decimal place, unless otherwise noted.
The decimal shown on the shells are examples, the actually decimals to be presented should be based on precision of the actual data collected.

From “Just Shells” to a Detailed Specification Document for Tables, Listings and Figures, continued
3
5. Once the general notes table is created, add a table for “Revision History”. Any changes to the specifications after the first release can be documented in this section. As it is kept at the beginning, anyone who opens the document will get an idea of which reports need modifications. E.g
Date Author Description of Change
16Jun2013 Supriya Dalvi For Serious AE replaced the condition AESERN=2 to AESERN=1
01Jul2013 Supriya Dalvi Table 14.3.7.3: Added sub-set condition VSCAT= 'VITAL SIGNS - STANDARD'
P-value, CI
All p-values will be rounded to three decimal places; p-values less than 0.001 will be presented as ‘< 0.001’ and p-values greater than 0.999 will be presented as ‘>0.999’ in all tables.
All confidence intervals (Cis) will be two-sided with 95% coverage, unless otherwise specified.
MedDRA version
15.0
Population variable
For Safety Tables, use Actual Treatment – TRTAN
For rest, use Planned Treatment - TRTPN
Display of percentages
Display percentages with space like “76 (16.5)” Please note there is a space between “n” and “(“ also, and no percentages should be associated with the value 0 (i.e. do not print out 0.0% in this case).
Display of Mean and SD
Mean and SD will be displayed as Mean (SD) with no blank spaces in the bracket and cases where n=1, Mean (-)
Display of case For text fields should present data as the database. No need to change the case.
Statistical Procedures
Detailed SAS codes and procedure guidelines can be given in the individual table annotation. However if there is common procedure to be used across many reports, can be explained in detail in this section also.
Macros
Mention any study specific macros to be used for common derivations. E.g. There could be a macro created for deriving the header counts as per the
population for the table. A macro for deriving study day on the listings. A macro for deriving counts and percentages.
From “Just Shells” to a Detailed Specification Document for Tables, Listings and Figures, continued
4
ANNOTATING THE ACTUAL SHELLS, A FEW EXAMPLES:
1. THE SPECLIS (LISTING SHELLS)
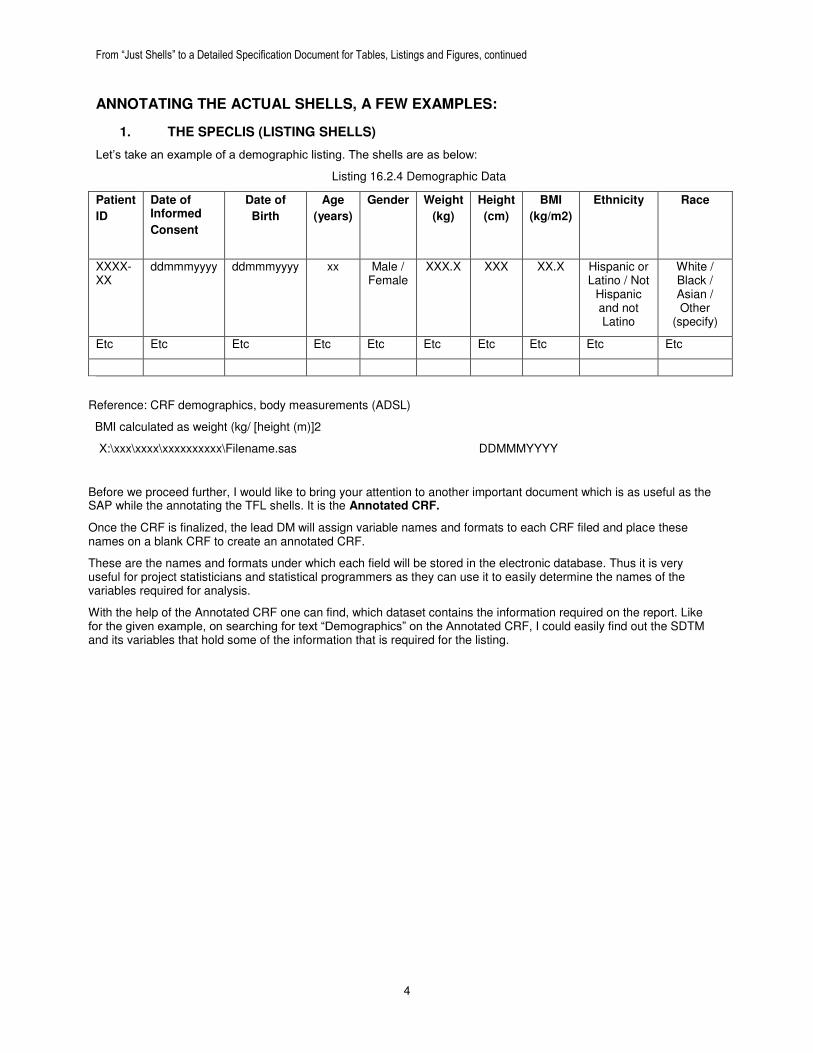
Let’s take an example of a demographic listing. The shells are as below:
Listing 16.2.4 Demographic Data
Patient
ID
Date of Informed
Consent
Date of
Birth
Age
(years)
Gender
Weight
(kg)
Height
(cm)
BMI
(kg/m2)
Ethnicity
Race
XXXX-XX
ddmmmyyyy ddmmmyyyy xx Male / Female
XXX.X XXX XX.X Hispanic or Latino / Not
Hispanic and not Latino
White / Black / Asian / Other
(specify)
Etc Etc Etc Etc Etc Etc Etc Etc Etc Etc
Reference: CRF demographics, body measurements (ADSL)
BMI calculated as weight (kg/ [height (m)]2
X:\xxx\xxxx\xxxxxxxxxx\Filename.sas DDMMMYYYY
Before we proceed further, I would like to bring your attention to another important document which is as useful as the SAP while the annotating the TFL shells. It is the Annotated CRF.
Once the CRF is finalized, the lead DM will assign variable names and formats to each CRF filed and place these names on a blank CRF to create an annotated CRF.
These are the names and formats under which each field will be stored in the electronic database. Thus it is very useful for project statisticians and statistical programmers as they can use it to easily determine the names of the variables required for analysis.
With the help of the Annotated CRF one can find, which dataset contains the information required on the report. Like for the given example, on searching for text “Demographics” on the Annotated CRF, I could easily find out the SDTM and its variables that hold some of the information that is required for the listing.

From “Just Shells” to a Detailed Specification Document for Tables, Listings and Figures, continued
5
The SDTM is DM and the variables to be used are BRTHDTC, SEX, ETHNIC and RACE.
Similarly once can search for other variables like “Height” on the CRF and find out the SDTM dataset which holds this information. It will be mostly collected in the VS (Vital Signs) domain.
If analysis datasets are directly being used for listing programming, one can also do a PROC CONTENTS on the required analysis dataset to get the names & labels of all variables at one place. It is then easier to just copy paste the variable names on to the specs.
E.g. Since demographics mostly contained in the subject level analysis dataset, a PROC CONTENTS on ADSL in the manner below would give me the results as:
Proc Contents DATA= ASDL Out=Content (KEEP= name label varnum);
Run;
The output dataset “CONTENT” will have information as below:

From “Just Shells” to a Detailed Specification Document for Tables, Listings and Figures, continued
6
Now we can just copy the variable names (in blue) from the contents data and paste on the specs against the relevant columns like below:
Listing 16.2.4 Demographic Data
Patient
ID ADSL.
PATID
Date of Informed
Consent ADSL.
INFCONDT
Date of
Birth
ADSL. BRTHDT
Age
(years) ADSL.
AGE
Gender ADSL.
SEX
Weight
(kg) ADSL.
WEIGHT
Height
(cm) ADSL.
HEIGHT
BMI
(kg/m2) ADSL.
BMI
Ethnicity ADSL.
ETHNIC
Race ADSL.
RACE
XXXX-XX
ddmmmyyyy ddmmmyyyy xx Male / Female
XXX.X XXX XX.X Hispanic or Latino /
Not Hispanic and not Latino
White / Black / Asian / Other
(specify)
Etc Etc Etc Etc Etc Etc Etc Etc Etc Etc
Reference: CRF demographics, body measurements (ADSL)
BMI calculated as weight (kg/ [height (m)]2
X:\xxx\xxxx\xxxxxxxxxx\Filename.sas DDMMMYYYY
Dataset: ADSL
*Note: The annotated CRF not only helps one to identify the variables needed for annotating a given shells, it also gives clear picture of the actual data (with its format) is collected for a given domain.
Sometimes it may happen that a particular item which is mentioned in the CRF for a given domain may not be present on the report for that domain.

From “Just Shells” to a Detailed Specification Document for Tables, Listings and Figures, continued
7
Example: The CRF for Adverse Events domain mentions “Relation to the study treatment”, but the AE listing shell does not have a column for the same. In such cases, there is no harm in clarifying with the study statistician whether to include this column on the shell.
The below given Adverse Event Listing shells were annotated in similar fashion as the Demographic Listing, using the Annotated CRF and PROC CONTENTS on ADAE dataset.
Listing 16.2.7 Adverse Events
Subject
Number
Gender/
Race/
Age(a)
Start Date/
End Date/
Relative Day
of Onset†
System Organ Class/
Preferred Term/
Reported Term
Duration
of AE
(Days)#
Severity/
Drug (b)
Relationship
Action
Taken/
Outcome
(c)
Frequency/
Serious
ADAE.
Subjid
X/x/xx
ADAE.Sex/
ADAE.Race/
ADAE.Age
None
ADAE.Aestdtc/
ADAE.Aeendtc
Or
ADAE.Aeenrf/
ADAE.Astdy
ADAE.Aebodsys/
ADAE.Aedecod/
ADAE.Aeterm
ADAE.
Adurn
ADAE.Aesev/
ADAE.Aerel
ADAE.
Aeacn/
ADAE.
Aeout
ADAE.
Aepatt/
ADAE.
Aeser
Reference: eCRF Page 3(AE), 4(AE_YN)
Note: †Day of onset relative to the start of study drug = ((AE onset date – study drug start date) + 1); # duration of AE = ((AE end date – AE start date) + 1);
(a) Race: W = White; B = Black or African American; A = Asian; I = American Indian or Alaska Native; N = Native Hawaiian or Other Pacific Islander; O = Other. Gender: M = Male; F = Female.
(b) Relationship: RL = Related; PB = Probably related; PS = Possibly related; UL = Unlikely to be related; UN = Unrelated. (c) Action Taken with study treatment: NA = Not applicable; DW = Drug withdrawn; DIT = Drug interrupted; DN = Dose not changed; DR = Dose reduced; DI = Dose increased. Outcome: RD = Recovered; RS = Recovered with sequelae; RG = Recovering; NR = Not yet recovered; FT = Fatal; UNK = Unknown. Dataset: ADAE

From “Just Shells” to a Detailed Specification Document for Tables, Listings and Figures, continued
8
Another important check for listings like that of Adverse Events is that, these listings have a number of abbreviations or symbols used in the column headers with their corresponding definition given in the footnotes. While annotating the shells for such listings always cross verify the correctness of the abbreviations.
For example the symbol “†” is mentioned against ‘Relative Day of Onset’ in the header for the 3rd column. Cross
verify whether the explanation given for “†” in the footnote is relevant to “Relative Day of Onset” only.
One can also cross verify the data values mentioned in the footnotes for symbols (a), (b), (c) with the CRF page as below:
Example: Compare the values in the footnote :(b) Relationship: RL = Related; PB = Probably related; PS = Possibly related; UL = Unlikely to be related; UN = Unrelated. with the CRF page and check whether all values on the CRF are covered in the footnote. If there is anything which is left out from the CRF, then one can add the same to the listing shells with proper abbreviation after confirming with the statistician.
Here is a snapshot of the CRF:

From “Just Shells” to a Detailed Specification Document for Tables, Listings and Figures, continued
9
2. THE SPECSUM (TABLE SHELLS)
Taking a simple demographic table as example:
Table 2 Demographic Summary by treatment
Safety Population
Page X of Y
Treatment A
N=XXX
Treatment B
N=XXX
Gender
Male XX XX
Female XX XX
Age (years)
N XX XX
Mean XX.X XX.X
SD XX.XX XX.XX
Median XX XX
Minimum XX XX
Maximum XX XX
Primary Race / Ethnicity
American Indian / Alaska Native
XX XX
Asian XX XX
Black or African American XX XX
Hispanic or Latino XX XX

From “Just Shells” to a Detailed Specification Document for Tables, Listings and Figures, continued
10
Starting top to bottom, annotations need to be provided for:
1. The analysis dataset to be used for Demographic Summary. 2. The population flag for “Safety”. 3. The column variables – Treatment vars. 4. The row variables – The variables that should be used to summarize each of the row categories Gender,
Age, Race.
Here is how the annotated shell should look like:
Table 2 Demographic Summary by treatment
Safety Population
ADSL.SAFF=”Y”
Page X of Y
Treatment A
N=XXX
ADSL.TRTAN
Treatment B
N=XXX
ADSL.TRTAN
Gender ADSL.GENDER
Male XX XX
Female XX XX
Age (years) ADSL.AGE
N XX XX
Mean XX.X XX.X
SD XX.XX XX.XX
Median XX XX
Minimum XX XX
Maximum XX XX
Primary Race / Ethnicity ADSL.RACE
American Indian / Alaska Native
XX XX
Asian XX XX
Black or African American XX XX
Hispanic or Latino XX XX
Dataset: ADSL where SAFF=”Y”

From “Just Shells” to a Detailed Specification Document for Tables, Listings and Figures, continued
11
3. THE SPECFIG (FIGURE SHELLS)
Here are the shells for an “Individual profiles” graph by parameter:
Figure 1a
Individual profiles for PD parameters
Safety Analysis Set
Treatment: A
The figure is by Treatment, Subject.
Y-Axis: PD parameter (All PD parameters present in the data)
X-Axis: Scheduled Time point
Most of the graphs are never that straight forward as they seem to be. One needs to carefully understand all items given on the shells and note down all the variables that would be needed for plotting the graph.
The most obvious variables are the Y-axis and X-axis variables. Other than that, go through the titles and check if there are any “By” variables that are needed.
Another important variable is the Z-axis, which is basically shown in the legends.
Carefully reviewing the shell given above, here is the list of information that is needed for plotting the graph:
The dataset to be used for analysis of PD parameters. Population flag for “Safety”. BY variables– Treatment Group and Subject Number Y-Axis – Since it is mentioned to include all PD parameters in the data, we need 2 variables here: 1. the
variable holding parameter name. 2. The variable holding the corresponding PD result if the analysis dataset has data in this fashion.
X-Axis- Scheduled Time point variable for a given Day. Z-Axis – From the legends, we see that we would need to plot the results by Visit or “Day” in this case.
Suppose the data (DATASET: ADEFF) is in the below format:

From “Just Shells” to a Detailed Specification Document for Tables, Listings and Figures, continued
12
The annotated specs would look like:
Figure 1a
Individual profiles for PD parameters
Safety Analysis Set
Treatment: A
Y-Axis: PD parameter (All PD parameters present in the data)
X-Axis: Scheduled Time point
Dataset : ADEFF where SAFETY =”Y”
BY variable : ADEFF.TRTA, ADEFF.SUBJID
Y- Axis variable : ADEFF.PDRES. Separate GPLOT would be needed for each value of PARAM variable.
X- Axis variable : ADEFF.TIMEPOINT
Z- Axis variable : ADEFF.VISIT
Proc Gplot DATA= ADEFF (WHERE= (SAFETY=”Y”)); By TRTA SUBJID;
Where PARAM=”Glucose (mmol/L”; PLOT PDRES*TIMEPOINT=VISIT;
Run;
Repeat for each value of PARAM.
From “Just Shells” to a Detailed Specification Document for Tables, Listings and Figures, continued
13
These are a few examples of annotating the TFL shells with utmost detail. However no matter how much attention is given by the programmer who creates the specification, it is the execution that matters the most.
It is also the responsibility of every individual working on the programming/validation of these reports to carefully go through every detail mentioned in the specifications, follow all the programming rules efficiently, make utmost use of the SAP and annotated CRF for understanding a given report and raise questions wherever needed.
CONCLUSION
A good quality specification document can be build by:
Carefully reviewing the SAP and the shells against each other.
Using the Annotated CRF document for 1. Identifying the variables needed for a given report. 2. Comparing the data collected with items given on the shells.
Maintaining a section for “General Notes” and “Revision History” at the beginning for common rules or derivations and for maintaining the change log. This will keep consistency across the study.
Efficiently created high quality outputs form the basis for an outstanding deliverable. Maintaining high efficiency without compromising quality is a necessity in the CRO/ Pharmaceutical industry. This paper enables easy facilitation of the same by getting the basics right.
In order to attain topmost quality, the steps mentioned in this paper should also be followed by programmers generating/validating the reports.
ACKNOWLEDGEMENTS
I thank all my colleagues who reviewed and provided useful comments on my paper. I am sincerely grateful to my Manager Sandeep Sawant at InVentiv Health Clinical for his continuous encouragement and motivation without which this effort would have not materialized.
CONTACT INFORMATION
Your comments and questions are valued and encouraged. Contact the author at:
Name: Supriya Dalvi Enterprise: InVentiv Health Clinical Address: Marwah Centre, Ground floor, Krishanlal Marwah Marg Andheri (E) - 400072 City, State ZIP: Mumbai, MH, India Work Phone: +91 22 4095 7371 E-mail: [email protected] Web: http://www.inVentivHealthclinical.com
SAS and all other SAS Institute Inc. product or service names are registered trademarks or trademarks of SAS Institute Inc. in the USA and other countries. ® indicates USA registration.
Other brand and product names are trademarks of their respective companies.