URBAN INDIAN HEALTH PROGRAM CY2013 1 Introducing the UDS Brief Introduction to UDS Available...
115
-
date post
19-Dec-2015 -
Category
Documents
-
view
220 -
download
0
Transcript of URBAN INDIAN HEALTH PROGRAM CY2013 1 Introducing the UDS Brief Introduction to UDS Available...


URBAN INDIAN HEALTH PROGRAMCY2013 2
Introducing the UDS• Brief Introduction to UDS• Available Assistance• Definitions Used in the UDS Report • Step by Step instructions for completing the
UDS tables• 2013 Changes• Software Demonstration• Interpreting the UDS Report
Agenda

URBAN INDIAN HEALTH PROGRAMCY2013 3
• Copy of the presentation slides• CY2013 UDS Manual, Tables, Fact
Sheets • Summary of CY2013 changes• UDS Feedback Report• UDS Reference Formula Guide
Reference Materials

URBAN INDIAN HEALTH PROGRAMCY2013 4
Do you know?
(117,557 Patients, 51,646 AI/AN)• How many patients are served by the Urban Indian
Health Program?
• How many visits? (507,987)
• What % of patients are uninsured?(52%) on Medicaid?
(30%)
• What is the average cost per medical visit? ($230)
• Where can you get this information? (UIHP UDS for CY2012)
• How is this information used? (We’ll discuss in a few moments…)
• Why are we here today? (Accurate Reporting of the UDS Data)

URBAN INDIAN HEALTH PROGRAMCY2013 5
2012 Program Impact
• 33 Programs serving 117,557
• Total Visits include Medical, Dental, MH, SA, Vision, Other Professional and Enabling Services
• Employees represent FTE- those employed greater

URBAN INDIAN HEALTH PROGRAMCY2013 6
• A Standardized set of data reported by federally funded programs: Urban Indian Health programs Section 330 Grantees – CHC,
HCH,MHC and PHPC (for over 15 years)
FQHC Look-Alike agencies Nurse Managed Health Clinics
(NMHCs)• 11 Tables (UIHP UDS)
What is the Uniform Data System (UDS)?

URBAN INDIAN HEALTH PROGRAMCY2013 7
11 Tables Provide a Snapshot of Patients and performance from January 1 – December 31
What is Reported Table(s)
Patients you serve Coversheet/Zip CodeTables 3A, 3B, 4
Staffing Mix Table 5
Types and quantities of services you provide
Tables 2, 5 and 6A
The care you deliver Tables 6A
Costs of providing services Table 8A
Revenue sources Tables 9D and 9E
URBAN INDIAN HEALTH PROGRAMCY2013 8
TableUniversal Report AI/\AN Table
Coversheet, Zip Code, Table 2
Yes
3A, 3B, 4 Yes Yes
5 Yes Visits & Patients, only
6A Yes Yes
8A Yes
9D Yes
9E Yes
Universal and AI/AN Tables

URBAN INDIAN HEALTH PROGRAMCY2013 9
UDS data is used by IHS to:• Ensure compliance with legislative and
regulatory requirements• Report program achievements to Congress
and OMB• Monitor performance and identify TA
needs
UDS data is used by programs to improve performance
Why is the UDS important?

URBAN INDIAN HEALTH PROGRAMCY2013 10
• Software on CD ROM received February 15, 2014 Software demonstration later in agenda
• Report due April 15, 2014 Before submit you must run audit report
and correct errors• Reviewer Technical Assistance to finalize
report from April 15-June 15, 2014• Data finalized July, 2014• Feedback Report received August 2014
Critical Dates in the UDS Process

URBAN INDIAN HEALTH PROGRAMCY2013 11
• Regional trainings• On-line training modules, manual and
fact sheets available at: www.uihpdata.net
• Telephone helpline at: 1-866-698-5976• Email help at: [email protected]• Technical support to review submission
Available Assistance
URBAN INDIAN HEALTH PROGRAMCY2013 12
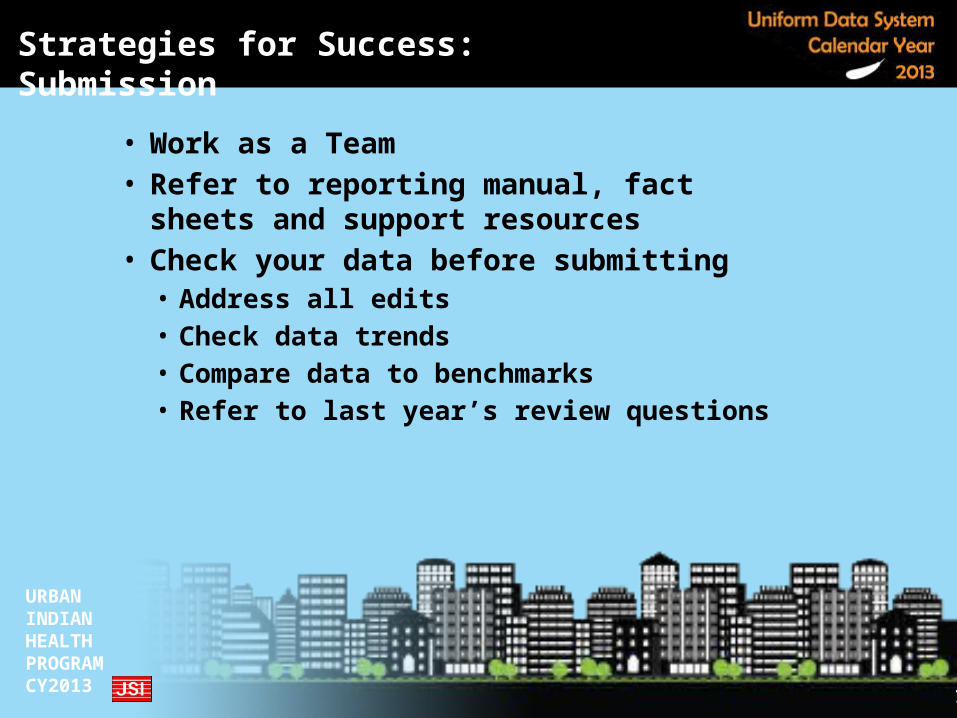
• Work as a Team• Refer to reporting manual, fact sheets
and support resources• Check your data before submitting
• Address all edits• Check data trends • Compare data to benchmarks• Refer to last year’s review questions
Strategies for Success: Submission

URBAN INDIAN HEALTH PROGRAMCY2013 13
UDS Tables and Definitions

URBAN INDIAN HEALTH PROGRAMCY2013 14
• Definitions of terms for consistent reporting
• Step-by-step instructions for table completionReference Manual and Quick Fact Sheets
• Interrelatedness of TablesTables cannot be completed accurately
without cross checking• How the data are / can be used for
program improvement
Each table will be reviewed for:

URBAN INDIAN HEALTH PROGRAMCY2013 15
CY2013 Changes
Table CY2013
Coversheet,Zip Code, Table 2 No Change
3A, 3B No Change
4Table 4: Change in age groups for insurance data (Table 4 lines 7-12) to:
Ages 0-17 years old (column a) and Ages 18 and over (column b)
5 No Change
6A No Change
8A No Change
9D No Change
9E No Change

URBAN INDIAN HEALTH PROGRAMCY2013 16
General InformationProvides general information
on program including contacts, service locations and services
URBAN INDIAN HEALTH PROGRAMCY2013 17
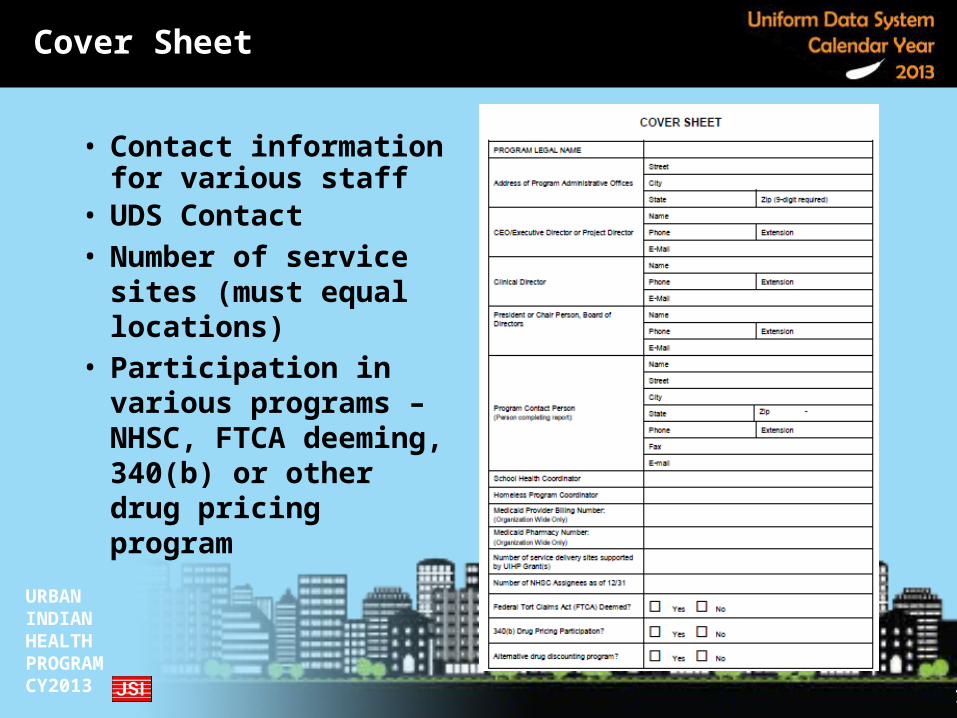
• Contact information for various staff
• UDS Contact• Number of service
sites (must equal locations)
• Participation in various programs – NHSC, FTCA deeming, 340(b) or other drug pricing program
Cover Sheet
URBAN INDIAN HEALTH PROGRAMCY2013 18
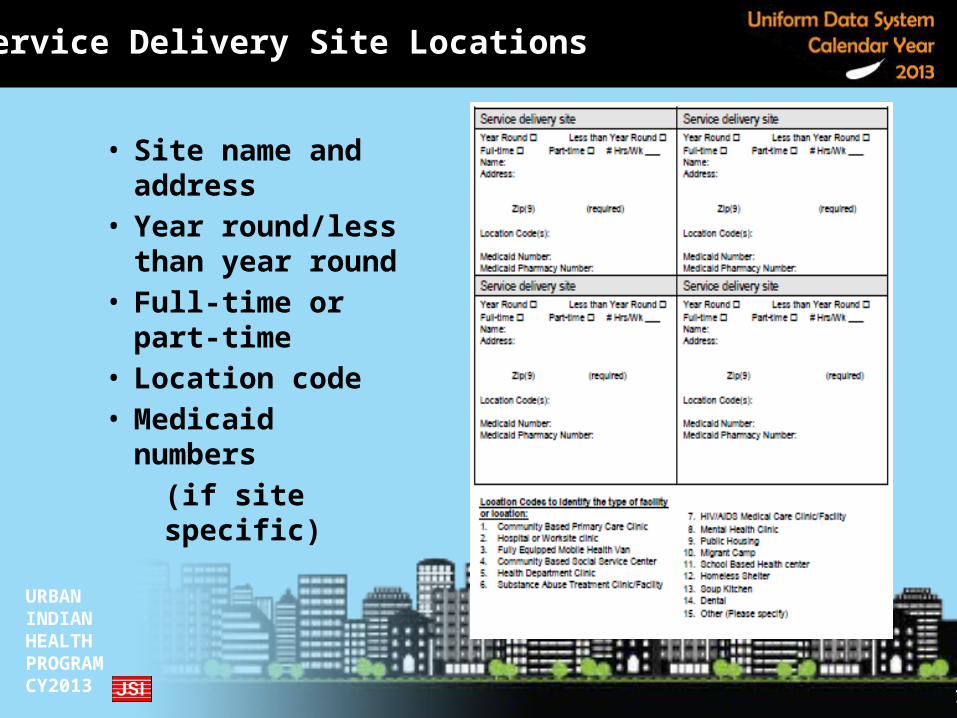
• Site name and address
• Year round/less than year round
• Full-time or part-time
• Location code • Medicaid
numbers (if site specific)
Service Delivery Site Locations

URBAN INDIAN HEALTH PROGRAMCY2013 19
• For each service indicate if and how service is provided (3 methods of service)
• Check all cells that apply
• There is no “quantity” measure
Table 2: Services Offered and Delivery Methods

URBAN INDIAN HEALTH PROGRAMCY2013 20
Describes the number of patients served and their socio-demographic characteristics including AI/AN
patients
Patient Profile

URBAN INDIAN HEALTH PROGRAMCY2013 21
Number and socio-demographic characteristics of patients served• Patients by Zip Code• Table 3A – Patients by Age and Gender• Table 3B – Patients by
Race/Ethnicity/Language• Table 4 – Other Patient Characteristics
Income and primary medical insurance, special populations
• Tables 3A, 3B and 4 are completed for AI/AN patients separately
Patient Profile Tables
21

URBAN INDIAN HEALTH PROGRAMCY2013 22
• An individual who has one or more visits that was reported on Table 5 during the calendar year Medical, dental, mental health, substance
abuse, vision, other professional and selected enabling services.
• Whenever ‘patients’ are counted, it is an unduplicated count. Each patient is counted once and only once regardless of the number or scope of visits
Who Counts: Patient Defined

URBAN INDIAN HEALTH PROGRAMCY2013 23
• AI/AN Patient: Individuals who qualify as an American Indian/Alaskan Native according to the 25 U.S.C. 1603 (f) definition
• “Other” AI/AN Patient: Individuals who are designated AI/AN but do not quality as an AI/AN according to the 25 U.S.C. 1603 (f)
• Non-Indian Patients: Individuals who do not qualify as an Indian patient
Who counts as an American Indian/Alaska Native patient (AI/AN)?

URBAN INDIAN HEALTH PROGRAMCY2013 24
Patients by Zip CodesZip Code Table

URBAN INDIAN HEALTH PROGRAMCY2013 25
Patients by Zip Code
• Enter zip code and number of patients from each zip code
• Account for total patients by zip code
• Aggregate zip codes with 3 or less patients
• Combine the rest as ‘other zip codes’

URBAN INDIAN HEALTH PROGRAMCY2013 26
Patients by Zip Code (continued)
Additional instructions for reporting zip codes for special populations:
• Homeless- Use zip code of location where patient receives services if no better data exists
• Seasonal/Migrant Workers-use zip code of the temporary housing they occupy when patient is in the area.

URBAN INDIAN HEALTH PROGRAMCY2013 27
Patient DemographicsTables 3A and 3B

URBAN INDIAN HEALTH PROGRAMCY2013 28
• Age is calculated as of June 30th of the calendar year
• Count each patient once and only once on total line of Table 3A
• AI/AN table is subset of total
• Total on line 39 column a+b is the official total.
• Total on line 39 columns a+b must = patient totals reported on Zip Code, 3B, and 4.
Table 3A: Patients by Age & Gender (Universal and AI/AN)

URBAN INDIAN HEALTH PROGRAMCY2013 29
Table 3B: Patients by Race and Ethnicity
• Patients self select except AI/AN (line 4a); 4b for “Other” AI/AN
• Use Column b (Non-Hispanic) if patient does not indicate “Latino” or “Hispanic”
• Use Line 6 only if patient chooses two or more listed races.– “More than one”
shouldn’t be a choice; don’t use for Latino + a Race
URBAN INDIAN HEALTH PROGRAMCY2013 30
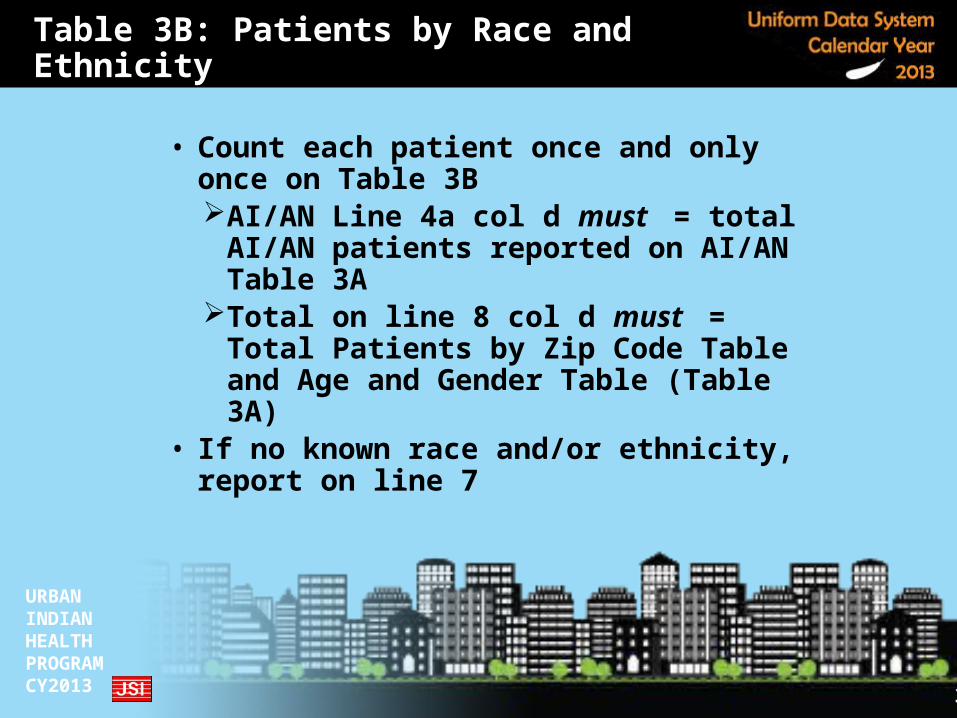
• Count each patient once and only once on Table 3BAI/AN Line 4a col d must = total
AI/AN patients reported on AI/AN Table 3A
Total on line 8 col d must = Total Patients by Zip Code Table and Age and Gender Table (Table 3A)
• If no known race and/or ethnicity, report on line 7
Table 3B: Patients by Race and Ethnicity
URBAN INDIAN HEALTH PROGRAMCY2013 31
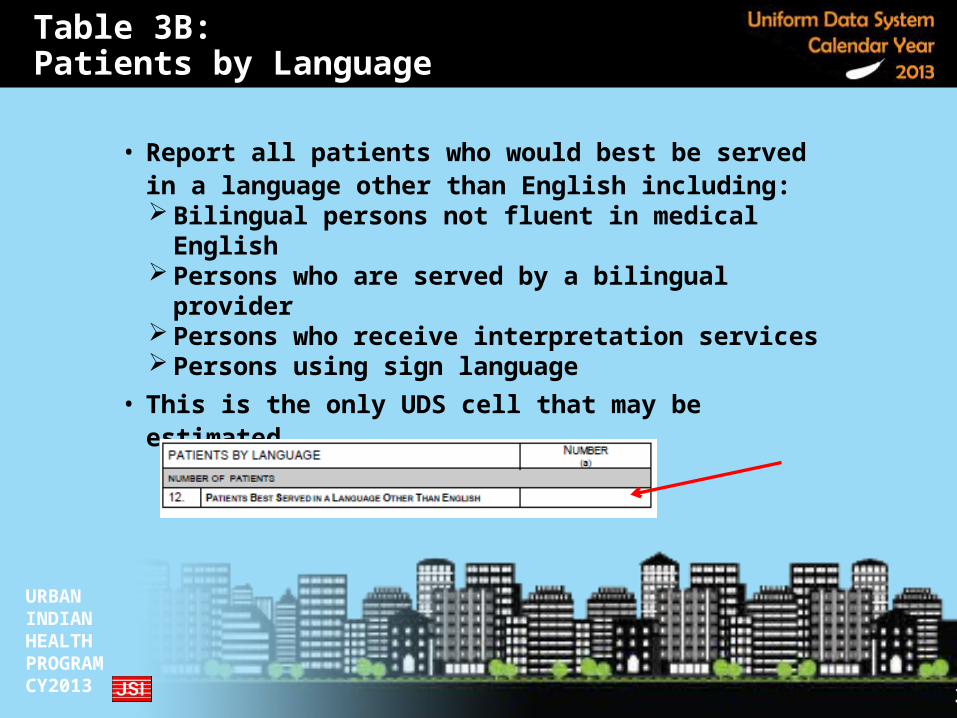
• Report all patients who would best be served in a language other than English including: Bilingual persons not fluent in medical
English Persons who are served by a bilingual
provider Persons who receive interpretation
services Persons using sign language
• This is the only UDS cell that may be estimated
Table 3B: Patients by Language
URBAN INDIAN HEALTH PROGRAMCY2013 32
Other Demographic Data: Income, Insurance, Managed Care, Veterans
Table 4

URBAN INDIAN HEALTH PROGRAMCY2013 33
• Income• Insurance• Managed
care • Veterans
Table 4: Selected Patient Characteristics

URBAN INDIAN HEALTH PROGRAMCY2013 34
• Use income as of the most recent assessment• Income may be self-reported if permitted by
your policy • Income must be from recent patient data (within
last year). Otherwise count as unknown.• Do not use insurance as a proxy for income• Count each patient once and only once by income• AI/AN Table must = total AI/AN patients reported
on AI/AN Tables 3A, 3B line 4a• Total on Table 4 line 6 must = total patients
Table 4: Patients by Income

URBAN INDIAN HEALTH PROGRAMCY2013 35
• 2013 Change: Age Groups on lines 7-12: 0-17 and 18+
• Report principal 3rd party insurance for MEDICAL care (even if patient is not a medical patient)
Do not count as insurance, grant programs that pay for categorical services (e.g., Family Planning,
Breast and Cervical Cancer Screening, etc.) Workers Comp is not medical insurance
• Insurance is reported as of the last visit (even if it did not pay for the visit in whole or in part)• State specific reporting of CHIP on Line 8b or 10b
Table 4: Patients by Medical Insurance

URBAN INDIAN HEALTH PROGRAMCY2013 36
• Count each patient once and only once by insurance AI/AN Table must = total AI/AN patients
reported on AI/AN Tables 3A, 3B line 4a Total on Table 4 line 12 col (a) and (b)
must = total patients Patients by insurance reported by age (0-
17 and 18+) must match patients by same ages on Table 3A
Table 4: Patients by Medical Insurance

URBAN INDIAN HEALTH PROGRAMCY2013 37
• NONE/UNINSURED: patients with no insurance: may include patients for whom program is reimbursed through grant (e.g. BCCCP) or uncompensated care fund
• MEDICAID: report all Medicaid patients including those in managed care programs run by commercial insurers
• MEDICARE: report all Medicare Patients including Medicare Advantage and Medi-Medi patients
Table 4: Medical Insurance Reporting Categories

URBAN INDIAN HEALTH PROGRAMCY2013 38
• CHIP: is handled differently from state to state:
• If provided through Medicaid is reported on line 8b
• If provided through a commercial carrier outside of Medicaid it is reported on Line 10b (Other Public- not private)
• OTHER PUBLIC: Public coverage for patients for a broad set of benefits- very uncommon
• Do not include family planning, breast and cervical programs, EPSDT, etc.
• PRIVATE INSURANCE• NOTE: Workers Comp is not medical
insurance
Table 4: Medical Insurance Reporting Categories (continued)

URBAN INDIAN HEALTH PROGRAMCY2013 39
Managed Care• ONLY reported by programs with capitated and/or FFS
managed care (HMO) contracts. • Patient is assigned to program’s provider• Patient MUST go to program provider for primary care
services• Do not count Primary Care Case Management (PCCM)
patients• A member month is 1 member enrolled for 1 month. Report
the sum of monthly enrollment for 12 months (generally from HMO reports supplied to program)
• In some cases, “members” might not be “patients”
Veteran• A veteran is an individual who completed service in the
uniformed services of the United States.
Table 4: Managed Care Utilization & Veterans

URBAN INDIAN HEALTH PROGRAMCY2013 40
• Patients by Zip Codes, T3A, T3B and T4 describe the same patients and must be equal.
• The number of AI/AN patients reported on the AI/AN T3A L39 cols a + b; T3B line 4a col d; and AI/AN T4 line 6 col a describe the same patients and must be equal. AI/AN tables are a subset of total (universal
table); Numbers on the AI/AN table must be less than or equal the corresponding number on the universal report for same table.
• Managed care member months indicate managed care revenues on Table 9D
Cross Table Issues

URBAN INDIAN HEALTH PROGRAMCY2013 41
• Total number of patients and AI/AN patients
• Proportion of AI/AN patients served in area
• Socio demographic profile of patients• GIS mapping of service area• Calculated performance measures
Costs, visits, revenues per patient Patients per provider FTE
Uses of Patient Data

URBAN INDIAN HEALTH PROGRAMCY2013 42
• How would you check the reasonableness of these numbers?
• Do they get your seal of approval?
Test Your Reviewer Skills 1

URBAN INDIAN HEALTH PROGRAMCY2013 43
Table 5: Staffing and Utilization
Describes the types and quantities of services provided and staff who provide these services
FTEs, visits, and patients

URBAN INDIAN HEALTH PROGRAMCY2013 44
• Col (a) – Staff full-time equivalents (FTEs) reported by position
• Col (b) – Clinic visits reported by provider type
• Col (c) – Patients reported by service
Table 5: Staffing and Utilization

URBAN INDIAN HEALTH PROGRAMCY2013 45
• Include all workers providing services at approved sitesEmployees, contracted staff, residents,
and volunteers• FTE is actual for the year, not as of last day
Do not use staff list as of December 31• Do not count FTE’s for paid referral
providers (but do count the referral provider’s paid visits/patients).
Who is included as a Full-time Equivalent (FTE)?

URBAN INDIAN HEALTH PROGRAMCY2013 46
• 1.0 FTE is equivalent to one person working full-time for one year
FTE is adjusted for part-time work and for part-year employment
Calculate FTE by dividing worked hours by “full-time” hours
• Each agency defines the number of paid hours it considers to be “full-time” work (e.g., 2080 hrs./yr., 1872 hrs./yr.)
How are FTEs calculated?

URBAN INDIAN HEALTH PROGRAMCY2013 47
• Calculate the FTE for hourly workers (including volunteers and residents) who received no paid leave by dividing hours worked by the comparable hours worked in that position less leave days.
For example:Resident worked 250 hours during the
yearFull time doctor works 2080 hours less
vacation (160) holidays (96) and CME (40) hours = 1784
250 / 1784 = 0.14 FTE
How are FTEs calculated? (Continued)

URBAN INDIAN HEALTH PROGRAMCY2013 48
• FTEs are reported based on work performed
• FTEs can be allocated across multiple categories
Clinicians are not allocated from clinical
Allocate only corporate time to non-clinical for Medical Director
Reporting of FTEs of Table 5 must correspond to allocation of costs on Table 8A by cost center
• See “Appendix A” in the UDS Reporting Manual for guidance on where to report staff
Where are FTEs reported?
URBAN INDIAN HEALTH PROGRAMCY2013 49
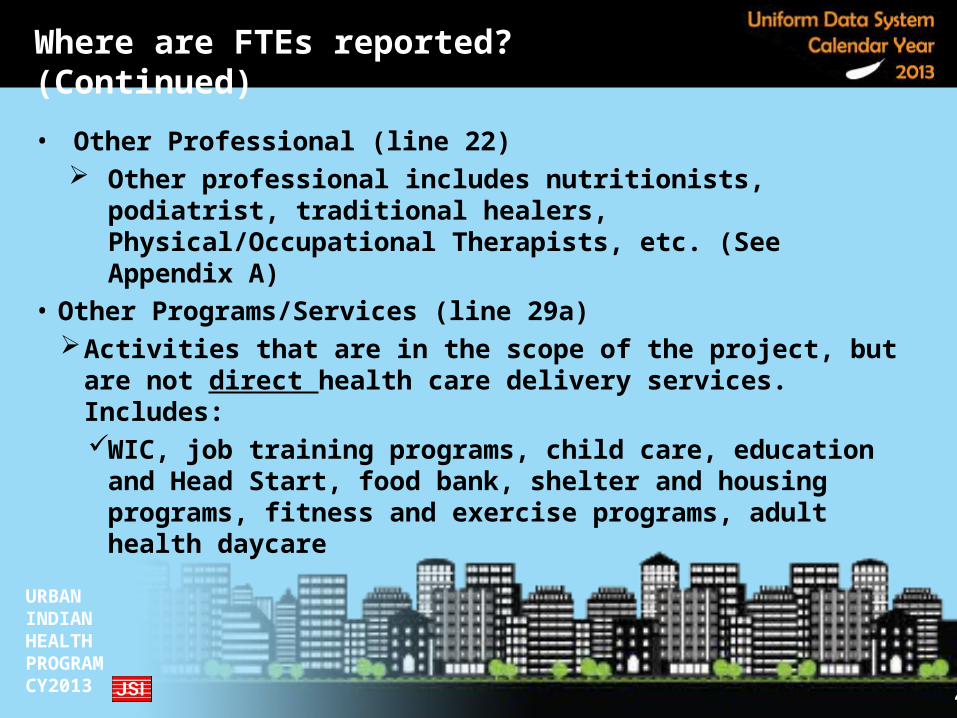
• Other Professional (line 22) Other professional includes nutritionists, podiatrist,
traditional healers, Physical/Occupational Therapists, etc. (See Appendix A)
• Other Programs/Services (line 29a)Activities that are in the scope of the project, but are
not direct health care delivery services. Includes: WIC, job training programs, child care, education
and Head Start, food bank, shelter and housing programs, fitness and exercise programs, adult health daycare
Where are FTEs reported? (Continued)

URBAN INDIAN HEALTH PROGRAMCY2013 50
• Face to face, 1:1 between patient and providerExcept for Behavioral Health visits
(group and telemedicine)• Licensed provider for medical, dental,
vision• Acting independently• Exercising independent judgment• The service must be charted
(documented in patient record)
What is a Visit?

URBAN INDIAN HEALTH PROGRAMCY2013 51
• Only 1 visit per patient per provider type per day
Unless 2 different providers at 2 different sites
• Only 1 visit per provider per patient per day regardless of the number of services provided
What is a Visit? (continued)

URBAN INDIAN HEALTH PROGRAMCY2013 52
• Count paid referral, nursing home and hospital visits and visits provided by volunteers and contracted staff
• Do not count:Group visits including health education
classes (except behavioral health)Health fairs and screenings (e.g., blood
pressure, etc.)Immunization-only and lab-only, visitsPharmacy visits
What is a Visit? (continued)

URBAN INDIAN HEALTH PROGRAMCY2013 53
• An individual who receives one or more documented “visits” of any of the service types on Table 5:
• Medical • Dental• Vision• Other Professional • Mental Health• Substance Abuse• Enabling (of selected services)
• A patient should be counted once and only once in each category in which they receive services
What is a service patient?
URBAN INDIAN HEALTH PROGRAMCY2013 54
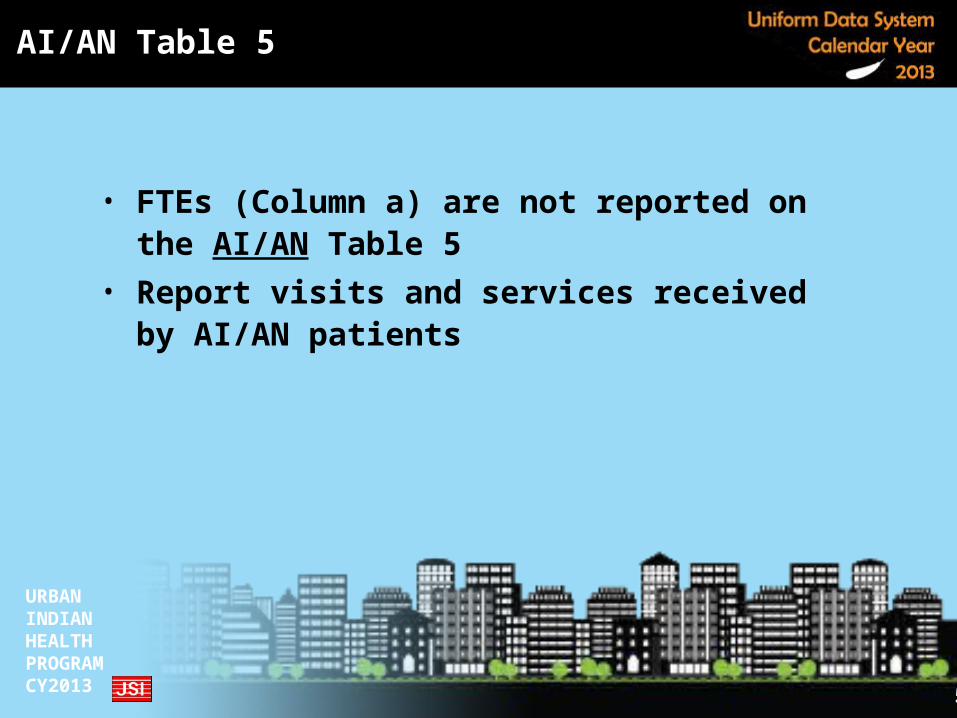
• FTEs (Column a) are not reported on the AI/AN Table 5
• Report visits and services received by AI/AN patients
AI/AN Table 5

URBAN INDIAN HEALTH PROGRAMCY2013 55
• The sum of patients by service type on T5: should not equal total patients on 3A (unless only one type of service is offered)
• Tables 5 and 8A: Staff reported on T5 must be included in the same cost center on T8A
• Tables 5 and 9D: Billable visits reported on T5 should relate to patient charges reported on T9D
• Visits and patients reported in any cell of the AI/AN table cannot exceed the number reported on universal table
Cross Table Issues

URBAN INDIAN HEALTH PROGRAMCY2013 56
• Staffing Ratios• Visits per provider (productivity)• Panel size: Patients per provider• Continuity of Care: Visits per
patient• Calculated performance measures
Costs per patient and per visitCharge and collection per visit
Uses of Utilization and FTE Data

URBAN INDIAN HEALTH PROGRAMCY2013 57
• How would you check the reasonableness of these numbers?
Test Your Reviewer Skills 2

URBAN INDIAN HEALTH PROGRAMCY2013 58
Table 6A: Clinical ProfileDescribes patients by selected
diagnoses and services received

URBAN INDIAN HEALTH PROGRAMCY2013 59
Table 6A –Selected Diagnoses and Services• Report visits and patients for the selected
diagnosis on lines 1-20e, regardless of whether it was a primary or secondary, tertiary, etc. diagnosis Changed in CY2012 to allow reporting of selected
diagnoses regardless of primacy. Prior to CY2012 only primary was reported on lines 1-20e
Clinical Profile Table

URBAN INDIAN HEALTH PROGRAMCY2013 60
60
• Lines 1-20e diagnoses regardless of primacy
• Lines 21-34 Selected Services
• Column (a) – Visits• Column (b) –
Patients
Table 6A: Selected Diagnoses and Services Rendered

URBAN INDIAN HEALTH PROGRAMCY2013 61
Lines 1-20e: Selected Diagnoses• For each diagnosis on lines 1-20e, report:
Total visits for the diagnosis (column a)Unduplicated number of patients with this diagnosis
(column b)
Lines 21-26d: Selected Services• For each service, report
Total visits with the service (column a)Count only one visit for any given service code even
if multiple services are given (e.g., five vaccines or two fillings in one visit is counted only once)
Unduplicated number of patients having received this service (column b)
For CY2013 -Use ICD-9 or CPT codes
Table 6A: Selected Diagnoses and Services Rendered

URBAN INDIAN HEALTH PROGRAMCY2013 62
• Visits and patients reported in any cell of the AI/AN table cannot exceed the number reported on the same line on the universal table
• Total patients reported on any row cannot exceed total patients reported on Table 3A or total medical patients for medical services
• Total AI/AN patients reported on any row cannot exceed total AI/AN patients reported on Table 3A
Cross Table Issues

URBAN INDIAN HEALTH PROGRAMCY2013 63
• Estimated prevalence of chronic conditions in patient population
• Continuity of care defined by average visits per year for selected chronic conditions (HTN, Diabetes, etc.)
• Frequency of acute care services by service (well child immunizations)
• Penetration rate for routine preventive services (well child, family planning, Pap tests)
Uses of Clinical Data

URBAN INDIAN HEALTH PROGRAMCY2013 64
Financial ProfileDescribes cost and efficiency of
delivering services and sources and amounts of income

URBAN INDIAN HEALTH PROGRAMCY2013 65
• Table 8A – Financial costs• Table 9D – Patient related
revenues• Table 9E – Other revenues
Grants, contracts, and other income not generated by patient services
Financial Profile Tables
URBAN INDIAN HEALTH PROGRAMCY2013 66
Table 8A Financial Costs
Costs by Cost Center

URBAN INDIAN HEALTH PROGRAMCY2013 67
• Col (a) – Accrued costs
• Col (b) – Allocation of facility and non-clinical support (Line 16) to cost centers
• Col (c) – Total costs• Line 18 - Donated
Table 8A:Financial Costs

URBAN INDIAN HEALTH PROGRAMCY2013 68
Cross Table Issues (continued)Table 8A and Table 5 “Crosswalk”

URBAN INDIAN HEALTH PROGRAMCY2013 69
Medical Care Costs (Lines 1-4):• Line 1: Medical staff salaries and benefits
including staff on contract and contracted visits Includes Staff dedicated to use or application
of EHR QI programs Includes Staff on contract and contracted
visits Excludes Ophthalmologists (report under
Vision) and Psychiatrists (report under MH)• Line 2: All medical (not dental) lab and x-ray costs
including supplies, lab staff, etc.• Line 3: All other direct medical costs: dues,
supplies, depreciation, travel, CME, EHR, etc.
Table 8A: Direct Costs

URBAN INDIAN HEALTH PROGRAMCY2013 70
Other Clinical Services Costs:
• Lines 5, 6, 7, 9 and 9a include all personnel (hired or contracted) and all “other” direct expenses for (5) Dental; (6) Mental Health; (7) Substance Abuse; (9) Other Professional; (9a) Vision
Pharmacy costs (Lines 8a and 8b) are divided:• Line 8b = cost of pharmaceuticals only. • Line 8a = all other costs including MIS, staff,
equipment, non-pharmaceutical supplies, etc.• All Pharmacy Overhead is reported on line 8a
column b• Note: Do not report donated pharmaceuticals on
either line 8a or 8b. Is reported on Line 18/Donated
Direct Costs (continued)

URBAN INDIAN HEALTH PROGRAMCY2013 71
• Line 11 Total Enabling Costs = sum of lines 11a-11g
Include all staff and contract personnel as well as all other related direct expenses for enabling services.
FINANCIAL COSTS OF ENABLING AND OTHER PROGRAM RELATED SERVICES
11a. Case Management
11b. Transportation
11c. Outreach
11d. Patient and Community Education
11e. Eligibility Assistance
11 f. Interpretation Services
11g. Other Enabling Services (specify: ___________)
11.Total Enabling Services Cost (Sum lines 11a through 11g)
12. Other Related Services (specify:________________)
13.TOTAL ENABLING AND OTHER SERVICES
(SUM LINES 11 AND 12)
Direct Costs (continued)

URBAN INDIAN HEALTH PROGRAMCY2013 72
Table 8A Line 12: Other Program Related Costs:
• Include staff and contract personnel reported on Table 5, Line 29a as well as other related direct expenses for non-health-care services such as:
WIC Housing CorporationsJob Training Child careShelters Fitness programsHead Start /Early Head StartAdult Day Health Care
• Include any “pass through” funds here
Direct Costs (continued)
URBAN INDIAN HEALTH PROGRAMCY2013 73
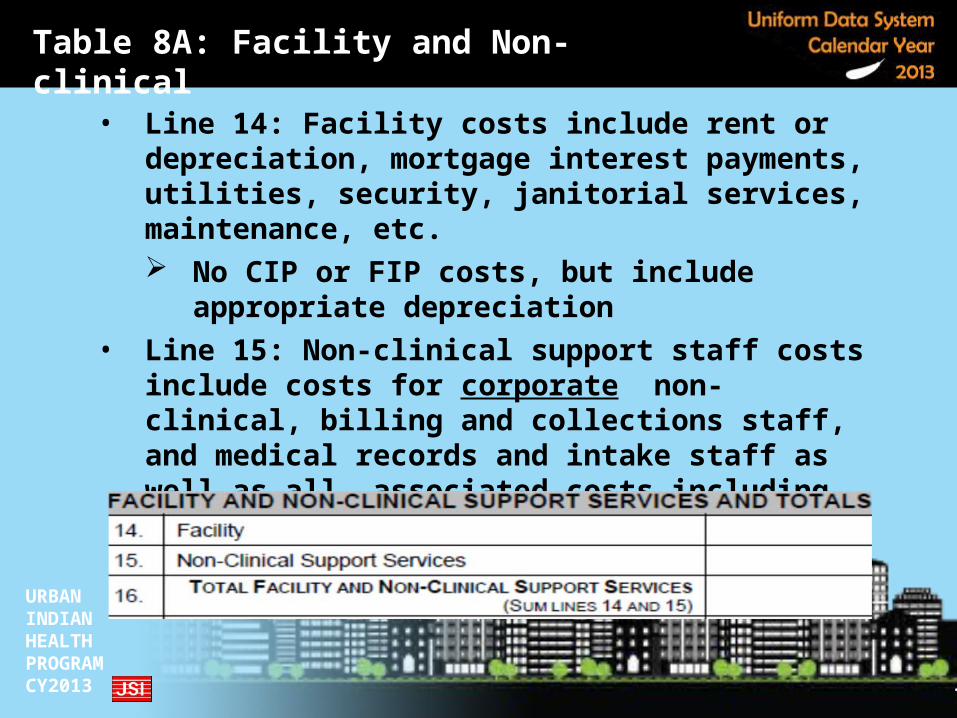
• Line 14: Facility costs include rent or depreciation, mortgage interest payments, utilities, security, janitorial services, maintenance, etc. No CIP or FIP costs, but include
appropriate depreciation• Line 15: Non-clinical support staff costs
include costs for corporate non-clinical, billing and collections staff, and medical records and intake staff as well as all associated costs including supplies, equipment, depreciation, travel, etc.
Table 8A: Facility and Non-clinical

URBAN INDIAN HEALTH PROGRAMCY2013 74
• Allocate each building separately Captures differences in costs per
building such as improvements, donated space, etc.
• Allocate based on proportion of square footage utilized by each cost center
• Add non-clinical space expenses to non-clinical costs to be allocated
Allocation of Facility

URBAN INDIAN HEALTH PROGRAMCY2013 75
Non-Clinical support staff and costs• Allocate based on actual use
Billing, medical records, front desk, etc.
• Alternative: straight line method, using the proportion of total costs to the service category excluding all non-clinical support costs and facility costs.
Allocation of Non-Clinical Support

URBAN INDIAN HEALTH PROGRAMCY2013 76
• Table 8A and 5 Consistency:Staff FTEs reported by service on Table 5
should be consistent with costs reported on Table 8A by cost center
• Calculated performance measures:Costs per visit and per patient for each
serviceFor example, medical cost per medical visit or dental cost per dental patient, etc.
Cross Table Issues
URBAN INDIAN HEALTH PROGRAMCY2013 77
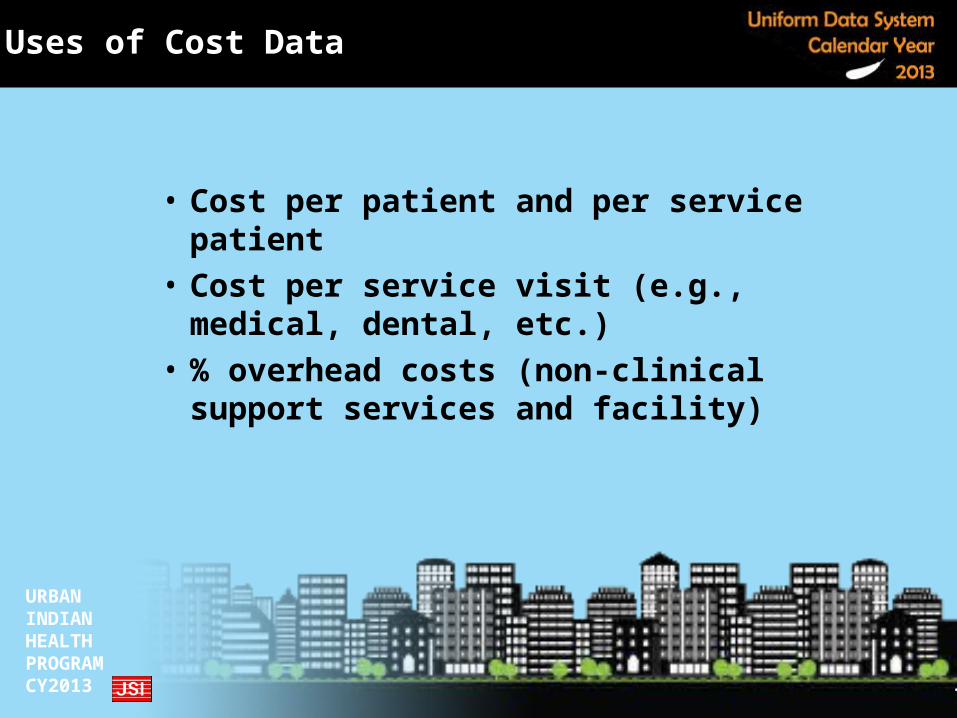
• Cost per patient and per service patient
• Cost per service visit (e.g., medical, dental, etc.)
• % overhead costs (non-clinical support services and facility)
Uses of Cost Data

URBAN INDIAN HEALTH PROGRAMCY2013 78
• How would you check the reasonableness of costs on T8A as they relate to staffing and visits on T5?
Test Your Reviewer Skills 3
Table 5:
Table 8A:

URBAN INDIAN HEALTH PROGRAMCY2013 79
Table 9D: Patient Related Revenues
Charges, collections and allowances by payor

URBAN INDIAN HEALTH PROGRAMCY2013 80
• Cash Basis• Patient revenues are
reported by payor:Medicaid MedicareOther PublicSelf-Pay
Table 9D: Patient Related Revenue

URBAN INDIAN HEALTH PROGRAMCY2013 81
Col (a) – Full Charges• Undiscounted, unadjusted charges
for services based on fee schedule; charges should cover costs
• Include all charges (i.e., medical, dental, pharmacy, mental health, etc.) for services rendered during year
• Do not include “charges” where no collection is attempted or expected such as charges for enabling services, donated pharmaceuticals, or free vaccines
Charges

URBAN INDIAN HEALTH PROGRAMCY2013 82
• Collections (column b):• Report all amounts collected as payment
for health services including payments from patients, third party insurance, FQHC reconciliation payments and contract payments (e.g., schools, jails, etc.) received during the year.
• Report collections by payorDo not include cash “donations” (these
are reported on Table 9E)Do not include “meaningful use”
payments
Collections

URBAN INDIAN HEALTH PROGRAMCY2013 83
Adjustments Columns (c1-c4): Note: These amounts are included in col (b) but do not = col (b)
• Columns (c1) and (c2): reconciliation payments for FQHC or CHIP-RA settlements
• Col (c3): “Other Retroactive Payments” including risk pools, incentives, PFP, withholds and court ordered payments
• Col (c4): amounts which are returned to third party (report as positive number)
Adjustments

URBAN INDIAN HEALTH PROGRAMCY2013 84
Allowances Column(d): • Reductions in payment by a third party
based on a contract• Allowances do not include:
non-payment for services that are not covered by the third party or rejected by the 3rd party
deductibles or co-payments that are due from the patient and not paid by a third party
• Reduce allowances by amount of FQHC payments
• For capitated plans, col d = col a – col b
Allowances

URBAN INDIAN HEALTH PROGRAMCY2013 85
Self-Pay Sliding Discounts Column (e) (Line 13)• A reduction in the amount charged to patients
for services rendered which: Is based on the patient’s documented
income and family size at the time of service as it relates to the Federal Poverty Level
May be applied to insured patients co-payments, deductibles and non-covered services when the charge has been moved to self-pay if consistent with how uninsured patients are treated
AI/AN status May not be applied to past due amounts
Self-Pay Sliding Discounts

URBAN INDIAN HEALTH PROGRAMCY2013 86
Bad Debt –Column (f) (Line 13 only):
• Amounts considered to be uncollectable and formally written off during the current calendar year, regardless of when the service was provided
• Only self-pay bad debt is reported, not third party bad debt
• Do not report as a “cost” on Table 8A• Bad debt can never be changed to a
sliding discount
Bad Debt

URBAN INDIAN HEALTH PROGRAMCY2013 87
Lines 1 - 3: Medicaid • All routine Medicaid under any name• EPSDT – under any name• Medicaid part of Medi-Medi or crossovers• CHIP, if paid through Medicaid• May also include fees for other state
programs which are paid by the Medicaid intermediary
Lines 4 - 6: Medicare • All routine Medicare• Medicare Advantage• Medicare portion of Medi-Medi or
crossovers
Payors: Medicaid and Medicare

URBAN INDIAN HEALTH PROGRAMCY2013 88
Lines 7 - 9: Other Public • State or other public insurance programs• Non-Medicaid CHIP programs• State-based programs which cover a
specific service or disease (i.e., BCCCP, Title X, Title V, TB)
• Does not include indigent care programs NOTE: Patients who benefit from
services paid for by “other public payers” are not necessarily counted under “other public insurance” on Table 4
Lines 10-12: Private• Private and commercial insurance• Medi-gap programs, Tricare, Workers
Comp., etc.• Contracts with schools, jails head start,
etc.
Payors: Other Public and Private

URBAN INDIAN HEALTH PROGRAMCY2013 89
Line 13: Self PayCharges for which patients are responsible and all associated collections including:
• Full fee patients• Patients receiving sliding discounts• “Nominal fee” or “zero-pay” patients• Co-payments and/or deductibles• Services not covered by a patient’s insurance• Services which form or will form the basis for
state or local safety net (uncompensated care) funds
• Dental patients who only have medical insurance
Payors: Self-Pay

URBAN INDIAN HEALTH PROGRAMCY2013 90
It is essential to reclassify rejected charges:
• This includes co-payments and deductibles as well as charges for non-covered services which are rejected by third parties
Deduct unpaid charges or portion of charge from original payor (Medicaid, Medicare, Private etc.)
Add to charges on line for the secondary (tertiary, etc.) payor
Show collections of these amounts on the appropriate line
Reclassify Charges

URBAN INDIAN HEALTH PROGRAMCY2013 91
• Patient charges by payor related to enrollment (Table 4)
• Managed care revenues related to member months (Table 4)
• Patient charges and billable visits on Table 5
• Cash revenues (Table 9D and 9E) and total costs (Table 8A)
Cross-Table Issues
URBAN INDIAN HEALTH PROGRAMCY2013 92
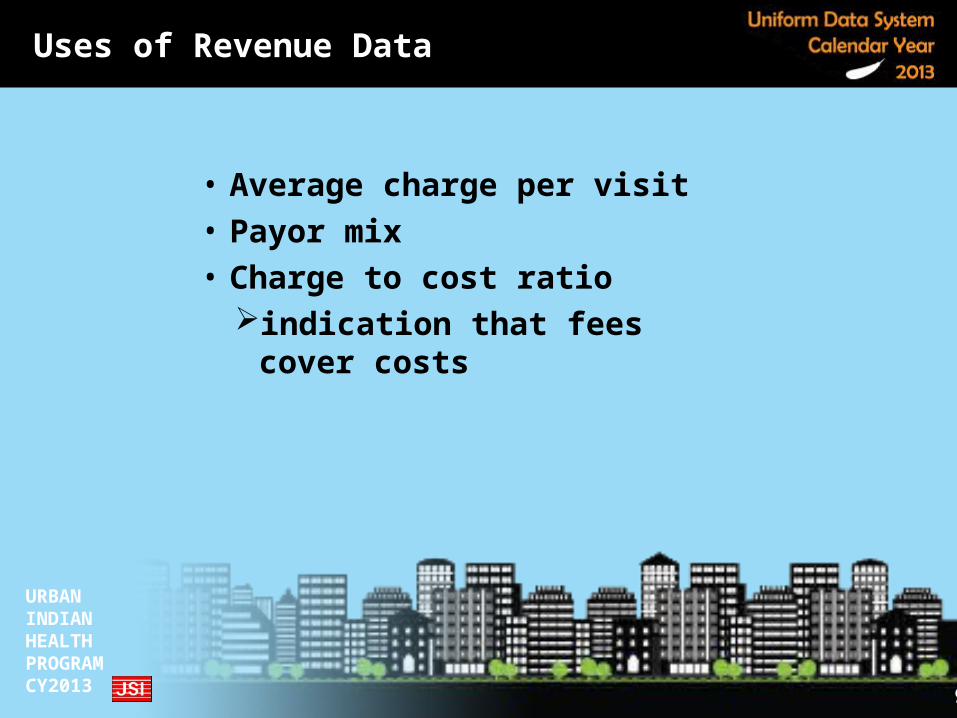
• Average charge per visit• Payor mix• Charge to cost ratio
indication that fees cover costs
Uses of Revenue Data

URBAN INDIAN HEALTH PROGRAMCY2013 93
Table 9E: Other RevenuesNon-patient-service income

URBAN INDIAN HEALTH PROGRAMCY2013 94
Table 9E: Other Revenues
• Report non patient-service income
• Cash basis – amount received/drawn down during year
• Report “last party” to handle funds before you receive them
• Do not include:Capital received as a
loanPatient-related
revenueValue of donated
services, supplies, or facilities
Donated “community value”
URBAN INDIAN HEALTH PROGRAMCY2013 95
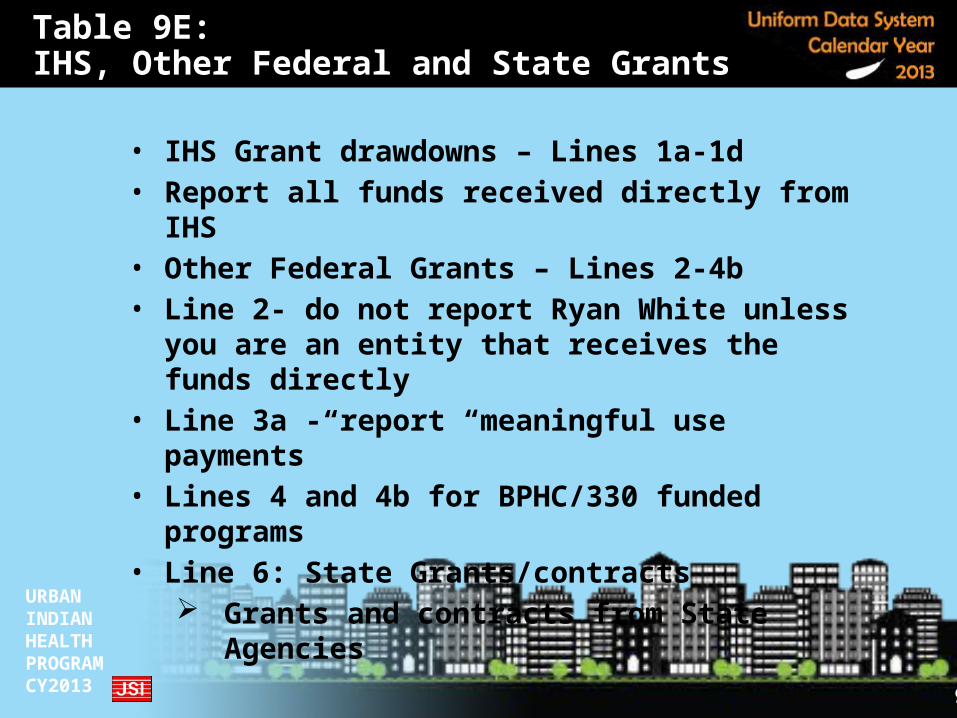
• IHS Grant drawdowns – Lines 1a-1d• Report all funds received directly from
IHS • Other Federal Grants – Lines 2-4b• Line 2- do not report Ryan White unless
you are an entity that receives the funds directly
• Line 3a - report “meaningful use payments”
• Lines 4 and 4b for BPHC/330 funded programs
• Line 6: State Grants/contracts Grants and contracts from State
Agencies
Table 9E: IHS, Other Federal and State Grants

URBAN INDIAN HEALTH PROGRAMCY2013 96
Line 6a: Indigent Care programs• If a tribal entity, report 638 Compacting money
received directly from IHS • State and local programs that pay for health
care in general and are based on a current or prior level of service, though not on a specific fee for service
• Full charges for these programs are reported on Table 9D as self-pay charges and everything not due from the patient is written off as a sliding fee discount
• Do not include state insurance plans
Table 9E: Non-FederalIndigent Care Programs

URBAN INDIAN HEALTH PROGRAMCY2013 97
• Line 6b: Maternal and Childcare grants and WIC • Line 7a and b: Local Grants/ contracts
Grants/contracts from city (line 7A) and county (line 7b) gov’t.
• Line 8: Foundation / Private GrantsFunds received from foundations or private
organizations including money received from a contract with a tribe
• Line 10: Other RevenuesContributions, fund raising income, rents and
sales, patient record fees, etc.
Table 9E: Non-Federal Grants or Contracts

URBAN INDIAN HEALTH PROGRAMCY2013 98
Do not include value of donated services supplies or facilities
Do not include capital received as a loan Do not include patient-related revenues
(e.g., pharmacy, BCCCP, etc.)
What NOT to include on Table 9E

URBAN INDIAN HEALTH PROGRAMCY2013 99
• Table 5 and 9E: Reporting of other related services including WIC
• Table 9D and 9E: Reporting of patient and non-patient related revenues
Sliding fee discount versus indigent care program funds
Cross Table Issues

URBAN INDIAN HEALTH PROGRAMCY2013 100
• Table 9D, 9E, and 5: Total revenues and revenues per patient, provider FTE, etc.
• Table 9D and 9E versus 8A: Cash collections compared with costs as indicator of cash flow
• Table 9D and 9E: diversification of funding
Uses of Revenue Data

URBAN INDIAN HEALTH PROGRAMCY2013 101
Demonstration of Software
AccessData EntryValidationSubmissionReports
URBAN INDIAN HEALTH PROGRAMCY2013 102
Using UDS for Decision Making
Interpreting the Feedback Report

URBAN INDIAN HEALTH PROGRAMCY2013 103
• Too much information and not enough time!
• A Snapshot Approach – focus on a few high impact measures for initial review to identify
StrengthsPossible areas of improvement
Focusing Your Efforts

URBAN INDIAN HEALTH PROGRAMCY2013 104
• Patient profile – who are you serving?
• Quality of care – are standards of care high?
• Efficiency – are we maximizing our resources?
• Financial security - are we in a good financial position?
Snapshot of Performance

URBAN INDIAN HEALTH PROGRAMCY2013 105
Performance measures• Access
Describes patients you serve
• Quality of Care Utilization and GPRA
measures• Efficiency
Evaluates capacity• Financial Cost/Viability
Assesses costs and viability
Feedback Report

URBAN INDIAN HEALTH PROGRAMCY2013 106
Evidence that program is serving priority populations:
• % Growth in patientsAI/AN patients% AI/AN of total patientsTotal patients% patients using medical
services• Patient demographics• Patients with financial, cultural
and linguistic barriers% Uninsured, Medicaid, other
public% < 200% FPL
Patient Profile

URBAN INDIAN HEALTH PROGRAMCY2013 107
Evidence that program is delivering quality care:
GPRA Measures
Continuity of care
Prevalence rates
• Visits per patient• Rates of service use• GPRA
Chronic Disease (diabetes control)
Routine and Preventive care (screenings, immunizations and assessments)
Behavioral health (tobacco, mental health and domestic violence)
Quality of Care
URBAN INDIAN HEALTH PROGRAMCY2013 108
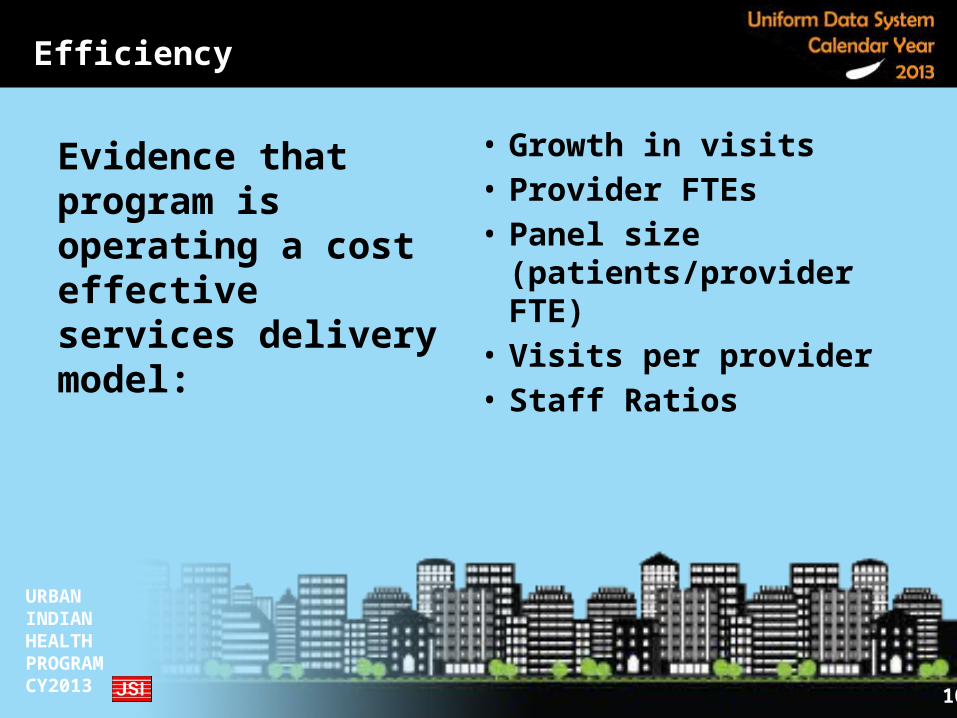
Evidence that program is operating a cost effective services delivery model:
• Growth in visits• Provider FTEs• Panel size
(patients/provider FTE)
• Visits per provider• Staff Ratios
Efficiency

URBAN INDIAN HEALTH PROGRAMCY2013 109
• Cost Cost per patient and visit % administrative costs Charge to cost ratio Surplus/deficit as % of total costs
• Diversification of Funding % income from IHS % income from patient service IHS funding per AI/AN patient
• Financial Viability Change in net assets as % of
expense Working capital to expense ratio Debt to equity ratio
Financial/Cost Viability
Evidence that program is financially viable:

URBAN INDIAN HEALTH PROGRAMCY2013 110
• Provides formulas for all measures
• Format “replicates” the report format
• In the formula section, each measure is identified with: A number A name, corresponding to
the name on the report A formula for calculating
the measure
UDS Reference Guide

URBAN INDIAN HEALTH PROGRAMCY2013 111
% Pediatric: (T3A Lines 1-15, Col A+B) /(T3A L39 CA + T3A L39 CB)
T= Table + = add - = subtractL= Line * = multiply C=
Column / = divide
Calculations for Performance Measures

URBAN INDIAN HEALTH PROGRAMCY2013 112
Comparison Groups• Program
Current year, prior year and 2 year change Reported for total patients and AI/AN population
• Averages Comparison group – Full Ambulatory, Limited
Ambulatory or Information and Referral National average (all UIHP programs) BPHC Average (applicable to Full Ambulatory
programs)

URBAN INDIAN HEALTH PROGRAMCY2013 113
Average Defined: The value obtained by dividing the sum of a set of quantities by the number of quantities in the set.
Program Type (Full Ambulatory, Limited Ambulatory, Information and Referral
UIHP National Averages (from all urban programs)
BPHC National (from FQHCs)
Averages
URBAN INDIAN HEALTH PROGRAMCY2013 114
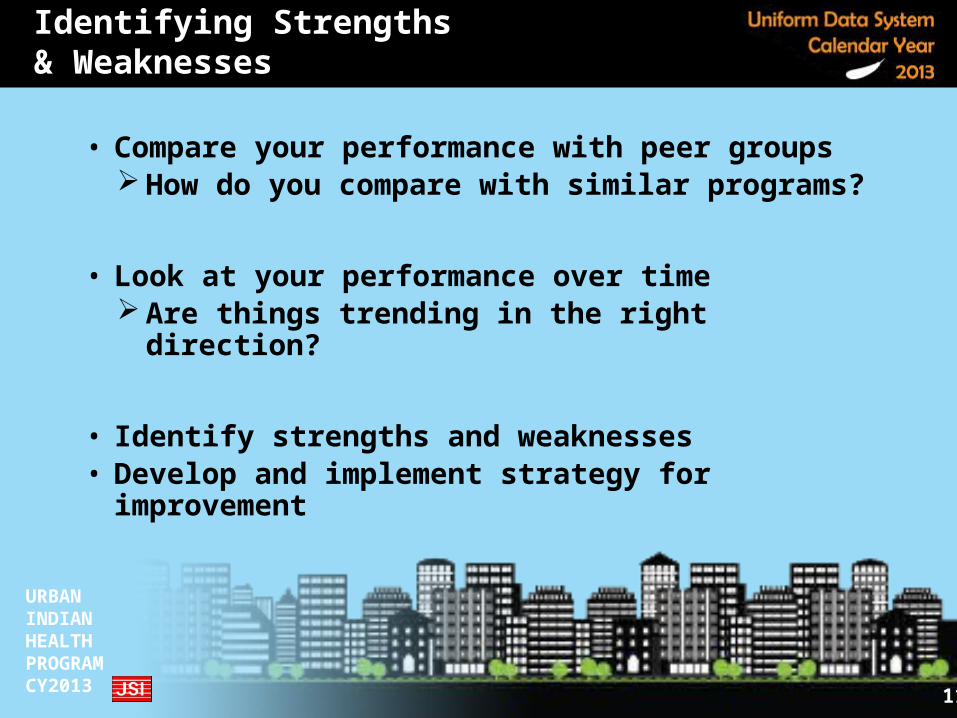
• Compare your performance with peer groups How do you compare with similar
programs?
• Look at your performance over time Are things trending in the right direction?
• Identify strengths and weaknesses• Develop and implement strategy for
improvement
Identifying Strengths & Weaknesses

URBAN INDIAN HEALTH PROGRAMCY2013 115
Priscilla DavisJohn Snow, Inc. (JSI)
UDS Helpline: 1-866-698-5976email: [email protected]: www.uihpdata.net
Contact Information