Uranium 801
37
PUBLIC HEALTH GOALS FOR CHEMICALS IN DRINKING WATER URANIUM August 2001 Agency Secretary California Environmental Protection Agency Winston H. Hickox Director Office of Environmental Health Hazard Assessment Joan E. Denton, Ph.D.
-
Upload
adel-suker -
Category
Documents
-
view
226 -
download
0
Transcript of Uranium 801
7/28/2019 Uranium 801
http://slidepdf.com/reader/full/uranium-801 1/37
PUBLIC HEALTH GOALS FORCHEMICALS IN DRINKING WATER
URANIUM
August 2001
Agency Secretary
California Environmental Protection Agency
Winston H. Hickox
Director
Office of Environmental Health Hazard Assessment
Joan E. Denton, Ph.D.
7/28/2019 Uranium 801
http://slidepdf.com/reader/full/uranium-801 2/37
Public Health Goal for
URANIUM
In Drinking Water
Prepared by
Office of Environmental Health Hazard Assessment
California Environmental Protection Agency
Pesticide and Environmental Toxicology SectionAnna M. Fan, Ph.D., Chief
Deputy Director for Scientific Affairs
George V. Alexeeff, Ph.D.
August 2001
7/28/2019 Uranium 801
http://slidepdf.com/reader/full/uranium-801 3/37
LIST OF CONTRIBUTORS
PHG PROJECT
MANAGEMENT
REPORT PREPARATION SUPPORT
Project Director Authors Administrative Support
Anna Fan, Ph.D. David Morry, Ph.D. Edna Hernandez
Joseph Brown, Ph.D. Coordinator
Public Workshop Sharon Davis
Yi Wang, Ph.D. Primary Reviewer Jocelyn Tan
Frank Mycroft, Ph.D. Genevieve Vivar
External Review
David Ting, Ph.D.
Revisions/Responses
Robert Howd, Ph.D.
Final Reviewers
Anna Fan, Ph.D.
George Alexeeff, Ph.D.Robert Howd, Ph.D.
Education and
Outreach/Summary Documents
Hanafi Russell
Library Support
Charleen Kubota, M.L.S.
Valerie Walter
Web Site Posting
Edna Hernandez
Laurie Monserrat
We thank the U.S. Environmental Protection Agency (Office of Water; National Center for
Environmental Assessment) and the faculty members of the University of California with whom
the Office of Environmental Health Hazard Assessment contracted through the University of
California Office of the President for their peer reviews of the public health goal documents, and
gratefully acknowledge the comments received from all interested parties.
URANIUM in Drinking Water
California Public Health Goal (PHG) iii August 2001
7/28/2019 Uranium 801
http://slidepdf.com/reader/full/uranium-801 4/37
PREFACE
Drinking Water Public Health Goals
Pesticide and Environmental Toxicology Section
Office of Environmental Health Hazard Assessment
California Environmental Protection Agency
This Public Health Goal (PHG) technical support document provides information on health
effects from contaminants in drinking water. PHGs are developed for chemical contaminants
based on the best available toxicological data in the scientific literature. These documents and the
analyses contained in them provide estimates of the levels of contaminants in drinking water that
would pose no significant health risk to individuals consuming the water on a daily basis over a
lifetime.
The California Safe Drinking Water Act of 1996 (amended Health and Safety Code, Section
116365), amended 1999, requires the Office of Environmental Health Hazard Assessment(OEHHA) to perform risk assessments and publish PHGs for contaminants in drinking water
based exclusively on public health considerations. Section 116365 specifies that the PHG is to be
based exclusively on public health considerations without regard to cost impacts. The Act
requires that PHGs be set in accordance with the following criteria:
1. PHGs for acutely toxic substances shall be set at levels at which no known or anticipated
adverse effects on health will occur, with an adequate margin of safety.
2. PHGs for carcinogens or other substances which can cause chronic disease shall be based
upon currently available data and shall be set at levels which OEHHA has determined do
not pose any significant risk to health.
3. To the extent the information is available, OEHHA shall consider possible synergisticeffects resulting from exposure to two or more contaminants.
4. OEHHA shall consider the existence of groups in the population that are more
susceptible to adverse effects of the contaminants than a normal healthy adult.
5. OEHHA shall consider the contaminant exposure and body burden levels that alter
physiological function or structure in a manner that may significantly increase the risk of
illness.
6. In cases of insufficient data to determine a level of no anticipated risk, OEHHA shall set
the PHG at a level that is protective of public health with an adequate margin of safety.
7. In cases where scientific evidence demonstrates that a safe dose-response threshold for a
contaminant exists, then the PHG should be set at that threshold.
8. The PHG may be set at zero if necessary to satisfy the requirements listed above.
9. OEHHA shall consider exposure to contaminants in media other than drinking water,
including food and air and the resulting body burden.
10. PHGs published by OEHHA shall be reviewed every five years and revised as necessary
based on the availability of new scientific data.
URANIUM in Drinking Water
California Public Health Goal (PHG) iv August 2001
7/28/2019 Uranium 801
http://slidepdf.com/reader/full/uranium-801 5/37
PHGs published by OEHHA are for use by the California Department of Health Services (DHS)
in establishing primary drinking water standards (State Maximum Contaminant Levels, or
MCLs). Whereas PHGs are to be based solely on scientific and public health considerations
without regard to economic cost considerations, drinking water standards adopted by DHS are to
consider economic factors and technical feasibility. Each standard adopted shall be set at a level
that is as close as feasible to the corresponding PHG, placing emphasis on the protection of public
health. PHGs established by OEHHA are not regulatory in nature and represent only non-mandatory goals. By federal law, MCLs established by DHS must be at least as stringent as the
federal MCL if one exists.
PHG documents are used to provide technical assistance to DHS, and they are also informative
reference materials for federal, state and local public health officials and the public. While the
PHGs are calculated for single chemicals only, they may, if the information is available, address
hazards associated with the interactions of contaminants in mixtures. Further, PHGs are derived
for drinking water only and are not to be utilized as target levels for the contamination of other
environmental media.
Additional information on PHGs can be obtained at the OEHHA Web site at www.oehha.ca.gov.
URANIUM in Drinking Water
California Public Health Goal (PHG) v August 2001
7/28/2019 Uranium 801
http://slidepdf.com/reader/full/uranium-801 6/37
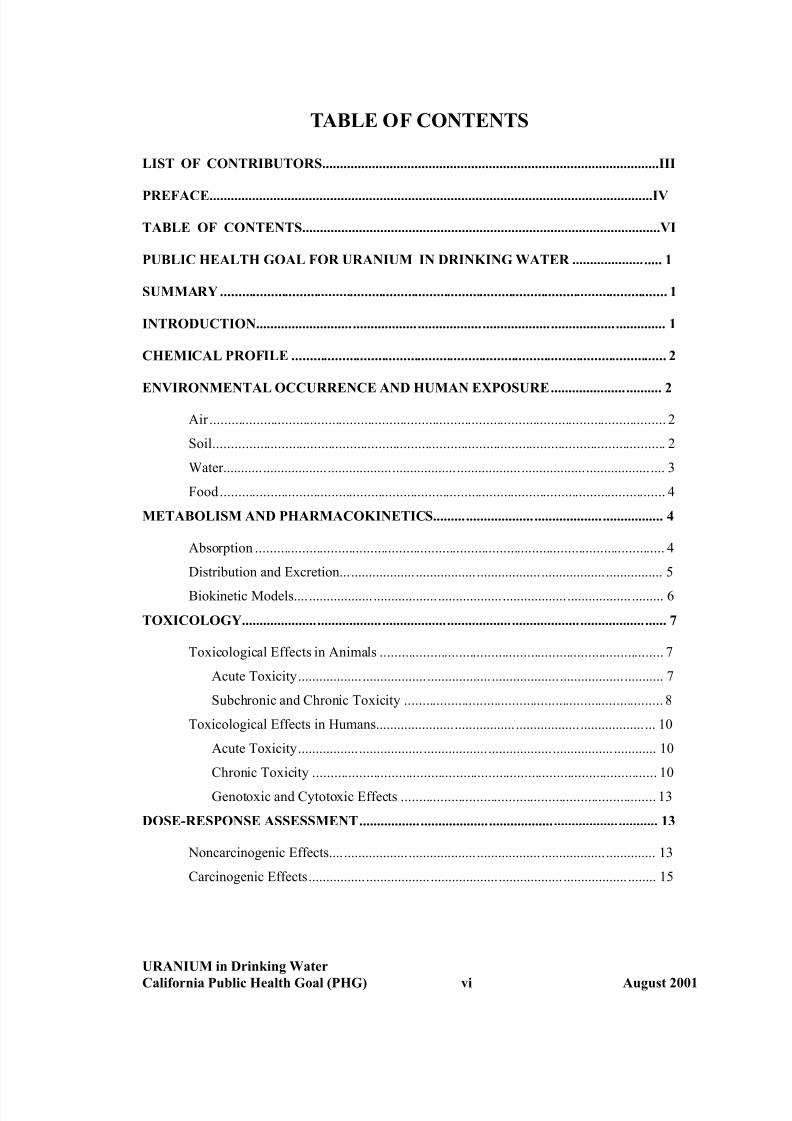
TABLE OF CONTENTS
LIST OF CONTRIBUTORS...............................................................................................III
PREFACE.............................................................................................................................IV
TABLE OF CONTENTS.....................................................................................................VI
PUBLIC HEALTH GOAL FOR URANIUM IN DRINKING WATER ......................... 1
SUMMARY ............................................................................................................................ 1
INTRODUCTION.................................................................................................................. 1
CHEMICAL PROFILE ........................................................................................................ 2
ENVIRONMENTAL OCCURRENCE AND HUMAN EXPOSURE............................... 2
Air............................................................................................................................... 2
Soil.............................................................................................................................. 2
Water........................................................................................................................... 3
Food............................................................................................................................ 4
METABOLISM AND PHARMACOKINETICS................................................................ 4
Absorption .................................................................................................................. 4
Distribution and Excretion.......................................................................................... 5
Biokinetic Models....................................................................................................... 6
TOXICOLOGY...................................................................................................................... 7
Toxicological Effects in Animals ............................................................................... 7
Acute Toxicity...................................................................................................... 7
Subchronic and Chronic Toxicity ........................................................................ 8
Toxicological Effects in Humans.............................................................................. 10
Acute Toxicity.................................................................................................... 10
Chronic Toxicity ................................................................................................ 10
Genotoxic and Cytotoxic Effects ....................................................................... 13
DOSE-RESPONSE ASSESSMENT................................................................................... 13
Noncarcinogenic Effects........................................................................................... 13
Carcinogenic Effects................................................................................................. 15
URANIUM in Drinking Water
California Public Health Goal (PHG) vi August 2001
7/28/2019 Uranium 801
http://slidepdf.com/reader/full/uranium-801 7/37
CALCULATION OF PHG ................................................................................................. 16
Noncarcinogenic Effects........................................................................................... 16
Calculations Based on Data from Rat Studies.................................................... 16
Calculations Based on Data from Human Studies.............................................. 18
Carcinogenic Effects................................................................................................. 19
RISK CHARACTERIZATION.......................................................................................... 21
OTHER STANDARDS AND REGULATORY LEVELS................................................ 23
REFERENCES..................................................................................................................... 25
URANIUM in Drinking Water
California Public Health Goal (PHG) vii August 2001
7/28/2019 Uranium 801
http://slidepdf.com/reader/full/uranium-801 8/37
PUBLIC HEALTH GOAL FOR URANIUM
IN DRINKING WATER
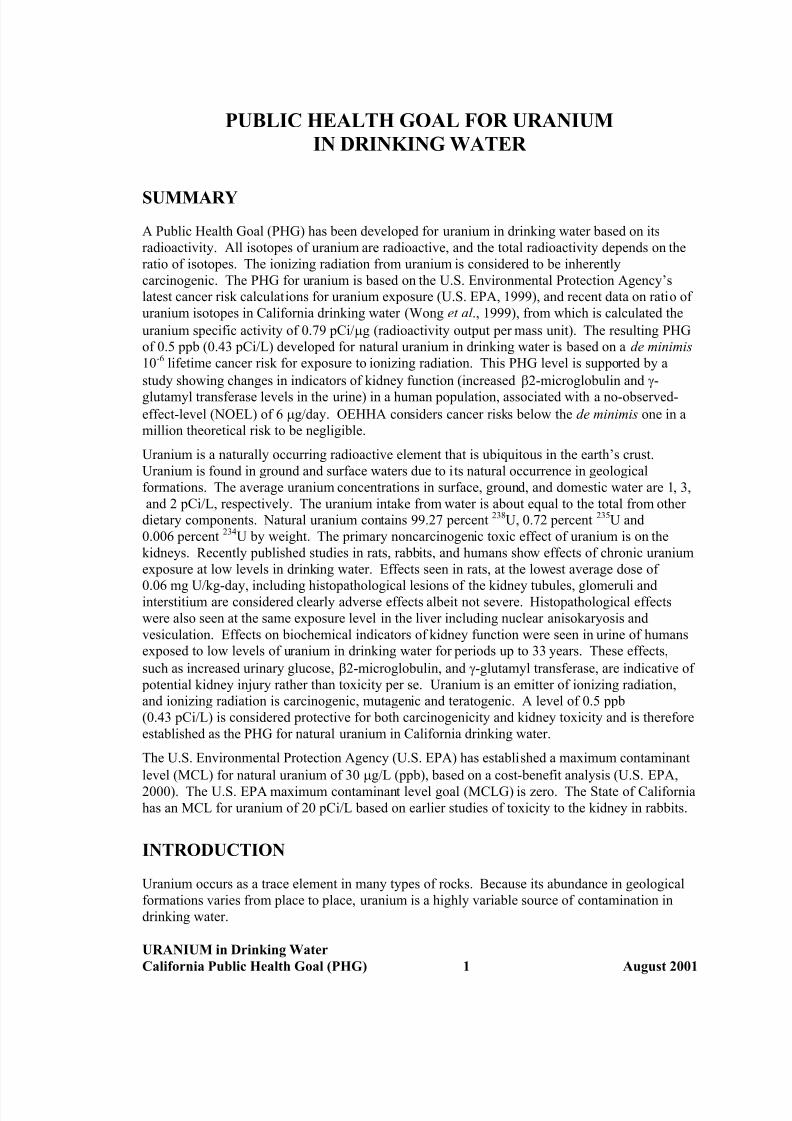
SUMMARY
A Public Health Goal (PHG) has been developed for uranium in drinking water based on its
radioactivity. All isotopes of uranium are radioactive, and the total radioactivity depends on the
ratio of isotopes. The ionizing radiation from uranium is considered to be inherently
carcinogenic. The PHG for uranium is based on the U.S. Environmental Protection Agency’s
latest cancer risk calculations for uranium exposure (U.S. EPA, 1999), and recent data on ratio of
uranium isotopes in California drinking water (Wong et al ., 1999), from which is calculated the
uranium specific activity of 0.79 pCi/µg (radioactivity output per mass unit). The resulting PHG
of 0.5 ppb (0.43 pCi/L) developed for natural uranium in drinking water is based on a de minimis
10-6 lifetime cancer risk for exposure to ionizing radiation. This PHG level is supported by a
study showing changes in indicators of kidney function (increased β2-microglobulin and γ-
glutamyl transferase levels in the urine) in a human population, associated with a no-observed-effect-level (NOEL) of 6 µg/day. OEHHA considers cancer risks below the de minimis one in a
million theoretical risk to be negligible.
Uranium is a naturally occurring radioactive element that is ubiquitous in the earth’s crust.
Uranium is found in ground and surface waters due to its natural occurrence in geological
formations. The average uranium concentrations in surface, ground, and domestic water are 1, 3,
and 2 pCi/L, respectively. The uranium intake from water is about equal to the total from other
dietary components. Natural uranium contains 99.27 percent 238U, 0.72 percent 235U and
0.006 percent 234U by weight. The primary noncarcinogenic toxic effect of uranium is on the
kidneys. Recently published studies in rats, rabbits, and humans show effects of chronic uranium
exposure at low levels in drinking water. Effects seen in rats, at the lowest average dose of
0.06 mg U/kg-day, including histopathological lesions of the kidney tubules, glomeruli andinterstitium are considered clearly adverse effects albeit not severe. Histopathological effects
were also seen at the same exposure level in the liver including nuclear anisokaryosis and
vesiculation. Effects on biochemical indicators of kidney function were seen in urine of humans
exposed to low levels of uranium in drinking water for periods up to 33 years. These effects,
such as increased urinary glucose, β2-microglobulin, and γ-glutamyl transferase, are indicative of
potential kidney injury rather than toxicity per se. Uranium is an emitter of ionizing radiation,
and ionizing radiation is carcinogenic, mutagenic and teratogenic. A level of 0.5 ppb
(0.43 pCi/L) is considered protective for both carcinogenicity and kidney toxicity and is therefore
established as the PHG for natural uranium in California drinking water.
The U.S. Environmental Protection Agency (U.S. EPA) has established a maximum contaminant
level (MCL) for natural uranium of 30 µg/L (ppb), based on a cost-benefit analysis (U.S. EPA,
2000). The U.S. EPA maximum contaminant level goal (MCLG) is zero. The State of California
has an MCL for uranium of 20 pCi/L based on earlier studies of toxicity to the kidney in rabbits.
INTRODUCTION
Uranium occurs as a trace element in many types of rocks. Because its abundance in geological
formations varies from place to place, uranium is a highly variable source of contamination in
drinking water.
URANIUM in Drinking Water
California Public Health Goal (PHG) 1 August 2001
7/28/2019 Uranium 801
http://slidepdf.com/reader/full/uranium-801 9/37
Other agencies have developed health protective levels for uranium (see page 23), these differ
from each other and provide equivocal guidance for setting a PHG for natural uranium. The
purpose of this document is to review the evidence on toxicity of natural uranium and to derive an
appropriate PHG for natural uranium in drinking water.
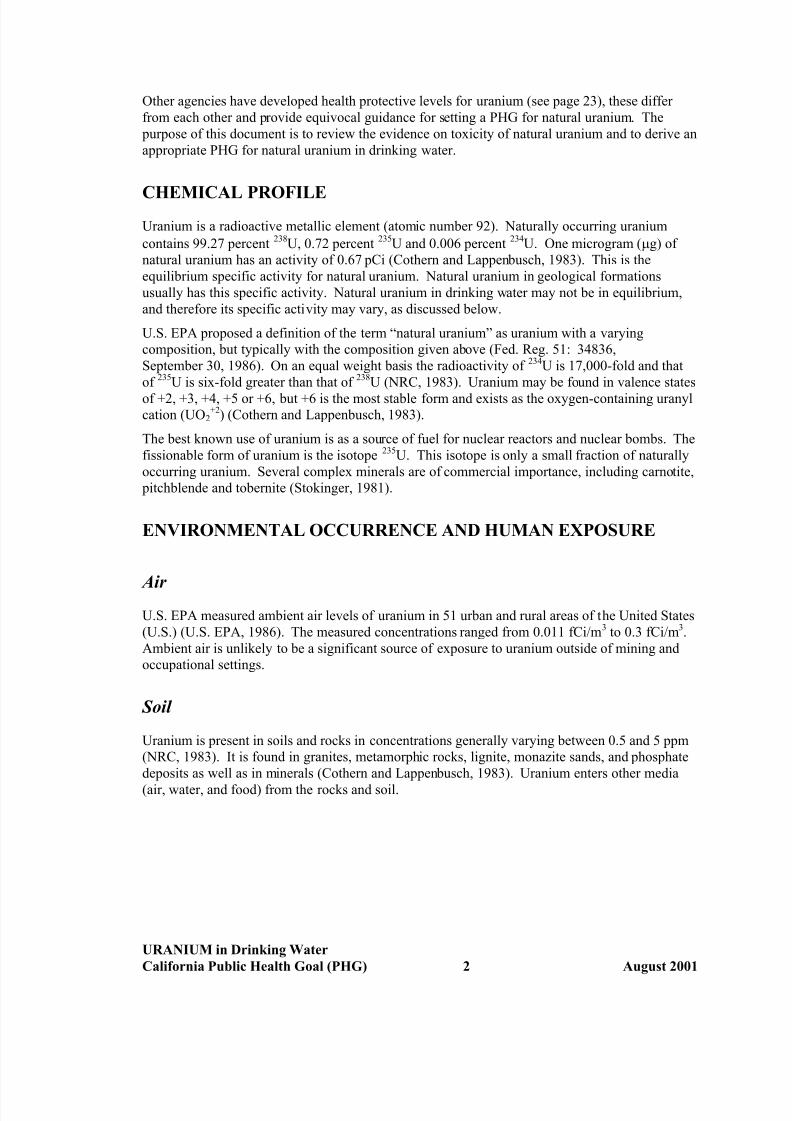
CHEMICAL PROFILE
Uranium is a radioactive metallic element (atomic number 92). Naturally occurring uranium
contains 99.27 percent 238U, 0.72 percent 235U and 0.006 percent 234U. One microgram (µg) of
natural uranium has an activity of 0.67 pCi (Cothern and Lappenbusch, 1983). This is the
equilibrium specific activity for natural uranium. Natural uranium in geological formations
usually has this specific activity. Natural uranium in drinking water may not be in equilibrium,
and therefore its specific activity may vary, as discussed below.
U.S. EPA proposed a definition of the term “natural uranium” as uranium with a varying
composition, but typically with the composition given above (Fed. Reg. 51: 34836,
September 30, 1986). On an equal weight basis the radioactivity of 234U is 17,000-fold and that
of 235U is six-fold greater than that of 238U (NRC, 1983). Uranium may be found in valence states
of +2, +3, +4, +5 or +6, but +6 is the most stable form and exists as the oxygen-containing uranyl
cation (UO2+2) (Cothern and Lappenbusch, 1983).
The best known use of uranium is as a source of fuel for nuclear reactors and nuclear bombs. The
fissionable form of uranium is the isotope 235U. This isotope is only a small fraction of naturally
occurring uranium. Several complex minerals are of commercial importance, including carnotite,
pitchblende and tobernite (Stokinger, 1981).
ENVIRONMENTAL OCCURRENCE AND HUMAN EXPOSURE
Air U.S. EPA measured ambient air levels of uranium in 51 urban and rural areas of the United States
(U.S.) (U.S. EPA, 1986). The measured concentrations ranged from 0.011 fCi/m3 to 0.3 fCi/m3.
Ambient air is unlikely to be a significant source of exposure to uranium outside of mining and
occupational settings.
Soil
Uranium is present in soils and rocks in concentrations generally varying between 0.5 and 5 ppm
(NRC, 1983). It is found in granites, metamorphic rocks, lignite, monazite sands, and phosphate
deposits as well as in minerals (Cothern and Lappenbusch, 1983). Uranium enters other media
(air, water, and food) from the rocks and soil.
URANIUM in Drinking Water
California Public Health Goal (PHG) 2 August 2001
7/28/2019 Uranium 801
http://slidepdf.com/reader/full/uranium-801 10/37
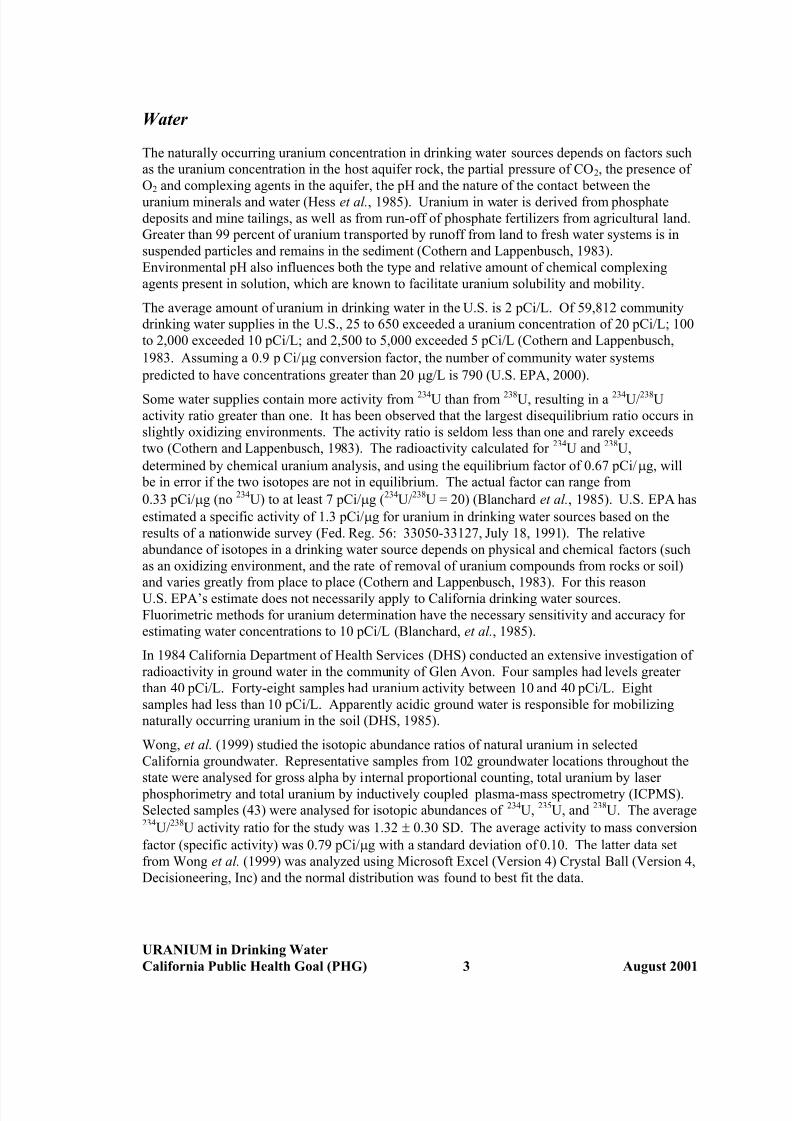
Water
The naturally occurring uranium concentration in drinking water sources depends on factors such
as the uranium concentration in the host aquifer rock, the partial pressure of CO2, the presence of
O2 and complexing agents in the aquifer, the pH and the nature of the contact between the
uranium minerals and water (Hess et al., 1985). Uranium in water is derived from phosphate
deposits and mine tailings, as well as from run-off of phosphate fertilizers from agricultural land.
Greater than 99 percent of uranium transported by runoff from land to fresh water systems is in
suspended particles and remains in the sediment (Cothern and Lappenbusch, 1983).
Environmental pH also influences both the type and relative amount of chemical complexing
agents present in solution, which are known to facilitate uranium solubility and mobility.
The average amount of uranium in drinking water in the U.S. is 2 pCi/L. Of 59,812 community
drinking water supplies in the U.S., 25 to 650 exceeded a uranium concentration of 20 pCi/L; 100
to 2,000 exceeded 10 pCi/L; and 2,500 to 5,000 exceeded 5 pCi/L (Cothern and Lappenbusch,
1983. Assuming a 0.9 p Ci/µg conversion factor, the number of community water systems
predicted to have concentrations greater than 20 µg/L is 790 (U.S. EPA, 2000).
Some water supplies contain more activity from 234U than from 238U, resulting in a 234U/238U
activity ratio greater than one. It has been observed that the largest disequilibrium ratio occurs in
slightly oxidizing environments. The activity ratio is seldom less than one and rarely exceeds
two (Cothern and Lappenbusch, 1983). The radioactivity calculated for 234U and 238U,
determined by chemical uranium analysis, and using the equilibrium factor of 0.67 pCi/µg, will
be in error if the two isotopes are not in equilibrium. The actual factor can range from
0.33 pCi/µg (no 234U) to at least 7 pCi/µg (234U/238U = 20) (Blanchard et al., 1985). U.S. EPA has
estimated a specific activity of 1.3 pCi/µg for uranium in drinking water sources based on the
results of a nationwide survey (Fed. Reg. 56: 33050-33127, July 18, 1991). The relative
abundance of isotopes in a drinking water source depends on physical and chemical factors (such
as an oxidizing environment, and the rate of removal of uranium compounds from rocks or soil)
and varies greatly from place to place (Cothern and Lappenbusch, 1983). For this reasonU.S. EPA’s estimate does not necessarily apply to California drinking water sources.
Fluorimetric methods for uranium determination have the necessary sensitivity and accuracy for
estimating water concentrations to 10 pCi/L (Blanchard, et al., 1985).
In 1984 California Department of Health Services (DHS) conducted an extensive investigation of
radioactivity in ground water in the community of Glen Avon. Four samples had levels greater
than 40 pCi/L. Forty-eight samples had uranium activity between 10 and 40 pCi/L. Eight
samples had less than 10 pCi/L. Apparently acidic ground water is responsible for mobilizing
naturally occurring uranium in the soil (DHS, 1985).
Wong, et al. (1999) studied the isotopic abundance ratios of natural uranium in selected
California groundwater. Representative samples from 102 groundwater locations throughout the
state were analysed for gross alpha by internal proportional counting, total uranium by laser
phosphorimetry and total uranium by inductively coupled plasma-mass spectrometry (ICPMS).
Selected samples (43) were analysed for isotopic abundances of 234U, 235U, and 238U. The average234U/238U activity ratio for the study was 1.32 ± 0.30 SD. The average activity to mass conversion
factor (specific activity) was 0.79 pCi/µg with a standard deviation of 0.10. The latter data set
from Wong et al. (1999) was analyzed using Microsoft Excel (Version 4) Crystal Ball (Version 4,
Decisioneering, Inc) and the normal distribution was found to best fit the data.
URANIUM in Drinking Water
California Public Health Goal (PHG) 3 August 2001
7/28/2019 Uranium 801
http://slidepdf.com/reader/full/uranium-801 11/37
Food
Because uranium is present in many soils and in some water supplies, it also occurs in many
foods. The use of phosphate fertilizers increases the uranium level in foods. The National
Council on Radiation Protection and Measurements (NCRPM) has estimated that humans take in
approximately the same amount of uranium in food as they do in drinking water (NCRPM, 1984).
This would suggest a relative source contribution (RSC) in the range of 40 to 60 percent for use
in calculating a PHG based on experiments in which total uranium exposure is measured.
METABOLISM AND PHARMACOKINETICS
Absorption
Inhalation is a minor route of entry for uranium into humans in the general population. The use
of water that contains uranium could expose an individual to uranium by dermal contact or
ingestion. Human skin absorption data are not available. Percutaneous absorption has beenreported as an effective route of penetration for soluble uranium compounds after application to
rat skin (De Rey et al., 1983). Single or daily applications were performed with uranium
compounds mixed with emulsion composed of Vaseline and water (De Rey et al., 1983). The
lowest administered dose (0.5 g/kg body weight) was orders of magnitude greater than could
result from exposure to the highest levels of uranium found in potential California drinking water
sources. Electron microscopy showed that the uranium penetrated into the intercellular space
between the horny and granular layers of the epidermis. Adverse effects such as purulence and
detachment of the horny layer were observed (De Rey et al., 1983).
Gastrointestinal absorption studies of uranium include single oral administration experiments of
soluble uranium compounds to rats, dogs, hamsters, baboons, and neonatal swine.
Gastrointestinal absorption is consistently lower in rats (less than 0.5 percent) than in other species studied (Wrenn et al., 1985). Fractional absorption in two-day old rats given uranyl
nitrate orally was estimated as 0.01 to 0.07 (ICRP, 1995). In feeding studies, it was found that
absorption was doubled in fasted rats, and increased 3.4 fold in iron-deficient rats (ATSDR,
1997).
Average absorption was reported to be 1.55 percent (0.83 to 2.3 percent) for seven dogs (Fish
et al., 1960). Gastrointestinal absorption for adult Syrian hamsters was calculated to be
0.77 percent (Harrison and Stather, 1981). UO2(NO3)2 given by gavage to one-day old miniature
swine at a dose of 1.5 to 2.0 mg uranium/kg showed absorption of at least 34.5 percent (Sullivan
and Gorham, 1982).
There is limited published information on gastrointestinal absorption of uranium in humans.
Hursh et al. (1969) studied oral uranium absorption in four male hospital patients (ages 56 to78 years). UO2(NO3)2 (10.8 mg) dissolved in 100 mL Coca Cola was ingested by each subject
after an overnight fast. Urine and fecal samples were collected and analyzed for uranium. The
four subjects showed uranium absorption of 0.3, 0.7, 1.1, and 3.3 percent. The authors suggest
that the data support an approximate 1 percent value for gastrointestinal absorption of uranium in
humans. Unabsorbed uranium passes into the feces. Daily excretion of uranium in urine
approximates the
URANIUM in Drinking Water
California Public Health Goal (PHG) 4 August 2001
7/28/2019 Uranium 801
http://slidepdf.com/reader/full/uranium-801 12/37
uranium absorbed from food and drink. Hursch and Spoor (1973) cited data indicating that
between 12 and 30 percent of uranium ingested in the normal diet is absorbed from the
gastrointestinal tract. The levels of natural uranium in food and water are lower than those used
experimentally.
In general, the smaller the amount of uranium ingested, the greater the fraction absorbed (Wrenn
et al., 1985). On the basis of a U.S. survey (Welford and Baird, 1967), it was estimated that theintake of uranium from the normal diet is 1.75 µg/day, and that the extent of gastrointestinal
absorption was 7.7 percent (Wrenn et al., 1985). Fisher et al. (1983) reported that uranium
absorption for three controls was 0.6 to 1 percent and for three retired uranium workers it was
0.55 to 1.6 percent. Wrenn et al. (1985) using data from three human studies and six animal
experiments, gave a best estimate of gastrointestinal absorption of uranium for adult humans at
environmental levels of uranium intake of 1.4 percent. From all the data sets available, Wrenn
et al. found a range of mean values of 0.3-7.8 percent of ingested uranium absorbed, with a grand
mean of 1.8 percent. No values for human neonates were given. Gastrointestinal absorption of 238Pu (plutonium) was about 100 times higher in neonatal rodents than in adult rodents and this
difference was 10 to 20 times greater in swine (Sullivan, 1980a,b). Absorption of uranium by
neonatal swine is higher than absorption of Pu from the gastrointestinal tract (Sullivan and
Gorham, 1982).Enhanced permeability of the intestine of the neonate facilitates passage from the nursing
mother’s milk to the neonate of macromolecules that are essential to immunity (Sullivan and
Gorham, 1982). Uranium may be associated with proteins during passage across the intestinal
mucosa. Absorption of iron and other heavy metals increases during lactation (Batey and
Gallagher, 1977; Bhattacharrya et al., 1981 and 1982; Kostial and Momcilovic, 1972). Given
these facts it is reasonable to assume that nursing infants and lactating mothers may have higher
gastrointestinal absorption of uranium than normal healthy adults. In its review of the literature,
U.S. EPA found values for gastrointestinal absorption of uranium in humans ranging from 1 to
30 percent (U.S. EPA, 1991a, b). For purposes of calculating the cancer risk of natural uranium
in drinking water, U.S. EPA chose 20 percent as the “best estimate” acknowledging that there is
“substantial uncertainty” associated with this number (U.S. EPA, 1991a, b).
The latest guidance from U.S. EPA on gastrointestinal absorption of uranium is found in Federal
Guidance 13 (U.S. EPA, 1999). This document gives gastrointestinal absorption fractions
(F1 values) for uranium of 2 percent for children aged 1 to 15 years, and 2 percent for adults.
The value listed for infants is 4 percent. U.S. EPA took these data from the International
Commission on Radiological Protection (ICRP, 1995).
Distribution and Excretion
Bicarbonate complexes are the chief form in which uranium is absorbed and transported within
the human body (Hodge, 1973). UO2(HCO3)2 in plasma is taken up by bone and filtered by the
glomeruli into the urine (Durbin and Wrenn, 1975). Most of the studies involving distribution
and excretion of uranium have been based on administration by intravenous or intraperitonealinjection, feeding or inhalation to animals. Stevens et al. (1980) measured the distribution,
retention and excretion of 233U in seven beagles injected intravenously with 2.8 µCi 233U per kg
body weight, and sacrificed at times ranging from 1 to 726 days post injection. Twenty-two
percent of the injected uranium was found in the kidney at one day post injection with high
concentrations localized in the proximal tubules and 7.7 percent of the uranium was found in the
skeleton. In a study with female mice exposed orally to uranyl nitrate hexahydrate at a dose of
462 mg/kg-day for 36 to 44 weeks, average uranium accumulation was 6 µg per pair of kidneys,
URANIUM in Drinking Water
California Public Health Goal (PHG) 5 August 2001
7/28/2019 Uranium 801
http://slidepdf.com/reader/full/uranium-801 13/37
46 µg/mg bone, and 0 to 0.5 µg/mg whole liver (Tannenbaum et al., 1951). Autoradiographic
studies in Sprague-Dawley rats showed that, in bone, uranium accumulates mainly in the
cancellous portion (trabeculae) and endosteum; whereas accumulation in the kidney occurs in the
cortex and in the corticomedullary junction (Tannenbaum et al., 1951).
The kidneys and bones are the principal sites of accumulation and toxic action of uranium
(Yuile, 1973; Stevens et al., 1980; Morrow et al., 1982). Following uranium administration,80 percent is excreted in urine and feces, 10 percent is deposited in the kidneys and the remaining
10 percent is deposited in the skeleton with negligible concentrations appearing in other tissues
(NRC, 1983). The skeleton is the major site of long-term storage of uranium (Wrenn and
Singh, 1982).
Several studies have reported the amount of uranium in the skeleton of persons with no known
occupational exposure to uranium. The average values ranged from 2.3 to 61.6 µg with a mean
value of 24.9 ± 22 µg uranium in 5,000 grams of bone, or 5.0 ± 4.4 µg/kg of bone (Wrenn et al.,
1985).
Kathren et al. (1989) reported uranium concentrations in tissues collected at autopsy from an
individual who worked as a "chemical operator" in a uranium processing plant for 20 years.
Deposition of uranium followed the pattern: skeleton > liver > kidney, with ratios of 63:2.8:1.The rank order of uranium content was in agreement with the observations by Fisenne and
Welford (1986) for New York City residents but in disagreement with the data reported for
the ICRP Reference Man (ICRP, 1975). The uranium order content in the Reference Man is
skeleton > kidney > lung > liver or 59, 7, 1, 0.45 µg, respectively. Recently, uranium in all
tissues of two whole bodies were measured and reported by the U.S. Transuranium and Uranium
Registries (USTUR) (Kathrin, 1998). The data showed lung > kidney > liver in one case and
kidney > lung > liver in the other. In both cases, pulmonary lymph nodes were an order of
magnitude higher in uranium concentration than other soft tissues. Such differences may be due
to sampling error or real differences in exposure history and individual variability.
In humans, most of the uranium (approximately 90 percent) is excreted in the feces; the
remainder is excreted in the urine (Wrenn et al., 1985). In rats, most of the absorbed dose leaves
the body within a few days in the urine (ATSDR, 1997); half is excreted in two to six days(Durbin and Wrenn, 1975), and 98 percent is excreted within seven days (Sullivan et al., 1986).
There is a fast and a slow phase of uranium excretion in humans and animals. The retention
half lives of uranium in bone and kidney are of most relevance. For bone, half-lives of 883 days
(Stevens et al., 1980), 180 and 360 days (Hursh and Spoor, 1973) and 800 days (Bernard, 1958)
have been reported. Retention half-lives for uranium in human kidney have been reported as
30 days (Bernard, 1958) and more recently as 6 days and 1,500 days for the fast and slow
components, respectively (ICRP, 1979). Wrenn et al. (1985) utilized a 15-day half-life (Hursh
and Spoor, 1973) and this value was incorporated into the uranium pharmacokinetic model.
Biokinetic Models
Biokinetic models mathematically characterize the movement, translocation, fate, deposition, and
excretion of a substance (e.g., uranium) in a living system. Such models predict where
substances go in the body, and how long they remain, which permits the calculation of internal
doses and risks to specific tissues and organs as well as the whole body (Kathrin, 1998). Such
models may be generally descriptive of the retention of radionuclides in the body with virtual
compartments or physiological where model compartments represent actual body organs and
tissues. In the dose-computation scheme of the ICRP, information on the biological behavior of
URANIUM in Drinking Water
California Public Health Goal (PHG) 6 August 2001
7/28/2019 Uranium 801
http://slidepdf.com/reader/full/uranium-801 14/37
radionuclides is contained in three main types of biokinetic model: a respiratory model, a
gastrointestinal (GI) model, and an element-specific systemic model.
The GI model is used to describe the movement of swallowed or endogenously secreted material
through the stomach and intestines. Element-specific GI absorption fractions (F1 values)
describe the rate and extent of absorption from the small intestine to blood (U.S. EPA, 1999).
The GI model developed by U.S. EPA (1999) has been used by ICRP for many years. The modeldivides the GI tract into four compartments: stomach (St); small intestine (SI); upper large
intestine (ULI); and lower large intestine (LLI), and assumes first-order transfer of material from
one compartment to the next. Absorption of ingested material to blood is assumed to occur only
in SI in terms of a fraction F1. The fraction (F1) of ingested material moves from SI to BLOOD
and the fraction 1-F1 moves from SI to ULI and eventually via excretion to FECES, in simple
mass-balance and rate equations.
The source of the uranium systemic biokinetic model used by U.S. EPA (1999) is ICRP (1995).
The ICRP’s physiologically based models for bone-seeking elements were developed within two
frameworks: one designed for the class of “calcium-like” or bone volume filling elements such as
strontium, radium, and lead; and the other designed for the class of “plutonium-like” or
bone-surface-seeking radionuclides such as thorium. The uranium model is of the calcium-like
type. The model incorporates a central blood Plasma and RBC compartment connected to tissuecompartments: Skeleton, Kidneys, Liver, and Other Soft Tissues, and to output compartments:
GI Tract and Feces, Urinary Bladder and Urine. The tissue compartments are subdivided into
sub-compartments of faster or slower turnover. The implementation of the model is described by
Leggett et al. (1993). A simpler five compartment exponential model has been proposed by
Fisher et al. (1991) based on an acute accidental occupational inhalation exposure of 31 workers
to UF6. In this model the fractional urinary excretion Y(t) is predicted as a function of time (in
days) after exposure. The excretion constants of the five exponential compartments correspond to
residence half-times of 0.25, 6, 26, 300, and 3,700 days in the lungs, kidneys, other soft tissues,
and two bone compartments, respectively.
TOXICOLOGY
Toxicological Effects in Animals
Numerous animal studies of the toxicity of uranium have been undertaken, beginning with the
Manhattan Project in the 1940s. These studies have been reviewed by Yuile (1973). More
recently, the toxicology of uranium in animals has been reviewed by Durbin and Wrenn (1975)
and by Wrenn et al. (1985).
Acute Toxicity
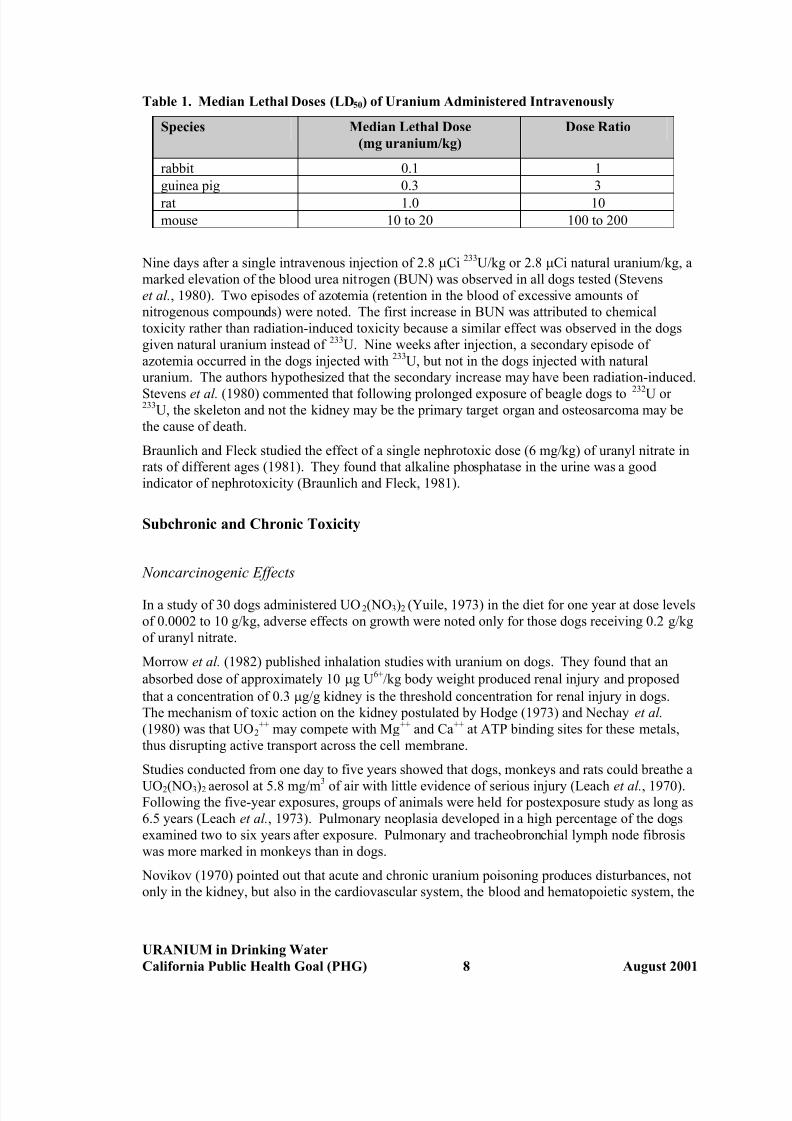
The acute oral toxicity of uranium compounds is low. There are large differences in sensitivity to
uranium among the species tested. The LD50s of intraperitoneal uranium nitrate ranged from
0.1 to 0.3 mg/kg in the rabbit and guinea pig to as much as 20 to 25 mg/kg in mice (Durbin and
Wrenn, 1975). The approximate lethal doses of UO2(NO3)2 administered intravenously to four
species are given in Table 1.
URANIUM in Drinking Water
California Public Health Goal (PHG) 7 August 2001
7/28/2019 Uranium 801
http://slidepdf.com/reader/full/uranium-801 15/37
Table 1. Median Lethal Doses (LD50) of Uranium Administered Intravenously
Species Median Lethal Dose
(mg uranium/kg)
Dose Ratio
rabbit 0.1 1
guinea pig 0.3 3
rat 1.0 10
mouse 10 to 20 100 to 200
Nine days after a single intravenous injection of 2.8 µCi 233U/kg or 2.8 µCi natural uranium/kg, a
marked elevation of the blood urea nitrogen (BUN) was observed in all dogs tested (Stevens
et al., 1980). Two episodes of azotemia (retention in the blood of excessive amounts of
nitrogenous compounds) were noted. The first increase in BUN was attributed to chemical
toxicity rather than radiation-induced toxicity because a similar effect was observed in the dogs
given natural uranium instead of 233U. Nine weeks after injection, a secondary episode of
azotemia occurred in the dogs injected with 233U, but not in the dogs injected with natural
uranium. The authors hypothesized that the secondary increase may have been radiation-induced.
Stevens et al. (1980) commented that following prolonged exposure of beagle dogs to 232U or 233U, the skeleton and not the kidney may be the primary target organ and osteosarcoma may be
the cause of death.
Braunlich and Fleck studied the effect of a single nephrotoxic dose (6 mg/kg) of uranyl nitrate in
rats of different ages (1981). They found that alkaline phosphatase in the urine was a good
indicator of nephrotoxicity (Braunlich and Fleck, 1981).
Subchronic and Chronic Toxicity
Noncarcinogenic Effects
In a study of 30 dogs administered UO2(NO3)2 (Yuile, 1973) in the diet for one year at dose levels
of 0.0002 to 10 g/kg, adverse effects on growth were noted only for those dogs receiving 0.2 g/kg
of uranyl nitrate.
Morrow et al. (1982) published inhalation studies with uranium on dogs. They found that an
absorbed dose of approximately 10 µg U6+/kg body weight produced renal injury and proposed
that a concentration of 0.3 µg/g kidney is the threshold concentration for renal injury in dogs.
The mechanism of toxic action on the kidney postulated by Hodge (1973) and Nechay et al.
(1980) was that UO2++ may compete with Mg++ and Ca++ at ATP binding sites for these metals,
thus disrupting active transport across the cell membrane.
Studies conducted from one day to five years showed that dogs, monkeys and rats could breathe a
UO2(NO3)2 aerosol at 5.8 mg/m3 of air with little evidence of serious injury (Leach et al., 1970).Following the five-year exposures, groups of animals were held for postexposure study as long as
6.5 years (Leach et al., 1973). Pulmonary neoplasia developed in a high percentage of the dogs
examined two to six years after exposure. Pulmonary and tracheobronchial lymph node fibrosis
was more marked in monkeys than in dogs.
Novikov (1970) pointed out that acute and chronic uranium poisoning produces disturbances, not
only in the kidney, but also in the cardiovascular system, the blood and hematopoietic system, the
URANIUM in Drinking Water
California Public Health Goal (PHG) 8 August 2001
7/28/2019 Uranium 801
http://slidepdf.com/reader/full/uranium-801 16/37
immune system, the thyroid, adrenal gland and liver, and in basal metabolism. Novikov (1970)
stated that the use of the uranium concentration in the kidney as the sole criterion of toxicity is
untenable because of toxicity in other organ systems. Novikov and Yudina (1970) examined the
effects of 0.02, 0.2 and 1.0 mg/kg of uranium administered orally for 12 months to rabbits. They
observed no changes in serum urea, creatinine and chloride levels. A dose of 1.0 mg/kg inhibited
nucleic acid metabolism in rabbit kidney and liver.
Gilman et al. (1998a) studied the toxic effects of uranium administered to rats in drinking water.
Following a 28-day range finding study, five groups of 15 male and 15 female weanling Sprague-
Dawley rats were exposed for 91 days to uranyl nitrate hexahydrate (UN) in drinking water at
0.96, 4.8, 24, 120, or 600 mg UN/L. A control group was given tap water with less than
0.001 mg U/L. No dose-related effects on hematological or biochemical parameters were seen.
Histopathological lesions were observed in the kidney and liver, in both males and females, in all
dose groups. Renal lesions of tubules (apical nuclear displacement and vesiculation, cytoplasmic
vacuolation, and dilation), glomeruli (capsular sclerosis), and interstitium (reticulin sclerosis and
lymphoid cuffing) were observed in the lowest exposure groups. However, these do not
generally increase in the higher dose groups. The authors identified a study LOAEL of 0.96 mg
UN/L drinking water, equivalent to average doses of 0.06 and 0.09 mg U/kg-d in male and female
rats, respectively.Gilman et al. (1998b) exposed male New Zealand White (NZW) rabbits for 91 days to 0.96, 4.8,
24, 120, or 600 mg UN/L in drinking water. Subsequently females were similarly exposed for
91 days to 4.8, 24, or 600 mg UN/L. No dose-related changes in hematological or biochemical
parameters were observed. Dose dependent effects were seen primarily in the kidney, where
changes in the renal tubules were characteristic of uranium toxicity. The authors identified a
study a lowest-observed-adverse-effect-level (LOAEL) of 0.96 mg UN/L in drinking water,
equivalent to an average dose in males of 0.05 mg U/kg-d. The reversibility of uranium kidney
toxicity was also investigated by Gilman et al. (1998c). Specific-pathogen free (SPF) male NZW
rabbits were exposed to 24 or 600 mg UN/L in drinking water for 91 days. Recovery periods
were 0, 8, 14, 45, or 91 days. Renal tubular injury with degenerative nuclear changes,
cytoplasmic vacuolation, and tubular dilation was seen in the high dose group, without consistent
resolution even after 91 days recovery.
Reproductive and developmental effects have been studied in rodents by several groups of
investigators. These studies are summarized in U.S. EPA’s drinking water criteria document
(U.S. EPA, 1991b). In general, uranium salts cause reproductive and developmental effects (e.g.,
embryolethality, malformations and testicular effects) only when administered at much higher
doses than those that would cause nephrotoxicity.
Carcinogenic Effects
Sarcomas resulted in rats injected with metallic uranium in the femoral marrow and in the chest
wall (Hueper et al., 1952). The authors were unable to determine whether the local tumors
induced by uranium were caused by metallocarcinogenic or radiocarcinogenic action. Alpha-emitting, bone-seeking radionuclides such as 232U, 233U and 226Ra have been shown to induce
bone tumors in rodents (U.S. EPA, 1991a, b). In general, ionizing radiation is regarded by
U.S. EPA as carcinogenic, mutagenic and teratogenic in animals and humans (U.S. EPA,
1991a, b).
URANIUM in Drinking Water
California Public Health Goal (PHG) 9 August 2001
7/28/2019 Uranium 801
http://slidepdf.com/reader/full/uranium-801 17/37
Toxicological Effects in Humans
Acute Toxicity
One case study reported two deaths of human beings accidentally exposed to uranium
hexafluoride and its breakdown products (uranyl fluoride and hydrofluoric acid) by inhalation
(ATSDR, 1997). The acute effects of this exposure were characteristic of hydrofluoric acid
exposure. No studies were found of acute effects to humans resulting from oral exposure to
uranium or uranium compounds. Levels of UO2(NO3)2 below 70 µg/kg administered
intravenously to six terminally ill patients (Hursh and Spoor, 1973) did not produce renal injury
as evidenced by changes in urinary proteins and catalase.
Chronic Toxicity
Noncarcinogenic Effects
The human data on uranium toxicity have been summarized by Hursh and Spoor (1973), Adams
and Spoor (1973) and by Boback (1975). Boback (1975) found no abnormal clinical chemistry
parameter effects in urine from uranium workers involved in exposure incidents that produced
urinary uranium concentrations up to 2.85 mg/L. Clarkson and Kench (1952) found low but
significantly elevated levels of amino acids in the urine of 12 workers exposed to uranium
hexafluoride.
Short-term follow-up studies in the 1940s and 50s of uranium workers exposed for several
months or years to high levels of soluble uranium compounds showed only transient kidney
damage (proteinuria) and no evidence of permanent effects (Hursh and Spoor, 1973).
Moss and McCurdy (1982) reported that increased β2-microglobulin (BMG) excretion in urinecould be correlated with uranium in drinking water at concentrations up to 0.7 mg/L. Under
normal conditions, only small amounts of protein are detected in the urine (Zamora, et al., 1998).
Excretion of low molecular weight proteins such as BMG may increase as a result of increased
plasma concentration or decreased tubular absorption (Zamora, et al., 1998). Even among those
individuals who drank water with the highest uranium concentration, there were no overt signs of
kidney dysfunction, nor histories of kidney ailments. No subtle changes in kidney function were
revealed by clinical chemistry. Wrenn and Singh (1981) concluded that the skeleton is the major
site of storage of uranium, but the kidney is the principal site of uranium injury after it once gains
entrance to the circulation. More recently, Thun et al. (1985) found significantly higher urinary
excretion of BMG and five amino acids in uranium workers than in a reference group. Increased
renal excretion was associated with length of exposure to soluble uranium. These data were
consistent with uranium-induced nephrotoxicity.Uranium has a pronounced tissue toxicity quite apart from its potential toxicity to the skeleton.
Chen et al. (1961) concluded that 238U would not pose a radiological hazard in humans because
the quantities necessary to deposit sufficient uranium in bone to cause radiation effects would be
far in excess of the uranium doses causing lethal renal damage. More recent analyses of the
potential carcinogenic effects of natural uranium due to ionizing radiation do not agree with this
conclusion (U.S. EPA, 1991a, b).
URANIUM in Drinking Water
California Public Health Goal (PHG) 10 August 2001
7/28/2019 Uranium 801
http://slidepdf.com/reader/full/uranium-801 18/37
Zamora et al. (1998) studied the effects of uranium exposure in 50 subjects in two Canadian
communities. The first had private wells supplied from a groundwater source whose uranium
content was well above the current Canadian drinking water guideline of 100 µg/L (Health and
Welfare Canada, 1996). The second community had drinking water that contained less than
1 µgU/L. The indicators of kidney function measured included glucose, creatinine, protein, and
BMG. The markers for cell toxicity were alkaline phosphatase (ALP), γ-glutamyl transferase
(GGT), lactate dehydrogenase (LDH), and N -acetyl-β-D-glucosaminidase (NAG). These appear
in the urine as a result of cell toxicity (Zamora, et al., 1998). Urinary glucose was found to be
significantly different and positively correlated with uranium intake for males, females and
pooled data. Increases in ALP and BMG were also observed to be correlated with uranium intake
for pooled data. In contrast, the indicators for glomerular injury, creatinine and protein, were not
significantly different in the two groups or correlated with uranium intake. The authors conclude
that chronic uranium intakes of 0.004 µg/kg-day to 9 µg/kg-day via drinking water affect kidney
function and that the proximal tubule is the site of action. The authors note that these effects may
represent a manifestation of subclinical toxicity which may not necessarily lead to kidney failure
or overt illness. It may, however be the first step in a process where chronic intake of elevated
levels of uranium may lead to progressive or irreversible renal injury.
In another small study, Health Canada (1998) investigated kidney effects of exposure to uraniumin people living in Kitigan Zibi, a town in Quebec. This town is supplied with drinking water
from wells that have uranium concentrations ranging from 10 to 1,418 ppb. Exposure to uranium
was estimated by measuring uranium excretion in the urine. Effects on kidney function were
determined (as in the previous study) by analyzing urine samples for a variety of parameters and
enzymes, including urine volume, urine specific gravity, GGT and BMG. In this study it was
found that for the pooled male and female data there was a statistically significant positive
correlation (p<0.01) between four parameters associated with tubule effects and uranium
excretion (see Table 2, below). These four parameters were urine volume, specific gravity, GGT
and BMG. Other parameters related to tubule effects (urinary glucose, ALP, LDH, and NAG) did
not show a statistically significant correlation with uranium excretion. Two parameters related to
glomerular effects (urinary creatinine and protein) were not correlated with uranium excretion in
a statistically significant manner. The data from this study are discussed further in the Dose-Response section below.
Carcinogenicity
A mortality study was conducted on 2,731 males employed at a uranium refining and processing
facility. Exposure and smoking habits were not analyzed. No deaths occurred from cancers of
the bone or thyroid, but deaths from cancer of the esophagus showed a statistically significant
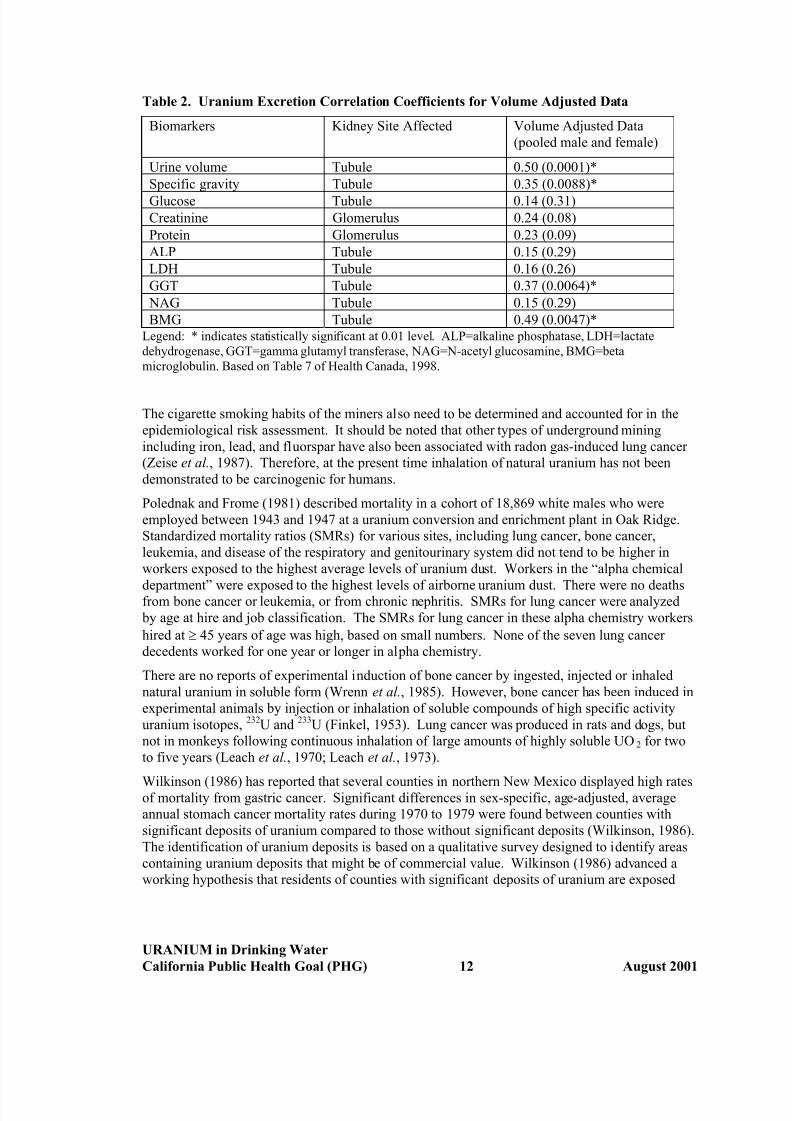
increase (Dupree, 1980).
In uranium miners, an increased mortality from lung cancer has been recognized for many years
(Pochin, 1985). Lung cancer has been related to the radiation dose to lung tissues. The dose to
the lung in uranium mines comes essentially from the radioactive decay products of theradioactive gas radon, rather than from uranium itself. The atmosphere in mines is likely to
contain materials such as arsenic and diesel fume polycyclic aromatic hydrocarbons, which have
significant carcinogenic effects. These would have confounding effects on any study of the
carcinogenicity of uranium itself.
URANIUM in Drinking Water
California Public Health Goal (PHG) 11 August 2001
7/28/2019 Uranium 801
http://slidepdf.com/reader/full/uranium-801 19/37
Table 2. Uranium Excretion Correlation Coefficients for Volume Adjusted Data
Biomarkers Kidney Site Affected Volume Adjusted Data
(pooled male and female)
Urine volume Tubule 0.50 (0.0001)*
Specific gravity Tubule 0.35 (0.0088)*
Glucose Tubule 0.14 (0.31)
Creatinine Glomerulus 0.24 (0.08)
Protein Glomerulus 0.23 (0.09)
ALP Tubule 0.15 (0.29)
LDH Tubule 0.16 (0.26)
GGT Tubule 0.37 (0.0064)*
NAG Tubule 0.15 (0.29)
BMG Tubule 0.49 (0.0047)*Legend: * indicates statistically significant at 0.01 level. ALP=alkaline phosphatase, LDH=lactate
dehydrogenase, GGT=gamma glutamyl transferase, NAG=N-acetyl glucosamine, BMG=beta
microglobulin. Based on Table 7 of Health Canada, 1998.
The cigarette smoking habits of the miners also need to be determined and accounted for in the
epidemiological risk assessment. It should be noted that other types of underground mining
including iron, lead, and fluorspar have also been associated with radon gas-induced lung cancer
(Zeise et al., 1987). Therefore, at the present time inhalation of natural uranium has not been
demonstrated to be carcinogenic for humans.
Polednak and Frome (1981) described mortality in a cohort of 18,869 white males who were
employed between 1943 and 1947 at a uranium conversion and enrichment plant in Oak Ridge.
Standardized mortality ratios (SMRs) for various sites, including lung cancer, bone cancer,
leukemia, and disease of the respiratory and genitourinary system did not tend to be higher in
workers exposed to the highest average levels of uranium dust. Workers in the “alpha chemical
department” were exposed to the highest levels of airborne uranium dust. There were no deathsfrom bone cancer or leukemia, or from chronic nephritis. SMRs for lung cancer were analyzed
by age at hire and job classification. The SMRs for lung cancer in these alpha chemistry workers
hired at ≥ 45 years of age was high, based on small numbers. None of the seven lung cancer
decedents worked for one year or longer in alpha chemistry.
There are no reports of experimental induction of bone cancer by ingested, injected or inhaled
natural uranium in soluble form (Wrenn et al., 1985). However, bone cancer has been induced in
experimental animals by injection or inhalation of soluble compounds of high specific activity
uranium isotopes, 232U and 233U (Finkel, 1953). Lung cancer was produced in rats and dogs, but
not in monkeys following continuous inhalation of large amounts of highly soluble UO2 for two
to five years (Leach et al., 1970; Leach et al., 1973).
Wilkinson (1986) has reported that several counties in northern New Mexico displayed high ratesof mortality from gastric cancer. Significant differences in sex-specific, age-adjusted, average
annual stomach cancer mortality rates during 1970 to 1979 were found between counties with
significant deposits of uranium compared to those without significant deposits (Wilkinson, 1986).
The identification of uranium deposits is based on a qualitative survey designed to identify areas
containing uranium deposits that might be of commercial value. Wilkinson (1986) advanced a
working hypothesis that residents of counties with significant deposits of uranium are exposed
URANIUM in Drinking Water
California Public Health Goal (PHG) 12 August 2001
7/28/2019 Uranium 801
http://slidepdf.com/reader/full/uranium-801 20/37
to higher levels of radionuclides such as radon and radon daughters than residents of counties
lacking the uranium deposits.
Genotoxic and Cytotoxic Effects
Uranium miners have been found to have increased frequency of chromosomal aberrations inhuman lymphocytes, but these have been thought to be due to radon or its radioisotope daughters
(Brandom et al., 1978; ATSDR, 1997). Other genotoxic effects have not been adequately tested
(ATSDR, 1997).
Blood lymphocyte cultures from two groups of workers exposed to uranium were examined for
asymmetric chromosomal aberrations and sister-chromatid exchanges (SCEs). Significant
increases were seen in both of these cytogenetic endpoints (Martin et al., 1991). These
investigators interpreted their results as evidence of clastogenic effects of uranium.
DOSE-RESPONSE ASSESSMENT
Noncarcinogenic Effects
The recently published studies of Gilman et al. (1998a-c) provide a basis for a dose response
assessment of noncarcinogenic effects caused by chronic uranium intake via drinking water. In
particular the 91-day study in Sprague-Dawley rats identifying a subchronic oral LOAEL of
0.06 mg/kg-d for renal and liver lesions in males appears to be a reliable basis. The histological
changes that were observed at this lowest dose did not generally increase in number at the higher
doses, so these data cannot be said to exhibit a dose-response relationship above the lowest dose
tested. This observation diminishes the value of these data as an indication of the beginning of
potentially pathological changes. A similar subchronic LOAEL of 0.05 mg/kg-d was observed in
male New Zealand White rabbits although the study was compromised by a microbial infection in
four animals.
Effects on human kidney function have been reported from quite low exposure levels of uranium
in drinking water (0.004 µg/kg-d to 9 µg/kg-d) suggesting a very broad dose-response range,
although the effects noted cannot be considered toxic as such (Zamora et al., 1998). One could
question the toxic significance of the histological lesions seen in the Gilman et al. studies and
while it is often difficult to identify clearly adverse effects in such studies, for the purpose of
determining a PHG, OEHHA considers such effects to be adverse albeit weak. Each human
kidney contains about one million nephrons, and considerable loss of these is required to reduce
kidney function or result in kidney disease. However, chronic subclinical kidney toxicity ought
to be considered as a continuum where certain levels of injury may compromise the body’s
resistance to other environmental insults.
The Zamora et al. (1998) kidney function study compared two communities in Canada based onhigh and low uranium intake in drinking water. The authors reported that daily uranium intake in
the high exposure group was associated with higher urinary glucose levels in males and females.
They also reported a positive correlation between individual total uranium intake and individual
urinary glucose levels for the high exposure group. Increases in ALP and BMG were also
correlated with uranium intake for pooled (male and female) data. The range of daily intake
associated with the "high exposure group" was from 0.004 to 9 µg/kg. The median
URANIUM in Drinking Water
California Public Health Goal (PHG) 13 August 2001
7/28/2019 Uranium 801
http://slidepdf.com/reader/full/uranium-801 21/37
high exposure intake in this study was 58 µg/day. Thus, the daily intake was on the order of
1 µg/kg at the median dose level.
As discussed above (page 11), the Health Canada (1998) study found four parameters related to
tubule effects to be positively correlated in a statistically significant manner with uranium
excretion. These four parameters are urine volume, urine specific gravity, GGT, and BMG. Of
these, the first two are of questionable specificity, i.e. they may or may not be related to effects of uranium on the kidney tubules. GGT and BMG are more reliable indicators of kidney tubule
effects of uranium exposure. Both of these data sets were analyzed by OEHHA using linear
regression statistics. Both data sets showed a high degree of correlation (r=0.4 for both data sets).
The BMG and GGT data sets were chosen to use for determination of a no-observed-effect-level
(NOEL) for kidney tubule effects caused by uranium in drinking water.
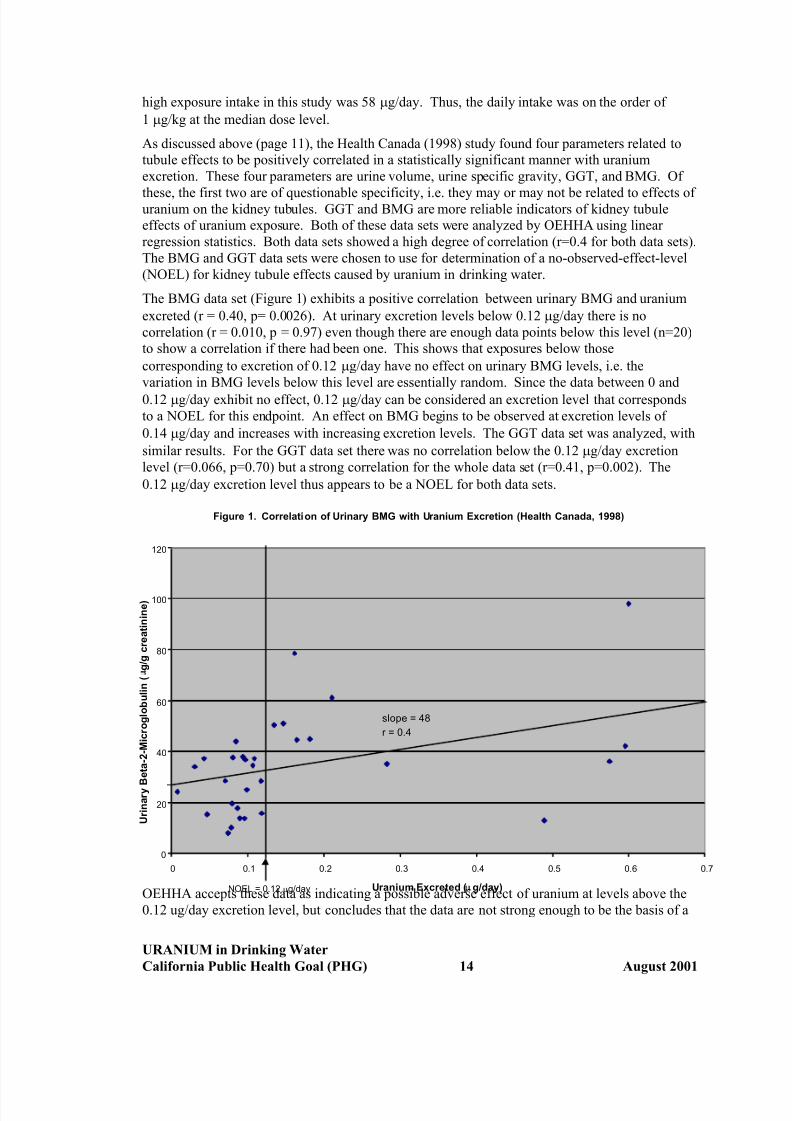
The BMG data set (Figure 1) exhibits a positive correlation between urinary BMG and uranium
excreted (r = 0.40, p= 0.0026). At urinary excretion levels below 0.12 µg/day there is no
correlation (r = 0.010, p = 0.97) even though there are enough data points below this level (n=20)
to show a correlation if there had been one. This shows that exposures below those
corresponding to excretion of 0.12 µg/day have no effect on urinary BMG levels, i.e. the
variation in BMG levels below this level are essentially random. Since the data between 0 and
0.12 µg/day exhibit no effect, 0.12 µg/day can be considered an excretion level that corresponds
to a NOEL for this endpoint. An effect on BMG begins to be observed at excretion levels of
0.14 µg/day and increases with increasing excretion levels. The GGT data set was analyzed, with
similar results. For the GGT data set there was no correlation below the 0.12 µg/day excretion
level (r=0.066, p=0.70) but a strong correlation for the whole data set (r=0.41, p=0.002). The
0.12 µg/day excretion level thus appears to be a NOEL for both data sets.
OEHHA accepts these data as indicating a possible adverse effect of uranium at levels above the
0.12 ug/day excretion level, but concludes that the data are not strong enough to be the basis of a
UN
Figure 1. Correlation of Urinary BMG with Uranium Excretion (Health Canada, 1998)
0
20
40
60
80
100
120
0 0.1 0.2 0.3 0.4 0.5 0.6 0.7
ranium Excreted (µg/day)
U r i n a r y B e t a - 2 - M i c r o g l o b u l i n (µ g / g c r e a t i n i n e )
OEL = 0.12 µg/day
slope = 48
r = 0.4
URANIUM in Drinking Water
California Public Health Goal (PHG) 14 August 2001
7/28/2019 Uranium 801
http://slidepdf.com/reader/full/uranium-801 22/37
PHG. These two small “ecological” studies demonstrate an association between several
parameters of kidney function and population exposures to increased uranium in drinking water,
but cannot demonstrate a cause and effect relationship. Nevertheless, the potential for kidney
effects at these low levels of uranium in drinking water should be considered in derivation of a
PHG.
Carcinogenic Effects
U.S. EPA has classified natural uranium as a Group A carcinogen (“human carcinogen based on
sufficient evidence from epidemiological studies”) because it is an emitter of ionizing radiation.
U.S. EPA classifies all emitters of ionizing radiation as Group A carcinogens. U.S. EPA
acknowledges that “studies using natural uranium do not provide direct evidence of carcinogenic
potential.” However, studies with radium and certain isotopes of uranium provide evidence for
the carcinogenicity of ionizing radiation in humans (U.S. EPA, 1991a, b). U.S. EPA also
considers agents emitting ionizing radiation to be mutagens and teratogens.
Mays et al. (1985) estimated the lifetime cancer risk of daily intake of uranium in drinking water
based on data from induction of skeletal cancers by radium isotopes. They estimated that
exposure of one million persons to 5.0 pCi per day from uranium isotopes in drinking water would be expected to result in 1.5 additional bone sarcomas. This is equivalent to a cancer risk
for uranium in drinking water of 6.0×10⁻⁷ per pCi/L (assuming consumption of two liters of water
per day). This is virtually identical to the U.S. EPA’s 1991 estimate.
More recently, U.S. EPA developed carcinogenic potencies or risk coefficients for over
100 radionuclides including six uranium isotopes (U.S. EPA, 1994, 1999). The risk coefficients
developed apply to an average member of the public in that estimates of risk are averaged over
the age and gender distributions of a hypothetical closed population with an unchanging gender
ratio whose survival functions and cancer mortality rates are based on the 1989-1991
U.S. decennial life table (NCHS, 1997) and U.S. cancer mortality data for the same period
(NCHS, 1992, 1993a, b). For each radionuclide and exposure route both mortality and morbidity
risk coefficients are provided. The five steps in computing the risk coefficients for internalexposure are as follows:
• Step 1 (Lifetime risk per unit absorbed dose at each age): Radiation risk models are used to
calculate gender-specific lifetime risks per unit of absorbed dose for 14 cancer sites.
• Step 2 (Absorbed dose rates as a function of time post-acute intake at each age): Age-
specific biokinetic models are used to calculate the time-dependent inventories of activity in
various regions of the body following an acute intake of a unit of radionuclide activity. Six
ages are used: 100 days and 1, 5, 10, 15, 20-25 years.
• Step 3 (Lifetime cancer risk per unit intake at each age): For each cancer site, the gender-
specific values of lifetime risk per unit absorbed dose received at each age (from the first
step) are used to convert the calculated absorbed dose rates to lifetime cancer risks for the
case of acute intake of one unit of activity at each age xi.
• Step 4 (Lifetime cancer risk for chronic intake): It is assumed that the concentration of the
radionuclide in the environmental medium remains constant and that all persons in the
population are exposed throughout their lifetimes.
• Step 5 (Average lifetime cancer risk per unit activity intake): Because a risk coefficient is
an expression of the radiogenic cancer risk per unit activity intake, the calculated lifetime
URANIUM in Drinking Water
California Public Health Goal (PHG) 15 August 2001
7/28/2019 Uranium 801
http://slidepdf.com/reader/full/uranium-801 23/37
cancer risk from chronic intake of the environmental medium must be divided by the
expected lifetime intake.
A more detailed explanation of these five steps is presented in the most recent U.S. EPA report
(U.S. EPA, 1999).
Analyses involving the risk coefficients should be limited to estimation of prospective risks in
large existing populations, rather than being applied to specific individuals. Also the risk coefficients may not be suitable for assessing the risk to an average individual in an age-specific
cohort. All computations of dose and risk were performed using DCAL, a comprehensive
biokinetics-dose-risk computational system designed for radiation dosimetry (U.S. EPA, 1999).
DCAL has been extensively tested and has been compared with several widely used solvers for
biokinetic models and systems of differential equations. DCAL was used by a task group of the
ICRP to derive or check the dose coefficients given in its series of documents on age-specific
doses to members of the public from the intake of radionuclides (e.g., ICRP, 1996).
The two most common uranium isotopes in drinking water are 234U and 238U with lifetime
mortality risk coefficients for exposure via tap water of 1.24×10⁻⁹ Bq-1 and 1.13×10⁻⁹ Bq-1,
respectively. Multiplying by 0.037 Bq/pCi converts these coefficients to lifetime risks of
4.6×10
-11
and 4.2×10
-11
per pCi. These risks from specific isotopes should be adjusted to net risk based on the isotope ratios actually found in drinking water, which can vary slightly from the
crustal abundance. Recent calculations of the relative abundance of 234U and 238U in California
groundwater (Wong et al., 1999) are based on sampling from 102 groundwater locations
throughout California, and analyses of total uranium by laser phosphorimetry and inductively
coupled plasma-mass spectrometry, plus gross alpha determinations by internal proportional
counting. Selected samples were also analyzed for uranium isotopic abundance by alpha
spectroscopy. There was good agreement among the different methods, yielding an average234U/238U ratio of 1.32 ± 0.3 (SD) (Wong et al., 1999). At this isotopic ratio, the combined risk
coefficient for uranium in California water is 4.4×10⁻¹¹ (pCi)-1. Assuming a lifetime to be
25,550 days (70 years) and daily water consumption to be 2 L, a unit risk of 2.3×10⁻⁶ (pCi/L)-1
can be calculated. The U.S. EPA risk coefficient incorporates a gastrointestinal uptake factor
(F1) of 0.02 (2 percent).
CALCULATION OF PHG
Noncarcinogenic Effects
We will calculate public-health protective concentrations (C) for noncarcinogenic endpoints,
using first the rat studies of Gilman et al. (1998a), then using the human data from Health Canada
(1998).
Calculations Based on Data from Rat Studies
First, using the data from Gilman et al. (1998a), a public health-protective concentration (C) for
uranium in drinking water (in mg/L) can be calculated following the general equation for
noncarcinogenic endpoints:
C = NOAEL or LOAEL x BW x RSC
UF x W
URANIUM in Drinking Water
California Public Health Goal (PHG) 16 August 2001
7/28/2019 Uranium 801
http://slidepdf.com/reader/full/uranium-801 24/37
where,
NOAEL or LOAEL = no-observed-adverse-effect-level or lowest-observed-adverse-effect-level
(LOAEL of 0.06 mg/kg-d for toxicity in rats evidenced by a variety of
kidney and liver histological lesions from Gilman et al., 1998a);
BW = body weight default for an adult human (70 kg);
RSC = relative source contribution of 40 percent (0.4);
UF = uncertainty factor of 3000: This includes a factor of 3 for LOAEL to
NOAEL assuming the histological lesions in the rat study are relatively
mild adverse effects; a factor of 10 for interindividual differences in
sensitivity to uranium toxicity; 10 for interspecies differences; and 10 for
extrapolation from a 91 day study to lifetime exposure; and
W = daily water consumption default for an adult (2 L/day).
Therefore,
C = 0.06 mg/kg-day x 70 kg x 0.4 = 0.00028 mg/L = 0.0003 mg/L = 0.3 ppb (rounded)
3000 x 2 L/day
The C value of 0.0003 mg/L (0.3 µg/L) is equivalent to approximately 0.24 pCi/L (based on a
specific activity of 0.79 pCi/µg).
Repeating the same calculation for a child:
C = NOAEL x BW x RSCUF x W
where,
NOAEL = same as for the adult calculation,
BW = an assumed default child’s body weight (10 kg),
RSC = relative source contribution of 40 percent (0.4 as for the adult),
UF = uncertainty factor of 3000 (as for the adult), and
W = daily water consumption for a child (1 L/day).
URANIUM in Drinking Water
California Public Health Goal (PHG) 17 August 2001
7/28/2019 Uranium 801
http://slidepdf.com/reader/full/uranium-801 25/37
Therefore,
C = 0.06 mg/kg-day x 10 kg x 0.4 = 0.00008 mg/L = 0.08 ppb.
3000 x 1 L/day
The health-protective concentration based on noncarcinogenic effects in children is0.00008 mg/L, equivalent to 0.063 pCi/L. This calculation is based on rat data that exhibited an
apparent LOAEL, but did not exhibit a positive dose-response relationship at doses above the
LOAEL.
Calculations Based on Data from Human Studies
The human data from Health Canada (1998) can be used to calculate a health protective value as
follows. The excretion NOEL of 0.12 µg/day from the Health Canada (1998) human study can
be used to calculate a C value for natural uranium in drinking water. If we assume that the
individuals are in equilibrium, the uranium excreted would equal the uranium intake multiplied
by the percentage absorbed. In its review of the literature, U.S. EPA found values for gastrointestinal absorption of uranium in humans ranging from 1 to 30 percent (U.S. EPA,
1991a,b). As discussed above in the section on absorption (page 3) the value for absorption
recommended by the U.S. EPA in Federal Guidance 13 (U.S. EPA, 1999) is 2 percent. Assuming
2 percent absorption, the NOEL would be 50 times the excretion NOEL of 0.12 µg/day, or
6.0 µg/day. This NOEL is expressed in µg/day, so body weight is not included in the equation.
C = NOEL
UF × 2 L/day
No RSC is included in the equation because the data are taken from an ecological human study
that directly compares drinking water exposures. Since this is a NOEL based on human data, theonly uncertainty factor needed is a factor of 10 for intra-human variability, i.e. to protect sensitive
individuals including children and individuals with subclinical kidney impairment. At these low
levels, only lifetime or very long exposures would be effective, so we can base the calculation on
adult water consumption (2 L/day). The equation thus becomes:
C = 6 µg/day = 0.3 µg/L or 0.3 ppb.
10 × 2 L/day
Because it involves less uncertainty (no interspecies extrapolation or long-term exposure
extrapolation), is specifically protective of the effects of concern in humans, and because theanimal data did not show a clear dose-response, the 0.3 ppb based on human data is the preferable
number to use for a health protective concentration based on noncarcinogenic effects to the
kidney. However, the nature of these data (small changes in urinary parameters in a small
ecologic study) would make this a relatively weak basis for determination of a PHG, compared to
the better-known carcinogenic effects of ionizing radiation. OEHHA therefore chooses to
establish the PHG for uranium based on its carcinogenic effects due to exposure to ionizing
radiation.
URANIUM in Drinking Water
California Public Health Goal (PHG) 18 August 2001
7/28/2019 Uranium 801
http://slidepdf.com/reader/full/uranium-801 26/37
Carcinogenic Effects.
As noted above under Dose/Response Assessment, the unit risk of uranium in California drinking
water is 2.3 × 10⁻⁶ (pCi/L)-1, based on default assumptions. Therefore the drinking water
concentration corresponding to negligible risk would be given by:
C = Risk = 1 x 10-6 = 0.43 pCi/L.
Unit Risk 2.3x10⁻⁶ (pCi/L)-1
This calculation and those above for noncarcinogenic health effects are based on point estimates
rather than distributions (i.e., a deterministic approach). Probabilistic or stochastic methods can
be used to predict a distribution of safe drinking water levels, thereby making use of the
information available concerning the distributions of risk factors, and clarifying the uncertainty
associated with the use of single point values. For example, an alternate probabilistic expression
for health protective concentrations with distributions represented by bold face symbols is as
follows:
C = Risk x 0.02 = pCi/L.
RC x L x F1 x W
where,
Risk = negligible lifetime individual risk of 10-6,
RC = risk coefficient of 4.4 x 10⁻¹¹ (pCi)-1 lifetime,
L = lifetime of 74 yr or 27,000 d/lifetime (rounded),
F1 = intestinal absorption fraction lognormal distribution (Wrenn et al., 1985), and
W = daily water intake in L/d lognormal distributions (Ershow and Cantor, 1989).
A variant of this relation employed separate distributions for body weight (BW) in kg and
specific water intake (WI) in L/kg-d with an assumed correlation of 0.5 (data not shown).
However, the simpler expression is preferred. The RC value was determined for F1 = 0.02 and
the F1 distribution adjusts this value based on the data of Wrenn et al. (1985) for variation in
intestinal uptake of uranyl nitrate (p 4). Similarly the data of Ershow and Cantor (1989) was used
to derive distributions of daily intake for total water and tap water. The distribution parameters
used in the analyses are shown in Table 3. The distributions are empirical but similar to modeled
distributions over the range of predicted distribution values, i.e., 10-90 percent (OEHHA, 1996).
URANIUM in Drinking Water
California Public Health Goal (PHG) 19 August 2001
7/28/2019 Uranium 801
http://slidepdf.com/reader/full/uranium-801 27/37
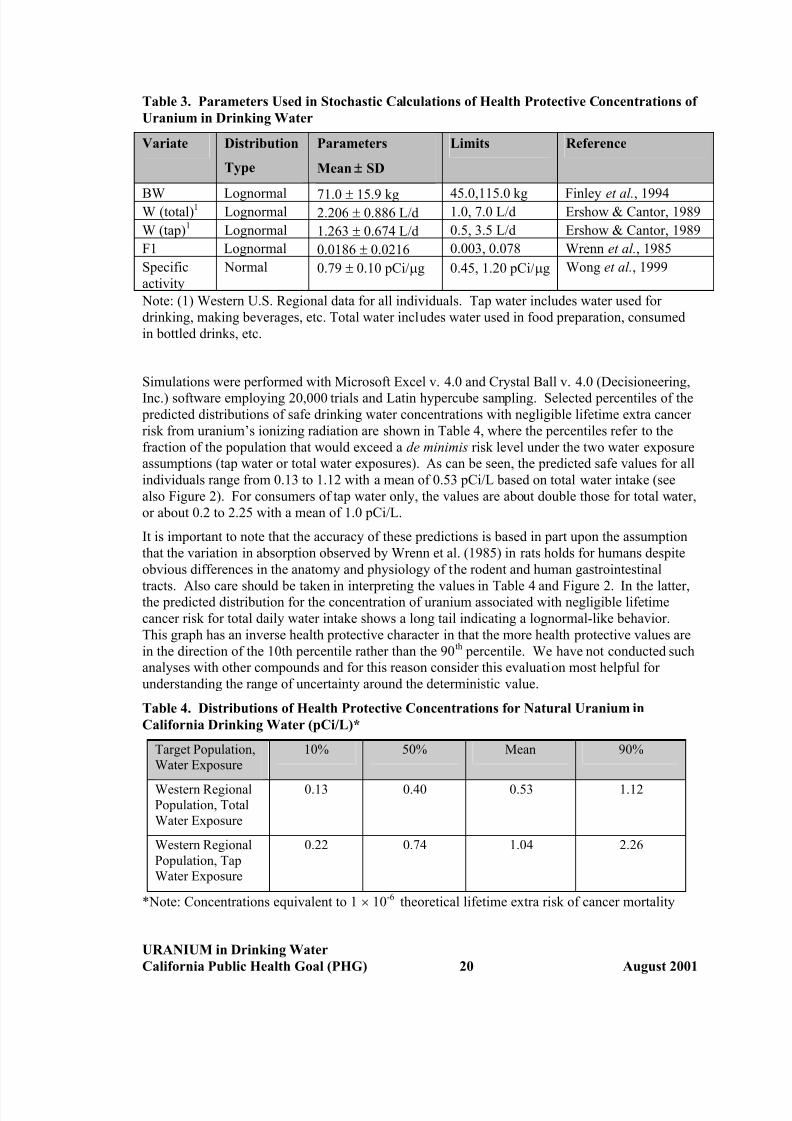
Table 3. Parameters Used in Stochastic Calculations of Health Protective Concentrations of
Uranium in Drinking Water
Variate Distribution
Type
Parameters
Mean ± SD
Limits Reference
BW Lognormal 71.0 ± 15.9 kg 45.0,115.0 kg Finley et al., 1994W (total)1 Lognormal 2.206 ± 0.886 L/d 1.0, 7.0 L/d Ershow & Cantor, 1989
W (tap)1 Lognormal 1.263 ± 0.674 L/d 0.5, 3.5 L/d Ershow & Cantor, 1989
F1 Lognormal 0.0186 ± 0.0216 0.003, 0.078 Wrenn et al., 1985
Specific
activity
Normal 0.79 ± 0.10 pCi/µg 0.45, 1.20 pCi/µg Wong et al., 1999
Note: (1) Western U.S. Regional data for all individuals. Tap water includes water used for
drinking, making beverages, etc. Total water includes water used in food preparation, consumed
in bottled drinks, etc.
Simulations were performed with Microsoft Excel v. 4.0 and Crystal Ball v. 4.0 (Decisioneering,
Inc.) software employing 20,000 trials and Latin hypercube sampling. Selected percentiles of the
predicted distributions of safe drinking water concentrations with negligible lifetime extra cancer
risk from uranium’s ionizing radiation are shown in Table 4, where the percentiles refer to the
fraction of the population that would exceed a de minimis risk level under the two water exposure
assumptions (tap water or total water exposures). As can be seen, the predicted safe values for all
individuals range from 0.13 to 1.12 with a mean of 0.53 pCi/L based on total water intake (see
also Figure 2). For consumers of tap water only, the values are about double those for total water,
or about 0.2 to 2.25 with a mean of 1.0 pCi/L.
It is important to note that the accuracy of these predictions is based in part upon the assumption
that the variation in absorption observed by Wrenn et al. (1985) in rats holds for humans despite
obvious differences in the anatomy and physiology of the rodent and human gastrointestinal
tracts. Also care should be taken in interpreting the values in Table 4 and Figure 2. In the latter,the predicted distribution for the concentration of uranium associated with negligible lifetime
cancer risk for total daily water intake shows a long tail indicating a lognormal-like behavior.
This graph has an inverse health protective character in that the more health protective values are
in the direction of the 10th percentile rather than the 90th percentile. We have not conducted such
analyses with other compounds and for this reason consider this evaluation most helpful for
understanding the range of uncertainty around the deterministic value.
Table 4. Distributions of Health Protective Concentrations for Natural Uranium in
California Drinking Water (pCi/L)*
Target Population,
Water Exposure
10% 50% Mean 90%
Western RegionalPopulation, Total
Water Exposure
0.13 0.40 0.53 1.12
Western Regional
Population, Tap
Water Exposure
0.22 0.74 1.04 2.26
*Note: Concentrations equivalent to 1 × 10⁻⁶ theoretical lifetime extra risk of cancer mortality
URANIUM in Drinking Water
California Public Health Goal (PHG) 20 August 2001
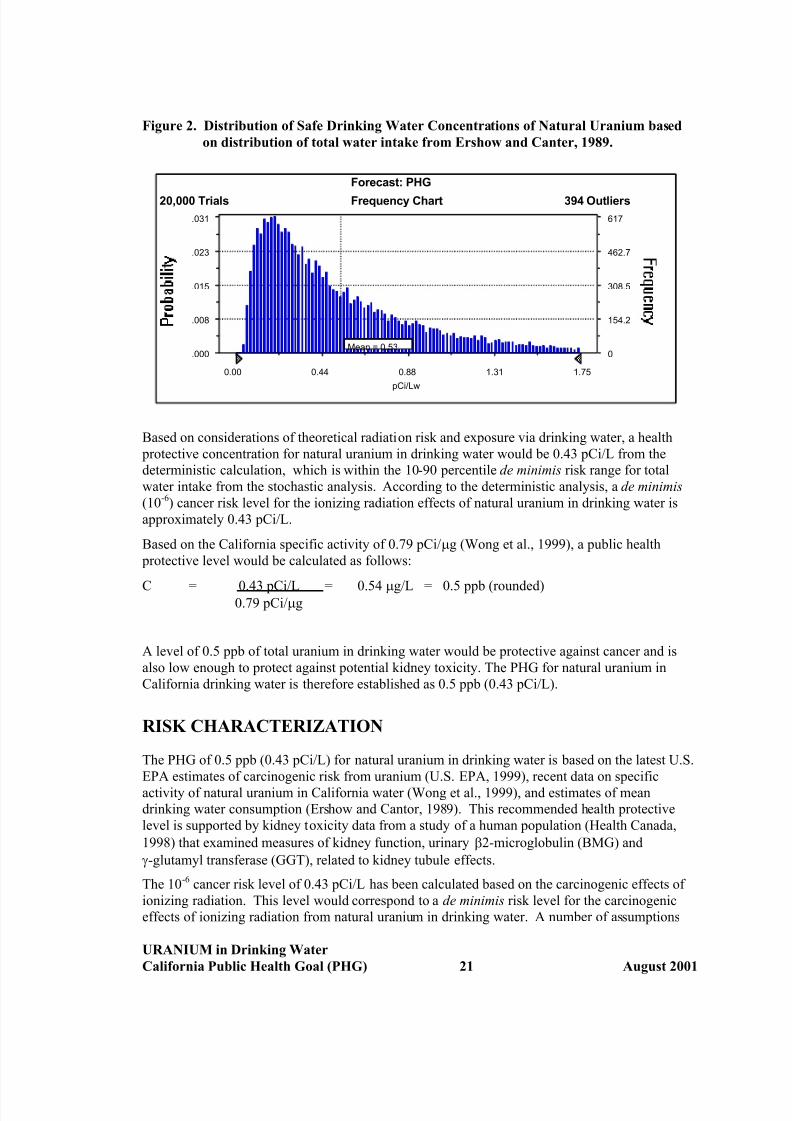
7/28/2019 Uranium 801
http://slidepdf.com/reader/full/uranium-801 28/37
Figure 2. Distribution of Safe Drinking Water Concentrations of Natural Uranium based
on distribution of total water intake from Ershow and Canter, 1989.
Frequency Chart
pCi/Lw
Mean = 0.53.000
.008
.015
.023
.031
0
154.2
308.5
462.7
617
0.00 0.44 0.88 1.31 1.75
20,000 Trials 394 Outliers
Forecast: PHG
Based on considerations of theoretical radiation risk and exposure via drinking water, a health
protective concentration for natural uranium in drinking water would be 0.43 pCi/L from the
deterministic calculation, which is within the 10-90 percentile de minimis risk range for total
water intake from the stochastic analysis. According to the deterministic analysis, a de minimis
(10-6) cancer risk level for the ionizing radiation effects of natural uranium in drinking water is
approximately 0.43 pCi/L.
Based on the California specific activity of 0.79 pCi/µg (Wong et al., 1999), a public health
protective level would be calculated as follows:
C = 0.43 pCi/L = 0.54 µg/L = 0.5 ppb (rounded)0.79 pCi/µg
A level of 0.5 ppb of total uranium in drinking water would be protective against cancer and is
also low enough to protect against potential kidney toxicity. The PHG for natural uranium in
California drinking water is therefore established as 0.5 ppb (0.43 pCi/L).
RISK CHARACTERIZATION
The PHG of 0.5 ppb (0.43 pCi/L) for natural uranium in drinking water is based on the latest U.S.
EPA estimates of carcinogenic risk from uranium (U.S. EPA, 1999), recent data on specific
activity of natural uranium in California water (Wong et al., 1999), and estimates of mean
drinking water consumption (Ershow and Cantor, 1989). This recommended health protective
level is supported by kidney toxicity data from a study of a human population (Health Canada,
1998) that examined measures of kidney function, urinary β2-microglobulin (BMG) and
γ-glutamyl transferase (GGT), related to kidney tubule effects.
The 10-6 cancer risk level of 0.43 pCi/L has been calculated based on the carcinogenic effects of
ionizing radiation. This level would correspond to a de minimis risk level for the carcinogenic
effects of ionizing radiation from natural uranium in drinking water. A number of assumptions
URANIUM in Drinking Water
California Public Health Goal (PHG) 21 August 2001
7/28/2019 Uranium 801
http://slidepdf.com/reader/full/uranium-801 29/37
were made in calculating this de minimis risk level. Each of these assumptions is a source of
uncertainty. It was assumed that ionizing radiation (particularly alpha particles) emitted by
natural uranium would be as carcinogenic as ionizing radiation emitted by more highly
radioactive substances including man-made isotopes of uranium. This assumption and
extrapolation is the source of some uncertainty. There are a number of studies indicating that the
radiogenic dose response may be nonlinear or linear-quadratic or that tumors develop more
slowly at low doses (e.g., Raabe et al., 1980; Billen, 1990; Makinodan and James, 1990; Cohen,1995, and Pollycove, 1998). U.S. EPA has characterized such effects in terms of a dose and dose
rate effectiveness factor (DDREF): e.g., a DDREF of three means the risk per unit dose observed
at high acute doses should be divided by three before being applied to low dose (dose rate)
conditions (U.S. EPA, 1999). With the possible exception of lung cancer, current scientific data
generally indicate DDREFs between one and three for human cancer induction. For uranium and
radionuclides emitting high-LET alpha radiation, the radiobiological results generally support a
linear nonthreshold dose response, except for a possible fall-off in effectiveness at high doses
(U.S. EPA, 1999). At this point it appears that the linear paradigm of radiogenic risk dose
response best satisfies the requirements of the PHG mandate with respect to waterborne natural
uranium at low levels. Other extrapolation methods are possible. It is noteworthy that Mays
et al. (1985) arrived at a similar estimate of the cancer potency of uranium, based on a different
methodology.
The direct toxic effects of uranium on the kidney are well established from both human and
animal studies. The recent Canadian studies help estimate a NOAEL for these effects in humans,
especially the report from Health Canada (1998). A particular strength of this study is its
correlations of urinary parameters with actual measurements of uranium excretion in urine. One
of the sources of uncertainty in this calculation has to do with whether the observed urinary
changes are truly an indicator of the beginning of an adverse effect, or whether this is just a
transient effect not related to adverse kidney effects. We are regarding this effect as an indicator
of an incipient change in kidney function that can lead ultimately to frankly adverse effects such
as breakdown of tubular function, although the data are not clear enough to utilize these
endpoints as the basis for the PHG. The BMG and GGT data are supported by the data for two
other parameters (urine volume and specific gravity) related to tubule effects in the same studythat also showed a positive correlation with uranium excretion. The kidney is a well-recognized
target organ for uranium toxicity, and effects on tubule function were observed in an earlier
human study (Zamora et al., 1998) as well as the histological effects noted in several animal
studies (Gilman et al., 1998 a-c).
Our PHG for uranium differs somewhat in concept from the MCLG as developed by U.S. EPA.
U.S. EPA uses the following procedure in promulgating MCLGs:
1. Group A and B carcinogens (i.e., strong evidence of carcinogenicity) MCLGs are set to zero,
2. Group C (i.e., limited evidence of carcinogenicity), either an RfD approach is used (as with a
noncarcinogen) but an additional UF of one to ten (usually ten) is applied to account for the
limited evidence of carcinogenicity, or a quantitative method (potency and low-dose
extrapolation) is used and the MCLG is set in the 10-5 to 10-6 cancer risk range,
3. Group D (i.e., inadequate or no animal evidence) an RfD approach is used to promulgate the
MCLG.
OEHHA has chosen to identify a de minimis risk level for Group A and B carcinogens in order to
provide more guidance for risk management than with the arbitrary value of zero. This is
particularly relevant for widespread natural contaminants like uranium for which decisions about
tolerable levels in drinking water must be made.
URANIUM in Drinking Water
California Public Health Goal (PHG) 22 August 2001
7/28/2019 Uranium 801
http://slidepdf.com/reader/full/uranium-801 30/37
An additional source of uncertainty in development of this PHG is intrahuman variability in
susceptibility to kidney effects. Individuals with compromised kidney function will of course be
more sensitive to the nephrotoxic effects of uranium. The humans studied by Zamora et al. are
the native American inhabitants of a Canadian village. Considering the small number of
individuals studied, their limited genetic diversity, and the lack of information on incidence of
renal diseases in this subpopulation, the extent to which they may encompass the variability of
the more diverse American population is unknown. In the calculation of a noncancer health- protective concentration, OEHHA has therefore used the standard default of ten to account for the
total potential variability. With this added factor, the inferred health protective level for kidney
toxicity would be half that for protection against effects due to radiation. However, we believe
the establishment of this concentration is too uncertain to provide a basis for the PHG. Similarly,
the animal data, as represented by the rat studies of Gilman et al. (1988a) would indicate a lower
health protective level only with the inclusion of large uncertainty factors. While extrapolation of
radiation risk to very low levels is also uncertain, OEHHA believes that a linear extrapolation is
prudent in this case.
Gastrointestinal absorption of uranium for humans was assumed to be 2.0 percent. The range of
values identified in the literature is 1 to 30 percent (U.S. EPA, 1991a, b). Actual gastrointestinal
absorption may vary from individual to individual. In the stochastic analysis described aboveOEHHA used the range of values from Wrenn et al. (1985) assuming a lognormal distribution,
specifically 1.86 ± 2.16 percent (range 0.3 to 7.8 percent).
Standard default assumptions used by both OEHHA and U.S. EPA include 70 kg body weight for
adults and two liters per day drinking water consumption. Actual body weights and drinking
water consumption vary over a wide range. In the stochastic analysis we incorporated a number
of water consumption distributions from U.S. national and western regional data sets published
by Ershow and Cantor (1989). The range of predicted safe concentrations (pCi/L) was
approximately an order of magnitude from the 10 th to the 90th percentiles. The PHG is close to
the mean of the predicted distribution based on total water consumption. It should be noted that
the stochastic analysis employed exposure variates only since OEHHA currently has no proposed
methodology for addressing the uncertainty in dose response mentioned above. The use of
“average” values for body weight and drinking water consumption can be justified under theassumption that with longer-term exposures, average daily doses tend to migrate toward the
mean.
Ionizing radiation has been conclusively shown to be carcinogenic in humans, therefore
U.S. EPA classifies all emitters of ionizing radiation as Class A carcinogens. U.S. EPA also
considers agents emitting ionizing radiation to be mutagens and teratogens. OEHHA concurs
with these conclusions. There can be little doubt that high levels of natural uranium in drinking
water would present cancer and other risks to humans who consume such water over a long
period of time. The estimated PHG of 0.5 ppb (0.43 pCi/L) is considered to provide a de minimis
risk based on the ionizing radiation emitted by natural uranium. It should also protect the
population, including sensitive groups, against all non-cancer effects of uranium.
OTHER STANDARDS AND REGULATORY LEVELS
U.S. EPA has promulgated a final rule for uranium that establishes an MCL of 30 ppb (or
30 pCi/L) (U.S. EPA, 2000). The MCLG of 0 ppb for uranium has been confirmed, based on their
classification of it as a known human carcinogen (Carcinogen Group A) (U.S. EPA, 1991a). The
calculation of the U.S. EPA MCL assumes a uranium specific activity of about 1 pCi/µg, based
on a new survey (U.S. EPA, 2000). According to the U.S. EPA’s evaluation, the MCL level
URANIUM in Drinking Water
California Public Health Goal (PHG) 23 August 2001
7/28/2019 Uranium 801
http://slidepdf.com/reader/full/uranium-801 31/37
would “ corresponds to a cancer risk greater than 1x10⁻⁵. Economic and technical feasibility were
considered in arriving at this proposed MCL. U.S. EPA concludes that the feasible level is 20
µg/L to protect against kidney toxicity, but chose the higher level based on economic
considerations, which they concluded would also be protective.
The State of California adopted an MCL of 20 pCi/L for natural uranium based on kidney toxicity
to adults (Lam et al., 1994; DHS, 1987). This State MCL was based on a risk assessment whichidentified Novikov and Yudina (1970) as the key study. However, the more recent studies
(Gilman et al., 1998a-c; Zamora et al ., 1998; Health Canada, 1998) indicate that there is some
potential for kidney effects at this level, in our opinion.
In the earlier review by the National Research Council (NRC, 1983), a suggested no-adverse-
response-level (SNARL) in drinking water for chronic exposure of 35 ppb (23 pCi/L, based on
the equilibrium specific activity of 0.67 pCi/µg), was based on non-carcinogenic effects (weight
loss and kidney effects) in a one-year feeding study in dogs (Maynard and Hodge, 1949). The
National Workshop on Radioactivity in Drinking Water recommended that the limiting
concentration for natural uranium in drinking water should be 100 ppb (67 pCi/L) (Wrenn et al.,
1985).
URANIUM in Drinking Water
California Public Health Goal (PHG) 24 August 2001
7/28/2019 Uranium 801
http://slidepdf.com/reader/full/uranium-801 32/37
REFERENCES
Adams, N., Spoor, N.L. (1974). Kidney and bone retention functions in the human metabolism
of uranium. Phys. Med. Biol. 19, 460-471.
ATSDR. (1997). Toxicological Profile for Uranium. Draft for Public Comment. Agency for Toxic Substances and Disease Registry, CDC, Atlanta, Georgia.
Batey, R., Gallagher, N. (1977). Effect of iron and hysterectomy on iron absorption and
distribution in pregnant mice. Amer. J. Physiol. 232, 57-61.
Bhattacharrya, M.H., Whelton, B.D., Peterson, D.P. (1981). Gastrointestinal absorption of
cadmium in mice during gestation and lactation. I. Short-term exposure studies. Toxicol. Appl.
Pharmacol. 61, 335-342.
Billen, D. (1990). Spontaneous DNA damage and its significance for the “negligible dose”
controversy in radiation protection. Rad. Res. 124, 242-245.
Blanchard, R.L., Hahme, R.M.A., Kahn, B., McCurdy, D., Mellor, R.A., Moore, W.S., Sedlet, J.,
Shittaker, E. (1985). Radiological sampling and analytical methods for national primarydrinking water regulations. Health Phys. 48, 587-600.
Boback, M.W. (1975). A review of uranium excretion and clinical urinalysis data in accidental
exposure cases. In: Conference on Occupational Health Experience with Uranium. Edited by
M.E. Wrenn. Arlington, Virginia. ERDA 93, 225-243.
Brandom, W.F., Saccomanno, G., Archer, V.E. (1978). Chromosome aberrations as a biological
dose-response indicator of radiation exposure in uranium miners. Rad. Res. 76, 159-171.
Braunlich, H., Fleck, C. (1981). Urinary enzyme excretion as an indicator of nephrotoxicity in
dependence on age. Exp. Pathol . 20, 182-187.
Chen, P.C., Terepka, A.R., Hodge, H.C. (1961). The pharmacology and toxicology of bone
seekers. In: Annual Review of Pharmacology. Edited by Cutting, W.C., Dreisbach, R.H.,Elliott, H.W. pp. 369-396.
Clarkson, T.W., Kench, J.E. (1952). Urinary excretion of amino acids by men absorbing heavy
metals. Biochem. J. 62, 361-371.
Cohen, B.L. (1995). Test of the linear-no threshold theory of radiation carcinogenesis for
inhaled radon. Health Phys. 68, 157-174.
Cothern, C.R., and Lappenbusch, W.L. (1983). Occurrence of uranium in drinking water in the
U.S. Health Phys. 45, 89-100.
Cothern, C.R., Lappenbusch, W.L. (1986). Drinking water contribution to natural background
radiation. Health Phys. 50, 33-47.
De Rey, B.M., Lanfranchi, H.E., Cabrini, R.L. (1983). Percutaneous absorption of uranium
compounds. Environ. Res. 30, 480-491.
DHS (1985). Report on Radioactivity at the Stringfellow site and in the Community of Glen
Avon. California Department of Health Services, Sacramento, California.
DHS (1987). Proposed Maximum Contaminant Level, Uranium. California Department of
Health Services, Hazard Evaluation Section, Berkeley, California, currently Pesticide and
URANIUM in Drinking Water
California Public Health Goal (PHG) 25 August 2001
7/28/2019 Uranium 801
http://slidepdf.com/reader/full/uranium-801 33/37
Environmental Toxicology Section, Office of Environmental Health Hazard Assessment,
California Environmental Protection Agency, Oakland, California.
Dupree, E.A. (1980). Mortality among workers at a uranium refining and processing plant. Am.
J. Epidemiol. 112, 446.
Durbin, P.W., Wrenn, M.E. (1975). Metabolism and effects of uranium in animals. In:
Conference on Occupational Health Experience with Uranium. Edited by M.E. Wrenn. ERDA93, 67-129.
Ershow A.G., Cantor, K.P. (1989). Total Water and Tapwater Intake in the United States:
Population-Based Estimates of Quantities and Sources. Life Sciences Research Office,
Federation of American Societies for Experimental Biology, Bethesda, Maryland.
Finkel, M.P. (1953). Relative biological effectiveness of radium and other alpha emitters in CF
No. 1 female mice. Proc. Soc. Exptl. Biol. Med. 83, 494-498.
Finley, B., Proctor, D., Scott, P., Harrington, N., Paustenbach, D., Price, P. (1994).
Recommended distributions for exposure factors frequently used in health risk assessment. Risk
Anal . 14, 533-553.
Fisenne, I.M., Welford, G.A. (1986). Natural U concentrations in soft tissues and bone of NewYork City residents. Health Phys. 50, 739-746.
Fish, B.R., Payne, J.A., Thompson, J.L. (1960). Ingestion of uranium compounds. In: Oak
Ridge National Laboratory Health Physics Division Annual Report . Oak Ridge National
Laboratory. Oak Ridge, Tennessee. ORNL-2994, 269-272.
Fisher, D.R., Jackson, P.O., Brodaczynsk, G.G., Sherpelz, R.I. (1983). Levels of 234U, 238U, and230Th in excreta of uranium mill crushermen. Health Phys. 45, 617-630.
Fisher, D.R., Kathrin, R.L., Swint, M.J. (1991). Modified biokinetic model for uranium from
analysis of acute exposure to UF6. Health Phys. 60, 335-342.
Gilman, A.P., Villeneuve, D.C., Secours, V.E., Yagminas, A.P., Tracy, B.L., Quinn, J.M.,
Valli, V.E., Willes, R.J., Moss, M.A. (1998a). Uranyl nitrate: 28-day and 91-day toxicity studiesin the Sprague-Dawley rat. Toxicol. Sci. 41, 117-128.
Gilman, A.P., Villeneuve, D.C., Secours, V.E., Yagminas, A.P., Tracy, B.L., Quinn, J.M.,
Valli, V.E., Moss, M.A. (1998b). Uranyl nitrate: 91-day toxicity studies in the New Zealand
White rabbit. Toxicol. Sci. 41, 129-137.
Gilman, A.P., Moss, M.A., Villeneuve, D.C., Secours, V.E., Yagminas, A.P., Tracy, B.L., Quinn,
J.M., Long, G., Valli, V.E. (1998c). Uranyl nitrate: 91-day exposure and recovery studies in the
male New Zealand White rabbit. Toxicol. Sci. 41, 138-151.
Harrison, J.D., Stather, J.W. (1981). The gastrointestinal absorption of protoactinium, uranium
and neptunium in the hamster. Rad. Res. 88, 47-55.
Health Canada (1998). Assessment of the effect on kidney function of long-term ingestion of uranium in drinking water by the Kitigan Zibi Community. Report to Medical Services Branch
on a Study Conducted by the Radiation Protection Bureau, Health Protection Branch.
Hess, C.T., Michel, J., Horton, T.R., Prichard, H.M. and Conigilio, W.A. (1985). The
occurrence of radioactivity in public water supplies in the United States. Health Phys. 48,
553-586.
Hodge, H.C., Stannard, J.V., Hursh, J.B., eds. (1973) Uranium, plutonium, transplutonic
elements. In: Handbook of Experimental Pharmacology Berlin. Springer-Verlag.
URANIUM in Drinking Water
California Public Health Goal (PHG) 26 August 2001
7/28/2019 Uranium 801
http://slidepdf.com/reader/full/uranium-801 34/37
Hueper, W.C., Zuefle, J.H., Link, A.M., Johnson, M.G. (1952). Experimental studies in metal
cancerigenesis. II. Experimental uranium cancers in rats. J. National Cancer Institute 13,
291-01.
Hursh, J.B., Neuman, W.F., Toribara, T., Wilson, H., Waterhouse, C. (1969). Oral ingestion of
uranium by man. Health Phys. 17, 619-621.
Hursh, J.B., Spoor, N.L. (1973). Uranium data on man. In: Handbook of Experimental Pharmacology. Edited by Hodge, H.C., Stannard, J.N., Hursh, J.B. Berlin. Springer-Verlag. 36,
197-239.
ICRP (1975). Report of the Task Group on Reference Man. ICRP Publication 23. International
Commission on Radiological Protection, Pergamon Press, Oxford.
ICRP (1995). Age-Dependent Doses to Members of the Public from Intake of Radionuclides,
Part 3. ICRP Publication 69. International Commission on Radiological Protection, Pergamon
Press, Oxford.
ICRP (1996). Age-Dependent Doses to Members of the Public from Intake of Radionuclides,
Part 5. Compilation of Ingestion and Inhalation Dose Coefficients. ICRP Publication 72.
International Commission on Radiological Protection, Pergamon Press, Oxford.Kathrin, R.L. (1989). Uranium in the tissues of an occupationally exposed individual. Health
Phys. 57, 17-21.
Kathrin, R.L. (1998). Uranium biokinetics, modeling and human tissue studies. Uranium Issues
Workshop, Washington, DC, June 23-24.
Kostial, K., Momcilovic, B. (1972). The effect of lactation on the absorption of 203Pb and 47Ca in
rats. Health Phys. 23, 383-384.
Lam, R.H.F., Brown, J.P., Fan, A.M., Milea, A. (1994). Chemicals in California drinking water:
source contaminants, risk assessment, risk management, and regulatory standards. J. Hazard.
Materials 39, 173-192.
Leach, L.J., Maynard, E.A., Hodge, H.C., Scott, J.K., Yuile, C.L., Sylvester, G.E., Wilson, H.B.(1970). A five-year inhalation study with natural uranium dioxide dust: 1. Retention and
biologic effect in the monkey, dog, and rat. Health Phys. 18, 599-612.
Leach, L.J., Yuile, C.L., Hodge, H.C., Sylvester, G.E., Wilson, H.B. (1973). A five year
inhalation study with natural uranium dioxide dust: II. Postexposure retention and biologic
effects in the monkey, dog, and rat. Health Phys. 25, 239-258.
Leggett R.W., Eckerman, K.F., Williams L.R. (1993). An elementary method for implementing
complex biokinetic models. Health Phys. 64, 260-278.
Makinodan, T., James, S.J. (1990). T cell potentiation by low dose ionizing radiation: Possible
mechanisms. Health Phys. 59, 29-34.
Martin, F., Earl, R., Tawn, E.J. (1991). A cytogenetic study of men occupationally exposed touranium. Br. J. Ind. Med. 48, 98-102.
URANIUM in Drinking Water
California Public Health Goal (PHG) 27 August 2001
7/28/2019 Uranium 801
http://slidepdf.com/reader/full/uranium-801 35/37
Maynard, E.A., Hodge, H.C. (1949). Studies of the toxicity of various uranium compounds
when fed to experimental animals. Pp. 309 to 376 in Voegtlin, C. and Hodge, H.C. eds.,
Pharmacology and Toxicology of Uranium Compounds. National Nuclear Energy Series,
Division VI, Vol. 1. McGraw-Hill, New York.
Mays, C.W., Rowland, R.E., Stehney, A.F. (1985). Cancer risk from the lifetime intake of Ra
and U isotopes. Health Phys. 48, 635-647.Morrow, P., Gelein, R., Beiter, H., Scott, J., Picano, J., Yuile, C. (1982). Inhalation and
intravenous studies of UF6/UO2F2 in dogs. Health Phys. 43, 859-873.
Moss, M.A., McCurdy, R.F. (1982). Clinical study of a population exposed to excessive levels
of uranium in drinking water . Annals R.C.P.S.C . 15, 4 (abstract).
NCHS (1992). Vital Statistics Mortality Data, Detail, 1989. NTIS:PB92-504554.
U.S. Department of Health and Human Services, Public Health Service, National Center for
Health Statistics, Hyattsville, Maryland.
NCHS (1993a). Vital Statistics Mortality Data, Detail, 1990. NTIS: PB93-504777.
U.S. Department of Health and Human Services, Public Health Service, National Center for
Health Statistics, Hyattsville, Maryland. NCHS (1993b). Vital Statistics Mortality Data, Detail, 1991. NTIS: PB93-506889.
U.S. Department of Health and Human Services, Public Health Service, National Center for
Health Statistics, Hyattsville, Maryland.
NCHS (1997). U.S. Decennial Life Tables for 1989-91. Vol. 1, No. 1. DCDHS, PHS-98-1150-1.
National Center for Health Statistics: United States Life Tables. Public Health Service,
Washington, DC.
NCRPM (1984). Exposure from uranium series with emphasis on radon and its daughters.
National Council on Radiation Protection and Measurements NCRPM Report No. 77. Bethesda,
Maryland.
Nechay, B.R., Thompson, J.D., Saunders, J.P. (1980). Inhibition by uranyl nitrate of adenosine
triphosphatase derived from animal and human tissues. Toxicol. Appl. Pharmacol . 53, 410-419.
NRC. (1983). “Uranium.” In: Drinking Water and Health. Volume 5. National Research
Council Washington, DC, pp. 90-97.
Novikov, Y.V. (1970). The hygienic standard for natural uranium in water. Hyg. Sanit .
35, 225-261.
Novikov, Y.V., Yudina, T.V. (1970). Data on biological effect of small amounts of natural
uranium in water. Hyg. Sanit . 35, 63-71.
OEHHA. (1996). Exposure Assessment and Stochastic Analysis. Draft Technical Support
Document. Office of Environmental Health Hazard Assessment, California Environmental
Protection Agency, Sacramento, California.
Pochin, E.E. (1985). Radiation carcinogenesis. In: Epidemiology and Quantitation of
Environmental Risk in Humans from Radiation and Other Agents. Edited by Castellani, A.
NATO ASI Series, Life Science, Volume 96. Plenum Press, New York, pp. 1-16.
Polednak, A.P., Frome, E.L. (1981). Mortality among men employed between 1943 and 1947 at
a uranium processing plant. J. Occupational Medicine 23, 169-178.
Pollycove, M. (1998). Nonlinearity of radiation health effects. Environ. Health Perspect .
106(Suppl 1), 363-368.
URANIUM in Drinking Water
California Public Health Goal (PHG) 28 August 2001
7/28/2019 Uranium 801
http://slidepdf.com/reader/full/uranium-801 36/37
Raabe, O.G., Book, S.A., Parks, N.J. (1980). Bone cancer from radium: Canine dose response
explains data for mice and humans. Science 208, 61-64.
Smith, R.G. and Foulkes, C.E. (1985). The influence of diet on intestinal absorption of cadmium
in the rat. Yug. Phys. Pharmacol. Acta. (Suppl. Proceeding).
Stevens, W., Bruenger, F.W., Atherton, D.R., Smith, J.M., Taylor, G.N. (1980). The distribution
and retention of hexavalent 233U in the beagle. Rad. Res. 83, 109-126.
Stokinger, H.E. (1981). “The Metals”, Chapter 29. In: Patty’s Industrial Hygiene and
Toxicology. 3rd Edition, Volume 2A. Ch. 29. Edited by Clayton, G.D., Clayton, F.E. Wiley
and Sons, New York.
Sullivan, M.F. and Gorham, L.S. (1982). Further studies on the absorption of actinide elements
from the gastrointestinal tract of neonatal animals. Health Phys. 43, 509-519.
Sullivan, M.F. (1980a). Absorption of actinide elements from the gastrointestinal tract of rats,
guinea pigs, and dogs. Health Phys. 38, 159-171.
Sullivan, M.F. (1980b). Absorption of actinide elements from the gastrointestinal tract of
neonatal animals. Health Phys. 38, 173-185.
Sullivan, M.F., Ruemmler, P.S., Ryan, J.L., Buschbom, R.L. (1986). Influence of oxidizing or
reducing agents on gastrointestinal absorption of uranium, plutonium, americium, curium, and
promethium by rats. Health Phys. 50, 223-232.
Tannenbaum, A., Silverstone, H., Koziol, J. (1951). Tracer studies of the distribution and
excretion of uranium in mice, rats, and dogs. In: Tannenbaum, A., ed. Toxicology of Uranium.
New York, New York: McGraw-Hill, pp. 128-181.
U.S. EPA. (1976). National Interim Primary Drinking Water Regulations. EPA-570/g-76-003.
U.S. Environmental Protection Agency, Washington, DC.
U.S. EPA. (1985). Criteria Document for Uranium in Drinking Water. U.S. Environmental
Protection Agency, Washington DC.
U.S. EPA. (1986). Environmental Radiation Data. Report 42. April-June 1985. NTIS
PB166311.
U.S. EPA. (1991a). National Primary Drinking Water Regulations; Radionuclides; Proposed
Rule. Federal Register 56, No. 138, 33050-33127. Thursday, July 18, 1991.
U.S. EPA. (1991b). Drinking Water Criteria Document for Uranium (Draft). U.S. Environmental
Protection Agency, Washington, DC.
U.S. EPA. (1994). Estimating Radiogenic Cancer Risks. EPA 402-R-93-076.
U.S. Environmental Protection Agency, Washington, DC.
U.S. EPA. (1999). Cancer Risk Coefficients for Environmental Exposures to Radionuclides.
Federal Guidance Report No. 13, EPA 402-R-99-001. U.S. Environmental Protection Agency,
September 1999, Washington, D.C.
U.S. EPA. (2000). National Primary Drinking Water Regulations; Radionuclides; Final Rule,
40 CFR Parts 9, 141, and 142. Federal Register 65, No. 236, 76708-76753. December 7, 2000
Welford, G.A., Baird, R. (1967). Uranium levels in human diet and biological materials. Health
Phys. 13, 1321-1324.
Wilkinson, J.S. (1986). Gastric cancer in New Mexico counties with significant deposits of
uranium. Arch. Environ. Health 40, 307-312.
URANIUM in Drinking Water
California Public Health Goal (PHG) 29 August 2001
7/28/2019 Uranium 801
http://slidepdf.com/reader/full/uranium-801 37/37
Wong, C.T., Okamoto, H.S., Milea, A.M., Perera, S.K., Baumann, F.J. (1999). Isotopic uranium
activity ratios in California groundwater. J. Amer. Water Works Assoc. 91, 171-185.
Wrenn, M.E., Durbin, P.W., Howard, B., Lipsztein, J., Rundo, J., Still, E.T., Willis, D.L. (1985).
Metabolism of ingested uranium and radium. Health Phys. 48, 601-634.
Wrenn, M.D., Singh, N.P. (1982). Comparative distribution of uranium, thorium, and plutonium
in human tissues of the general population. In: Natural Radiation Environment . Edited byVohra, K.C. Wiley Eastern Ltd., New Delhi, pp. 144-154.
Yuile, C.L. (1973). Animal experiments. In: Handbook of Experimental Pharmacology. Edited
by Hodge, H.C., Stannard, J.N., Hursh, J.B. Volume 36. Springer-Verlag, Berlin, pp. 165-196.
Zamora, M.L., Tracy, B.L., Zielinski, J.M., Meyerhof, D.P., Moss, M.A. (1998). Chronic
ingestion of uranium in drinking water: A study of kidney bioeffects in humans. Toxicol. Sci.
43, 68-77.
Zeise, L., Wilson, R., Crouch, E.A.C. (1987). The dose-response relationship for carcinogens --
a review. Environ. Health Perspect. 73, 259-308.


![Western Uranium Corporation [Type text]western-uranium.com/media/Western Uranium Corp...2015, Western Uranium acquired Black Range Minerals Ltd to acquire additional uranium assets](https://static.fdocuments.in/doc/165x107/5e9e2fdc39245c320521c248/western-uranium-corporation-type-textwestern-uranium-corp-2015-western-uranium.jpg)