Upper Snake Province Assessment - nwcouncil.org
75
Upper Snake Province Assessment Prepared for the Northwest Power and Conservation Council May 28, 2004
Transcript of Upper Snake Province Assessment - nwcouncil.org

Upper Snake Province Assessment
Prepared for the Northwest Power and Conservation Council
May 28, 2004

Upper Snake Provincial Assessment May 2004
i
Table of Contents 1 Overview .............................................................................................................................................1-1
1.1 Background ................................................................................................................................1-1 1.2 Assessment Conceptual Framework ..........................................................................................1-1
1.2.1 Scientific Principles ................................................................................................................... 1-1 1.2.2 Provincial Null Hypotheses........................................................................................................ 1-4
1.3 General Description....................................................................................................................1-5 1.3.1 Province Location ...................................................................................................................... 1-5 1.3.2 Snake Headwaters Subbasin....................................................................................................... 1-6 1.3.3 Upper Snake Subbasin ............................................................................................................... 1-7 1.3.4 Closed Basin Subbasin............................................................................................................... 1-7
1.4 Physical Description...................................................................................................................1-7 1.4.1 Drainage Area .......................................................................................................................... 1-11
1.4.1.1 Snake Headwaters Subbasin ................................................................................... 1-11 1.4.1.2 Upper Snake Subbasin .............................................................................................1-11 1.4.1.3 Closed Basin Subbasin............................................................................................ 1-14
1.4.2. Hydrology ................................................................................................................................ 1-16 1.4.2.1 Snake Headwaters Subbasin ................................................................................... 1-16 1.4.2.2 Upper Snake Subbasin ............................................................................................ 1-18 1.4.2.3 Closed Basin Subbasin............................................................................................ 1-21
1.4.3 Geology.................................................................................................................................... 1-21 1.4.3.1 Snake Headwaters Subbasin ................................................................................... 1-21 1.4.3.2 Upper Snake Subbasin ............................................................................................ 1-23 1.4.3.3 Closed Basin Subbasin............................................................................................ 1-24
1.4.4 Climate ..................................................................................................................................... 1-25 1.4.4.1 Snake Headwaters Subbasin ................................................................................... 1-25 1.4.4.2 Upper Snake Subbasin ............................................................................................ 1-26 1.4.4.3 Closed Basin Subbasin............................................................................................ 1-26
1.5 Biological Description..............................................................................................................1-27 1.5.1 Aquatic Species........................................................................................................................ 1-27
1.5.1.1 Invertebrate Species ................................................................................................ 1-27 1.5.1.2 Fish Species ............................................................................................................ 1-28
1.5.2 Wildlife .................................................................................................................................... 1-30 1.5.2.1 Mammals ................................................................................................................ 1-32 1.5.2.2 Birds........................................................................................................................ 1-33 1.5.2.3 Reptiles and Amphibians ........................................................................................ 1-36
1.5.3 Vegetation and Floristic Diversity ........................................................................................... 1-36 1.5.3.1 Snake Headwaters Subbasin ................................................................................... 1-37 1.5.3.2 Upper Snake Subbasin ............................................................................................ 1-37 1.5.3.3 Closed Basin Subbasin............................................................................................ 1-37
1.5.4 Rare and Endemic Plants.......................................................................................................... 1-37 1.6 Social Description ....................................................................................................................1-38
1.6.1 Demographics ......................................................................................................................... 1-38 1.6.2 Ownership and Land Use Patterns ........................................................................................... 1-41 1.6.3 Water Diversion and Management........................................................................................... 1-44 1.6.4 Protected Areas ........................................................................................................................ 1-47
1.7 Environmental and Biological Situation ..................................................................................1-51 1.7.1 Water Quality ........................................................................................................................... 1-51 1.7.2 Species and Habitat Status and Constraints.............................................................................. 1-52 1.7.3 Disturbance .............................................................................................................................. 1-55 1.7.4 Noxious Weeds ........................................................................................................................ 1-58

Upper Snake Provincial Assessment May 2004
ii
2 Subbasin Biological Resources ...........................................................................................................2-1 2.1 Key Ecological Functions of Fish and Wildlife Species ............................................................2-7
2.1.1 Overview....................................................................................................................................... 2-7 2.1.1.1 Key Ecological Functions and Environmental Correlates......................................... 2-7 2.1.1.2 Functional Specialists and Generalists...................................................................... 2-8 2.1.1.3 Functional Richness .................................................................................................. 2-9 2.1.1.4 Trophic Levels .......................................................................................................... 2-9 2.1.1.5 Total Functional Diversity ...................................................................................... 2-11 2.1.1.6 Functional Profiles .................................................................................................. 2-13 2.1.1.7 Critical Functional Link Species ............................................................................. 2-15
2.1.2 Focal Species .............................................................................................................................. 2-16 2.2 Aquatic Resources....................................................................................................................2-20
2.2.1 Focal Species .............................................................................................................................. 2-20 2.2.1.1 Yellowstone Cutthroat Trout (Oncorhynchus clarkii bouvieri) .............................. 2-21 2.2.1.2 Bull Trout (Salvelinus confluentus) ........................................................................ 2-55 2.2.1.3 Mountain Whitefish (Prosopium williamsoni)........................................................ 2-60 2.2.1.4 Molluscs.................................................................................................................. 2-60
2.2.2 Important Species........................................................................................................................ 2-63 2.2.2.1 Speckled Dace (Rhinichthys osculus) ..................................................................... 2-63 2.2.2.2 Longnose Dace (Rhinichthys cataractae) ................................................................ 2-63 2.2.2.3 Leopard Dace (Rhinichthys falcatus)...................................................................... 2-64 2.2.2.4 Peamouth Chub (Mylocheilus caurinus) ................................................................. 2-64 2.2.2.5 Leatherside Chub (Gila copei) ................................................................................ 2-65 2.2.2.6 Chiselmouth Chub (Acrocheilus alutaceus) ............................................................ 2-65 2.2.2.7 Utah Chub (Gila atraria) ......................................................................................... 2-66 2.2.2.8 Tui Chub (Gila bicolor)........................................................................................... 2-66 2.2.2.9 Shorthead Sculpin (Cottus confuses) ...................................................................... 2-66 2.2.2.10 Mottled Sculpin (Cottus bairdi) .............................................................................. 2-67 2.2.2.11 Torrent Sculpin (Cottus rhotheus)........................................................................... 2-67 2.2.2.12 Western Pearlshell (Margeterifera falcate).............................................................. 2-67 2.2.2.13 California Floater (Pisidium ultramontanum) ......................................................... 2-68
2.2.3 Nonnative Species Descriptions.................................................................................................. 2-69 2.3 Terrestrial Resources................................................................................................................2-69
2.3.1 Riparian/Herbaceous Wetlands................................................................................................... 2-74 2.3.1.1 Focal Species .......................................................................................................... 2-76
2.3.2 Open Water ................................................................................................................................. 2-78 2.3.2.1 Focal Species .......................................................................................................... 2-79
2.3.3 Shrub-steppe ............................................................................................................................... 2-82 2.3.3.1 Focal Species .......................................................................................................... 2-83
2.3.4 Pine/Fir Forests (Dry, Mature).................................................................................................... 2-85 2.3.4.1 Focal Species .......................................................................................................... 2-85
2.3.5 Juniper/Mountain Mahogany ...................................................................................................... 2-89 2.3.5.1 Focal Species .......................................................................................................... 2-90
2.3.6 Whitebark Pine............................................................................................................................ 2-90 2.3.6.1 Focal Species .......................................................................................................... 2-92
2.3.7 Aspen .......................................................................................................................................... 2-93 2.3.7.1 Focal Species .......................................................................................................... 2-94
2.3.8 Mountain Brush .......................................................................................................................... 2-94 2.3.8.1 Focal Species .......................................................................................................... 2-95
2.3.9 Threatened and Endangered Wildlife Species............................................................................. 2-99 2.3.9.1 Bald Eagle (Haliaeetus leucocephalus) ................................................................... 2-99 2.3.9.2 Gray Wolf (Canis lupus) ....................................................................................... 2-102 2.3.9.3 Lynx (Lynx canadensis)........................................................................................ 2-102 2.3.9.4 Grizzly Bear (Ursus arctos horribilis) ................................................................... 2-104

Upper Snake Provincial Assessment May 2004
iii
2.4 Environmental Conditions......................................................................................................2-105 2.4.1 Snake Headwaters Subbasin ..................................................................................................... 2-106
2.4.1.1 Greys–Hoback (GHB)........................................................................................... 2-106 2.4.1.2 Gros Ventre (GVT) ............................................................................................... 2-108 2.4.1.3 Palisades (PAL) .................................................................................................... 2-110 2.4.1.4 Salt (SAL) ............................................................................................................. 2-111 2.4.1.5 Snake Headwaters (SHW) .................................................................................... 2-113
2.4.2 Upper Snake Subbasin .............................................................................................................. 2-114 2.4.2.1 American Falls (AMF).......................................................................................... 2-114 2.4.2.2 Blackfoot (BFT).................................................................................................... 2-115 2.4.2.3 Goose (GSE) ......................................................................................................... 2-116 2.4.2.4 Idaho Falls (IFA)................................................................................................... 2-117 2.4.2.5 Lower Henrys (LHF) ............................................................................................ 2-118 2.4.2.6 Portneuf (PTF) ...................................................................................................... 2-120 2.4.2.7 Raft (RFT)............................................................................................................. 2-121 2.4.2.8 Teton (TET) .......................................................................................................... 2-123 2.4.2.9 Upper Henrys (UHF) ............................................................................................ 2-125 2.4.2.10 Upper Snake–Rock (USR) .................................................................................... 2-127 2.4.2.11 Lake Walcott (LWT)............................................................................................. 2-129 2.4.2.12 Willow (WIL) ....................................................................................................... 2-129
2.4.3 Closed Basin Subbasin.............................................................................................................. 2-131 2.4.3.1 Beaver–Camas (BCM).......................................................................................... 2-131 2.4.3.2 Birch (BCK).......................................................................................................... 2-132 2.4.3.3 Big Lost (BLR) ..................................................................................................... 2-133 2.4.3.4 Little Lost (LLR)................................................................................................... 2-135 2.4.3.5 Medicine Lodge (MDL)........................................................................................ 2-136
3 Biological Resources Limiting Factors ...............................................................................................3-1
3.1 Limiting Factors by Watershed ................................................................................................3-11 3.1.1 Snake Headwaters Subbasin.......................................................................................................... 3-12
3.1.1.1 Greys–Hoback (GHB)............................................................................................. 3-13 3.1.1.2 Gros Ventre (GVT) ................................................................................................. 3-16 3.1.1.3 Palisades (PAL) ...................................................................................................... 3-16 3.1.1.4 Salt (SAL) ............................................................................................................... 3-19 3.1.1.5 Snake Headwaters (SHW) ...................................................................................... 3-21
3.1.2 Upper Snake Subbasin ................................................................................................................ 3-23 3.1.2.1 American Falls (AMF)............................................................................................ 3-26 3.1.2.2 Blackfoot (BFT)...................................................................................................... 3-26 3.1.2.3 Goose (GSE) ........................................................................................................... 3-28 3.1.2.4 Idaho Falls (IFA)..................................................................................................... 3-30 3.1.2.5 Lower Henrys Fork (LHF)...................................................................................... 3-31 3.1.2.6 Portneuf (PTF) ........................................................................................................ 3-32 3.1.2.7 Raft (RFT)............................................................................................................... 3-33 3.1.2.8 Teton (TET) ............................................................................................................ 3-35 3.1.2.9 Upper Henrys Fork (UHF)...................................................................................... 3-37 3.1.2.10 Upper Snake–Rock (USR) ...................................................................................... 3-39 3.1.2.11 Lake Walcott (LWT)............................................................................................... 3-40 3.1.2.12 Willow (WIL) ......................................................................................................... 3-40
3.1.3 Closed Basin Subbasin................................................................................................................ 3-41 3.1.3.1 Beaver–Camas (BCM)............................................................................................ 3-42 3.1.3.2 Birch Creek (BCK) ................................................................................................. 3-44 3.1.3.3 Big Lost River (BLR) ............................................................................................. 3-45 3.1.3.4 Little Lost River (LLR)........................................................................................... 3-47 3.1.3.5 Medicine Lodge (MDL).......................................................................................... 3-47

Upper Snake Provincial Assessment May 2004
iv
3.2 Out-of-Basin Effects ................................................................................................................3-49 3.2.1 Aquatic Resources....................................................................................................................... 3-49 3.2.2 Terrestrial Resources................................................................................................................... 3-49
3.2.2.1 Noxious and Invasive Exotic Weeds....................................................................... 3-49 3.2.2.2 Insect and Disease Outbreaks.................................................................................. 3-50 3.2.2.3 Invasive Exotic Wildlife ......................................................................................... 3-50 3.2.2.4 Habitat Losses and Linkages................................................................................... 3-51 3.2.2.5 Genetic Linkages .................................................................................................... 3-52 3.2.2.6 Development ........................................................................................................... 3-53 3.2.2.7 Climate Cycles ........................................................................................................ 3-53
4 Inventory/Synthesis .............................................................................................................................4-1
4.1 Inventory ....................................................................................................................................4-1 4.1.1 Existing Protection ..................................................................................................................... 4-1 4.1.2 Existing Management Plans and Programs ................................................................................ 4-1 4.1.3 Restoration and Conservation Projects....................................................................................... 4-5
4.1.3.1 Snake Headwaters Subbasin ..................................................................................... 4-8 4.1.3.2 Upper Snake Subbasin .............................................................................................. 4-9 4.1.3.3 Closed Basin Subbasin............................................................................................ 4-12
4.1.5 Monitoring and Evaluation Activities ...................................................................................... 4-12 4.1.5.1 Aquatics .................................................................................................................. 4-12 4.1.5.2 Terrestrial................................................................................................................ 4-12
4.1.6 Project Gap Assessment ........................................................................................................... 4-12 4.1.6.1 Aquatics .................................................................................................................. 4-12 4.1.6.3 Terrestrial................................................................................................................ 4-12 4.1.6.4 Terrestrial Monitoring and Evaluation.................................................................... 4-13
4.2 Synthesis of Findings ...............................................................................................................4-13 4.2.1 Key Findings ............................................................................................................................ 4-13
4.2.1.1 Snake Headwaters Subbasin—Key Findings .......................................................... 4-14 4.2.1.2 Upper Snake Subbasin—Key Findings................................................................... 4-15 4.2.1.3 Closed Basin Subbasin—Key Findings .................................................................. 4-17
4.2.2 Reference Conditions ............................................................................................................... 4-18 4.2.2.1 Aquatic Habitat and Fish Focal Species.................................................................. 4-19 4.2.2.2 Riparian/Herbaceous wetlands................................................................................ 4-19 4.2.2.3 Shrub-Steppe........................................................................................................... 4-19 4.2.2.4 Pine/Fir Forest......................................................................................................... 4-19 4.2.2.5 Aspen ...................................................................................................................... 4-20
4.2.3 Near-Term Opportunities ......................................................................................................... 4-20 4.2.3.1 Aquatic.................................................................................................................... 4-20 4.2.3.2 Open Water ............................................................................................................. 4-21 4.2.3.3 Riparian/Herbaceous Wetlands............................................................................... 4-21 4.2.3.4 Shrub-Steppe........................................................................................................... 4-21 4.2.3.5 Pine/Fir Forest......................................................................................................... 4-21 4.2.3.6 Juniper/Mountain Mahogany .................................................................................. 4-22 4.2.3.7 Whitebark Pine........................................................................................................ 4-22
4.2.4 Summary of Priorities .............................................................................................................. 4-22 4.2.4.1 Aquatic Habitat Protection...................................................................................... 4-22 4.2.4.2 Riparian/Wetland Habitat Data ............................................................................... 4-22 4.2.4.3 Noxious and Exotic Invasive Weeds....................................................................... 4-23 4.2.4.4 Altered Fire Regime................................................................................................ 4-23 4.2.4.5 Subbasinwide Coordination of Management Plans................................................. 4-23
4.2.5 Identification of Strategic Actions to Address Highest Priorities ............................................ 4-23 4.2.5.1 Aquatic and Riparian Habitat.................................................................................. 4-23 4.2.5.2 Noxious and Exotic Invasive Weeds....................................................................... 4-23 4.2.5.3 Public Education Campaign.................................................................................... 4-24

Upper Snake Provincial Assessment May 2004
v
4.2.6 Working Hypotheses................................................................................................................ 4-24 4.2.6.1 Upper Snake Province Working Hypotheses .......................................................... 4-24 4.2.6.2 Snake Headwaters Subbasin Working Hypotheses................................................. 4-24 4.2.6.3 Upper Snake Working Hypotheses ......................................................................... 4-25 4.2.6.2 Closed Basin Subbasin Working Hypotheses ......................................................... 4-25
5 References ...........................................................................................................................................5-1 6 Participants and Affiliations ................................................................................................................6-1
List of Authors for the Upper Snake Provincial Assessment .....................................................6-1 List of Reviewers and Technical Team Members......................................................................6-1
List of additional contacts that provided data and GIS layers ………………………………...6-2 Acknowledgements ....................................................................................................................6-3

Upper Snake Provincial Assessment May 2004
vi
List of Tables Table 1-1. Drainage areas, numbers of named streams, and their total stream kilometers for the 22
major hydrologic units (watersheds) within the Upper Snake province (source: IFWIS 2003)........1-8 Table 1-2. Flow statistics for data of record from U.S. Geological Survey gages near Heise and Irwin,
Idaho (source: USGS 2004). ...........................................................................................................1-18 Table 1-3. Perennial and intermittent waterbodies of the Upper Snake subbasin (Buhidar 1999).
Prepared by Idaho Department of Environmental Quality-Twin Falls Regional Office from U.S. Geological Survey GIS maps via ArcView 1996. (Note: a canal is a manmade conveyance structure used to carry irrigation water from a recognized point of diversion. Natural streams, which may at times convey irrigation water, are not considered canals under the current definition. Aqueducts are defined as conduits or artificial channels that convey water above the surface across a river or hollow.) ...........................................................................................................................................1-19
Table 1-4. Temperatures and discharge rates of the Henrys Fork springs (data from Benjamin 2000). ………………………………………………………………………………………….. 1-21
Table 1-5. Threatened (T), endangered (E), and sensitive mollusc species found in the Snake River. (Note: W = watch species, species of concern to the U.S. Fish and Wildlife Service (USFWS) but without formal federal status.).........................................................................................................1-28
Table 1-6. Fish species present in the Snake River above Shoshone Falls (Buhidar et al. 1999). (Note: N = native origin; I = introduced origin.) ........................................................................................1-28
Table 1-7. Demographic information for the Upper Snake province. (Note: population counts taken in 2001; ppsm = persons per square mile; trend calculated between 1990 and 2000. Source: U.S. Census Bureau 2003).......................................................................................................................1-40
Table 1-8. Percentage of land area in the Snake Headwaters subbasin for various ownership/management entities, by watersheds and a 50-m stream buffer. ...................................1-42
Table 1-9. Percentage of land area in the Upper Snake subbasin for various ownership/management entities, by watersheds and a 50-m stream buffer. ..........................................................................1-42
Table 1-10. Percentage of land area in the Closed Basin subbasin for various ownership/management entities, by watersheds and a 50-m stream buffer. ..........................................................................1-43
Table 1-11. Spaceholder contracts in the Upper Snake subbasin as of November 1995 (Buhidar 1999) . ......................................................................................................................................1-46
Table 2-1. Focal habitats and species associated with the focal habitats in the Upper Snake province. . ........................................................................................................................................2-3
Table 2-2. Species listed under the Endangered Species Act in the Upper Snake province. ............2-6 Table 2-3. Focal, important, and nonnative species in the Upper Snake province identified by the
fisheries technical teams..................................................................................................................2-21 Table 2-4. Introgression and population status of Yellowstone cutthroat trout (YCT) for sampling
locations in the Beaver–Camas (BCM) and Medicine Lodge (MDL) watersheds within the Closed Basin subbasin. Density of rainbow trout (RBT) < 100 mm is listed as an index of further introgression risk. ............................................................................................................................2-27
Table 2-5. Introgression and population status of Yellowstone cutthroat trout (YCT) for sampling locations in the Upper Henrys watershed in the Upper Snake subbasin. Density of rainbow trout (RBT) < 100 mm is listed as an index of further introgression risk................................................2-29
Upper Snake Provincial Assessment May 2004
vii
Table 2-6. Introgression and population status of Yellowstone cutthroat trout (YCT) for sampling locations in the Lower Henrys watershed in the Upper Snake subbasin. Density of rainbow trout (RBT) < 100 mm is listed as an index of further introgression risk................................................2-31
Table 2-7. Introgression and population status of Yellowstone cutthroat trout (YCT) for sampling locations in the Teton watershed in the Upper Snake subbasin. Density of rainbow trout (RBT) <100 mm is listed as an index of further introgression risk. ....................................................................2-33
Table 2-8. Introgression and status of Yellowstone cutthroat trout (YCT) populations sampled in the Willow watershed in the Upper Snake subbasin. Density of rainbow trout (RBT) <100 mm is listed as an index of further introgression risk. .........................................................................................2-35
Table 2-9. Introgression and population status of Yellowstone cutthroat trout (YCT) for sampling locations in the Blackfoot watershed in the Upper Snake subbasin. Density of rainbow trout (RBT) <100 mm is listed as an index of further introgression risk. ...........................................................2-37
Table 2-10. Introgression and population status of Yellowstone cutthroat trout (YCT) for sampling locations in the Portneuf watershed in the Upper Snake subbasin. Density of rainbow trout (RBT) <100 mm is listed as an index of further introgression risk. ...........................................................2-39
Table 2-11. Introgression and population status of Yellowstone cutthroat trout (YCT) for sampling locations in the American Falls watershed in the Upper Snake subbasin. Density of rainbow trout (RBT) < 100 mm is listed as an index of further introgression risk................................................2-41
Table 2-12. Introgression and population status of Yellowstone cutthroat trout (YCT) for sampling locations in the American Falls watershed in the Upper Snake subbasin. Density of rainbow trout (RBT) <100 mm is listed as an index of further introgression risk.................................................2-42
Table 2-13. Introgression and population status of Yellowstone cutthroat trout (YCT) for sampling locations in the Raft watershed in the Upper Snake subbasin. Density of rainbow trout (RBT) < 100 mm is listed as an index of further introgression risk. ....................................................................2-43
Table 2-14. Introgression and population status of Yellowstone cutthroat trout (YCT) for sampling locations in the Goose watershed in the Upper Snake subbasin. Density of rainbow trout (RBT) < 100 mm is listed as an index of further introgression risk. ..........................................................2-45
Table 2-15. Introgression and population status of Yellowstone cutthroat trout (YCT) for sampling locations in the Upper Snake–Rock watershed in the Upper Snake subbasin. Density of rainbow trout (RBT) < 100 mm is listed as an index of further introgression risk. ......................................2-47
Table 2-16. Introgression and population status of Yellowstone cutthroat trout (YCT) for sampling locations in the Palisades watershed in the Snake Headwaters subbasin. Density of rainbow trout (RBT) < 100 mm is listed as an index of further introgression risk................................................2-48
Table 2-17. Introgression and population status of Yellowstone cutthroat trout (YCT) for sampling locations in the Salt watershed in the Snake Headwaters subbasin. Density of rainbow trout (RBT) < 100 mm is listed as an index of further introgression risk (Dan Isaak, unpublished data). .........2-51
Table 2-18. Mean values of stream characteristics in study sites with and without Yellowstone cutthroat trout within several river drainages in the Upper Snake subbasin, Idaho. Bold italics within each river drainage indicate variables that were subsequently included in logistic regression models (Meyer and Lamansky 2003). .........................................................................................................2-53
Table 2-19. Summary of variables included in logistic regression models relating stream characteristics to the occurrence of Yellowstone cutthroat trout in the Upper Snake subbasin, Idaho. Up and down arrows indicate direct or indirect relationships between stream attributes and cutthroat trout presence, respectively (Meyer and Lamansky 2003)..............................................................2-54
Table 2-20. Estimated densities (individuals per stream kilometer) of rainbow trout, brook trout, bull trout, and all species combined for two reaches of the Little Lost River from surveys conducted in the 1980s and 1990s (Garnett 1999)................................................................................................2-57

Upper Snake Provincial Assessment May 2004
viii
Table 2-21. Percentage representation of the current terrestrial focal habitats, by major watershed, for the Upper Snake province (GAP II) (see Table 1-1 for watershed code definitions)......................2-70
Table 2-22. Percentage changes in area (km2) from historical to current for the focal habitats in the three subbasins of the Upper Snake province using ICBMP Historic and GAP II vegetation classifications (see Table 1-1 for watershed code definitions). (See Appendix 2-1 for data limitations. For instance, there is no reliable information on the current distribution of riparian/herbaceous wetland area in the Upper Snake province.) ...................................................2-72
Table 2-23. Status and life history information for vertebrate focal species selected for riparian/herbaceous wetland habitats in the Upper Snake province. See Appendix H for detailed life history and biological information for each of the focal species.....................................................2-76
Table 2-24. Status and life history information for vertebrate focal species selected for open water habitat in the Upper Snake province. See Appendix H for detailed life history and biological information for each of the focal species. .......................................................................................2-80
Table 2-25. Status and life history information for vertebrate focal species selected for shrub-steppe habitat in the Upper Snake province. See Appendix H for detailed life history and biological information for each of the focal species. .......................................................................................2-84
Table 2-26. Status and life history information for vertebrate focal species selected for pine/fir forest habitat in the Upper Snake province. See Appendix H for detailed life history and biological information for each of the focal species. .......................................................................................2-87
Table 2-27. Status and life history information for vertebrate focal species selected for whitebark habitat in the Upper Snake province. See Appendix H for detailed life history and biological information for the focal species. ....................................................................................................2-92
Table 2-28. Status and life history information for vertebrate focal species selected for brush habitat in the Upper Snake province. See Appendix H for detailed life history and biological information for each of the focal species. .................................................................................................................2-97
Table 3-1. Rankings of the impacts of limiting factor causes for terrestrial resources in each watershed in the Upper Snake province (rankings by the technical team: 0 = none to insignificant, 1 = low, 2 = moderate, and 3 = high). .............................................................................................3-12
Table 3-2. Ranked impacts of altered ecosystem features impacting habitat quality and quantity for focal fish species in tributaries to the 5 watersheds of the Snake Headwaters subbasin. Degree of impact on habitat quality or quantity ranked as P (component is functioning properly, needs protection), 1 (least influence), 2 (moderate influence), and 3 (greatest influence, highest priority) .... . ......................................................................................................................................3-13
Table 3-3. Comparison of the relative percentages of area impacted by the causes of limiting factors in the Greys–Hoback watershed for terrestrial resources (ICBEMP 1997a). ..................................3-15
Table 3-4. Comparison of the relative percentages of area impacted by the causes of limiting factors in the Gros Ventre watershed for terrestrial resources (ICBEMP 1997a)........................................3-16
Table 3-5. Comparison of the relative percentages of area impacted by the causes of limiting factors in the Palisades watershed for terrestrial resources (ICBEMP 1997a). ...........................................3-17
Table 3-6. Comparison of the relative percentages of area impacted by the causes of limiting factors in the Salt watershed for terrestrial resources (ICBEMP 1997a). ....................................................3-20
Table 3-7. Comparison of the relative percentages of area impacted by the causes of limiting factors in the Snake Headwaters watershed for terrestrial resources (ICBEMP 1997a)..............................3-27
Table 3-8. Ranked impacts of altered ecosystem features impacting habitat quality and quantity for focal fish species in tributaries of the 12 watersheds in the Upper Snake subbasin. Degree of impact on habitat quality or quantity ranked as P (component is functioning properly, needs protection), 1 (least influence), 2 (moderate influence), or 3 (greatest influence, highest priority). ..................3-25

Upper Snake Provincial Assessment May 2004
ix
Table 3-9. Comparison of the relative percentages of area impacted by the causes of limiting factors in the American Falls watershed for terrestrial resources (ICBEMP 1997a)...................................3-26
Table 3-10. Comparison of the relative percentages of area impacted by the causes of limiting factors in the Blackfoot watershed for terrestrial resources (ICBEMP 1997a). ..........................................3-27
Table 3-11. Comparison of the relative percentages of area impacted by the causes of limiting factors in the Goose watershed for terrestrial resources (ICBEMP 1997a). ................................................3-29
Table 3-12. Comparison of the relative percentages of area impacted by the causes of limiting factors in the Idaho Falls watershed for terrestrial resources (ICBEMP 1997a). ........................................3-31
Table 3-13. Comparison of the relative percentages of area impacted by the causes of limiting factors in the Lower Henrys Fork watershed for terrestrial resources (ICBEMP 1997a)............................3-31
Table 3-14. Comparison of the relative percentages of area impacted by the causes of limiting factors in the Portneuf watershed for terrestrial resources (ICBEMP 1997a). ............................................3-33
Table 3-15. Comparison of the relative percentages of area impacted by the causes of limiting factors in the Raft watershed for terrestrial resources (ICBEMP 1997a). ...................................................3-35
Table 3-16. Comparison of the relative percentages of area impacted by the causes of limiting factors in the Teton watershed for terrestrial resources (ICBEMP 1997a)..................................................3-37
Table 3-17. Comparison of the relative percentages of area impacted by the causes of limiting factors in the Upper Henrys Fork watershed for terrestrial resources (ICBEMP 1997a). ...........................3-38
Table 3-18. Comparison of the relative percentages of area impacted by the causes of limiting factors in the Upper Snake–Rock watershed for terrestrial resources (ICBEMP 1997a). ...........................3-39
Table 3-19. Comparison of the relative percentages of area impacted by the causes of limiting factors in the Lake Walcott watershed for terrestrial resources (ICBEMP 1997a)......................................3-40
Table 3-20. Comparison of the relative percentages of area impacted by the causes of limiting factors in the Willow watershed for terrestrial resources (ICBEMP 1997a). ..............................................3-41
Table 3-21. Ranked impacts of altered ecosystem features impacting habitat quality and quantity for focal fish species in tributaries to the 5 watersheds of the Closed Basin subbasin. Degree of impact on habitat quality or quantity ranked as P (component is functioning properly, needs protection), 1 (least influence), 2 (moderate influence), and 3 (greatest influence, highest priority).................3-43
Table 3-22. Comparison of the relative percentages of area impacted by the causes of limiting factors in the Beaver–Camas watershed for terrestrial resources (ICBEMP 1997a). ..................................3-43
Table 3-23. Comparison of the relative percentages of area impacted by the causes of limiting factors in the Birch Creek watershed for terrestrial resources (ICBEMP 1997a)........................................3-44
Table 3-24. Comparison of the relative percentages of area impacted by the causes of limiting factors in the Big Lost River watershed for terrestrial resources (ICBEMP 1997a). ..................................3-46
Table 3-25. Comparison of the relative percentages of area impacted by the causes of limiting factors in the Little Lost River watershed for terrestrial resources (ICBEMP 1997a).................................3-47
Table 3-26. Comparison of the relative percentages of area impacted by the causes of limiting factors in the Medicine Lodge watershed for terrestrial resources (ICBEMP 1997a). ................................3-48
Table 4-1. Project activity categories and criteria for habitat restoration projects identified in the Upper Snake province. .................................................................................................................................4-5
Table 4-2. Number of habitat restoration projects by watershed in the Snake Headwaters subbasin identified for the 12 project activity categories. ................................................................................4-8
Table 4-3. Number of habitat restoration projects by watershed in the Upper Snake subbasin identified for the 12 project activity categories. ..............................................................................................4-10
Table 4-4. Number of habitat restoration projects by watershed in the Closed Basin subbasin identified for the 12 project activity categories. ..............................................................................................4-11

Upper Snake Provincial Assessment May 2004
x
List of Figures Figure 1-1. Simple model for evaluating relationships between fish and wildlife and their ecosystems
for the Upper Snake province............................................................................................................1-3 Figure 1-2. Schematic representation of a sustainable restoration scenario (adapted from National
Academy of Sciences, 1992) .............................................................................................................1-4 Figure 1-3. Location of the Upper Snake province and its three subbasins within the Columbia
River basin.........................................................................................................................................1-6 Figure 1-4. Major hydrologic units (22 watersheds) within the Upper Snake province.....................1-8 Figure 1-5. Major waterways within the 22 watersheds of the Upper Snake province. ...................1-10 Figure 1-6. Population centers and major roadways in the Upper Snake province. .........................1-14 Figure 1-7. Locations of dams in the Upper Snake province. ..........................................................1-20 Figure 1-8. Major geological formations within the Upper Snake province. ...................................1-23 Figure 1-9. Vertebrate species richness, where richness was calculated as the number of species
predicted to occur within each hexagon. .........................................................................................1-31 Figure 1-10. Documented occurrences of threatened and endangered species in the Upper Snake
subbasin. .......................................................................................................................................1-32 Figure 1-11. Predicted shrub-steppe habitats and sage-grouse lek locations in the Upper Snake
province. .......................................................................................................................................1-35 Figure 1-12. Distribution of rare plants in the Upper Snake province. ..............................................1-38 Figure 1-13. Twenty-seven counties comprise the Upper Snake province. Several counties are
comprised of two or more watersheds. Twenty-one counties occur in Idaho, four in Wyoming, and two in Utah. .....................................................................................................................................1-41
Figure 1-14. Land ownership/management patterns within the Upper Snake province.....................1-44 Figure 1-15. Road densities within the Upper Snake province. .........................................................1-48 Figure 1-16. Protected areas within the Upper Snake province. Data are not complete or consistent
across the basin. Boundaries are not verified, and resolution and accuracy of the source data vary widely. Original scales on sources varied from 1:24,000 to 1:500,000. Additional areas of Wild and Scenic River System were created by buffering 1:24,000-scale river reaches to fill gaps in original data. A buffer of 0.25 mile was used on each side of a river. .........................................................1-49
Figure 1-17. Mapped wetlands within the Upper Snake province as delineated by the U.S. Fish and Wildlife Service National Wetland Inventory.................................................................................1-50
Figure 1-18. Water quality limited (section 303[d]) streams in the Upper Snake province. ..............1-52 Figure 1-19. Watershed geomorphic integrity within the Upper Snake province (IWWI = Inland West
Watershed Initiative and SWIEG = Southwest Idaho Ecogroup). Sources: USDA 2003 and USFS 2003.. .......................................................................................................................................1-54
Figure 1-20. Water quality integrity within the Upper Snake province (IWWI = Inland West Watershed Initiative and SWIEG = Southwest Idaho Ecogroup). Sources: USDA 2003 and USFS 2003. .......................................................................................................................................1-55
Figure 1-21. Distribution of fires in the Upper Snake province over the last 25 years. .....................1-56 Figure 1-22. Showing the ownership of rangeland in Idaho and ownership of grazing allotments in
Utah, Nevada and Wyoming. ..........................................................................................................1-57 Figure 1-23. Known Distribution of noxious weeds in the Upper Snake province............................1-59

Upper Snake Provincial Assessment May 2004
xi
Figure 2-1. Organization of the nine focal habitats for the Upper Snake province. Note that the riparian/herbaceous wetlands habitat is the link between the aquatic and terrestrial resources. The American beaver is especially important to aquatic and riparian/herbaceous wetland habitats because it creates and maintains waterways and affects hydrography............................................................2-2
Figure 2-2. Frequency histogram showing the number of vertebrate wildlife species by number of categories of key ecological functions (KEFs) that they perform in the Upper Snake province (IBIS 2003). .........................................................................................................................................2-9
Figure 2-3. Trophic level functions of wildlife in the Upper Snake province (IBIS 2003)..............2-10 Figure 2-4. Organismal functional relations of wildlife in the Upper Snake province (see appendix
(IBIS 2003)......................................................................................................................................2-11 Figure 2-5. Change in total functional diversity from historic to current (circa 1850 to 2000)
conditions in the Upper Snake province (IBIS 2003). ....................................................................2-12 Figure 2-6. Degree of functional redundancy in trophic levels for seven focal habitats in the Upper
Snake province (IBIS 2003) (see Appendix 2-2 for KEF category definitions). ............................2-14 Figure 2-7. Degree of functional redundancy in organismal relationships for seven focal habitats in
the Upper Snake province (IBIS 2003) (see Appendix 2-2 for KEF category definitions). ...........2-15 Figure 2-8. Counts of key ecological functions (KEFs) for focal wildlife species in the Upper Snake
province (IBIS 2003).......................................................................................................................2-17 Figure 2-9. Counts of key environmental correlates (KECs) for focal wildlife species in the Upper
Snake province (IBIS 2003). ...........................................................................................................2-17 Figure 2-10. Terrestrial focal species associated with aquatic environments in the Upper Snake
province and their respective key environmental correlate (KEC) counts (IBIS 2003)..................2-18 Figure 2-11. The percentage change in total functional diversity (TFD) for each focal species in its
respective habitat in the Upper Snake province. .............................................................................2-19 Figure 2-12. The percentage change in total functional diversity (TFD) for each of the focal habitats in
the Upper Snake province. ..............................................................................................................2-20 Figure 2-13. Historical range of Yellowstone cutthroat trout in the Upper Snake province (May et al.
2003). . ......................................................................................................................................2-24 Figure 2-14. Distribution of sampling locations for Yellowstone cutthroat trout (YCT) in the Beaver–
Camas and Medicine Lodge watersheds. Rainbow trout (RBT) density < 100 mm is plotted as an index of further introgression risk. ..................................................................................................2-28
Figure 2-15. Distribution of sampling locations for Yellowstone cutthroat trout (YCT) in the Upper Henrys watershed. Rainbow trout (RBT) density < 100 mm is plotted as an index of further introgression risk. ............................................................................................................................2-30
Figure 2-16. Distribution of sampling locations for Yellowstone cutthroat trout (YCT) in the Lower Henrys watershed. Rainbow trout (RBT) density < 100 mm is plotted as an index of further introgression risk. ............................................................................................................................2-32
Figure 2-17. Distribution of sampling locations for Yellowstone cutthroat trout (YCT) in the Teton watershed. Rainbow trout (RBT) density < 100 mm is plotted as an index of further introgression risk. .......................................................................................................................................2-34
Figure 2-18. Distribution of sampling locations for Yellowstone cutthroat trout (YCT) in the Willow watershed. Rainbow trout (RBT) density < 100 mm is plotted as an index of further introgression risk. .......................................................................................................................................2-36
Figure 2-19. Distribution of sampling locations for Yellowstone cutthroat trout (YCT) in the Blackfoot watershed. Rainbow trout (RBT) density < 100 mm is plotted as an index of further introgression risk. .......................................................................................................................................2-38

Upper Snake Provincial Assessment May 2004
xii
Figure 2-20. Distribution of sampling locations for Yellowstone cutthroat trout (YCT) in the Portneuf watershed. Rainbow trout (RBT) density < 100 mm is plotted as an index of further introgression risk. .......................................................................................................................................2-40
Figure 2-21. Distribution of sampling locations for Yellowstone cutthroat trout (YCT) in the American Falls watershed. Rainbow trout (RBT) density < 100 mm is plotted as an index of further introgression risk. ............................................................................................................................2-41
Figure 2-22. Distribution of sampling locations for Yellowstone cutthroat trout (YCT) in the Lake Walcott watershed. Rainbow trout (RBT) density < 100 mm is plotted as an index of further introgression risk. ............................................................................................................................2-42
Figure 2-23. Distribution of sampling locations for Yellowstone cutthroat trout in the Raft watershed. Rainbow trout (RBT) density < 100 mm is plotted as an index of further introgression risk. ........2-44
Figure 2-24. Distribution of sampling locations for Yellowstone cutthroat trout (YCT) in the Goose watershed. Rainbow trout (RBT) density < 100 mm is plotted as an index of further introgression risk. .......................................................................................................................................2-46
Figure 2-25. Distribution of sampling locations with known introgression status of Yellowstone cutthroat trout (YCT) in the Upper Snake–Rock watershed. Rainbow trout (RBT) density < 100 mm is plotted as an index of further introgression risk. .........................................................................2-47
Figure 2-26. Distribution of sampling locations for Yellowstone cutthroat trout (YCT) in the Palisades watershed. Rainbow trout (RBT) density < 100 mm is plotted as an index of further introgression risk. .......................................................................................................................................2-50
Figure 2-27. Distribution of sampling locations for Yellowstone cutthroat trout (YCT) in the Salt watershed. Rainbow trout (RBT) density < 100 mm is plotted as an index of further introgression risk. .......................................................................................................................................2-52
Figure 2-28. Bull trout populations in the Little Lost River watershed in the Closed Basin subbasin of the Upper Snake province. ..............................................................................................................2-59
Figure 2-29. General locations where focal mollusc species are present in the Upper Snake province (IDCDC 2004). There are no distribution records for either the Idaho springsnail or the California floater. .......................................................................................................................................2-61
Figure 2-30. Historical occurrences of the focal habitats in the Upper Snake province. ...................2-73 Figure 2-31. Current occurrences of the focal habitats in the Upper Snake province. .......................2-74 Figure 2-32. Estimated distribution of riparian/herbaceous wetlands in the Upper Snake province..2-75 Figure 2-33. Estimated distribution of open water habitats in the Upper Snake province. ................2-79 Figure 2-34. Estimated current distribution of shrub-steppe habitat in the Upper Snake province....2-82 Figure 2-35. Estimated current distribution of pine/fir forests (dry, mature) habitat in the Upper Snake
province. .......................................................................................................................................2-86 Figure 2-36. Estimated current distribution of juniper/mountain mahogany habitats in the Upper Snake
province. .......................................................................................................................................2-89 Figure 2-37. Estimated current distribution of whitebark habitat in the Upper Snake province. .......2-91 Figure 2-38. Estimated current distribution of aspen habitat in the Upper Snake province. ..............2-93 Figure 2-39. Estimated current distribution of mountain brush habitat in the Upper Snake province ......
.......................................................................................................................................2-95 Figure 2-40. Estimated current mule deer distribution in the Upper Snake province. .......................2-96 Figure 2-41. Rocky Mountain elk winter range population estimates in the Upper Snake province
(IDFG 2004 unpublished aerial survey data collected during 1984-2003). ....................................2-97 Figure 3-1. Expression of limiting factors and their causes for each focal habitat type in the Upper
Snake province. This table is representative rather than comprehensive. The classification of

Upper Snake Provincial Assessment May 2004
xiii
exogenous material in this assessment generally refers to nonnatural physical barriers to migration or sediment, chemical impacts, and introduction of nonnative plants or animals (aquatic habitat information modified from Gregory and Bisson [1997]). .................................................................3-2
Figure 3-2. Current distribution of forest species compositions in the Greys–Hoback watershed, Snake Headwaters subbasin, Wyoming (GAP II, Scott et al. 2002). ..............................................3-15
Figure 3-3. Idaho Department of Water Resources points of water diversions in the Palisades watershed, Snake Headwaters subbasin. .........................................................................................3-18
Figure 3-4. Predicted areas within the Palisades watershed, Snake Headwaters subbasin, most likely to be at risk for severe fire effects, taking into account fire regime condition class, ignition probability, and fire weather hazard. Ecosystems-at-risk integrates ignition probability, fire weather hazard, rate-of-spread, and fire regime condition class (the probability of severe fire effects). Source: Northern Regional National Fire Plan Cohesive Strategy Assessment Team, Flathead National Forest (CSAT 2004). .......................................................................................................................3-19
Figure 3-5. Status of timber harvest activity in the Salt watershed, Snake Headwaters subbasin, Idaho and Wyoming (ICBEMP 1997).......................................................................................................3-20
Figure 3-6. Current distribution of forest species compositions in the Snake Headwaters watershed, Snake Headwaters subbasin, Wyoming (GAP II, Scott et al. 2002). ..............................................3-22
Figure 3-7. Status of timber harvest activity in the Blackfoot watershed, Upper Snake subbasin, Idaho (ICBEMP 1997). .............................................................................................................................3-28
Figure 3-8. Idaho Department of Water Resources points of water diversions in the Goose watershed, Upper Snake subbasin. ....................................................................................................................3-29
Figure 3-9. Status of grazing and browsing by domestic animals in the Goose watershed, Upper Snake subbasin, Idaho, Utah, and Nevada (ICBEMP 1997). ..........................................................3-30
Figure 3-10. Idaho Department of Water Resources points of water diversions in the Portneuf watershed, Upper Snake subbasin. ..................................................................................................3-33
Figure 3-11. Predicted areas within the Portneuf watershed, Upper Snake subbasin, most likely to be at risk for severe fire effects, taking into account fire regime condition class, ignition probability, and fire weather hazard. Ecosystems-at-risk integrates ignition probability, fire weather hazard, rate-of-spread, and fire regime condition class (the probability of severe fire effects). Source: Northern Regional National Fire Plan Cohesive Strategy Assessment Team, Flathead National Forest (CSAT 2004). .......................................................................................................................................3-34
Figure 3-12. Rangeland condition in the Raft watershed, Upper Snake subbasin, Idaho and Utah (ICBEMP 1997). .............................................................................................................................3-35
Figure 3-13. Idaho Department of Water Resources points of water diversions in the Teton watershed, Upper Snake subbasin. ....................................................................................................................3-36
Figure 3-14. Current distribution of forest species compositions in the Upper Henrys Fork watershed, Upper Snake subbasin, Idaho and Wyoming (GAP II 2003, Scott et al. 2002). .............................3-38
Figure 3-15. Predicted areas within the Beaver–Camas watershed, Closed Basin subbasin, most likely to be at risk for severe fire effects, taking into account fire regime condition class, ignition probability, and fire weather hazard. Ecosystems-at-risk integrates ignition probability, fire weather hazard, rate-of-spread, and fire regime condition class (the probability of severe fire effects). Source: Northern Regional National Fire Plan Cohesive Strategy Assessment Team, Flathead National Forest (CSAT 2004). .......................................................................................................................3-43
Figure 3-16. Status of grazing and browsing by domestic animals in the Birch Creek watershed, Closed Basin subbasin, Idaho (ICBEMP 1997). .............................................................................3-45
Figure 3-17. Idaho Department of Water Resources points of water diversions in the Big Lost River watershed, Closed Basin subbasin...................................................................................................3-46

Upper Snake Provincial Assessment May 2004
xiv
Figure 3-18. Status of grazing and browsing by domestic animals in the Medicine Lodge watershed, Closed Basin subbasin, Idaho (ICBEMP 1997). .............................................................................3-48
Figure 4-1. Funding breakdown for habitat restoration projects in the Snake Headwaters subbasin identified during the assessment process. WYG&F = Wyoming Game and Fish Department; Local = City or County; Federal = U.S. Forest Service, Bureau of Land Management, U.S. Fish and Wildlife Service, and Bureau of Reclamation; IDFG = Idaho Department of Fish and Game; Nonprofit =not for profit and nongovernmental organizations; Private = private business or citizens, RAC II = Resource Advisory Committees........................................................................................4-6
Figure 4-2. Funding breakdown for habitat restoration projects in the Upper Snake subbasin identified during the assessment process. Local= City or County, Federal= U.S Forest Service, Bureau of Land Management, U.S. Fish and Wildlife Service, and Bureau of Reclamation, IDFG= Idaho Department of Fish and Game, Nonprofit= not for profit and nongovernmental organizations, Private= private business or citizens, NRCS= Natural Resources Conservation Service, ITD= Idaho Department of Transportation, ISCC= Idaho Soil Conservation Commission, IDEQ= Idaho Department of Environmental Quality, RAC II= Resource Advisory Committees. .........................4-7
Figure 4-3. Funding breakdown for habitat restoration projects in the Closed Basin subbasin identified during the assessment process. Local = City or County; Federal = U.S. Forest Service, Bureau of Land Management, U.S. Fish and Wildlife Service, and Bureau of Reclamation; IDFG = Idaho Department of Fish and Game; Nonprofit =not for profit and nongovernmental organizations; Private = private business or citizens; ISCC = Idaho Soil Conservation Commission; IDEQ = Idaho Department of Environmental Quality; RAC II = Resource Advisory Committees. 4-7
Figure 4-4. Summary of 31 habitat restoration activities in the Snake Headwaters subbasin identified during the assessment process. ..........................................................................................................4-8
Figure 4-5. Summary of 127 habitat restoration activities in the Upper Snake subbasin identified during the assessment process. ........................................................................................................4-10
Figure 4-6. Summary of 26 habitat restoration activities in the Closed Basin subbasin identified during the assessment process. ........................................................................................................4-11

Upper Snake Provincial Assessment May 2004
xv
List of Appendices Appendix 1-1—List of Terrestrial Vertebrate Species within the Upper Snake Province Appendix 1-2—Potential and Current Natural Vegetation Appendix 1-3—Rare and Sensitive Vegetation in the Upper Snake Subbasins Appendix 1-4—Dams within the Upper Snake Province. Appendix 1-5—Water Quality Limited Streams within the Upper Snake Province Appendix 1-6—Noxious Weeds Appendix 2-1—Data Limitations Appendix 2-2—Key Ecological Functions of Species Appendix 2-3—Focal Habitat Descriptions Appendix 2-4―Terrestrial Focal Species Descriptions Appendix 3-1―Overview of the Major Causes Limiting the habitats and Fish and Wildlife in the Upper Snake Province Appendix 4-1—Upper Snake Province Project Inventory Appendix 4-2—Loss Assessment Appendix 4-3— Research, Monitoring and Evaluation Activities.

DRAFT Upper Snake Provincial Assessment May 2004
1-1
1 Overview
1.1 Background
In 1980, Congress authorized creation of the Northwest Power Planning Council (or NPPC, which in 2003 became the Northwest Power and Conservation Council, or NPCC) to give the states of Idaho, Montana, Oregon, and Washington a political voice in managing the federal hydropower system located in the Columbia River basin. In addition, the NPCC was directed to develop a program—the Columbia River Basin Fish and Wildlife Program—to protect, mitigate, and enhance fish and wildlife communities and populations affected by the Columbia River hydropower system.
In past years, the NPCC and Columbia Basin Fish and Wildlife Authority (local managers of fish and wildlife resources) reviewed proposals submitted for on-the-ground projects and research. The Bonneville Power Administration then funded approved projects. Recently, independent scientific review panels recommended that subbasin plans be developed to better guide the review, selection, and funding of projects that implement the NPCC’s Columbia River Basin Fish and Wildlife Program. In an effort to refine this program, a new review and selection process has begun. This process includes subbasin summaries (interim information), assessments, and management plans, which provide a base of information and direction on conditions, limiting factors, and needs in the basin.
Creation of these documents is followed by a rolling review of proposals by an Independent Scientific Review Panel, the Columbia Basin Fish and Wildlife Authority, and the NPCC. Under the rolling provincial review, project proposals from a given subbasin will only be reviewed once every three years.
1.2 Assessment Conceptual Framework
The NPCC has outlined eight scientific principles to guide the operation of its Columbia River Basin Fish and Wildlife Program.
These principles frame the assessment of the Upper Snake province.
1.2.1 Scientific Principles
Eight scientific principles guide the operation of the NPCC’s Columbia River Basin Fish and Wildlife Program. These principles served as the foundation for the fisheries and terrestrial technical teams that were formed to provide input to this technical assessment for the Upper Snake province. These principles are as follows:
1. The abundance, productivity, and diversity of organisms are integrally linked to the characteristics of their ecosystems.
2. Ecosystems are dynamic and resilient, and they develop over time.
3. Biological systems operate on various spatial and time scales that can be organized hierarchically.
4. Habitats develop through and are maintained by physical and biological processes.
5. Species play key roles in developing and maintaining ecological conditions.
6. Biological diversity allows ecosystems to persist despite environmental variation.
7. Ecological management is adaptive and experimental.
8. Ecosystem function, habitat structure, and biological performance are affected by human actions.

DRAFT Upper Snake Provincial Assessment May 2004
1-2
As the NPCC’s scientific principles indicate, the relationships of ecosystems, habitats, and populations of fish, wildlife, and plants are very complex. In most cases, these relationships are both undefined and interrelated. Changes resulting from weather, fire, flood, disease, or habitat loss may not only directly reduce or increase fish and wildlife populations, but they may also indirectly perturb relationships and interactions between and among fish, wildlife, and their ecosystems to the same or greater extent than the direct effects.
In the Upper Snake Province, we defined seven limiting factors, or environmental bottlenecks, that may limit fish, wildlife, and their habitats. These factors, in relation to their causes and their manifestations, provide a simplistic working picture of how we evaluated focal populations, focal habitats, and ecosystems in this assessment (Figure 1-1).
These limiting factors may act exclusively, such as when a fire eliminates old growth forest habitat necessary for old growth-dependent species such as the fisher (Martes pennanti). Or they may act simultaneously or in a composite, such as when aquatic habitat quantity is reduced by water diversion, the remaining water in the stream is reduced in quality by increased water temperatures, and population linkage between aquatic species and the amount of water in the stream is reduced or eliminated.
Each limiting factor may manifest itself differently, depending on the status of the
species or habitat, the scale of the effect, and the cause of the limiting factor. For example, wolf predation of elk calves may locally limit elk population growth, especially in an area of low habitat quality but will not threaten elk rangewide. In this assessment, our simplistic model suggests causes of limiting factors affecting focal species and habitats and the manifestation of the limiting factor in a focal species, habitat, or ecosystem (Figure 1-1).
Our model is scale independent. And it does not represent whether invasive exotic weeds are a competitive or habitat quality limiting factor or both, and it does not imply that fish, wildlife, and ecosystem relationships are as linear and simplistic as shown.
In this assessment, we assume that each of the ecosystems, habitats, and species we assessed originated and functioned optimally prior to anthropogenic influence (Figure 1-2). Pre-anthropogenic optimum function is assumed to be resilience of fish and wildlife systems and sustainability of populations within the range of natural variability. We suggest that increasing anthropogenic effects have exaggerated the limiting factors beyond the range of natural variability and that this pressure has simplified interactions and relationships and reduced the resilience of focal habitats and species, leading to long-term decline (Figure 1-2). Ongoing declines in focal habitats or species have unknown consequences at best and lead to extinction for one or more species at worst.

DRAFT Upper Snake Provincial Assessment May 2004
1-3
Figure 1-1. Simple model for evaluating relationships between fish and wildlife and their ecosystems for the Upper Snake province.

DRAFT Upper Snake Provincial Assessment May 2004
1-4
Figure 1-2. Schematic representation of a sustainable restoration scenario (adapted from National Academy of Sciences, 1992)
Through definition of limiting factors and their causes, we identify strategies to relieve or eliminate the limiting factors and increase the trend and status of focal species, habitats, and ecosystems. We use the best available information to select focal species, define the status of each focal fish and wildlife species or habitat, and then synthesize this information into working hypothesis to direct effective relief of limiting factors. Implementation of management strategies will ideally move the trend or status of focal species or habitats upward toward the acceptable and sustainable levels defined by
the biological objectives in the provincial plan. Monitoring and evaluation of strategy implementation is necessary to test the hypothesis of the management experiment, the effectiveness of the strategy, and increase learning through management actions.
1.2.2 Provincial Null Hypotheses
Scientific methodology incorporates hypothesis testing by first assuming a specified action has no effect or impact on the parameter in question. This is called the null hypothesis (Ho). From the provincial
Past Present Future
A
D
A = determined by natural, physical, and biological constraints and processesB = ideal condition that can be achieved within social and political constraintsC = minimum desirable condition for state variable (actual or social thresholds;
B to C represents desirable range for state variable) D = projected trend of focal habitat or species in ecosystemX = area of predicted sustainability
B
CX
Start of human-induced change

DRAFT Upper Snake Provincial Assessment May 2004
1-5
perspective, the broadest null hypothesis is that fish and wildlife species and their habitats are not limited in the Upper Snake province. The broadest alternative hypothesis (HA) states fish and wildlife species and their habitats are limited by one or more of seven identified limiting factors. More specifically, we begin our assessment with the following null hypotheses.
Hypothesis A
Ho: Habitat quantity does not limit the abundance, distribution, life history, and ecological relationships of focal species and habitats.
Hypothesis B
Ho: Habitat quality does not limit the abundance, distribution, life history, and ecological relationships of focal species and habitats.
Hypothesis C
Ho: Population harvest does not limit the abundance, distribution, life history, and ecological relationships of focal species and habitats.
Hypothesis D
Ho: Competition among and between fish and wildlife species and habitats does not limit the abundance, distribution, life history, and ecological relationships of focal species and habitats.
Hypothesis E
Ho: Predation does not limit the abundance, distribution, life history, and ecological relationships of focal species and habitats.
Hypothesis F
Ho: Disease does not limit the abundance, distribution, life history, and ecological relationships of focal species and habitats.
Hypothesis G
Ho: Population and habitat fragmentation and loss of connectivity does not limit the abundance, distribution, life history, and ecological relationships of focal species and habitats.
The alternative or working hypothesis (HA) is the opposite of the null hypothesis (Ho). It may be developed intuitively or be based on data and information. The alternative or working hypothesis is refuted based on data and information collected using scientific methodology during designed actions.
Our assessment begins by presuming seven stated null hypotheses based on our simplistic model (Figure 1-1) and ends by statement of alternative hypothesis HA developed through synthesis of the information on fish, wildlife, habitats, environmental conditions, and limiting factors we gathered during the assessment. Management and monitoring strategies designed to change the influence of the identified limiting factor on focal species or habitats and measure that change can reinforce or refute these working or alternative hypotheses.
1.3 General Description
1.3.1 Province Location
The Upper Snake province is the uppermost province of the Snake River system and includes areas within Idaho, Wyoming, Utah, and Nevada (Figure 1-3). It includes the Snake River and all its tributaries from Shoshone Falls, Idaho, to its headwaters in Wyoming, as well as the closed basins on the northern edge of the Snake River Plain. The

DRAFT Upper Snake Provincial Assessment May 2004
1-6
Upper Snake province is divided into three subbasins: the Upper Snake, Snake
Headwaters, and Closed Basin (Figure 1-4).
Figure 1-3. Location of the Upper Snake province and its three subbasins within the Columbia River basin.
1.3.2 Snake Headwaters Subbasin
The Snake Headwaters subbasin encompasses some of the most pristine terrestrial and aquatic temperate montane ecosystems in the Columbia River basin system. This subbasin lies within the heart of the northern Rocky Mountain region, straddling the border between southeastern Idaho and western Wyoming (Figure 1-3). The key rivers that are a part of or feed into the Snake Headwaters subbasin include the Snake, Salt, Greys-Hoback, and Gros Ventre rivers. Some of the most important cottonwood gallery
forests in the Intermountain West exist within this river parkway. Lakes and reservoirs within the drainages include Jackson Lake, Palisades Reservoir, and Ririe Reservoir. The Snake River itself harbors one of the few fluvial populations of Yellowstone cutthroat trout in Idaho.
The forested areas of the Snake Headwaters are home to diverse mammalian and avian species, including the largest population of nesting bald eagles in the Greater Yellowstone Ecosystem (an area including the Snake Headwaters subbasin and with broad-

DRAFT Upper Snake Provincial Assessment May 2004
1-7
reaching environmental and ecological oversight). National Forests within the Snake Headwaters subbasin include the Targhee-Caribou and Bridger-Teton. The subbasin also includes Grand Teton National Park, Jackson Hole Elk Refuge, Jackson National Fish Hatchery, and Gros Ventre Wilderness.
1.3.3 Upper Snake Subbasin
The Upper Snake subbasin includes the Blackfoot River, Portneuf River, and Henrys Fork watersheds and numerous tributaries across this area of southeastern Idaho. The Henrys Fork and Teton River watersheds of the Upper Snake subbasin have been well known for trout fishing and other recreational opportunities since the 1880s. The area provides one of the most important rainbow trout (Oncorhynchus mykiss) fisheries in the state in terms of habitat, fish populations, and angler use (IDFG 2001). In addition, rich agricultural land along the lower reaches of the Henrys Fork provides the world’s largest seed potato production area (Van Kirk and Griffin 1997). An estimated 75% of the economy of southern Idaho is driven by agricultural business in this area. Streamflow of the Snake River and its major tributaries is highly regulated by dams and diversions. Over the past two decades, water and other natural resource management issues in the subbasin have received national attention, for both the intensity of conflicts over them and the eventual success of collaborative subbasin research and management efforts.
1.3.4 Closed Basin Subbasin
The Closed Basin subbasin occupies a remote and sparsely populated area of east-central Idaho. This subbasin is distinct in that the major flowing waters in the subbasin, such as the Big Lost and Little Lost rivers, percolate through the volcanic flows of the Snake River
Plain and disappear. Through discharge of the Snake River aquifer, the flows emerge in springs along the Snake River. More than 70% of the roadless areas greater than 199,908 acres (809 km2) in the lower 48 states are in this subbasin. Because of the remoteness and areas of limited accessibility, most wildlife populations are in reasonably good condition. Exceptions include the greater sage grouse (Centrocercus urophasianus), some Neotropical migrant birds, and other birds experiencing rangewide declines stemming from changes outside the provincial boundaries. Fish populations and aquatic habitats in this subbasin are more impacted by anthropogenic activities, including water use and historical fish management and stocking practices. Basinwide information is lacking for a number of taxa, notably nongame species, including songbirds, amphibians, reptiles, and bats and other small mammals.
1.4 Physical Description
The Upper Snake province is 18,497,568acres (74,857 km2) (Table 1-1) and composed of 22 watersheds (Figure 1-4). The province incorporates lands within the boundaries of Idaho, Wyoming, Utah, and Nevada. Elevations in the province range from the summit of the Grand Teton at 14,436 ft (4,400 m) to Shoshone Falls at 2,625 ft (800 m). This province contains the origins of the Snake River, the largest tributary to the Columbia River. The Snake River origins are on the Continental Divide south of Yellowstone National Park boundary and at nearly the most northern point of Grand Teton National Park. The water originating in the Closed Basin subbasin of the Upper Snake province enters the Snake River at Thousand Springs, below the Shoshone Falls boundary of the Upper Snake province.

DRAFT Upper Snake Provincial Assessment May 2004
1-8
Figure 1-4. Major hydrologic units (22 watersheds) within the Upper Snake province.
Table 1-1. Drainage areas, numbers of named streams, and their total stream kilometers for the 22 major hydrologic units (watersheds) within the Upper Snake province (source: IFWIS 2003).
Watershed Code Hydrologic Unit Code State Drainage
Area (km2)
Number of Named Streams
Total Stream
km Snake Headwaters subbasin Greys–Hoback GHB 17040103 Wyoming 4,062 311 1,161 Gros Ventre GVT 17040102 Wyoming 1,663 195 576 Palisades PAL 17040104 Idaho/Wyoming 2,395 170 896

DRAFT Upper Snake Provincial Assessment May 2004
1-9
Watershed Code Hydrologic Unit Code State Drainage
Area (km2)
Number of Named Streams
Total Stream
km Salt SAL 17040105 Idaho/Wyoming 2,303 231 939 Snake Headwaters SHW 17040101 Wyoming 4,405 232 1,080
Subbasin Totals 14,828 1,139 4,652 Upper Snake subbasin American Falls AMF 17040206 Idaho 7,544 136 1,004 Blackfoot BFT 17040207 Idaho 2,842 141 984 Goose GSE 17040211 Idaho/Utah/
Nevada 2,898 215 1,113
Idaho Falls IFA 17040201 Idaho 2,975 48 485 Lower Henrys Fork LHF 17040203 Idaho/Wyoming 2,666 108 761 Portneuf PTF 17040208 Idaho 3,441 300 1,455 Raft RFT 17040210 Idaho/Utah 3,915 232 1,342 Teton TET 17040204 Idaho/Wyoming 2,857 159 1,163 Upper Henrys Fork UHF 17040202 Idaho/Wyoming 2,873 223 1,242 Upper Snake–Rock USR 17040212 Idaho 2,530 39 347 Lake Walcott LWT 17040209 Idaho 9,283 142 865 Willow WIL 17040205 Idaho 1,682 83 611
Subbasin Totals 45,506 1,826 11,372 Closed Basin subbasin Beaver–Camas BCM 17040214 Idaho 2,576 177 898 Birch Creek BCK 17040216 Idaho 1,864 123 737 Big Lost River BLR 17040218 Idaho 5,139 474 2,161 Little Lost River LLR 17040217 Idaho 2,516 157 894 Medicine Lodge MDL 17040215 Idaho 2,428 98 603
Subbasin Totals 14,523 1,029 5,293 Province Totals 74,858 3,994 21,317
The Snake Headwaters subbasin of the Upper Snake province lies within the northern Rocky Mountains and straddles the border between southeastern Idaho and western Wyoming (Figure 1-3). The subbasin occurs within portions of the Northwest Basin and Range, Snake River Basalts, Yellowstone Highlands, and Over thrust Mountains ecoregional sections (McNab and Avers 1994). The 3,664,079 acres (14,828-km2)
subbasin encompasses five watersheds: Greys–Hoback, Gros Ventre, Palisades, Salt, and Snake Headwaters. The Greys–Hoback, Gros Ventre, and Snake Headwaters watersheds are all located in Wyoming. The Salt watershed lies between the boarders of Wyoming and Idaho. The majority of the Palisades watershed is located in Idaho, with only a small portion in Wyoming.

DRAFT Upper Snake Provincial Assessment May 2004
1-10
Figure 1-5. Major waterways within the 22 watersheds of the Upper Snake province.
The Upper Snake subbasin is located in eastern Idaho and encompasses 12 watersheds (Figure 1-4): American Falls, Blackfoot, Goose, Idaho Falls, Lower Henrys Fork, Portneuf, Raft, Teton, Upper Henrys Fork, Upper Snake–Rock, Lake Walcott, and Willow. Watersheds that include areas in both Idaho and Wyoming are the Lower Henrys Fork, Upper Henrys Fork, and Teton watersheds. Both the Goose and Raft watersheds include areas in both Idaho and Utah. The Goose watershed also includes area within Nevada. Land surface elevation above sea level ranges from 13,451 ft (4,100 m) in
the headwaters of the Snake River to 800 m at Shoshone Falls. Most streams in the subbasin originate in the foothills or montane regions that are between 5,906 and 9,843 ft (1,800 to 3,000 m) in elevation. Major tributaries include the Blackfoot, Portneuf, and Raft rivers and Goose and Big Cottonwood creeks (Figure 1-5).
The Closed Basin subbasin encompasses five watersheds in east central Idaho (Figure 1-4): the Big Lost, Little Lost, Birch, Medicine Lodge, and Beaver–Camas. These headwater streams originate in the mountains of

DRAFT Upper Snake Provincial Assessment May 2004
1-11
southeastern and south-central Idaho and terminate on the Snake River Plain. Although these streams are located within the Snake River basin, the immense lava formations of the upper Snake River Plain prevent them from forming an overland connection with other streams in the basin. During the Pleistocene, increased streamflows from these rivers combined to form Lake Terreton (Pierce and Scott 1982). This period was likely the most recent connection that these waters had with other streams. Today, and for the past 12,000 years, waters from these drainages sink into the lava along the northern edge of the Snake River Plain and contribute recharge to the Snake River Plain aquifer system from surface flow onto the plain and as underflow from the respective watersheds. The aquifer resurfaces and discharges to the middle Snake River at Thousand Springs near Hagerman, Idaho, approximately 124 miles (200 km) from the terminus of the Closed Basin subbasin watercourses.
1.4.1 Drainage Area
Some of the major drainage systems in the province are the Big Lost, Little Lost, Blackfoot, Portneuf, Raft, Greys-Hoback, Palisades, Henrys Fork, and Beaver–Camas (Table 1-1). Major water impoundments within the province include American Falls Reservoir, Lake Walcott, Palisades Reservoir, Jackson Lake, Mud Lake, Blackfoot Reservoir, Grays Lake, Henrys Lake, Moran Lake, Mackay Reservoir, and Island Park Reservoir (Figure 1-5).
1.4.1.1 Snake Headwaters Subbasin
The Greys–Hoback watershed is located in the southeastern section of the Snake Headwaters subbasin in Wyoming. The watershed contains a total area of 1,003,742 acres (4,062 km2) (Table 1-1). This watershed links the tributaries of the Snake River, Jackson Lake Reservoir, the Hoback River
(which flows from the east and joins the Snake River at Hoback Junction, Wyoming), and waters that originate in the Bridger-Teton National Forest. All waters confluence and flow south to Palisades Reservoir.
The Salt watershed is located in the southwestern section of the Snake Headwaters subbasin (Figure 1-4) in an area known as Star Valley The watershed contains a total area of 569,084 acres (2,303 km2) (Table 1-1) and is comprised of the drainage and tributaries of the Salt River originating in the Bridger-Teton National Forest and eventually meandering through Star Valley to join the Greys River near Alpine, Wyoming. This subbasin’s waters originate in the Bridger-Teton National Forest.
The Palisades watershed is located midway down the Idaho–Wyoming border. Approximately 10% of the watershed is in Wyoming. This watershed contains a total area of 591,817 acres (2,395 km2) (Table 1-1) and is comprised of the drainage and tributaries of the South Fork Snake River from Palisades Reservoir at the southeast corner of the watershed, through the small communities of Swan Valley (Figure 1-6) and Irwin, Idaho, to the U.S. Geological Survey gauging station at Heise, Idaho.
The Snake Headwaters and Gros Ventre watersheds are the only two watersheds in the subbasin that are entirely located in the State of Wyoming. The Snake Headwaters watershed is the largest watershed in the subbasin with a total area of 1,088,499 acres (4,405 km2) and 232 named streams (Table 1-1). The Gros Ventre watershed is the smallest in the subbasin with a total area of 410,936 acres (1,663 km2) and 195 named streams.
1.4.1.2 Upper Snake Subbasin
The Upper Snake subbasin contains over 7,022 miles (11,300 km) of streams (Table 1-

DRAFT Upper Snake Provincial Assessment May 2004
1-12
1). Streamflow in the Snake River and its major tributaries is highly regulated by dams and diversions, primarily for agricultural use and hydroelectric power generation. Irrigation projects have resulted in about 5,717 miles (9,200 km) of canals and 1,305 miles (2,100 km) of drains in the subbasin, and water transfer from one river watershed to irrigate crops in another is common practice.
However, as available surface-water supplies have diminished, use of ground water in the Upper Snake subbasin has increased. From 1980 to 1990, annual ground-water use increased to 2.6 million acre-feet (Maupin 1995). At Heise, upstream from nearly all irrigation uses, the average annual flow of the Snake River approximates 6,900 cubic feet per second (cfs). A significant amount of the river flow below Heise is lost to groundwater and naturally recharges the eastern Snake River Plain aquifer. Streamflows are reduced by irrigation diversions to an average flow of 3,450 cfs at Milner Dam. A portion of the water that is diverted for agriculture percolates into the aquifer. Some of this groundwater returns to the Snake River in other reaches, such as the reach between the cities of Blackfoot and American Falls, Idaho.
The Lower Henrys Fork, Upper Henrys Fork, and Teton watersheds drain areas of 658,783; 709,934; and 705,980 acres, respectively (2,666; 2,873; and 2,857 km2, respectively (658,783, 709934, and 705980 acres, respectively) (Table 1-1). Major tributaries in the watersheds are Henrys Lake Outlet and the Buffalo, Warm, Falls, and Teton rivers (Figure 1-5). Our listing of Henrys Lake Outlet as a tributary follows the convention that the Henrys Fork begins at the confluence of Henrys Lake Outlet and Big Springs (Van Kirk and Benjamin 2000). Most maps list the stream segment between Henrys Lake and Big Springs as the “Henrys Fork,” but local usage refers to this stream as “Henrys Lake Outlet.” In 2001, the name of this stream
segment was officially changed to “Henrys Lake Outlet” to be consistent with local usage and with the fact that in terms of total annual discharge, Big Springs, and not Henrys Lake, is the source of the Henrys Fork. The Upper Henrys Fork watershed consists of the Henrys Fork and its tributaries upstream of Ashton Reservoir. The Lower Henrys Fork watershed contains the river and its tributaries from Ashton Reservoir downstream to its confluence with the Snake River, excluding the Teton River. This hydrologic unit consists primarily of the Falls River drainage. The Teton watershed includes the Teton River and its tributaries (Figure 1-5).
The Raft watershed encompasses an area of about 963,711 acres (3,900 km2), about 95% of this area is in Idaho and the rest in Utah. The headwaters originate on the east side of the Albion Mountains southeast of the town of Oakley, Idaho. Perennially flowing headwater tributaries originating from the Albion Mountains near the City of Rocks National Reserve include Almo Creek and Edwards Creek. Tributary streams originating on the west side of the Black Pine Mountains include Sixmile Creek and Eightmile Creek. Farther downstream near the town of Malta, Cassia Creek enters the Raft River, which enters the Snake River at about 14 miles (23 km) downriver of Massacre Rocks State Park.
Located to the west of the Raft watershed, the Goose watershed has an estimated area of 716,111 acres (2,898 km2) (Table 1-1). The headwaters of Goose Creek originate in the South Hills south of the town of Twin Falls, Idaho, and flow south into Nevada, east into Utah, and then north into Idaho. Several spring-fed headwater tributaries in all three states provide significant flows to Goose Creek before it reaches the Oakley Reservoir impoundment, about 4 miles () south of the town of Oakley, Idaho.

DRAFT Upper Snake Provincial Assessment May 2004
1-13
The Blackfoot watershed encompasses 702,274 acres (2,842 km2) (Table 1-1) and includes 984 km of streams. Diamond and Lanes creeks merge to form the Blackfoot River, which winds westward for 209 km before reaching the Snake River west of the city of Blackfoot. Major tributaries include the Little Blackfoot River and Wolverine, Brush, Corral, Meadow, Trail, Slug, Dry Valley, Angus, and Spring creeks. Blackfoot Reservoir, created in 1910, is the only major reservoir in this watershed; it is operated by the U.S. Bureau of Indian Affairs.
The Portneuf watershed drains 850,290 acres (3,441 km2) in southeastern Idaho (Table 1-1) and is bounded by Malad Summit to the south, the Bannock Range to the west, the Portneuf Range to the southeast, and the Chesterfield Range to the northeast. Marsh Creek is the only major tributary to the Portneuf River (Figure 1-5). Other creeks in this watershed include Mink, Rapid, Garden, Hawkins, Birch, Dempsey, Pebble, Twentyfourmile, and Toponce creeks. The total area of the Chesterfield Reservoir is estimated at 1,236 acres (5 km2).
The Willow watershed is located in the southwestern section of the Upper Snake subbasin in southeastern Idaho. The watershed contains a total area of 415,631 acres (1,682 km2) (Table 1-1) and is composed of the drainage and tributaries that originate near Grays Lake National Wildlife Refuge in the Caribou National Forest and eventually meander through the Willow Creek drainage to Ririe Reservoir. The 19 miles (31 km) of Willow Creek below Ririe Dam is controlled for irrigation and flood control. This segment of Willow Creek is annually dewatered to keep ice buildup from causing floods near Idaho Falls. Some trout from irrigation ditches that flow into Willow Creek via the South Fork Snake River provide a seasonal fishery. The 95 miles (153 km) of streams in the Willow Creek drainage above
Ririe Reservoir are mainly in narrow canyons and contain important wild cutthroat trout populations.
The Idaho Falls watershed is located in the southwestern section of the Upper Snake subbasin in southeastern Idaho (Figure 1-4). The watershed contains a total area of 735,139 acres (2,975 km2) (Table 1-1) and includes the mainstem Snake River below the confluence of the Henrys Fork and South Fork Snake River.
Adjacent to the Idaho Falls watershed is the American Falls watershed, which contains American Falls Reservoir. This is the second largest in the Upper Snake subbasin with a total area of 1,864,163 acres (7,544 km2). Surface hydrology in the American Falls watershed is reasonably simple, with a few tributaries flowing into the Snake River from the south, while the north is dominated by the characteristically dry and flat Snake River Plain.
Lake Walcott is the largest watershed in the subbasin with a total area of 2,293,870 acres (9,283 km2). The Snake River flows for roughly 100 km through this watershed. Similar to American Falls, the surface hydrology is dominated by a few tributaries to the Snake River flowing from the south, and a large, dry, flat area to the north.
The Upper Snake Rock watershed lies at the western most extent of the Upper Snake Province. It is relatively small, containing only 625,214 acres (2,530 km2). At its western extent, this watershed is bounded by Shoshone Falls, which forms a natural barrier to anadromous fish into the Upper Snake Province. Additionally of note is that the Upper Snake Rock watershed contains the Thousand Springs area, where ground water contained within Eastern Idaho’s massive aquifer drains into the Snake River. Additionally, some surface tributaries
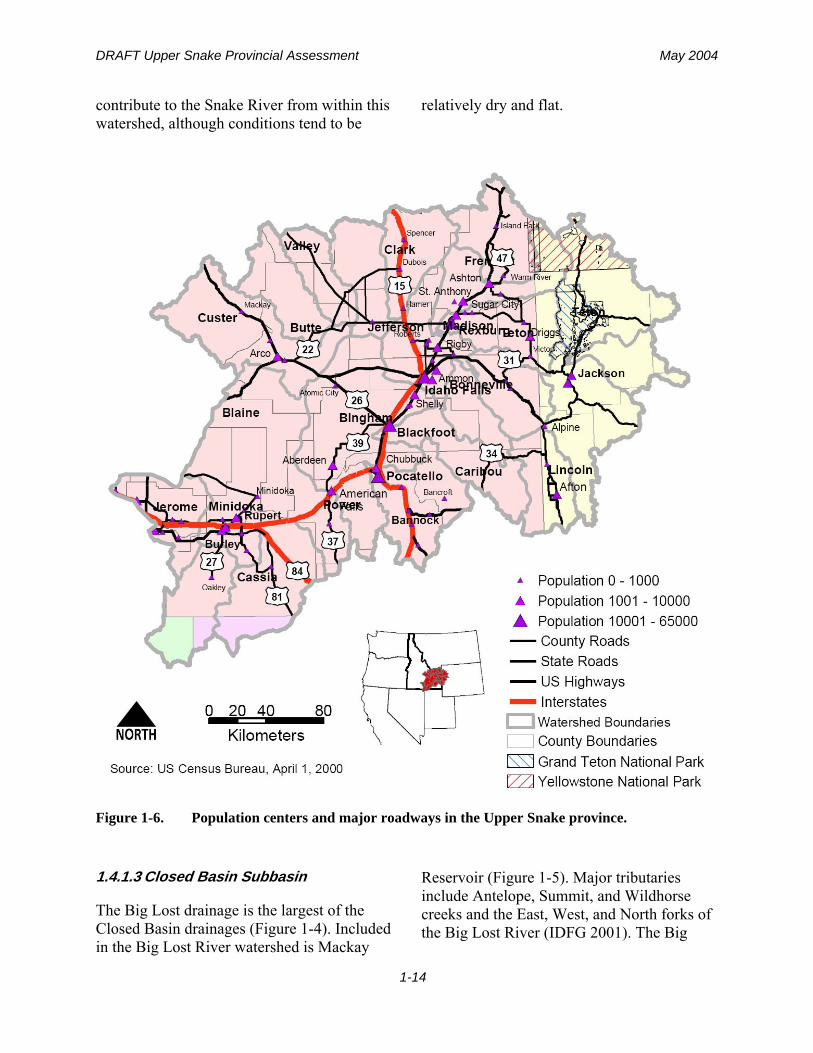
DRAFT Upper Snake Provincial Assessment May 2004
1-14
contribute to the Snake River from within this watershed, although conditions tend to be
relatively dry and flat.
Figure 1-6. Population centers and major roadways in the Upper Snake province.
1.4.1.3 Closed Basin Subbasin
The Big Lost drainage is the largest of the Closed Basin drainages (Figure 1-4). Included in the Big Lost River watershed is Mackay
Reservoir (Figure 1-5). Major tributaries include Antelope, Summit, and Wildhorse creeks and the East, West, and North forks of the Big Lost River (IDFG 2001). The Big

DRAFT Upper Snake Provincial Assessment May 2004
1-15
Lost River originates near Mackay, Idaho, and drains more than 89,600 acres (3,626 km2) of mountainous area bounded by the Lost River Range and Pioneer Mountains to the east and west, respectively. Downstream from Arco, Idaho, water flow in the Big Lost River infiltrates to the Snake River Plain aquifer along the Big Lost River’s channel and at sinks and playas at the river’s terminus. Since 1965, excess runoff has been diverted to spreading areas to protect facilities at the U.S. Department of Energy’s Idaho National Engineering and Environmental Laboratory, where much of the water rapidly infiltrates to the aquifer (Bennett 1990). Total drainage area is approximately 1,269,875 acres (5,139 km2) (Table 1-1).
The Bureau of Land Management administered portion of the upper Big Lost River watershed includes Thousand Springs, near Dickey, Idaho, and Chilly Slough, areas of unique hydrologic and ecosystem expression. In 1987, the Thousand Springs/Chilly Slough Area of Critical Environmental Concern (ACEC) was designated, and its management plan supports the protection and improvement of waterfowl and shorebird habitat. Species using these areas as breeding habitats include sandhill cranes, long-billed curlews, and numerous waterfowl. The Bureau of Land Management has joined with the Idaho Department of Fish and Game, as well as The Nature Conservancy and Ducks Unlimited, to develop a plan for the Chilly Slough Wetland Conservation Project (IDCDC 1999).
The Little Lost drainage is located in eastern Idaho (Table 1-1) on the northern margin of the Snake River Plain. This watershed covers 621,717 (2,516 km2) (Table 1-1). The river is flanked by the Lost River Range to the west and the Lemhi Range to the east. The headwaters of the Little Lost River are located in the far northern corner of the watershed in Sawmill Canyon. The river disappears into an
ephemeral playa, the Little Lost River Sinks, just south of Howe, Idaho, on the margin of the Snake River Plain. The river sometimes drains into the Big Lost River Sinks during times of extremely high runoff (Bartholomay 1990). Elevation in the Big Lost River watershed ranges from 4,777 feet (1,456 m) at the Little Lost River Sinks to 12,198 ft (3,718 m) at the summit of Diamond Peak in the Lemhi Range. The watershed has 17 lakes, 1 reservoir (Summit Creek Reservoir), 3 dysfunctional reservoirs, and several private ponds (Gamett 1990b). All of the lakes in the watershed are small (less than 6 ha or 0.6 km2) mountain lakes.
Like the Big Lost and Big Lost River watersheds, the Birch Creek watershed is a high, northwest- to southeast-trending mountain valley, approximately 460,604acres (1,864 km2) in size (Table 1-1). The Birch Creek Valley is bordered by rugged mountains rising to nearly 11,155 ft (3,400 m) in the Beaverhead Mountains of the Bitterroot Range to the east and the Lemhi Range to the west. Willow Creek and Mud Creek are the major tributaries to Birch Creek, but much of the flow comes from springs high in the valley.
In the Medicine Lodge watershed, there are nearly 99 miles (160 km) of perennial streams, 57% of which are on lands administered by the U.S. Forest Service. Mud Lake/Terreton is the largest community in this drainage (Figure 1-6). At the lower end of the subbasin, Mud Lake actually receives its water from the Beaver-Camas watershed to the east and does not directly receive water from the Medicine Lodge watershed.
Beaver and Camas creeks of the Beaver–Camas watershed arise in the Centennial Mountains on the Idaho–Montana border and flow generally south and southwest, respectively. They converge just north of and provide the much of the water for the Camas

DRAFT Upper Snake Provincial Assessment May 2004
1-16
National Wildlife Refuge near Hamer, Idaho. After exiting the refuge, the combined streamflows westward into Mud Lake, a natural playa lake that was modified with a dam to form a year-round impoundment (Figure 1-5). The Beaver–Camas watershed encompasses 637,285 acres (2,576 km2 ) (Table 1-1).
1.4.2. Hydrology
The diversion dams (shown in Figure 1-7), reservoirs, and canals in the Upper Snake province are operated as a system divided into three water projects or districts. The projects begin with headwater reservoirs at Jackson Lake, Grassy Lake, and Henrys Lake and end with Milner dam and reservoir. Irrigated lands benefiting from these water projects extend downstream from Milner Dam to the town of Bliss, about 60 miles (96.6 km) below Milner Dam and 35 miles (56.3 km) below Shoshone Falls.
The Minidoka Project furnishes irrigation water from five reservoirs with a combined storage capacity of more than 3 million acre-feet. Project works include Minidoka Dam and Lake Walcott, as well as American Falls dam and reservoir. Above the Upper Snake subbasin, the project includes Jackson Lake dam and reservoir, Island Park dam and reservoir, and Grassy Lake dam and reservoir. Two diversion dams, canals, laterals, and drains deliver the water to about 1.1 million acres. American Falls Dam is used as a hydropower generation site by the Idaho Power Company. The Ririe Project is the smallest of the projects. Features of this project are the Ririe dam and reservoir. The project’s principal purpose is flood control. Of the total reservoir capacity (100,500 acre-feet), 80,500 acre-feet serve both flood control and irrigation, 10,000 acre-feet are dead storage, and 10,000 acre-feet are reserved for flood control.
1.4.2.1 Snake Headwaters Subbasin
Much of the eastern and central portions of Grand Teton National Park (particularly areas covered by glacial outwash) have extensive groundwater resources (McGreevy and Gordon 1964, Cox 1974). Water tables vary from near the surface on floodplains to 30 to 60 feet (9.1-18.3 m) below the surface on outwash flats and deeper on most upland areas. Flow is toward the Snake River, and many springs emerge along the Snake River floodplain south of the Buffalo Fork confluence. Numerous springs also emerge from limestone areas in the northwest and southwest portions of Grand Teton National Park. Other springs along the park’s east boundary include several thermal springs near the town of Kelly and East Gros Ventre Butte, Wyoming. Another series of thermal springs are on the west side of Jackson Lake and may be associated with the Teton fault. Approximately 1.98 million acre-feet of water (average daily flow = 2,740 cfs) flow out of the National Park annually by way of the Snake River. Annual flow of the Gros Ventre River is about 345,000 acre-feet (average daily flow = 475 cfs). Streamflow is measured at three stations within the National Park: the Snake River below Jackson Lake Dam, Pacific Creek, and Buffalo Fork. The Pacific Creek and Buffalo Fork stations are under special use permit (U.S. Geological Survey). The Snake River station is on Bureau of Reclamation-withdrawn lands. Occasional streamflow measurements have been made for other streams in the National Park, but made systematically for only 15 years on the Gros Ventre River. Streamflow data are recorded in U.S. Geological Survey annual reports of water resources data.
Naturally occurring surface hydrologic features found on or influencing the National Elk Refuge include the Gros Ventre River, Flat Creek, Cache Creek, Nowlin Creek, and several other small creeks and springs. There
DRAFT Upper Snake Provincial Assessment May 2004
1-17
are two major streams flowing through the refuge. The Gros Ventre River forms much of the northern boundary, and Flat Creek, flowing east to west, nearly bisects the refuge. As Flat Creek approaches the western boundary of the refuge, it turns south and leaves the refuge in the southwest corner. The National Elk Refuge contains approximately 1,641 acres (6.6 km2) of wetlands consisting primarily of palustrine emergent and, to a lesser degree, scrub-shrub and aquatic bed wetlands. Refuge wetlands are some of the most diverse and important in the valley due to their multifunctional character, visual qualities, and importance to a wide variety of wildlife, especially resident and migratory birds. The majority of the wetlands on the refuge are located within the Nowlin Management Unit, which contains approximately 1,300 acres (5.3 km2) of the emergent wetlands. The remaining 300 acres (1.2 km2) can be found scattered throughout the refuge, often in the form of linear palustrine emergent or scrub-shrub wetlands along the banks of watercourses or in the form of unconsolidated bottom wetlands associated with seasonal watercourses.
The primary drainage for streams and groundwater in the Palisades watershed is the South Fork Snake River. The Bureau of Land Management and Targhee National Forest describe three general sections that characterize the stream corridor of the South Fork Snake River in this watershed (BLM and TNF 1991). From Palisades Dam downstream to Squaw Creek, the river follows a single channel through a narrow mountain valley cut into surrounding terraces, which rise steeply and abruptly transition to the uplands. Downstream from Squaw Creek, the river begins showing complex floodplain features, with side channels and islands, but the river bottom is narrow and flows through a rugged canyon. No road or foot traffic is possible along this stretch. The final stretch of the South Fork Snake River in this watershed
flows through a narrow canyon, but the river has several large river bars and numerous islands (BLM and TNF 1991).
Tributary flows are not regulated. The mountainous character of most of the Palisades watershed contributes to the natural stream discharge. The runoff pattern is dominated by snowmelt, which contributes to daily as well as seasonal variations in streamflow measurements. Flows are usually highest during spring runoff. Occasional summer thunderstorms sometimes increase tributary streamflow, but generally the lowest flows are in summer, fall, and winter (Drewes 1991).
Management of Palisades Reservoir currently regulates the water level and volume of the South Fork Snake River. The building of Palisades Dam was authorized primarily to store irrigation water, and the reservoir currently maintains an active storage capacity of 1,200,000 acre-feet. When the dam was completed in 1956, the upper portion of Swan Valley was inundated, and the flow rate of the river has been directed by irrigation needs since reservoir management began in 1957. Palisades Reservoir is also managed for flood control, power generation, recreation, and wildlife conservation. Water supply and demand are affected not only by weather, but also by storage holdover and water rights, and so analysis of average annual streamflow will not indicate natural hydrological trends for the South Fork Snake River (BLM and TNF 1991).
Composite hydrographs of mean daily discharge of the South Fork Snake River at the Heise gauging station were used to compare pre-Palisades Dam years to post-dam years to demonstrate altered flow patterns (Merigliano 1996). After the dam began controlling water discharge in 1957, three significant flow alteration trends appear on the comparative hydrographs. First, in post-

DRAFT Upper Snake Provincial Assessment May 2004
1-18
dam years, comparatively more water is released earlier in the spring, prior to snowmelt runoff, than was released in pre-dam years. Secondly, in post-dam years, throughout the late spring and summer months, larger peak flows that could lead to flooding are reduced. Finally, flows lower than those of pre-Palisades Dam conditions generally occur during fall and winter months while the reservoir is filling. Although the frequency of moderate flows has remained similar to that indicated in pre-dam data, the timing of these flows has changed. Moderate flows are the most efficient at transporting sediments over time, and the frequency of moderate flows has not changed significantly with operation of the dam.
Eighteen U.S. Geological Survey gages are located in the Palisades watershed. The two gages operating for the longest period of record and having the capability for reporting real time data are both below the dam on the South Fork Snake River near Irwin and Heise (Table 1-2). As shown in Table 1-2, the average annual discharge for the South Fork Snake River near Irwin is 6,578 cfs for the period 1935 to 1999, while the average annual discharge near Heise is 7,037 cfs for 1911 to 1999. Since Palisades Reservoir is managed primarily for irrigation needs (BLM and TNF 1990), the minor decrease in the lowest annual streamflows at the downstream Heise gage may be due to irrigation withdrawals.
Table 1-2. Flow statistics for data of record from U.S. Geological Survey gages near Heise and Irwin, Idaho (source: USGS 2004).
Station Name Station Data Years Average Annual (cfs)
Highest Annual
(cfs)
Lowest Annual
(cfs) Snake River near Irwin, ID 13032500 1935–1999 6,578 10,710 4,394 Snake River near Heise, ID 13037500 1911–1999 7,037 11,590 4,117
Drainage patterns are complex, but most of the major streams within the Palisades watershed exhibit dendritic, or branching, drainage patterns (USGS 1996), with some parallel drainage patterns in the Fall Creek region.
1.4.2.2 Upper Snake Subbasin
River systems and their drainage patterns in the Upper Snake subbasin are a result of water moving across areas of recent volcanic activity and uplifted mountains. The Lake Bonneville basin of western Utah, southern Idaho, and eastern Nevada had major influence on the subbasin’s fisheries resources. The Lake Bonneville floods spilled over into the Portneuf River drainage and then
to the Snake River near Pocatello, Idaho, about 14,500 years ago. The event left its mark on the landscape of the Portneuf and Upper Snake–Rock watersheds (Malde 1968). In a few square miles of flat valley bottom near Soda Springs, Idaho, streams drain south to the Bear River and Lake Bonneville basin and north to the Blackfoot and Portneuf watersheds of the Upper Snake subbasin. Within the last million years, basaltic flows dammed and diverted the Bear River away from the Portneuf and Snake river drainages.
In general, streams or waterbodies within the Upper Snake subbasin may be divided into perennial and intermittent waterbodies. Each of these may be further subdivided into springs, streams, aqueducts, and

DRAFT Upper Snake Provincial Assessment May 2004
1-19
lakes/reservoirs or canals (Table 1-3) Intermittent streams comprise 46.4% of the total stream kilometers; canals, 35.4%; and perennial streams, 15.2%.
American Falls Reservoir, a Bureau of Reclamation project with power generation by
Idaho Power Company, is the largest and lowest reservoir in the Upper Snake subbasin. Water discharges into the reservoir basin from springs between Blackfoot and the Fort Hall Bottoms, and flows of the Snake and Portneuf rivers reliably refill American Falls Reservoir (1.67 million acre-feet) each year.
Table 1-3. Perennial and intermittent water bodies of the Upper Snake subbasin (Buhidar 1999). Prepared by Idaho Department of Environmental Quality-Twin Falls Regional Office from U.S. Geological Survey GIS maps via ArcView 1996. (Note: a canal is a manmade conveyance structure used to carry irrigation water from a recognized point of diversion. Natural streams, which may at times convey irrigation water, are not considered canals under the current definition. Aqueducts are defined as conduits or artificial channels that convey water above the surface across a river or hollow.)
Waterbody Kilometers Percentage (%) of Total Perennial Waterbodies
Springs 10 0.20 Streams 797 15.18 Aqueducts 1 0.02 Lakes and reservoirs 143 2.73
Subtotal 952 18.13 Intermittent Waterbodies
Springs 5 0.10 Streams 2,436 46.37 Aqueducts 1 0.03 Canals 1,858 35.37
Subtotal 4,301 81.87 Total 5,253 100.00

DRAFT Upper Snake Provincial Assessment May 2004
1-20
Figure 1-7. Locations of dams in the Upper Snake province.
Several hydroelectric power generation plants also operate in the Upper Snake subbasin. The Minidoka Power Plant (28.5 megawatts) serves the pumped irrigation requirements on and near the Minidoka Project. Power not needed for Bureau of Reclamation project purposes is marketed in the Federal Southern Idaho Power System administered by the Bonneville Power Administration. Idaho Power Company operates three hydroelectric power generation plants (IPC 2003). Plants at American Falls Dam generate
112,420 kilowatts, while Milner Dam generates 59,448 kilowatts and Shoshone Falls generates 12,500 kilowatts.
Much of the upper Henrys Fork hydrologic unit discharge (75% of base flow at Island Park and 45% of base flow at Ashton) originates as springs on the eastern edge of the Island Park Caldera (Whitehead 1978). These springs are ecologically important during winter, when they provide thermal refugia for fish and open water areas for waterfowl (Table 1-4). During summer, fish

DRAFT Upper Snake Provincial Assessment May 2004
1-21
also find thermal refugia in the springs, which remain cooler than adjacent streams affected by surface area. Springs located upstream of Island Park Dam, including Big Springs and
Lucky Dog Springs, provide a constant, dependable discharge used to fill Island Park Reservoir (Benjamin and Van Kirk 1999, Benjamin 2000).
Table 1-4. Temperatures and discharge rates of the Henrys Fork springs (data from Benjamin 2000).
Spring Temperature (°C) Discharge (m³/s) Lucky Dog 12.6 0.8 Big Springs 12.5 5.4 Buffalo River 11.3 1.1 Chick Creek 11.0 0.4 Snow Creek 5.5 0.4 Warm River 12.0 5.6
1.4.2.3 Closed Basin Subbasin
Most of the watersheds within the Closed Basin subbasin have a somewhat similar hydrological regime. All have a large variety of streams, from streams with natural, steady, thermal springs to high-intensity runoff streams receiving snowmelt directly from high mountain ranges. Much of the land in each watershed is semiarid steppe, but there are also many miles of ephemeral and intermittent drainages. Many subdrainages never enter the waterways because of topographic barriers, irrigation withdrawals, and channel bed losses. There are seven U.S. Geological Survey streamflow gages in the Closed Basin subbasin. All are on the Big Lost River.
The average streamflow in the Big Lost River below Mackay Reservoir for the 83-year period of record (water years 1905, 1913–1914, and 1920–1999) was 225,500 acre-feet per year (Brennan et al. 2000). Streamflow in the Big Lost River below Mackay Reservoir was 274,900 acre-feet during the 1999 water year (Brennan et al. 2000). Annual peak streamflow measured below Mackay
Reservoir varies by as much as a factor of six. Recharge to the Snake River Plain aquifer can be substantial downstream from Arco; measured infiltration losses at various discharges ranged from 1 to 28 cfs/mile (Bennett 1990).
1.4.3 Geology
1.4.3.1 Snake Headwaters Subbasin
Anticlinal and synclinal structures of the Snake Headwaters subbasin in combination with fault thrust zones give rise to an intricate system of linear valleys and ridges (see Figure 1-8 for major geological formations within the province). The mountains are characterized by tight-to-open folded Paleozoic and Mesozoic sedimentary rocks (Ross and Savage 1967). The largest continual coverage of any one geological unit occurs in the Idaho Falls watershed where 72% of the land is Pleistocene to Pliocene basalts and associated tuffs and volcanic detritus. Peaks within the Snake Headwaters watershed exceed 14,436 ft (4,400 m) due to the faulting and tilting of the blocks that resulted in a very steep escarpment along the

DRAFT Upper Snake Provincial Assessment May 2004
1-22
east face of the Teton Range and a gentler slope on the west side. Deep, glacier-carved canyons cleave the mountains, and several canyons have large, morainal lakes at their mouths. Alpine lakes and tarns are numerous. The core of the Teton Range is metamorphic gneisses and schists and igneous rocks (granite and pegmatite).
The extent of mineral resources in Grand Teton National Park is poorly known. The two easternmost townships may have coal deposits of some value. Half of the park may have oil and/or gas deposits. Other possible minerals include phosphate, bentonite, asbestos, gold, lead, and silver (Austin et al. 1976). The federal Soil Conservation Service (now called the Natural Resources Conservation Service) has classified and mapped 44 soil series in Grand Teton National Park (Young 1982).
Within the boundaries of the National Elk Refuge, over 20 different soil types occur (Young 1982). Soils on the refuge at lower elevations are alluvial, generally sandy loam or loam, and are shallow and permeable. The soils at higher elevations are also loamy, but considerable areas of gravelly soils and cobblestone occur on the south slopes and ridges. The northern half of the refuge consists of steep rolling hills; the southern half is glacial outwash material, with one
resistant formation (Miller Butte) rising approximately 502 feet (153 m) above the valley floor.
Geological forces created a distinctive topographic trend along a northwest to southeast axis (USGS 1992), with mountain ranges to the southwest and northeast of the South Fork Snake River and valley flats between the ranges (Figure 1-8). An overthrust belt that was active during formation of the Rocky Mountains pushed from the southwest through layers of sedimentary bedrock to form the Caribou Range. High angle block-faulting events cut into this overthrust belt to create typical Basin and Range topography. These characteristics place the Palisades watershed in the Middle Rocky Mountains Hypsographic Province, with block-faulting influence from the Basin and Range Province to the south (Alt and Hyndman 1989). Igneous rocks of volcanic flows (where rhyolite and rhyolitic tuff are the dominant igneous rocks associated with extrusive flows and dissected shields); overthrust structures of sandstone, shale, limestone, and dolomite; glacial depositional/erosional cycles and deposits of alluvium at the base of block faults (Merigliano 1996); and hard Mesozoic sedimentary bedrock, mostly limestone, compose part of the geomorphology of the Palisades watershed.

DRAFT Upper Snake Provincial Assessment May 2004
1-23
Figure 1-8. Major geological formations within the Upper Snake province.
1.4.3.2 Upper Snake Subbasin
In general, the Upper Snake subbasin has a land-surface form or topography that consists of tablelands with medium to high relief (Figure 1-8). The plains have hills or low mountains. The Snake River canyon is a steep-sided trench, cut into the relatively flat surrounding plain. Shoshone Falls is a 212-foot-tall (64.6 m) natural waterfall located about 2.7 miles (4.3 km) downstream of Twin Falls Dam. It is recognized as a natural barrier to upstream migration of native fish species (FERC 1997a).
The elevation within the Upper Snake subbasin also describes the varying topography of the subbasin. In the northwestern portion, the Clover Creek drainage begins at 6,400 feet (1,951 m) in the Bennett Hills. In the southeastern portion of the subbasin, the Rock Creek drainage begins at 7,700 feet (2,347 m)in the Sawtooth National Forest and drains northward to the Snake River at about 3,500 feet (1,067 m). Geology is characterized largely by basalt flows in the lowlands of the central and southern parts of the subbasin and by intrusive volcanic, sedimentary, and metamorphic rocks in the uplands and mountains to the north, south, and east.

DRAFT Upper Snake Provincial Assessment May 2004
1-24
In the Upper Snake subbasin, alkalization of the area lets the soil water bring salts and alkalis to the surface, where they then evaporate, leaving a whitish crust. This alkalization and evaporation process has produced salty desert soils (or Aridisols) in many areas of subbasin. In general, the subbasin is comprised of soils that are 87% Aridisols and 13% Mollisols. Aridisols are mineral soils that have developed in dry regions. They are light colored and low in organic matter and may have accumulations of soluble salts and lime. The lower the precipitation, the more likely these accumulations are to be near the surface. Of the Aridisols and Mollisols in the subbasin, about 35% are loess (or buff-colored calcareous silt transported as wind deposits), while the remaining 63% contain residium (or residual soil that is developed from the weathering of rock directly beneath it), colluvium (loose and incoherent deposits at the base of slopes or cliffs brought there by gravity), and alluvium (deposits of silt or silty clay laid down during times of flooding).
The volcanic features present in the Upper Henrys Fork, Lower Henrys Fork, and Teton watersheds were created between about four million and 600,000 years ago as a “hot spot” of volcanism moved northeastward through the region (Hackett and Bonnichsen 1994). This hot spot now lies under Yellowstone National Park. The oldest volcanic formations in the watershed are those associated with the Snake River Plain: an 80- to 110-km-wide crescent of lava covering most of southern Idaho. The Island Park region lies at the transition between the basalts of the Snake River Plain and the more recent rhyolite flows of the Yellowstone Plateau (Christiansen 1982, Christiansen and Embree 1987). The Island Park Caldera consists of three smaller calderas formed by cycles of volcanism occurring between two million and 600,000 years ago. The Madison and Pitchstone plateaus on the northeastern edge of the
watersheds were formed by rhyolite flows that erupted from the Yellowstone hot spot about 600,000 years ago (Benjamin 2000).
1.4.3.3 Closed Basin Subbasin
The Closed Basin subbasin occurs within the Northern Rocky Mountain and Columbia Intermontane geomorphic provinces. The subbasin encompasses 16 major geological formations. Four geological features are predominant: Quaternary alluvial deposits, Pleistocene to Pliocene basalts and associated tuffs and volcanic detritus, Paleozoic and Mesozoic mixed sedimentary rocks, and Eocene mixed silicic and basaltic ejecta, flows, and reworked debris. The Beaver–Camas watershed is composed mainly of Pleistocene to Pliocene basalts and associated tuffs and volcanic detritus. Quaternary alluvial deposits are the dominant geological feature in the Big Lost, Birch, Little Lost, and Medicine Lodge watersheds.
Topographical relief of the subbasin is reflective of a terrain that once attained a mature erosional level (by the Middle Tertiary) and subsequently uplifted, thus reinitiating stream erosional processes (Ross and Savage 1967). Quaternary glaciation occurred primarily on isolated high-elevation peaks. Alpine glacier systems formed in the Pioneer Mountains, Lost River Range, Lemhi Range, and Centennial Mountains. Large-scale, glacially derived physiographic features (for example, broad U-shaped valleys) are not prominent. Rather, stream erosion has played the predominant role in shaping the physiography of the mountainous regions of the subbasin. Stream erosion since the Middle Tertiary has given rise to topography characterized by relatively narrow, V-shaped valleys; steep valley side slopes; and relatively broad, gentle ridge systems. Lower portions of the Big Lost, Little Lost, and Birch Creek watersheds and much of the Medicine Lodge and Beaver–Camas
DRAFT Upper Snake Provincial Assessment May 2004
1-25
watersheds encompass the lava-filled structural and topographical basin of the upper Snake River Plain. The young lava plateau of converging low shield volcanoes is punctuated by cinder cones and low lava ridges and mantled by a thin layer of wind-blown soil (Ross and Savage 1967).
1.4.4 Climate
The climate in the Upper Snake province is influenced by interactions between prevailing southwesterly winds and the typically north–south orientation of mountain ranges. Pacific maritime-influenced climatic conditions prevail in the high-elevation regions of the province; continental climatic conditions prevail in the low-elevation broad valleys and plains. Precipitation is relatively evenly divided between cold winters and warm summers but is usually characterized by a large early-winter peak in higher elevations. Average annual precipitation exceeds 25 inches (63.5 cm) along the Continental Divide and is approximately 8 to 10 inches (20-25 cm) at the lower elevations. The vast majority of discharge in the province’s streams is derived from snowfall at elevations higher than 6,234 ft (1,900 m). July, August, and September are normally the driest months. Topography is a primary influence on climate in areas along the Continental Divide and in mountain ranges including the Lemhi Range, Lost River Range, and Pioneer Mountains.
Some of the lowest temperatures in the United States have been recorded in this region. A temperature of –63 °F (-52.8 °C) was recorded on February 9, 1933, in Jackson Hole, Wyoming. The lowest temperatures ever recorded for the months of February, March, July, September, October, and December were also recorded in the Snake Headwaters subbasin. Average annual temperatures during July, the warmest month, are typically near 70 °F (21 °C). Summer
temperatures in excess of 100 °F (38 °C) are common.
1.4.4.1 Snake Headwaters Subbasin
The climate of the Snake Headwaters subbasin is influenced by interactions between prevailing southwesterly winds and the typically north–south orientation of mountain ranges (McNab and Avers 1994). Pacific maritime-influenced climatic conditions prevail in high-elevation regions of the subbasin. In these regions, precipitation occurs primarily as snow during winter. Summers are relatively short, cool, and dry. In contrast, on low-elevation broad valleys and plains of the subbasin, continental climatic conditions are prevalent. Precipitation is relatively evenly distributed between the cold winters and warm summers. Continental climatic conditions are particularly pronounced within the Palisades and Salt watersheds.
The climate of the Upper Snake province above Palisades Dam is very much dependent upon topography. For the most part, the region is mountainous, except for the valley of the Salt River, called Star Valley, and Jackson Hole. The entire basin is above 6,000 feet (1,829 m), except for a small part of the lower Star Valley and the area immediately around Palisades Reservoir. Because of this scheme, the Palisades watershed experiences long, cold winters and pleasantly mild summers. Freezing temperatures have occurred in all months of the year, and most areas have a freeze-free season of fewer than 30 days.
Precipitation varies widely depending on elevation. From Palisades Dam upstream to both Afton and the Star Valley and Jackson in Jackson Hole, annual amounts are between 15 and 20 inches (38-51 cm). Most precipitation in valleys occurs as snow from November through March, with some snowfalls

DRAFT Upper Snake Provincial Assessment May 2004
1-26
occurring as early as August or as late as June. In the high country, annual precipitation varies from about 20 inches (51 cm) on lower slopes to over 70 inches (179 cm) on the Pitchstone Plateau in Yellowstone Nation Park and other mountain areas over 9,000 feet (2,743 m). Snow can occur anytime throughout the year, although the period of significant snow accumulation extends from late October through April. Annual snowfall can vary from about 55 inches (140 cm) in the vicinity of Palisades Dam, to 80 inches (203 cm) at Afton and Jackson, to about 120 inches (305 cm) at Moran. Above Jackson Lake, snowfall increases significantly with increasing elevation, especially in the northern part of the basin. More than 500 inches (1,270 cm) of snow falls annually over the Pitchstone Plateau in Yellowstone National Park and in mountains north and east of Jackson Lake. Lower-elevation mountains can receive between 200 and 400 inches (508-1,016 cm) a year. The greatest flood potential occurs when heavy spring rains fall during the snowmelt season from late May through July. Precipitation during the warm season falls mostly from showers and thunderstorms. Thunderstorms are frequent from June through August, occurring, on average, on about half the afternoons. Precipitation amounts from individual storms are relatively small. The greatest daily precipitation recorded during summer at any of the stations in the subbasin was 2.56 inches (6.5 cm) at the Snake River Range Station on July 24, 1913.
1.4.4.2 Upper Snake Subbasin
The climate of the Upper Snake subbasin is semiarid with low annual rainfall, moderately hot and dry summers, moderate to cold winters, and relatively windy springs. Average annual precipitation is 11 inches (27 cm) and may vary from 50 to 150% of the mean. In general, precipitation is fairly consistent throughout the year, except in July
through September, when the total for the three months may be less than 1 inch (< 3 cm). More recently, from 1991 to 1996, annual precipitation of 9.6 inches (28.4 cm) was higher than the historical normal of 10.5 inches (26.7 cm) due to above normal snows and rains in winter and spring (AgriMet 1994).
Average annual air temperature ranges from 40 to 51 °F (100 °C). January and July are typically the coldest and warmest months, with average temperatures of 29.4 °F and 72.7 °F, respectively. During summer, temperatures in excess of 100 °F are common (AgriMet 1994).
The climate of the Upper Henrys Fork subbasin is primarily arid to semiarid and characterized by subfreezing winters and cool summers. Mean annual temperature ranges from about 41.53 °F (5.3 °C) at the lowest elevations to less than 343 °F (<1 °C) at the highest elevations. Mean annual precipitation ranges from 12 inches (30 cm) at low elevations to greater than 40 inches (100 cm) at higher elevations (Van Kirk and Benjamin 2000). Precipitation is nearly uniformly distributed throughout the year at the lowest elevations but exhibits a large early-winter peak at the higher elevations. May and June are the wettest months at lower elevations, whereas November, December, and January are the wettest months in the mountains. The vast majority of discharge in the subbasin’s streams is derived from snowfall at elevations higher than 6,234 ft (1,900 m) (Van Kirk and Benjamin 2000).
1.4.4.3 Closed Basin Subbasin
Due to the large range in elevation, from the Continental Divide down to the Lost River Sinks on the Snake River Plain, temperatures and precipitation vary significantly throughout the subbasin. The average annual precipitation exceeds 64 cm on the

DRAFT Upper Snake Provincial Assessment May 2004
1-27
Continental Divide and high mountains but is 25 cm at Mud Lake. Thirty years of precipitation monitoring at the U.S. Department of Agriculture’s Dubois Experimental Station, representative of a mid-elevation band within the Medicine Lodge watershed, shows the average annual precipitation at 33 cm, with an average monthly peak of 5 cm in June and an average monthly low at 2 cm in February. Weather records for the Idaho National Engineering and Environmental Laboratory, located at the lowest elevation in the subbasin, show a 40-year annual average precipitation (Clawson et al. 1989) of 22 cm at the southern (highest) end and 20 cm at northern end near the Lost River Sinks. The climate and landscape of this area are semiarid steppe. Day winds on the Snake River Plain and the Medicine Lodge and Beaver–Camas watersheds are primarily from the southwest, while night winds, generally reversed, are from the northeast (Clawson et al. 1989). Winds in the Big Lost, Little Lost, and Birch Creek valleys usually parallel and blow up valley in the daytime and down valley at night. As in other high-elevation, interior continent environments, there are significant daily and annual temperature fluctuations. Recorded high and low temperatures on the Idaho National Engineering and Environmental Laboratory are 102 °F (39 °C) and −47 °F (-43.9 °C), respectively.
1.5 Biological Description
1.5.1 Aquatic Species
The Snake River ecosystem has undergone significant transformation from a primarily free-flowing, coldwater system to a slower-moving, warmer system. Consequently, this change has impacted many of the native aquatic species. Species present in the Snake River system are vulnerable to continued adverse habitat modification and deteriorating water quality from one or more of the
following: hydroelectric development, load-following (the practice of artificially raising and lowering river levels to meet short-term electrical needs by local run-of-river hydroelectric projects) effects of hydroelectric project operations, water withdrawal and diversions, water pollution, inadequate regulatory mechanisms, and possible adverse effects of introduced exotic species.
1.5.1.1 Invertebrate Species
Over 40 native mollusc species reside in the mainstem Snake River and adjacent springs (Bowler and Frest 1992). Five snails are listed under the Endangered Species Act (ESA), and three others are classified as species of concern (Table 1-5). The listed snails are primarily limited to the Snake River basin below American Falls Dam and are generally intolerant of pollution, though they have divergent habitat preferences. The California floater (Anodonta californiensis) and three of the snails listed under the ESA are known to occur in the Upper Snake province: the Utah valvata snail (Valvata utahensis), Bliss Rapids snail (Taylorconcha serpenticola), and Snake River physa snail (Physa natricina).
The numerous springs that arise within the Snake River canyon provide a unique habitat that has been geologically isolated for several thousand years. This isolation has caused populations of molluscs to evolve as separate species that are found only within this reach of the Snake River and some of the adjacent springs. These native, coldwater snails appear to have decreased in numbers, while more pollution-tolerant, introduced species such as the New Zealand mudsnail (Potamopyrgus antipodarum) have increased in numbers. The New Zealand mudsnail is a relatively new invasive snail that has rapidly expanded its range and tends to dominate the invertebrate community in many locations of the Snake River (Bowler 1991, Royer et al. 1995).

DRAFT Upper Snake Provincial Assessment May 2004
1-28
Table 1-5. Threatened (T), endangered (E), and sensitive mollusc species found in the Snake River. (Note: W = watch species, species of concern to the U.S. Fish and Wildlife Service (USFWS) but without formal federal status.)
Species Common Name Species Scientific Name ESA Listing or USFWS Concern Status
Bliss Rapids snail (Taylorconcha serpenticola) T Idaho springsnail (Pyrgulopsis idahoensis) E Utah valvata snail (Valvata utahensis) E Snake River physa snail (Physa natricina) E Banbury Springs limpet (Lanx sp.) E Giant Columbia River limpet (Fisherola nuttalli) W California floater (Anodonta californiensis) W Columbia pebblesnail (Fluminicola fuscus) W
1.5.1.2 Fish Species
A relatively small number of coldwater fish species, primarily Catostomidae (suckers), Cottidae (sculpins), and Rhinichthys (dace), are native to the Upper Snake River above Shoshone Falls (Table 1-6). Other native nonanadromous species include Yellowstone cutthroat trout (Oncorhynchus clarki
bouvieri), finespotted cutthroat trout (O. clarki spp.), mountain whitefish (Prosopium williamsoni), Utah chub (Gila atraria), and leatherside chub (G. copei). White sturgeon (Acipenser transmontanus) and rainbow trout (O. mykiss) do not migrate above Shoshone Falls but have been introduced to various waterways in the province.
Table 1-6. Fish species present in the Snake River above Shoshone Falls (Buhidar et al. 1999). (Note: N = native origin; I = introduced origin.)
Family Taxonomy Species Taxonomy Common
Name Scientific
Name Common Name Scientific Name Origin
Sturgeon Acipenseridae White sturgeon Acipenser transmontanus I Mountain whitefish Prosopium williamsoni N Yellowstone cutthroat
trout Oncorhynchus clarki
bouvieri N
Finespotted cutthroat trout Oncorhynchus clarki ssp. N Rainbow trout Oncorhynchus mykiss I Utah chub Gila atraria N Leatherside chub Gila copei N Longnose dace Rhinichthys cataractae N
Trout Salmonidae
Speckled dace Rhinichthys osculus N

DRAFT Upper Snake Provincial Assessment May 2004
1-29
Family Taxonomy Species Taxonomy Common
Name Scientific
Name Common Name Scientific Name Origin
Redside shiner Richardsonius balteatus N Utah sucker Catostomus ardens N Sucker Catostomidae Mountain sucker Catostomus platyrhynchus N
Sculpin Cottidae Mottled sculpin Cottus bairdi N Coho salmon Oncorhynchus kisutch I Golden trout Oncorhynchus aguabonita I Brown trout Salmo trutta I Brook trout Salvelinus fontinalis I Lake trout Salvelinus namaycush I Arctic grayling Thymallus arcticus I Carp Cyprinus carpio I Grass carp Ctenopharyngodon idella I Spottail shiner Notropis hudsonius I Fathead minnow Pimephales promelas I Brown bullhead Ameiurus nebulosus I Blue catfish Ictalurus furcatus I
Trout Salmonidae
Channel catfish Ictalurus punctatus I Livebearer Poeciliidae Mosquitofish Gambusia affinis I
Pumpkinseed Lepomis gibbosus I Bluegill Lepomis macrochirus I Smallmouth bass Micropterus dolomieu I Largemouth bass Micropterus salmoides I
Sunfish Centrarchidae
Black crappie Pomoxis nigromaculatus I Yellow perch Perca flavescens I Perch Percidae Walleye Stizostedion vitreum I
A native nongame species, the leatherside chub, is also listed by the Idaho Department of Fish and Game as a species of special concern1. This fish has a limited distribution in the Upper Snake subbasin and may never have been abundant. Populations of leatherside chub occur in the Goose Creek 1 In March 2004, the Idaho Departmenr of Fish and Game Commission voted to eliminate the conservation category, Species of Special Concern. This change is expected to take place July 1, 2004.
and Raft River drainages, near the lower end of the Upper Snake subbasin. In 2000, Caribou National Forest biologists found leatherside chub in the upper Blackfoot River tributary of Angus Creek.
The Snake River from American Falls Dam to the mouth of Raft River has long been considered a quality trout fishery and recently produced a quality smallmouth bass population. From Eagle Rock to the mouth of Raft River, the river is actually the backwater of Lake Walcott behind Minidoka Dam. This

DRAFT Upper Snake Provincial Assessment May 2004
1-30
area is a quality trout and bass fishery especially when fish are washed into the river from American Falls Dam and upriver water quality is poor and/or water quantity is low. A portion of the river between Raft River and Cold Creek is within the Minidoka National Wildlife Refuge, and boaters are prohibited from entering this area.
In addition to trout, this river reach contains a sturgeon fishery that was newly developed during the 1990s. Bass fishing is most common in the lower portion of this reach, and sturgeon fishing is best in the first deep pool downriver from American Falls Dam.
There is no surface water connection between waters within the Closed Basin subbasin and the Snake River. However, a number of nonnative species, all salmonids, were introduced into the Closed Basin subbasin, and most of those species are still present. Most of the fisheries within the Closed Basin subbasin are artificially sustained. Few sustaining populations of native, resident fish remain. Rainbow trout (Oncorhynchus mykiss) of generally small size are the predominant fish throughout the Closed Basin drainages, except for some headwaters and a few minor tributaries where brook trout are dominant. Native bull trout (Salvelinus confluentus) and Yellowstone cutthroat trout are maintaining fishable populations in some limited areas. Mountain whitefish are found only in the Big Lost River watershed.
1.5.2 Wildlife
Many areas within the Upper Snake province support a variety of wildlife species (up to 401 species) including big game, upland game, waterfowl, and nongame species (Appendix 1-1). Wildlife populations in the province tend to fluctuate in response to natural and anthropogenic environmental conditions and habitat changes. Direct wildlife population management (that is, hunting, trapping, etc.) also affects wildlife populations. Wildlife species present in the province include actively managed big game species, native and nonnative game birds, waterfowl, and a larger number of nongame mammals, birds, amphibians, and reptiles (Appendix 1-1). Gray wolves (Canis lupus) inhabit a portion of the province. Watersheds in the Snake Headwaters and Upper Snake subbasins provide important nesting areas for bald eagles (Haliaeetus leucocephalus) and peregrine falcons (Falco peregrinus) and wintering habitat for trumpeter swans (Cygnus buccinator). The Closed Basin subbasin supports relatively healthy populations of native wildlife (Figure 1-9), primarily because of relatively limited anthropogenic effects. Within the Closed Basin subbasin, areas of high vertebrate richness are in the Little Lost and Birch Creek watersheds.

DRAFT Upper Snake Provincial Assessment May 2004
1-31
Figure 1-9. Vertebrate species richness, where richness was calculated as the number of species predicted to occur within each hexagon.
The wildlife species occurring in the Upper Snake province that are listed as threatened or endangered under the Endangered Species Act (ESA) are the bald eagle, grizzly bear (Ursus arctos horribilis), and Canada lynx (Lynx canadensis). Also present in the province are two experimental populations of endangered species: the gray wolf and whooping crane (Grus americana) (Figure 1-10).
The wolverine (Gulo gulo), present in some of the northern watersheds of the Upper
Snake province, was petitioned for proposal for listing under the ESA; on October 21, 2003, the U.S. Fish and Wildlife Service determined that there was insufficient data for listing the wolverine. The greater sage-grouse and pygmy rabbit (Brachylagus idahoensis) were also petitioned for listing under the ESA, and determinations have not yet been made. The yellow-billed cuckoo (Coccyzus americanus), also found in the province, is currently a candidate species under the ESA.
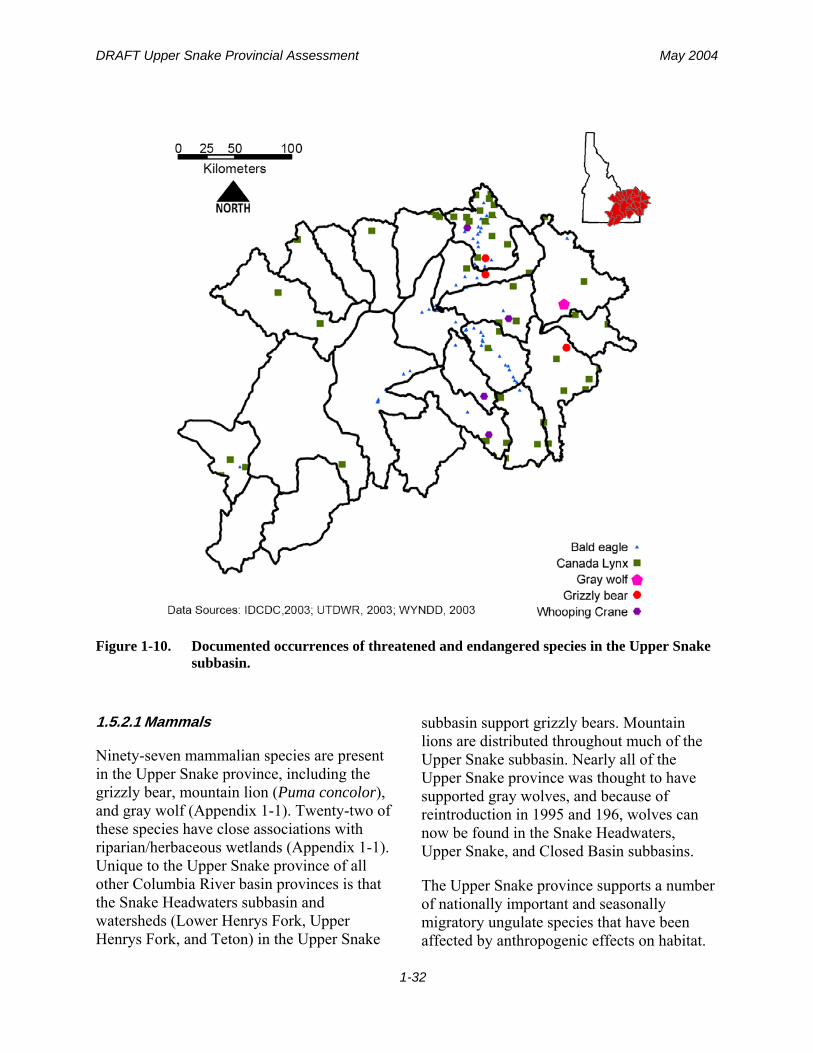
DRAFT Upper Snake Provincial Assessment May 2004
1-32
Figure 1-10. Documented occurrences of threatened and endangered species in the Upper Snake subbasin.
1.5.2.1 Mammals
Ninety-seven mammalian species are present in the Upper Snake province, including the grizzly bear, mountain lion (Puma concolor), and gray wolf (Appendix 1-1). Twenty-two of these species have close associations with riparian/herbaceous wetlands (Appendix 1-1). Unique to the Upper Snake province of all other Columbia River basin provinces is that the Snake Headwaters subbasin and watersheds (Lower Henrys Fork, Upper Henrys Fork, and Teton) in the Upper Snake
subbasin support grizzly bears. Mountain lions are distributed throughout much of the Upper Snake subbasin. Nearly all of the Upper Snake province was thought to have supported gray wolves, and because of reintroduction in 1995 and 196, wolves can now be found in the Snake Headwaters, Upper Snake, and Closed Basin subbasins.
The Upper Snake province supports a number of nationally important and seasonally migratory ungulate species that have been affected by anthropogenic effects on habitat.

DRAFT Upper Snake Provincial Assessment May 2004
1-33
Pronghorn (Antilocapra americana), which occur in the Closed Basin subbasin, are forced onto the Snake River Plain during severe winters, but their access to traditional winter ranges has been impeded by Interstate-15. Under current conditions, the population of this herd increases during light to moderate winters but is decimated during hard winters. The Closed Basin subbasin also historically supported Rocky Mountain bighorn sheep (Ovis canadensis) populations. However, vegetative changes due to livestock use of winter ranges, livestock-related diseases, and indiscriminate harvest by settlers and miners caused bighorn sheep populations to decline. In the Snake Headwaters subbasin, the internationally renowned Jackson elk herd summers on U.S. Forest Service lands but is completely dependent on confinement and feeding during winter due to development and loss of winter range in the Jackson Hole area.
1.5.2.2 Birds
Up to 274 bird species are known to reside or migrate through the Upper Snake province (Appendix 1-1). Of this number, 27 are birds of prey, including 12 owls, 9 hawks, 2 eagles, and 4 falcons. Bald eagle populations are increasing along the Snake River in Wyoming (Harmata and Oakleaf 1992). The South Fork Snake River provides habitat for nesting bald eagle pairs and up to 100 wintering eagles. The peregrine falcon (Falco peregrinus) is found as an occasional visitor and a winter migrant in the American Falls area and upstream to the confluence with the Henrys Fork. Although nesting has not been documented in the American Falls area, suitable habitat and food are present and adequate to support a nesting site (USFWS 1984). The Snake River, up to its confluence with the Henrys Fork, is known to support three peregrine falcon nesting territories. Surveys have documented that more than 28 young have been produced from these sites since 1990. Two of the sites, both located on
the Snake River, have each produced a total of four young since 1990. The third site, located on Palisades Reservoir just north of Alpine, Wyoming, has produced over 20 young.
An Idaho population of whooping cranes was reestablished through introduction at Gray’s Lake National Wildlife Refuge. The population was designated as experimental and nonessential on July 21, 1997. One of the purposes of the experimental reintroduction was to investigate the possibility that sandhill cranes could raise whooping cranes. Whooping crane eggs were translocated into sandhill crane nests, and sandhill cranes successfully raised whooping crane young and taught them seasonal migration routes. However, the whooping cranes wrongly imprinted and never mated, and the experiment was discontinued. Only a few whooping cranes remain in this population.
There are five grouse species in the Upper Snake province (Appendix 1-1). In the late 1990s, sharp-tailed grouse (Tympanuchus phasianellus) were discovered wintering in the Camas Creek drainage. They are the only known sharp-tailed grouse to occur in the Closed Basin subbasin. Few, if any, sharp-tailed grouse are known to reside north and west of the Snake River, mostly due to a lack of wintering habitat. Healthy populations are found south of the Snake River, in the Rock and Bannock creek drainages, but they appear to be highly dependent on the Conservation Reserve Program (CRP). In 1995, intensive searches for sharp-tailed grouse leks located 64 leks. A survey of 59,052 hectares in Bonneville and Bingham counties in 2002 identified 56 sharp-tailed grouse leks and provided a qualitative habitat suitability assessment. The dominant land use in areas where grouse were observed was land enrolled in the Conservation Reserve Program (Stanley et al. 2002).

DRAFT Upper Snake Provincial Assessment May 2004
1-34
The majority of greater sage grouse and their habitats are found north of the Snake River (Figure 1-11). Sage-grouse are highly dependent on sagebrush habitats, including open areas adjacent to sagebrush for use as leks, breeding habitats with a sagebrush canopy of 15 to 25% and sagebrush height of 40 to 80 cm, brood-rearing habitats of 10 to 25% sagebrush canopy and height of 40 to 80 cm, and winter habitats of 10 to 30% sagebrush canopy and height of 25 to 35 cm (Connelly et al. 2000). The Upper Snake province has the best long-term data set on sage-grouse in the region; data on lek routes and production go back to the 1960s. Sage-grouse and sagebrush habitat trends in the Upper Snake province are typical of those across the West. Numbers of sage-grouse and acres of sage-grouse and shrub-steppe habitats have declined, and population trends according to bird surveys are downward.
Eighteen species of ducks, four geese, two swans, and two cranes occur in the Upper Snake subbasin during migration and nesting season (IDFG 1990) (Appendix 1-1). Duck and goose nesting and loafing are primarily on rivers, streams, canals, reservoirs, and small ponds. Historically, ducks and geese utilized these waterways for nesting and resting and foraged in adjacent grain fields. As agricultural practices evolved, many wetlands and forage crops were eliminated, which reduced nesting and feeding areas for ducks. In contrast, the Canada goose (Branta canadensis) has made substantial gains in population levels. With the advent of artificial nest platforms and development of security sanctuaries for Canada geese along the Snake River, goose populations have risen to all time highs.
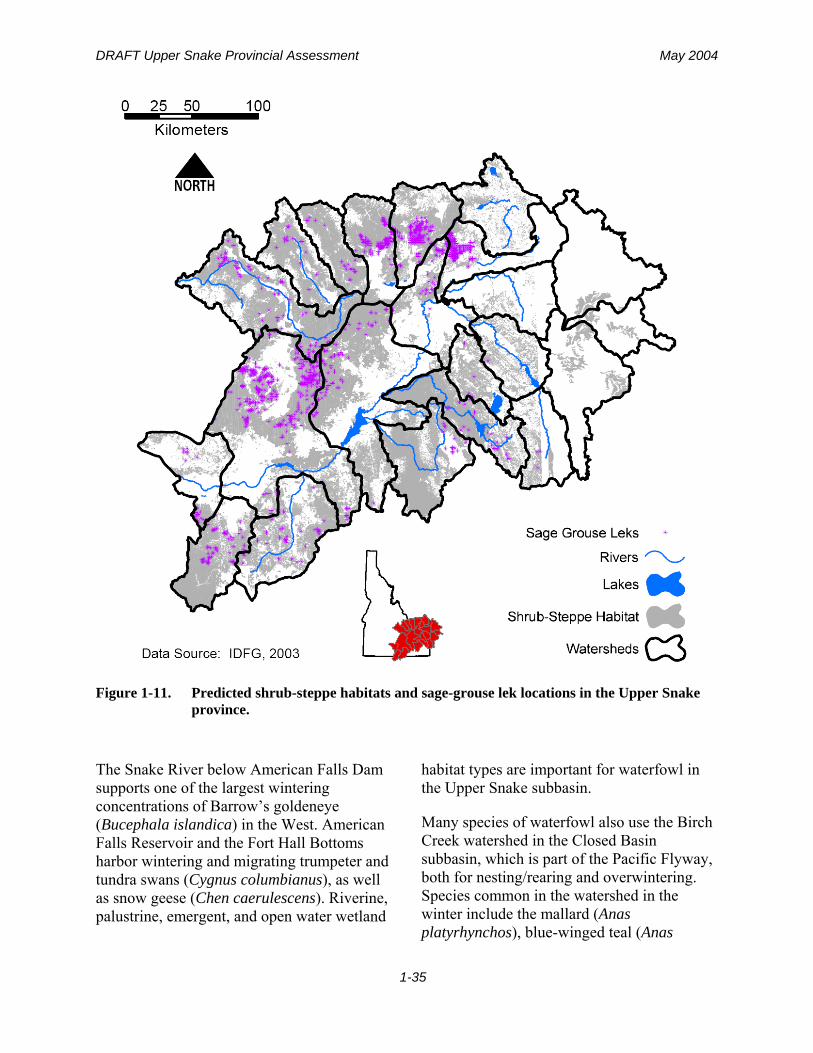
DRAFT Upper Snake Provincial Assessment May 2004
1-35
Figure 1-11. Predicted shrub-steppe habitats and sage-grouse lek locations in the Upper Snake province.
The Snake River below American Falls Dam supports one of the largest wintering concentrations of Barrow’s goldeneye (Bucephala islandica) in the West. American Falls Reservoir and the Fort Hall Bottoms harbor wintering and migrating trumpeter and tundra swans (Cygnus columbianus), as well as snow geese (Chen caerulescens). Riverine, palustrine, emergent, and open water wetland
habitat types are important for waterfowl in the Upper Snake subbasin.
Many species of waterfowl also use the Birch Creek watershed in the Closed Basin subbasin, which is part of the Pacific Flyway, both for nesting/rearing and overwintering. Species common in the watershed in the winter include the mallard (Anas platyrhynchos), blue-winged teal (Anas

DRAFT Upper Snake Provincial Assessment May 2004
1-36
discors), green-winged teal (Anas crecca), common merganser (Mergus merganser), double-crested cormorant (Phalacrocorax auritus), American widgeon (Anas americana), lesser scaup (Aythya affinis), Greater scaup (Anas marila) and Canada goose.
1.5.2.3 Reptiles and Amphibians
The Upper Snake province supports 10 amphibian and 20 reptile species. All amphibian species in the Upper Snake province are closely associated with riparian habitats and all, except for the inland tailed frog (Ascaphus montanus), are closely associated with herbaceous wetlands (Appendix 1-1). The common garter snake (Thamnophis sirtalis) is the only reptile species considered to be closely associated with riparian/herbaceous wetland habitats (Appendix 1-1). Amphibians known or suspected to inhabit the Big Lost River watershed include the inland tailed frog, northern leopard frog (Rana pipiens), western toad (Bufo boreas), Pacific chorus frog (Pseudacris regilla), Columbia spotted frog (Rana luteiventris), and long-toed salamander (Ambystoma macrodactylum). Inland tailed frogs are present and abundant in many streams within the study area (LLRITAT 1998). In good water years, the spadefoot toad (Spea intermountana) occurs in great numbers at the Big Lost River watershed (Reynolds et al. 1986).
1.5.3 Vegetation and Floristic Diversity
Existing vegetation is the plant cover, or floristic composition and vegetation structure, occurring at a given location at the current time (Brohman and Bryant 2003). Potential natural vegetation (sometimes called PNV) is the vegetation that would become established if all successional sequences were completed under the present climatic and edaphic
conditions without interference by people (Brohman and Bryant 2003). Therefore, potential natural vegetation classifications are based on existing vegetation, successional relationships, and environmental factors (for example, climate, geology, soil, etc.) considered together. Potential natural vegetation classification uses information on structure and composition similar to that needed for existing vegetation classification, but with greater emphasis on composition and successional relationships (Brohman and Bryant 2003). Existing vegetation classifications and maps provide much of the information needed to do the following:
• Describe the diversity of vegetation communities occupying an area.
• Characterize the effect of disturbances or management on species, including threatened and endangered species (sometimes called TES), and community distributions.
• Identify realistic objectives and related management opportunities.
• Document successional relationships and communities within potential natural vegetation or ecological types.
• Streamline monitoring design and facilitate extrapolation of monitoring interpretations.
• Assess resource conditions, determine capability and suitability, and evaluate forest and rangeland health.
• Assess risks for invasive species, fire, insects, and disease.
• Conduct project planning and watershed analysis and predict activity outcomes at the project or land and resource management planning scales.

DRAFT Upper Snake Provincial Assessment May 2004
1-37
• More effectively communicate with our partners, stakeholders, and neighbors.
The current plant community reflects the history of a site. That history often includes geologic events, geomorphic processes, climatic changes, migrations of plants and animals in and out of the area, natural disturbances, chance weather extremes, and numerous human activities. Because of these factors, existing vegetation seldom represents the potential under current environmental conditions (Brohman and Bryant 2003).
Existing vegetation information by itself cannot answer questions about successional relationships, changes over time, historical range of variation, productivity, habitat characteristics, and responses to management actions. These questions can only be addressed by combining information about potential natural vegetation, existing vegetation, and stand history (Brohman and Bryant 2003).
Appendix 1-2 includes percentages of representation of both potential and current natural vegetation, by major watershed, for the Upper Snake province.
1.5.3.1 Snake Headwaters Subbasin
The Snake Headwaters subbasin is predominated by forest cover types. The primary historic vegetative types within the Snake Headwaters subbasin include aspen, Douglas-fir, and spruce-fir (with aspen, without aspen, and mixed). Comparing current with historic estimates of these predominant potential natural forest vegetations shows that Douglas-fir, aspen, and subalpine fir are 40%, 59%, and 61% of predicted historic cover, respectively. Alternatively, although sagebrush-related cover types are not common in the Snake Headwaters subbasin, they show an increase of 3,800% over historic estimates. This
increase, although it may not be precise, probably accurately represents the trend in conversion of forest types to drier shrub types.
1.5.3.2 Upper Snake Subbasin
The primary historic vegetative types within the Upper Snake subbasin include aspen, big sagebrush, and spruce-fir types. Aspen cover has decreased to an estimated 47% of historic levels. Big sagebrush types, the predominant vegetative types in this subbasin, have decreased to 42% of their historic levels. Spruce-fir types are estimated to be at 12% of historic representation, while lodgepole pine types have increased to more than 1100% of historic cover estimates. Agricultural lands comprise an estimated 23% of the current Upper Snake subbasin cover and represent a conversion of this proportion of historic vegetative cover and habitat, which was probably mostly shrub-steppe vegetation types.
1.5.3.3 Closed Basin Subbasin
The Closed Basin subbasin was historically dominated by sagebrush types, which comprised more than 50% of the historic representation of the vegetation in the subbasin. Current vegetation representation shows that this proportion has not changed. Agricultural types currently comprise approximately 5% of the current vegetation representation. Forested types, historically comprising more than 20% of the vegetative cover in the subbasin, now are estimated to represent approximately 15% of current vegetative cover. Aspen is now estimated to cover less than 1% of the subbasin, just less than 0.5% less than historic cover estimates.
1.5.4 Rare and Endemic Plants
A total of 118 species of threatened, endangered, sensitive, or rare plants occur in

DRAFT Upper Snake Provincial Assessment May 2004
1-38
the Upper Snake province (see Appendix 1-3 for a list of the 76 threatened, endangered, sensitive, or rare species in the Idaho portion of the subbasin). Generally, presence and abundance of these plant species correlate with areas of the lowest anthropogenic effects
(Figure 1-12). However, data and surveys on these plant species are limited, and therefore understanding of their abundance and distribution throughout the province is limited.
Figure 1-12. Distribution of rare plants in the Upper Snake province.
1.6 Social Description
1.6.1 Demographics
The Upper Snake province was originally the realm of the Shoshoni, Bannock, and Northern Paiute Native American tribes. Although raid and rivalry between the Nez Perce and Shoshoni bands was continuous,
the area was relatively peaceful. Starting in the early 1800s, white explorers began encroaching from the east. John Jacob Astor’s Astorians, under Wilson Price Hunt, entered what would become the Idaho Territory as early as 1811 but did not reach southeast Idaho until 1813 when developing a route to the mouth of the Columbia River. They recognized the bountiful fur resources of the
DRAFT Upper Snake Provincial Assessment May 2004
1-39
area, and this resource attracted the mountain men and Indian traders.
Starting about 1841, and continuing to 1870, emigrants on the Oregon Trail passed through Montpelier, Georgetown Summit, and Soda Springs on their way to the Oregon Territory. This “trail” became a highway for a major episode of human migration. In 1843, John C. Fremont arrived in southeast Idaho and further solidified the route of the Oregon Trail. Fort Hall became a supply and rest point on the trail. When gold was discovered in 1861 near Pierce, in north-central Idaho, there was a large increase in traffic on the Oregon Trail as would-be miners traveled to the new discoveries.
However, not all of the people who migrated along the Oregon Trail were gold seekers; some stayed in this corner of Idaho. These settlers were primarily Mormons moving north from Utah into the fertile valleys of Bear Lake County and Old Bannock County (later divided into Bannock and Caribou counties) (Figure 1-13). Small communities, such as Franklin, Montpelier, and Bennington lent a note of social stability to the region, more so than did the mining regions in north-central Idaho. These towns turned into centers of ranching and farming.
Although sparsely populated when compared with other areas in the Upper Snake province, the Closed Basin subbasin also has a history of use by humans. Shoshone-Bannock peoples traditionally occupied and used these lands until these people were moved to the Fort Hall Indian Reservation in 1907. The Shoshone-Bannock tribes and the Northwest Band of the Shoshone Nation retain treaty rights that allow access to traditional cultural properties and resources in this subbasin. The Nez Perce tribes also retain certain rights and interest related to their seasonal travels through portions of the subbasin and their
association with the Nez Perce (Nee Me Poo) National Historic Trail.
The Fort Hall Indian Reservation was created by an Act of Congress on July 3, 1868, ratified on February 16, 1869, and formally proclaimed on February 24, 1869. The Shoshone and Bannock tribes were moved onto the reservation from several areas throughout southern Idaho.
Twenty-seven counties lay either wholly or partially within the Upper Snake province (Table 1-7). Four are within Wyoming, one is in Nevada, and one is in Utah. The fastest-growing counties in the province, Teton County in Idaho and Teton County in Wyoming, are within the Headwaters subbasin. Only one county within the province, Butte County, exhibited negative population growth during the past 10 years. State and local government employment in the Upper Snake province has been largely stable in the past 10 years.
The largest industries within the province include agriculture, services, retail trade, manufacturing, and government. Agriculture, largely dependent on surface water irrigation, predominates in the Upper Snake subbasin where potato and seed crops are grown. Livestock ranching and irrigated forage crops also make significant contributions to the agricultural economy in the Upper Snake and Closed Basin subbasins.
Services associated with tourism and outdoor recreation have been growth industries in the Upper Snake province during the last 10 years. In the Snake Headwaters subbasin, visitors to Yellowstone and Teton National Parks and Jackson Hole, as well as outdoor recreationists, make tourism-related services a growth industry. In association with these increases, the industries of finance, insurance, and real estate are increasing in this subbasin.

DRAFT Upper Snake Provincial Assessment May 2004
1-40
Manufacturing of nondurable goods and mining in the Upper Snake province is largely centered on fertilizer production in the cities of Pocatello and Soda Springs in the Upper Snake subbasin. However, this industry has been in slow decline in the last 10 years.
Unique to the Upper Snake province is the Idaho National Engineering and
Environmental Laboratory. Not only does this national laboratory protect a large area of high shrub-steppe desert from development, its employment of research, management, and administration staff make a significant contribution to the economy of the Upper Snake subbasin and its surrounding communities.
Table 1-7. Demographic information for the Upper Snake province. (Note: population counts taken in 2001; ppsm = persons per square mile; trend calculated between 1990 and 2000. Source: U.S. Census Bureau 2003).
County State Land Area
(sq mi) Population Estimate
Population Density (ppsm)
Population Trend
(% change) Bonneville Idaho 1,868 83,807 44.2 +14.3 Jefferson Idaho 1,095 19,578 17.5 +15.8 Madison Idaho 470 27,327 58.3 +16.0 Fremont Idaho 1,867 11,822 6.3 +8.1 Teton Idaho 450 6,419 13.3 +74.4 Bingham Idaho 2,095 42,335 19.9 +11.0 Caribou Idaho 1,766 7,397 4.1 +4.9 Bannock Idaho 1,113 75,323 67.9 +14.4 Power Idaho 1,406 7,468 5.4 +6.4 Oneida Idaho 1,200 4,210 3.4 +18.1 Cassia Idaho 2,566 21,577 8.3 +9.6 Blaine Idaho 2,645 19,798 7.2 +40.1 Minidoka Idaho 760 19,677 26.6 +4.2 Jerome Idaho 600 18,449 30.6 +21.2 Lincoln Idaho 1,206 4,132 3.4 +22.2 Gooding Idaho 731 14,207 19.4 +21.7 Twin Falls Idaho 1,925 64,731 33.4 +20.0 Butte Idaho 2,233 2,856 1.3 -0.7 Clark Idaho 1,765 971 0.6 +34.1 Valley Idaho 3,678 7,716 2.1 +25.2 Custer Idaho 4,925 4,292 0.9 +5.2 Lincoln Wyoming 4,069 14,793 3.6 +15.4 Fremont Wyoming 9,182 35,967 3.9 +6.4 Sublette Wyoming 4,883 6018 1.2 +22.2 Teton Wyoming 4,008 18,437 4.6 +63.3 Elko Nevada 17,179 45,275 2.6 +35.3 Box Elder Utah 5,723 43,397 7.5 +17.2
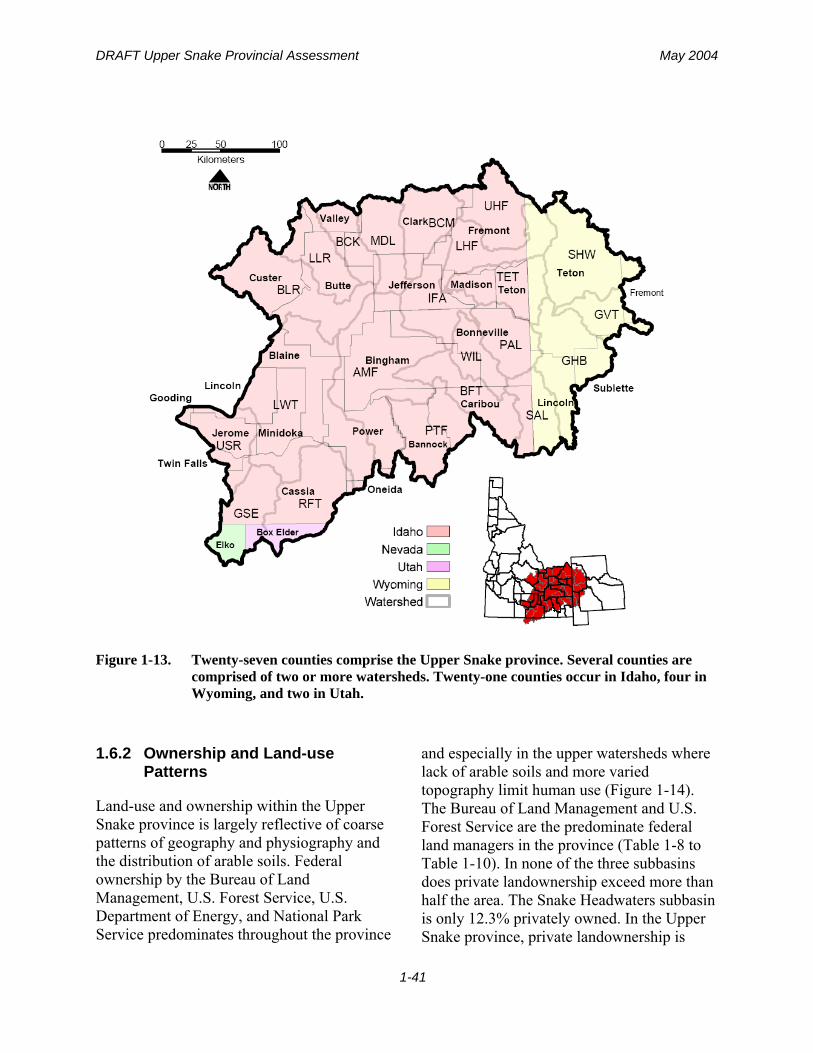
DRAFT Upper Snake Provincial Assessment May 2004
1-41
Figure 1-13. Twenty-seven counties comprise the Upper Snake province. Several counties are comprised of two or more watersheds. Twenty-one counties occur in Idaho, four in Wyoming, and two in Utah.
1.6.2 Ownership and Land-use Patterns
Land-use and ownership within the Upper Snake province is largely reflective of coarse patterns of geography and physiography and the distribution of arable soils. Federal ownership by the Bureau of Land Management, U.S. Forest Service, U.S. Department of Energy, and National Park Service predominates throughout the province
and especially in the upper watersheds where lack of arable soils and more varied topography limit human use (Figure 1-14). The Bureau of Land Management and U.S. Forest Service are the predominate federal land managers in the province (Table 1-8 to Table 1-10). In none of the three subbasins does private landownership exceed more than half the area. The Snake Headwaters subbasin is only 12.3% privately owned. In the Upper Snake province, private landownership is

DRAFT Upper Snake Provincial Assessment May 2004
1-42
predominant in the valley bottoms of the Snake Headwaters subbasin, valley bottoms and broader flat areas of the Closed Basin subbasin, and areas south of the Snake River and High Desert in the Upper Snake subbasin. These areas are characterized by agricultural development; canal, water, and road development; and small rural communities.
Within the province, the Greys–Hoback, Gros Ventre, and Snake Headwaters watersheds are
in the most pristine and least modified conditions. Watersheds with the most private ownership—including the Upper Snake–Rock, Raft, American Falls, Portneuf, Blackfoot, Willow, Idaho Falls, Teton, Lower Henrys Fork, and Beaver–Camas watersheds—have been the most impacted by human development and natural resource use, primarily farming and ranching.
Table 1-8. Percentage of land area in the Snake Headwaters subbasin for various ownership/management entities, by watersheds and a 50-m stream buffer.
Percentage of ownership by Watershed / 50m buffer of streamsa
Landowner/Manager GHB GVT PAL SAL SHW
% Entire Subbasin
Bureau of Land Management 2 / 3 0 / 0 <1 / <1 1 / <1 0 / 0 1 Bureau of Reclamation 0 / 0 0 / 0 2 / 3 0 / 0 0 / 0 1 Department of Defense 0 / 0 0 / 0 0 / 0 0 / 0 0 / 0 0 U.S. Department of Energy 0 / 0 0 / 0 0 / 0 0 / 0 0 / 0 0 National Park Service 2 / 2 <1 / 0 0 / 0 0 / 0 43 / 40 13 Private/Water 7 / 10 5 / 6 20 / 23 30 / 38 8 / 4 12 State of Idaho <1 / <1 0 / 0 <1 / 0 1 / 1 <1 / 0 1 Tribal 0 / 0 0 / 0 0 / 0 0 / 0 0 / 0 0 U.S. Forest Service 89 / 85 95 / 94 78/ 74 68 / 60 49 / 60 72 U.S. Fish and Wildlife Service <1 / <1 <1 / <1 0 / 0 0 / 0 0 / 0 1 Total Area (km2)b 4,035 1,642 2,395 2,295 4,371 100 a Percentages may not sum to 100 because of rounding. b Total area for watersheds may differ from drainage areas given in Table 1-1 because of rounding.
Table 1-9. Percentage of land area in the Upper Snake subbasin for various ownership/management entities, by watersheds and a 50-m stream buffer.
Percentage of ownership by Watershed / 50m buffer of streamsa Landowner/
Manager AMF BFT GSE IFA LHF PTF RFT TET UHF USR LWT WIL
% Entire Sub-basin
Bureau of Land Management 27 / 7 4 / 5 44 / 37 24 / 1 11 / 2 10 / 6 32 / 24 1 / <1 3 / 3 39 / 19 58 / 14 2 / 4 27
Bureau of Reclamation <1 / <1 0 / 0 0 / 0 0 / 0 0 / 0 0 / <1 0 / 0 0 / 0 1 / <1 1 / 0 <1 / 1 0 / 0 <1
Department of Defense 0 / 0 0 / 0 0 / 0 0 / 0 0 / 0 0 / 0 0 / 0 0 / 0 0 / 0 0 / 0 0 / 0 <1 / <1 <1
U.S. Department of Energy 13 / 0 0 / 0 0 / 0 0 / 0 0 / 0 0 / 0 0 / 0 0 / 0 0 / 0 0 / 0 0 / 0 0 / 0 2
National Park Service 0 / 0 0 / 0 0 / 0 0 / 0 24 / 25 0 / 0 0 / 0 <1 / <1 6 / 5 0 / 0 2 / <1 0 / 0 3

DRAFT Upper Snake Provincial Assessment May 2004
1-43
Percentage of ownership by Watershed / 50m buffer of streamsa Landowner/
Manager AMF BFT GSE IFA LHF PTF RFT TET UHF USR LWT WIL
% Entire Sub-basin
Private/Water 40 / 51 41 / 47 27 / 24 71 / 96 43 / 45 60 / 64 46 / 50 58 / 59 15 / 23 55 / 66 34 / 71 71 / 67 44
State of Idaho 3 / <1 18 / 15 2 / 2 4 / 2 6 ./ <1 4 / 3 2 / 1 2 / <1 4 / 3 6 / <1 7 / 3 15 / 17 3`
Tribal 17 / 39 16 / 13 0 / 0 0 / 0 0 / 0 7 / 5 0 / 0 0 / 0 0 / 0 0 / 0 0 / <1 0 / 0 5
U.S. Forest Service <1 / 2 18 / 19 26 / 37 <1 / <1 16 / 28 19 / 21 20 / 25 40 / 39 72 / 67 4 / 15 2 / 9 9 / 8 15
U.S. Fish and Wildlife Service 0 / 0 0 / 0 0 / 0 0 / 0 <1 / 0 0 / 0 0 / <1 0 / 0 0 / 0 0 / 0 <1 / 1 3 / 2 <1
Total Area (km2)b 7,534 2,833 2,887 2,975 2,665 3,420 3,893 2,857 2,850 2,530 9,274 1,682 100.0 a Percentages may not sum to 100 because of rounding. b Total area for watersheds may differ from drainage areas given in Table 1-1 because of rounding.
Table 1-10. Percentage of land area in the Closed Basin subbasin for various ownership/management entities, by watersheds and a 50-m stream buffer.
Percentage of ownership by Watershed / 50m buffer of streamsa Landowner/Manager
BCM BCK BLR LLR MDL % Entire Subbasin
Bureau of Land Management 23 / 7 41 / 44 27 / 20 44 / 39 35 / 31 33 Bureau of Reclamation 0 / <1 0 / 0 0 / 0 0 / 0 / 0 0 / 0 0 Department of Defense 0 / 0 0 / 0 0 / 0 0 / 0 0 / 0 0 U.S. Department of Energy 0 / 0 19 / 7 15 / 4 3 / 0 7 / 0 10 National Park Service 0 / 0 0 / 0 0 / 0 0 / 0 0 / 0 0 Private/Water 42 / 51 4 / 7 14 / 26 8 / 11 32 / 24 10 State of Idaho 10 / <1 1 / 2 1 / <1 2 / 1 3 / 2 3 Tribal 0 / 39 0 / 0 0 / 0 0 / 0 0 / 0 0 U.S. Forest Service 24 / 2 34 / 41 42 / 49 43 / 49 24 / 43 35 U.S. Fish and Wildlife Service 2 / 0 0 / 0 0 / 0 0 / 0 0 / 0 <1 Total Area (km2)b 2,566 1,861 5,139 2,516 2,423 100.0 a Percentages may not sum to 100 because of rounding. b Total area for watersheds may differ from drainage areas given in Table 1-1 because of rounding.

DRAFT Upper Snake Provincial Assessment May 2004
1-44
Figure 1-14. Land ownership/management patterns within the Upper Snake province.
1.6.3 Water Diversion and Management
The state’s largest water district, District 1, covers the entire Upper Snake subbasin above Milner Dam and includes numerous streams and tributaries and thousands of individual water users. The water district operates reservoirs, canals, and diversion dams in three water projects as a system. The projects begin with headwater reservoirs at Jackson Lake (Upper Snake subbasin) and Grassy and Henrys lakes (Upper Henrys Fork watershed) and end with Milner dam and reservoir.
The policy of Water District 1 is to store water in reservoirs that are highest in the system and use water in the lowest reservoirs (R. Carlson, Idaho Department of Water Resources, Public Informational Workshop, Pocatello, Idaho. November 21, 2000). American Falls Reservoir is the largest reservoir and the lowest meaningful reservoir. Water discharges into the reservoir basin from springs between Blackfoot and the Fort Hall Bottoms, and flows of the Snake and Portneuf rivers reliably refill American Falls Reservoir (1.67 million acre-feet) each year.

DRAFT Upper Snake Provincial Assessment May 2004
1-45
Consequently, this reservoir is the workhorse for irrigation supply in the Minidoka Project.
The Minidoka Project furnishes irrigation water from five reservoirs having a combined storage capacity of more than 3 million acre-feet. Within the Upper Snake subbasin, the project works include Minidoka dam and power plant and Lake Walcott, as well as American Falls dam and reservoir. Above the Upper Snake subbasin, the project includes Jackson Lake dam and reservoir, Island Park dam and reservoir, and Grassy Lake dam and reservoir. Two diversion dams, canals, laterals, and drains deliver the water to about 1.1 million acres. American Falls Dam is used by Idaho Power Company to generate hydropower.
The Palisades Project of Idaho and Wyoming is the second largest water project in Water District 1. The principal features of the project are Palisades dam, reservoir, and power plant located in the Palisades watershed, Snake Headwaters subbasin. The Palisades Project is instrumental in providing water to meet the Minidoka Project water requirements. The Bureau of Reclamation operates and maintains the project.
About 650,000 acres of irrigated land in the Minidoka and Michaud Flats projects in the Upper Snake subbasin are provided supplemental water from the Palisades Project. Palisades Reservoir stores 1,401,000 acre-feet (1,200,000 active) of water. The State of Wyoming has 33,000 acre-feet of “joint use” space in Palisades Reservoir, an amount that can be used to either retain water in Jackson Lake, Wyoming, or increase winter flows in the Snake River between Jackson Lake and Palisades Reservoir to benefit cutthroat trout.
The Ririe Project is the smallest of the three Water District 1 water projects. Features of the project are Ririe dam and reservoir.
Ririe’s principal purpose is flood control. Out of its total reservoir capacity (100,500 acre-feet), 80,500 acre-feet serve both flood control and irrigation, 10,000 acre-feet is dead storage, and 10,000 acre-feet are reserved for flood control.
Several hydroelectric power generation plants operate as part of the Water District 1 projects within the Upper Snake subbasin. The Minidoka Power Plant (28.5 megawatts) serves the requirements for pumped irrigation on and near the Minidoka Project in southern Idaho. Power not needed for Bureau of Reclamation project purposes is marketed in the Federal Southern Idaho Power System administered by the Bonneville Power Administration. Palisades Power Plant (176,600 kilowatts) also serves large power requirements for irrigation pumping on and near the Minidoka Project.
The Idaho Power Company operates three hydroelectric power generation plants. Plants at American Falls Dam generate 92,340 kilowatts; downstream at Milner Dam, 59,448 kilowatts; and farthest downstream at Shoshone Falls, 12,500 kilowatts. Idaho Power Company has an open access transmission policy. The company, Bonneville Power Administration, and seven other major transmission owners are moving forward collectively on developing a Regional Transmission Organization (RTO).
The Bureau of Reclamation actively pursues and provides water for Snake River/Columbia River flow augmentation for threatened and endangered salmon and steelhead. The Idaho Legislature authorized short-term rental of up to 427,000 acre-feet of water from the water supply bank each year. Both Bureau of Reclamation space and water rental from reservoir space holders are provided. Approximately 22,000 acre-feet of Bureau of Reclamation space and 38,000 acre-feet of American Falls Reservoir water leased long-

DRAFT Upper Snake Provincial Assessment May 2004
1-46
term from the Shoshone-Bannock Tribes were provided in addition to another 148,400 acre-feet rented from the District 1 Water Bank in 1999.
The State of Idaho has statutory authority in administering water rights within its boundaries. Under the prior appropriation doctrine, natural flow rights in Idaho are satisfied in order of priority based on date (first in time is first in right). When the water supply is limited, a water right holder with an earlier natural flow right (a senior water right) may receive a full supply, whereas a water right holder with a later or more recent date (a junior water right) may not receive a full supply. Diversion rights for irrigation are appurtenant to the land, whereas diversion
rights for other purposes such as power, municipal, and industrial water supply are not.
Storage reservoirs such as American Falls Reservoir, Jackson Lake, and Palisades Reservoir are constructed and operated to change the flow regime for irrigation purposes to provide for the water rights. Spaceholder contracts (through November 1995) in the American Falls, Jackson Lake, and Palisades storage facilities for the specific canal companies in the Upper Snake subbasin are shown in Table 1-11. The two primary canal companies in the subbasin have their water rights based primarily on natural flow with supplemental storage rights.
Table 1-11. Spaceholder contracts in the Upper Snake subbasin as of November 1995 (Buhidar 1999).
Spaceholdera American Falls Jackson Lake Palisades Total American Falls Reservoir District
274,338 (NSCC) 148,747 (TFCC)
0 0
0 0
423,085
MID 44,951 0 44,500 89,451 NSCC 116,471 312,007 116,600 545,078 TFCC 0 97,183 0 97,183 TOTAL (%)
584,507 (50.6%)
409,190 (35.4%)
161,100 (14.0%)
1,154,797 (100%)
a NSCC = North Side Canal Company; TFCC = Twin Falls Canal Company; MID = Milner Irrigation District. A spaceholder contract is defined as a type of repayment contract in which storage space is purchased in contrast to a specific amount of water being purchased. The amount of water that accumulates in that storage space belongs to the purchaser. Storage season is normally defined as beginning October 1 and extending to the date when no more water is available for storage. The irrigation season is defined in spaceholder contracts as April 1 to October 31, although the actual water may not be used until April 15 to October 15. A water year (or WY) begins on October 1 and extends to September 30 of the following year.
The Twin Falls Canal Company and North Side Canal Company irrigate tracts on the south and north sides of the Snake River. The Twin Falls area (or Twin Falls tract) is predominantly irrigated by the Twin Falls Canal Company, the largest irrigation company in Idaho. This canal company diverts an average of 1.1 million acre-feet per year from the Snake River. The irrigation
water is delivered to the area by gravity feed via the High Line and Low Line canals. Approximately 202,000 acres are serviced by the Twin Falls Canal Company. An estimated 85 to 90% of irrigation in the Twin Falls tract is surface irrigated, with sprinkler irrigation making up the balance (Barry 1996, Cosgrove et al. 1997).

DRAFT Upper Snake Provincial Assessment May 2004
1-47
The Hazelton-Jerome-Wendell-Gooding area (or Northside Tract) is predominantly irrigated by the North Side Canal Company, which diverts an average of 1.2 million acre-feet per year from the Snake River. The irrigation water is delivered to the area by gravity feed via the Main Canal. Approximately 160,000 acres are serviced by the North Side Canal Company. An estimated 80% of irrigation is primarily sprinkler irrigation (Barry 1996).
Approximately 6,000 farms within the Twin Falls and Northside Tracts discharge into one or more points in a return flow channel. At Milner Dam, there are 10 different discharges: 1) Middle Snake River, 2) Milner Hydro Plant, 3) North Side Canal Company, 4) Twin Falls Canal Company, 5) Milner-Gooding Canal, 6) Cross-cut canal, 7) A-Lateral, 8) PA-Lateral, 9) Milner Irrigation Pumping Plant, and 10) A & B Irrigation Pumping Plant. The largest withdrawals within this reach of the river are at Minidoka Dam and Milner Dam. During low water years, essentially all of the flows from the Snake River are diverted from the river channel at Milner Dam, leaving the Snake River completely dry until it picks up spring flows several miles downstream.
The 124 dams and impoundments in the province are for hydroelectric generation, water storage for irrigation and other agricultural uses, wildlife habitat, and recreation (Appendix 1-4). Seventy percent of these dams, most of them privately owned, are within the Upper Snake subbasin. Of the 124 dams within the province, 22 are federally owned. Twenty of those are within the Snake Headwaters subbasin, and the remaining 2 are in the Upper Snake subbasin. Of the 22 federal projects, only Palisades and Minidoka are currently within the NPCC’s Columbia River Basin Fish and Wildlife Program and have had construction and inundation loss assessments prepared and accepted by the NPCC (NPPC 2000).
1.6.4 Protected Areas
The majority of the province and its subbasin have been affected by human development. The areas with the highest road densities (Figure 1-15) represent areas of agricultural and community developments. Every major watershed within the province has been accessed and impacted by roads. The existing level of road development and associated use by people negatively impact fish and wildlife populations, habitats, and habitat linkage and connectivity.

DRAFT Upper Snake Provincial Assessment May 2004
1-48
Figure 1-15. Road densities within the Upper Snake province.
Although development has impacted most of the province, a diverse range of protected areas occurs (Figure 1-16). These specially designated areas include Wilderness and Wilderness Study Areas, National Parks, roadless areas, protected streams and rivers including those in the Wild and Scenic Rivers System, National Recreation Areas, fishing and hunting access areas, and natural areas. Natural areas, as defined here, are areas managed by various landowners in a natural state and managed to retain or restore naturalness for research, monitoring, inventory, habitat protection, education, or social needs. Mapped wetland areas have also been identified and mapped according to U.S.
Fish and Wildlife Service guidelines (Figure 1-17).
Relatively small, protected ecological reference areas are also present within the Upper Snake province, including U.S. Forest Service Research Natural Areas and Special Interest Areas, Bureau of Land Management Research Natural Areas and Areas of Critical Environmental Concern, and Nature Conservancy preserves. Research Natural Areas provide pristine, high quality, representative examples of the important ecosystems within the province and opportunities for research regarding physical and biological ecosystem processes.

DRAFT Upper Snake Provincial Assessment May 2004
1-49
Figure 1-16. Protected areas within the Upper Snake province. Data are not complete or consistent across the basin. Boundaries are not verified, and resolution and accuracy of the source data vary widely. Original scales on sources varied from 1:24,000 to 1:500,000. Additional areas of Wild and Scenic River System were created by buffering 1:24,000-scale river reaches to fill gaps in original data. A buffer of 0.25 mile was used on each side of a river.

DRAFT Upper Snake Provincial Assessment May 2004
1-50
Figure 1-17. Mapped wetlands within the Upper Snake province as delineated by the U.S. Fish and Wildlife Service National Wetland Inventory.
The Snake Headwaters subbasin encompasses portions of the Gros Ventre and Teton Wilderness areas and Yellowstone and Grand Teton National Parks. Forty-three U.S. Forest Service roadless areas are identified in this subbasin. They occur on the ridge crests and peaks of the Caribou, Wyoming, and Gros Ventre ranges. Three Bureau of Land Management Wilderness Study Areas are present within the Idaho Falls and Palisades watersheds. We estimate that 1,219,941 acres,
or 33%, of the Snake Headwaters subbasin is defined as protected.
Within the Upper Snake subbasin, the entire 569,600-acre (2,305 km2) Idaho National Engineering and Environmental Laboratory (INEEL) is designated as a National Environmental Research Park. Because these lands have been withdrawn from the public domain for over 50 years, this national laboratory arguably retains the largest and best representation of the shrub-steppe

DRAFT Upper Snake Provincial Assessment May 2004
1-51
ecosystem in the western United States (Anderson 1999). In addition, over 60,000 acres (243 km2) of the Idaho National Engineering and Environmental Laboratory at the mouth of the Birch Creek Valley were recently set aside as the Shrub-steppe Ecosystem Reserve, under joint management of the U.S. Department of Energy, Bureau of Land Management, and U.S. Fish and Wildlife Service. The 714,727-acre (2,892 km2) Craters of the Moon National Park consists of remote and largely undeveloped lava fields and shrub-steppe areas. Traditional livestock grazing continues within the grass/shrublands administered by the Bureau of Land Management. We estimate that 1,219,941 acres (4,937 km2) or about 10%, of the Upper Snake subbasin is defined as protected area, mostly within the boundaries of the Idaho National Engineering and Environmental Laboratory and Craters of the Moon National Park.
Protected areas within the Closed Basin subbasin are primarily roadless areas managed by the U.S. Forest Service.
1.7 Environmental and Biological Situation
1.7.1 Water Quality
A total of 99 waterbodies totaling 1,822 miles (2,933 km) of stream in the Upper Snake province are classified as impaired under the guidelines of section 303(d) of the Clean Water Act (USEPA and IDEQ 1998) (Figure 1-18). The primary limiting factors on water
quality limited waters in the Upper Snake province are sediments (cases), nutrients (cases), flow alteration, and irregular temperatures.
The Upper Snake subbasin has 71 water quality limited streams totaling 1,307 miles (2,104 km) of stream miles (or approximately 20% of all streams in the basin – see Appendix 1-5). The Snake Headwaters subbasin has 5 water quality limited streams totaling 46 miles (74 km) of stream miles, or approximately 2% of streams in the subbasin (see Appendix 1-5). Finally, the Closed Basin subbasin has a total of 23 water quality limited streams totaling 469 miles (755 km) of stream, or approximately 14% of streams in the subbasin – see Appendix 1-5 for more information.
As illustrated in Figure 1-18, some watersheds have notably greater distribution of water quality impaired streams than do others. To assess and mitigate these water quality issues, total maximum daily load (TMDL) standards are being addressed. TMDL standards were approved for the Little Lost River, Lake Walcott, and Upper Snake Rock watersheds. Standards have been developed and are in review for the Big Lost River, Goose Creek, and Raft River watersheds. Finally, standards are yet to be developed for the Camas Creek and Birch creek watersheds. Further, implementation plans are complete for the Upper Snake Rock watershed, and are in process for the other watersheds (IDEQ 2004).
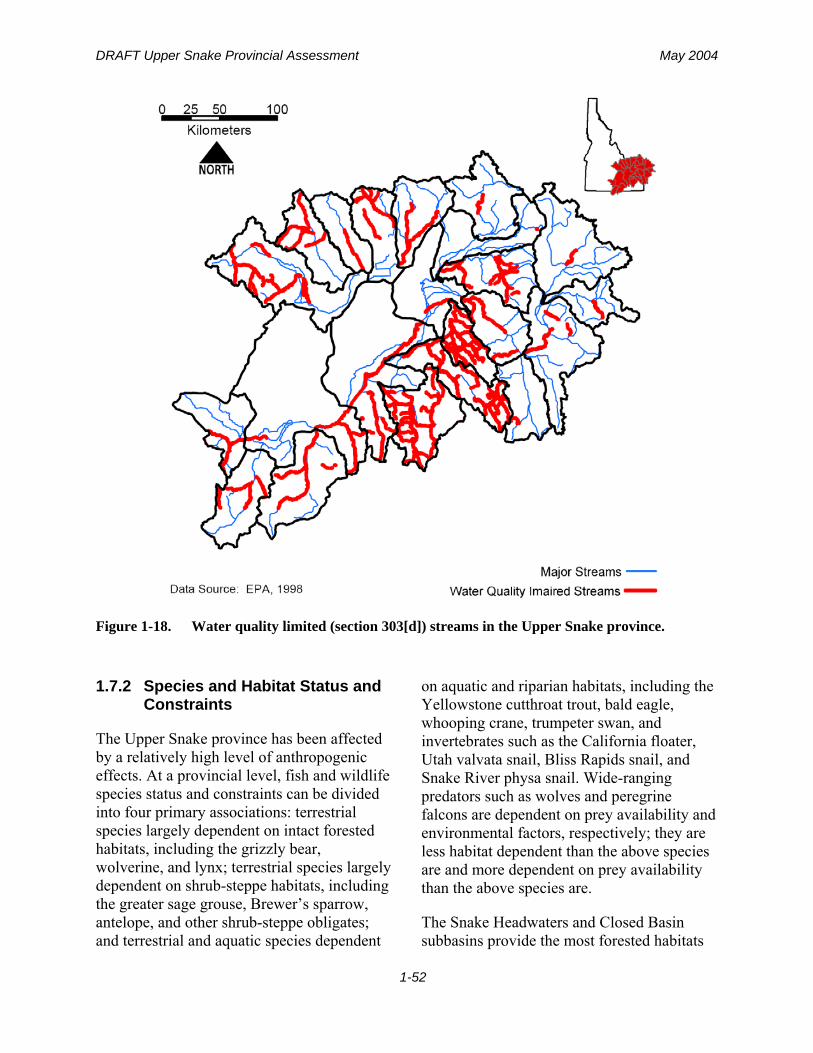
DRAFT Upper Snake Provincial Assessment May 2004
1-52
Figure 1-18. Water quality limited (section 303[d]) streams in the Upper Snake province.
1.7.2 Species and Habitat Status and Constraints
The Upper Snake province has been affected by a relatively high level of anthropogenic effects. At a provincial level, fish and wildlife species status and constraints can be divided into four primary associations: terrestrial species largely dependent on intact forested habitats, including the grizzly bear, wolverine, and lynx; terrestrial species largely dependent on shrub-steppe habitats, including the greater sage grouse, Brewer’s sparrow, antelope, and other shrub-steppe obligates; and terrestrial and aquatic species dependent
on aquatic and riparian habitats, including the Yellowstone cutthroat trout, bald eagle, whooping crane, trumpeter swan, and invertebrates such as the California floater, Utah valvata snail, Bliss Rapids snail, and Snake River physa snail. Wide-ranging predators such as wolves and peregrine falcons are dependent on prey availability and environmental factors, respectively; they are less habitat dependent than the above species are and more dependent on prey availability than the above species are.
The Snake Headwaters and Closed Basin subbasins provide the most forested habitats

DRAFT Upper Snake Provincial Assessment May 2004
1-53
and accordingly can support more and healthier populations of forest-associated species. Habitat fragmentation, conversion, fire frequency, disturbance, and increased mortality of forested species through increased human access and recreation are the primary constraints to sustaining forest-dependent species in the Snake Headwaters and Closed Basin subbasins. The associated human activities contributing to these constraints include road construction, development, timber harvest, tourism, increasing and unrestricted human access, and fire suppression.
The Upper Snake and Closed Basin subbasins provide the majority of shrub-steppe habitat and species dependent on shrub-steppe habitat in the Upper Snake province. Noxious weeds, habitat fragmentation, fire frequency, habitat conversion, and disturbance are the primary constraints to sustaining species dependent on shrub-steppe in the Upper Snake and Closed Basin subbasins. The associated human activities contributing to these constraints include livestock grazing, conversion of shrub-steppe habitats, and fire management.
The Snake Headwaters, Closed Basin, and Upper Snake subbasins all provide important aquatic and aquatic-associated habitats. The primary constraints to aquatic-dependent
species include water quantity and quality. The associated human activities enabling these constraints include water diversion, irrigated agriculture, and livestock grazing. In an analysis of geomorphic integrity and water quality integrity, the majority of watersheds analyzed show moderate soil and water integrity (< 20% degraded stream miles) (Figure 1-19), while several watershed show low integrity (> 20% degraded stream miles). Likewise, a majority of watersheds show fair water quality integrity, while several show poor water (Figure 1-20). Watersheds ranked as having high integrity for either geomorphic or water quality characteristics are discontinuous and rare throughout the province (Figure 1-19 and Figure 1-20).
New Zealand mudsnails also threaten aquatic habitats and species. These small brown snails measure less than 0.125 inch. These mudsnails easily reach densities that cause significant habitat degradation. Snail numbers as high as 750,000 per square yard have been recorded in some areas. At high densities, the snails consume most available food, leaving little for native snails and aquatic insects to feed on. This situation leads to a reduction or elimination of these species, as well as to indirect but significant impacts on fish and on riparian-dependent wildlife populations.

DRAFT Upper Snake Provincial Assessment May 2004
1-54
Figure 1-19. Watershed geomorphic integrity within the Upper Snake province (IWWI = Inland West Watershed Initiative and SWIEG = Southwest Idaho Ecogroup). Sources: USDA 2003 and USFS 2003.

DRAFT Upper Snake Provincial Assessment May 2004
1-55
Figure 1-20. Water quality integrity within the Upper Snake province (IWWI = Inland West Watershed Initiative and SWIEG = Southwest Idaho Ecogroup). Sources: USDA 2003 and USFS 2003.
1.7.3 Disturbance
We classified disturbance in the Upper Snake province in relation to fire (areas burned within the last 25 years), areas currently under cultivation and irrigation, and areas currently undergoing livestock grazing.
The largest areas that have been disturbed by fire in the last 25 years are represented by large blocks of forested habitats in the Upper Snake subbasin consisting of primarily U.S. Forest Service and National
Park Service lands (Figure 1-21). These forested areas that have been disturbed by fire total 1,950 acres (8 km2), 50 acres (0.2 km2), and 3,700 acres (15 km2) in the Snake Headwaters, Closed Basin, and Upper Snake subbasins, respectively2. Bureau of Land Management areas that have been disturbed
2 These areas are additive. If an area is burned twice, it is counted 2 times. Also, area locations are assigned based on the point location. Source: Federal Fire History, BLM, Denver, CO.

DRAFT Upper Snake Provincial Assessment May 2004
1-56
by fire within the last 25 years occur primarily within the Upper Snake subbasin, where predominately shrub-steppe habitats have been disturbed. These areas total 5,700 acres (23 km2) in the Upper Snake province.
This amount represents more than 45% of the total ownership of the Bureau of Land Management and 30% of the total shrub-steppe habitat in this province.
Figure 1-21. Distribution of fires in the Upper Snake province over the last 25 years.
Areas continuously disturbed by agricultural activity include more than 2,774,672 acres, or 15%, of the entire province. These disturbed lands consist primarily of irrigated crops and hayfields on private lands. Agriculturally disturbed lands constitute less than 5% of the Snake Headwaters subbasin. In the Closed Basin subbasin, agricultural lands comprise approximately 6% of the
land area. In the Upper Snake subbasin, more than 22% of the land area is in agricultural production, with the highest agricultural development occurring in the Teton, Idaho Falls, and Upper Snake–Rock watersheds, which have 48, 58, and 48%, respectively, of their land area in agriculture.

DRAFT Upper Snake Provincial Assessment May 2004
1-57
Areas of known livestock grazing disturbance were estimated primarily through information on grazing allotments on federal and state lands (Figure 1-22). These figures indicate more than 81% of the federal lands in the province are disturbed by grazing. Of that percentage, 84% of the Upper Snake subbasin is grazed, 65% of the Snake Headwaters subbasin are grazed, and 95% of the Closed Basin subbasin is under grazing allotments. Lands with high to
moderate probability of uncharacteristic effects from grazing include 4,906, 38,052, and 12,231 km2 in the Snake Headwaters, Upper Snake, and Closed Basin subbasins, respectively (ICBEMP 1997). These amounts indicate that 33, 83, and 84% of the Snake Headwaters, Upper Snake, and Closed Basin subbasins, respectively, have been impacted by livestock grazing. Less than 1% of each of the three subbasins has or had little or no grazing.
Figure 1-22. Showing the ownership of rangeland in Idaho and ownership of grazing allotments in Utah, Nevada and Wyoming.
DRAFT Upper Snake Provincial Assessment May 2004
1-58
1.7.4 Noxious Weeds
Twenty-three noxious weed species are known to occur within the Upper Snake province in Idaho. In Wyoming, an estimated 46 species of noxious weeds are within the Snake Headwaters subbasin. The Gros Ventre, Greys–Hoback, and Snake Headwaters watersheds have the greatest number of noxious weed species. Current location data on species occurrences within the subbasin are limited and only enable identification to county (Figure 1-23). This mapped information and data should be considered gross estimates. However, the information indicates that noxious weeds have invaded every county and watershed within the Upper Snake province (see Appendix 1-6 for weeds occurring in Teton County, Idaho, and Teton County, Wyoming). The noxious weeds most widespread within the province include black henbane (Hyoscyamus niger), Canada and musk thistle (Cirsium arvense and Carduus nutans), field bindweed (Convolvulus arvensis), leafy spurge (Euphorbia esula), spotted knapweed (Centaurea biebersteinii), hoary cress (also
known as whitetop, Cardaria draba), and poison hemlock (Conium maculatum). Noxious weed species of emerging concern include meadow knapweed (Centaurea debeauxii), Syrian beancaper (Zygophyllum fabago), yellow starthistle (Centaurea solstitialis), buffalobur nightshade (Solanum rostratum), purple loosestrife (Lythrum salicaria), silverleaf nightshade (Solanum elaeagnifolium), spring millet grass (Milium vernale), Johnsongrass (Sorghum halepense), and perennial pepperweed (Lepidium latifolium).
This noxious weed assessment does not include estimates or interpretations of the occurrence and coverage for cheatgrass (Bromus tectorum), a purposely introduced species intended to increase livestock forage on shrub-steppe range. Its introduction and spread has negatively impacted native shrub-steppe range through increased fire frequency and reduction in native forb production (Connelly et al. 2000). Cheatgrass abundance and distribution, although not mapped, is assumed to be pervasive throughout the province.

DRAFT Upper Snake Provincial Assessment May 2004
1-59
Figure 1-23. Known Distribution of noxious weeds in the Upper Snake province.