Upper Mississippi River Total Suspended Solids Total ...
70
November 2020 Upper Mississippi River Total Suspended Solids Total Maximum Daily Load Report This report quantifies the total amount of total suspended solids that can be received by the Upper Mississippi River and maintain its ability to support healthy biological communities, and identifies needed reductions. repeating the word “report” if already used above. Active voice is better. Watershed
Transcript of Upper Mississippi River Total Suspended Solids Total ...
November 2020
Upper Mississippi River Total Suspended Solids Total Maximum Daily Load Report This report quantifies the total amount of total suspended solids that can be received by the Upper Mississippi River and maintain its ability to support healthy biological communities, and identifies needed reductions. repeating the word “report” if already used above. Active voice is better.
Watershed

Document number: wq-iw8-60e
Authors
Meghan Funke, PhD, PE
Trevor Rundhaug Etoile Jensen, GISP
Contributors/acknowledgements Minnesota Pollution Control Agency:
Anna Bosch
Bonnie Finnerty
Kevin Stroom
Marco Graziani
Mark Evenson
Jesse Anderson
Mike Feist
Lee Engel
Sagor Biswas
Andrea Plevan
Rachel Olmanson
Aitkin County Soil and Water Conservation District:
Janet Smude
Steve Hughes
Crow Wing County Soil and Water Conservation District:
Melissa Barrick
Morrison County Soil and Water Conservation District:
Shannon Wettstein
Mississippi Headwaters Board
Tim Terrill
Minnesota Department of Natural Resources:
Rian Reed
Minnesota Department of Health:
Chris Parthun
Board of Water and Soil Resources:
Jeff Hrubes
U.S. Army Corps of Engineers:
Jason Hauser (Gull Lake)
Tamryn Frauenshuh (Big Sandy)
Editing and graphic design
PIO staff
Graphic design staff Administrative Staff
Cover photo credit
The MPCA is reducing printing and mailing costs by using the Internet to distribute reports and information to wider audience. Visit our website for more information.
The MPCA reports are printed on 100% post-consumer recycled content paper manufactured without
chlorine or chlorine derivatives.
Upper Mississippi River TSS TMDL Report Minnesota Pollution Control Agency
2
Contents Contents .............................................................................................................................................. 2
List of tables ........................................................................................................................................ 4
List of figures ....................................................................................................................................... 4
Acronyms ............................................................................................................................................. 6
Executive summary .............................................................................................................................. 8
1. Project overview ............................................................................................................................ 9
1.1 Purpose ................................................................................................................................................ 9
1.2 Identification of waterbodies ............................................................................................................ 10
1.3 TMDL Study Area ............................................................................................................................... 10
2. Applicable water quality standards and numeric water quality targets ........................................ 16
2.1 Designated uses ................................................................................................................................. 16
2.2 Priority ranking .................................................................................................................................. 16
2.3 Numeric standards for turbidity/TSS ................................................................................................. 16
2.3.1 Turbidity/TSS ................................................................................................................. 16
2.4 Antidegradation/Outstanding resource value waters ....................................................................... 17
3. Watershed and waterbody characterization ................................................................................ 18
3.1 River reaches ..................................................................................................................................... 18
3.2 Subwatersheds .................................................................................................................................. 20
3.3 Land use ............................................................................................................................................. 20
3.4 Current/historical water quality ........................................................................................................ 23
3.4.1 Total Suspended Solids .................................................................................................. 23
3.4.2 Fish bioassessments ...................................................................................................... 26
3.5 Pollutant source summary ................................................................................................................. 28
3.5.1 Permitted source types ................................................................................................. 28
3.5.2 Nonpermitted sources ................................................................................................... 31
3.5.3 Sediment Source Summary ........................................................................................... 41
4. TMDL development ..................................................................................................................... 41
4.1 Loading capacity methodology .......................................................................................................... 42
4.2 Wasteload allocation methodology ................................................................................................... 43
4.2.1 Regulated MS4 stormwater ........................................................................................... 43
4.2.2 Regulated construction stormwater.............................................................................. 43
4.2.3 Regulated industrial stormwater ................................................................................... 44
4.2.4 Regulated municipal and industrial wastewater ........................................................... 44
4.3 Load allocation methodology ............................................................................................................ 46

Upper Mississippi River TSS TMDL Report Minnesota Pollution Control Agency
3
4.4 Boundary condition (upstream subwatershed) allocation methodology .......................................... 46
4.5 Margin of safety ................................................................................................................................. 47
4.6 Seasonal variation .............................................................................................................................. 48
4.7 TMDL Summary ................................................................................................................................. 49
4.7.1 TSS TMDL: Mississippi River, Swan River to Willow River (07010103-708) .................. 49
4.7.2 TSS TMDL: Mississippi River, Willow River to Pine River (07010104-655) .................... 51
4.7.3 TSS TMDL: Mississippi River, Pine River to Crow Wing River (07010104-656) ............. 53
4.8 TSS Reductions ................................................................................................................................... 54
5. Future growth considerations ...................................................................................................... 55
5.1 New or expanding permitted MS4 WLA transfer process ................................................................. 55
5.2 New or expanding wastewater .......................................................................................................... 56
6. Reasonable assurance .................................................................................................................. 56
6.1 Reliable means of addressing pollutant loads ................................................................................... 57
6.1.1 Regulatory approaches .................................................................................................. 57
6.1.2 Nonregulatory................................................................................................................ 59
6.2 Implementation strategy ................................................................................................................... 61
6.3 Funding availability ............................................................................................................................ 61
6.4 Tracking progress and monitoring water quality response ............................................................... 62
6.5 Nonpoint source pollution reduction trends ..................................................................................... 62
7. Monitoring plan ........................................................................................................................... 63
8. Implementation strategy summary .............................................................................................. 64
8.1 Permitted sources .............................................................................................................................. 64
8.1.1 MS4 stormwater ............................................................................................................ 64
8.2 Nonpermitted sources ....................................................................................................................... 65
8.3 Education and outreach ..................................................................................................................... 66
8.4 Technical assistance ........................................................................................................................... 66
8.5 Partnerships ....................................................................................................................................... 66
8.6 Cost .................................................................................................................................................... 67
8.7 Adaptive management ...................................................................................................................... 67
9. Local Partner and Public Participation .......................................................................................... 67
9.1 Technical committee meetings .......................................................................................................... 67
9.2 Public Participation ............................................................................................................................ 68
10. Literature cited ............................................................................................................................ 68

Upper Mississippi River TSS TMDL Report Minnesota Pollution Control Agency
4
List of tables Table 1. Upper Mississippi River Mainstem Impairments. ......................................................................... 10 Table 2. TMDL Study Area (shaded red) and upstream subwatershed area TSS monitoring data. ........... 11 Table 3. Impaired Stream Reach HUC-8 watershed and reach length (miles) ........................................... 20 Table 4. Impaired Stream Reach Direct Drainage and Total Drainage Areas ............................................. 20 Table 5. Land Cover Summary for the TMDL Study Area (NLCD 2016). ..................................................... 20 Table 6. Observed TSS Exceedances from April to September (2009-2018). ............................................. 23 Table 7. Fish bioassessment results for the TMDL Study Area (2013), in order from most upstream to most downstream monitoring station. ....................................................................................................... 26 Table 8. Permitted Municipal Wastewater sources within TMDL Study Area. ........................................... 30 Table 9. Summary of types of watercourses in each subwatershed in the TMDL Study Area ................... 35 Table 10. Land use within a 150 m Buffer of the TMDL Study Area Impaired Stream Reaches (NLCD 2016) .................................................................................................................................................................... 37 Table 11. HSPF modeled TSS loads by source and impaired reach. ........................................................... 41 Table 12. Load duration curve data sources ............................................................................................... 43 Table 13. Regulated MS4 area by impaired reach ...................................................................................... 43 Table 14. 2014-2018 annual average percent of total county area under construction activity. .............. 44 Table 15. Percent of TMDL Study Area within each county. ...................................................................... 44 Table 16. 2014-2018 annual average percent of TMDL Study Area under regulated construction activity. .................................................................................................................................................................... 44 Table 17. Proportion of TMDL Study Area under regulated industrial activity. ......................................... 44 Table 18. Regulated wastewater AWWDF, effluent limit assumptions, and WLAs. ................................... 45 Table 19. TSS TMDL summary: Mississippi River, Swan River to Willow River (07010103-708) ................ 49 Table 20. TSS TMDL summary: Mississippi River, Willow River to Pine River (07010104-655) .................. 52 Table 21. TSS TMDL summary: Mississippi River, Pine River to Crow Wing River (07010104-656) ........... 54 Table 22. TSS reductions needed by impaired reach .................................................................................. 55 Table 23. Current easements within TMDL Study Area. ............................................................................. 61 Table 24. Upper Mississippi River TSS TMDL Technical Advisory Committee Meetings. ........................... 68
List of figures Figure 1. Upper Mississippi River 2013/2014 Monitoring and Assessment Study Summary. ...................... 9
Figure 2. Mississippi River, Swan River to Willow River (7010103-708) TMDL Study Area and upstream
subwatersheds. ........................................................................................................................................... 12
Figure 3. Mississippi River, Willow River to Pine River (7010104-655) TMDL Study Area and upstream
subwatersheds. ........................................................................................................................................... 13
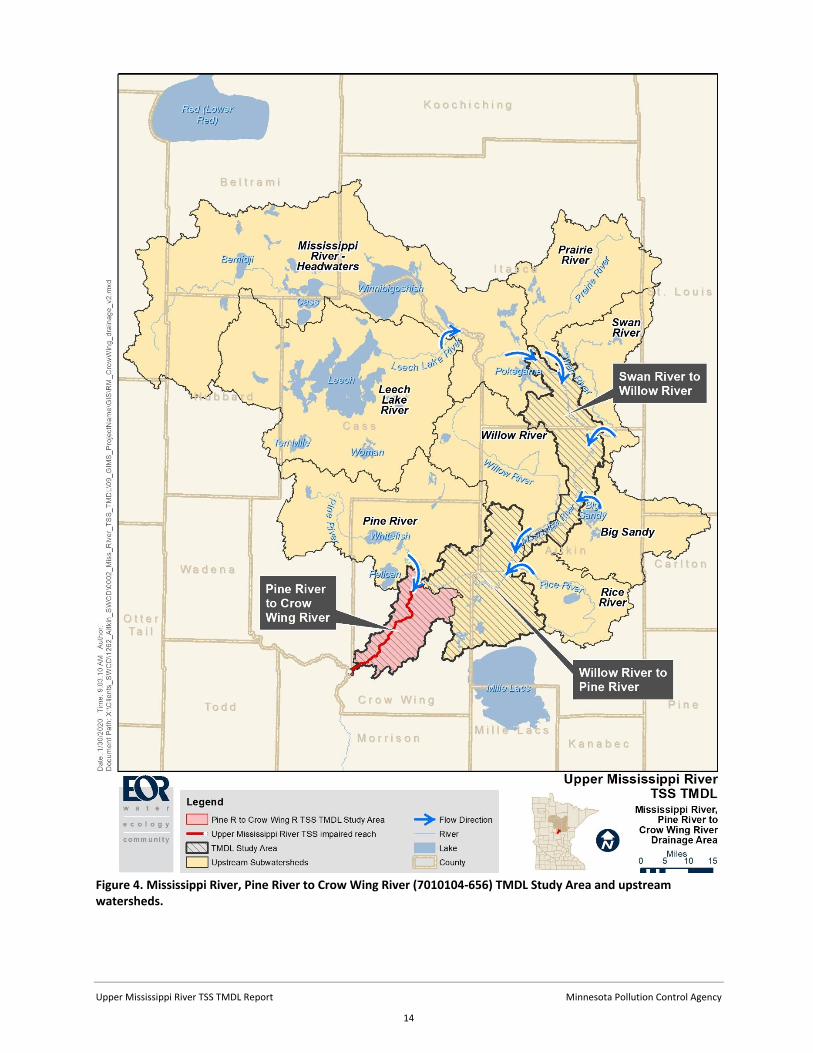
Figure 4. Mississippi River, Pine River to Crow Wing River (7010104-656) TMDL Study Area and upstream
watersheds. ................................................................................................................................................. 14
Figure 5. TMDL Study Area and TSS monitoring station locations. ............................................................ 15
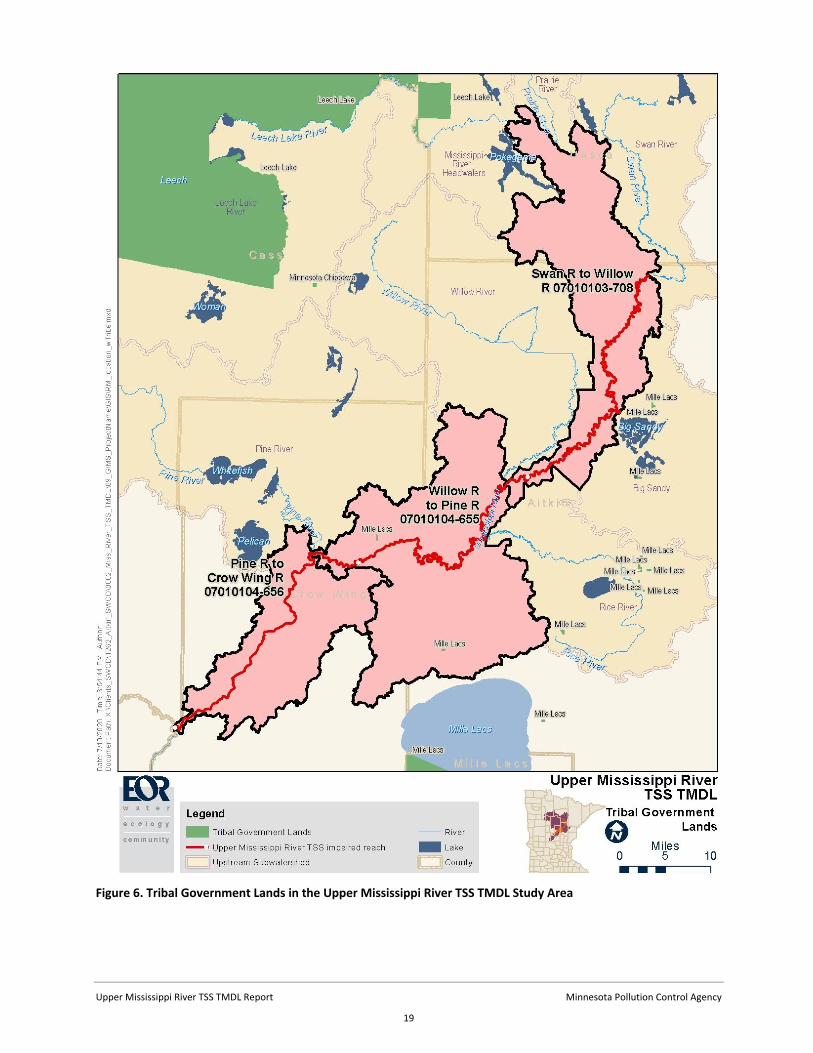
Figure 6. Tribal Government Lands in the Upper Mississippi River TSS TMDL Study Area......................... 19
Figure 7. TMDL Study Area subwatersheds and flow direction. ................................................................. 21
Figure 8. TMDL Study Area land cover (NLCD 2016). .................................................................................. 22
Figure 9. Distribution of total suspended solids concentrations along the main stem of the Mississippi
River from Cohasset Dam to Crow Wing River moving upstream to downstream (April-September, 2009-
2018). .......................................................................................................................................................... 24
Upper Mississippi River TSS TMDL Report Minnesota Pollution Control Agency
5
Figure 10. Monthly distribution of TSS concentrations at CSAH 1 Bridge at Aitkin (07010104-655 at S002-
010). ............................................................................................................................................................ 25
Figure 11. Total suspended solids concentration (in mg/L) and discharge flow (in cubic feet per second)
relationship at CSAH 1 Bridge at Aitkin (07010104-655 at S002-010, USGS station 05227500) plotted with
a statistically significant linear trend line and 95% confidence interval with a p-value of less than 0.001.
.................................................................................................................................................................... 25
Figure 12. TMDL Study Area 2013 biological monitoring sites. .................................................................. 27
Figure 13. MS4 jurisdictional boundaries within the TMDL Study Area. .................................................... 29
Figure 14. TMDL Study Area geologic associations. ................................................................................... 32
Figure 15. USGS streamflow annual duration hydrograph for the Mississippi River at Aitkin, MN (USGS
05227500). .................................................................................................................................................. 33
Figure 16. PRISM 1981-2010 normal monthly precipitation for the Upper Mississippi River Watershed
(PRISM Climate Group). .............................................................................................................................. 34
Figure 17. Historic stream development of the Upper Mississippi River south of Warba, MN shown in
LiDAR. .......................................................................................................................................................... 35
Figure 18. Altered watercourses in the Upper Mississippi River watersheds. ........................................... 36
Figure 19. Example of streambank erosion in rural areas at biological monitoring station 13UM017.
Photo taken by MPCA Staff August 8, 2013. ............................................................................................... 38
Figure 20. HSPF Predicted subbasin TSS yield (lb/acre/year) for the TMDL Study Area (1996-2015). ...... 39
Figure 21. HSPF modeled TSS loads by source and impaired reach. .......................................................... 40
Figure 22. HSPF TSS delivery to model outlet regression equations for the Mississippi River-Grand Rapids
Watershed. .................................................................................................................................................. 47
Figure 23. HSPF TSS delivery to model outlet regression equations for the Mississippi River-Brainerd
Watershed. .................................................................................................................................................. 47
Figure 24. TSS load duration curve: Mississippi River, Swan River to Willow River (07010103-708) ......... 49
Figure 25. TSS load duration curve: Mississippi River, Willow River to Pine River (07010104-655) .......... 51
Figure 26. TSS load duration curve: Mississippi River, Pine River to Crow Wing River (07010104-656) .... 53
Figure 27. Adaptive management ............................................................................................................... 67
Upper Mississippi River TSS TMDL Report Minnesota Pollution Control Agency
6
Acronyms AUID Assessment Unit Identification
AWWDF annual wet weather design flow
BC Boundary condition
BMP best management practice
BOD biochemical oxygen demand
BWSR Board of Water and Soil Resources
cfs cubic feet per second
CREP Conservation Reserve Enhancement Program
CRP Conservation Reserve Program
CSP Conservation Stewardship Program
DNR Minnesota Department of Natural Resources
EPA United States Environmental Protection Agency
EQIP Environmental Quality Incentives Program
F-IBI Fish Index of Biological Integrity
gSSURGO Gridded Soil Survey Geographic Database
HSPF Hydrologic Simulation Program-FORTRAN
HUC Hydrologic Unit Code
IDDE Illicit Discharge Detection and Elimination
kg kilogram
LA load allocation
Lb pound
LiDAR Light Detection and Ranging
m meter
MAWQCP Minnesota Agricultural Water Quality Certification Program
MDA Minnesota Department of Agriculture
MDF maximum design flow
mg/L milligrams per liter
MGS Minnesota Geological Survey
mL milliliter
MOS Margin of Safety
MPCA Minnesota Pollution Control Agency
MR-B Mississippi River-Brainerd
MR-GR Mississippi River-Grand Rapids

Upper Mississippi River TSS TMDL Report Minnesota Pollution Control Agency
7
MS4 Municipal Separate Storm Sewer Systems
NLCD National Land Cover Database
NPDES National Pollutant Discharge Elimination System
NRCS Natural Resources Conservation Service
NRS Nutrient Reduction Strategy
NTU Nephelometric Turbidity Unit
NVSS nonvolatile suspended solids
OHWM ordinary high water mark
ORVW Outstanding Resource Value Water
PWP Permanent Wetland Preserve
RIM Reinvest in Minnesota
SFIA Sustainable Forest Incentive Act
sq. mi. square mile
SWCD Soil and Water Conservation District
SWPPP Stormwater Pollution Prevention Plan
TAC Technical Advisory Committee
TMDL Total Maximum Daily Load
TP total phosphorus
TSS total suspended solids
USDA United States Department of Agriculture
USGS United States Geological Survey
USLE Universal Soil Loss Equation
VSS volatile suspended solids
WLA wasteload allocation
WPLMN Watershed Pollutant Load Monitoring Network
WRAPS Watershed Restoration and Protection Strategy
WRP Wetland Reserve Program
WWTF wastewater treatment facility
WWTP wastewater treatment plant

Upper Mississippi River TSS TMDL Report Minnesota Pollution Control Agency
8
Executive summary The Clean Water Act (1972) requires that each state develop a Total Maximum Daily Load (TMDL) Study
for any waterbody that is deemed impaired by state regulations. A TMDL identifies the pollutant that is
causing the impairment and how much of that pollutant can enter the waterbody and still meet water
quality standards.
This TMDL study addresses total suspended solids (TSS) impairments in three reaches of the Upper
Mississippi River that are on Minnesota’s 2018 303(d) list of impaired waters: Swan River to Willow River
(07010103-708); Willow River to Pine River (07010104-655); and Pine River to Crow Wing River
(07010104-656). The Upper Mississippi River is located in North Central Minnesota, and the impaired
reaches extend from near Grand Rapids in Itasca County to near Brainerd in Crow Wing County.
Information from multiple sources was used to evaluate the ecological health of each waterbody:
All available water quality data from the TMDL 10-year time period (2009 through 2018)
Mississippi River-Grand Rapids (MR-GR) Watershed Hydrologic Simulation Program – FORTRAN
(HSPF) model
Mississippi River-Brainerd (MR-B) Watershed HSPF model
U.S. Army Corps of Engineers Dam Operation and Maintenance Reports
Relevant biological observation data
Stakeholder input
The following pollutant sources were evaluated for each stream: loading from upstream waterbodies;
point sources; geologic conditions; near stream development; and watershed runoff. This TMDL study
used a load duration curve for each impaired stream based on TSS concentration data from April
through September during the TMDL 10-year time period of 2009 through 2018, paired with HSPF
simulated flows by date. These models were then used to determine the pollutant reductions needed
for the impaired waterbodies to meet water quality standards.
The dominant source of sediment to the Upper Mississippi River within the TMDL Study Area is nonpoint
sources, in particular bed and bank erosion of the finely-grained, easily erodible Glacial Lake
Aitkin/Upham clay deposits. Historical ditching in peatlands has resulted in a significant amount of
altered watercourses in the Study Area. Consequences of altered hydrology include channel instability
characterized by bank erosion and streambed material alteration, as well as increasing the amount of
water in downstream reaches. Land use conversions near the river channel also contribute sediment
through greater soil erosion from physical trampling of the banks from livestock, less stabilization of the
soil from shallow rooted plants, more areas of exposed soil, and more concentrated runoff flowpaths.
Watershed runoff and regulated wastewater and stormwater sources contribute a small fraction of the
total sediment to the Upper Mississippi River TMDL Study Area.
The TMDL study’s results will aid in the future management and improvement in the watershed.
Following completion of the TMDL process, the Upper Mississippi River TMDL Report will be publically
available on the Minnesota Pollution Control Agency (MPCA) MR-GR and MR-B Watershed websites:
https://www.pca.state.mn.us/water/watersheds/mississippi-river-grand-rapids

Upper Mississippi River TSS TMDL Report Minnesota Pollution Control Agency
9
https://www.pca.state.mn.us/water/watersheds/mississippi-river-brainerd
1. Project overview
1.1 Purpose
The large rivers of Minnesota are managed using a similar monitoring, assessment, planning, and
restoration process as other waterbodies in the state. The MPCA began monitoring large rivers in 2013,
starting with the Mississippi River from its headwaters to the St. Anthony Falls in Minneapolis,
Minnesota. The results from the first monitoring and assessment study completed in 2013/2014 are
summarized in the Upper Mississippi River: Monitoring and Assessment Study summary (MPCA 2017)
and in Figure 1 below.
Figure 1. Upper Mississippi River 2013/2014 Monitoring and Assessment Study Summary.

Upper Mississippi River TSS TMDL Report Minnesota Pollution Control Agency
10
The State of Minnesota has determined that three reaches of the Upper Mississippi River - Swan River to
Willow River (07010103-708), Willow River to Pine River (07010104-655), and Pine River to Crow Wing
River (07010104-656) - are impaired because they exceed established state water quality standards for
TSS and do not support their designated aquatic life uses. In accordance with the Clean Water Act, the
state must conduct TMDL studies on the impaired waters. The goals of this TMDL are to provide
wasteload allocations (WLA) and load allocations (LA) for pollutant sources within the TMDL Study Area
for the impaired portions of the Upper Mississippi River mainstem, and to quantify the pollutant
reductions needed to meet Minnesota water quality standards.
Other watershed studies completed that are referenced in this TMDL include:
Mississippi River – Brainerd Watershed TMDL Study
Mississippi River – Grand Rapids Watershed TMDL Study
1.2 Identification of waterbodies
This TMDL study addresses three turbidity/TSS impairments on the mainstem of the Upper Mississippi
River located between Grand Rapids and Brainerd (Table 1).
Table 1. Upper Mississippi River Mainstem Impairments.
Affected Use: Pollutant/Stressor AUID
Stream Name
Location/Reach Description
Designated Use Class
Listing Year
Impairment Addressed by:
Aquatic Life:
TSS 07010103-708
Mississippi River
Swan River to Willow River
2Bg, 3C 2016 TSS TMDL
Aquatic Life:
Turbidity 07010104-655
Mississippi River
Willow River to Pine River
2Bg, 3C 1998* TSS TMDL
Aquatic Life:
TSS 07010104-656
Mississippi River
Pine River to Crow Wing River
2Bg, 3C 2016 TSS TMDL
* The turbidity impairment was originally listed based on nephelometric turbidity unit (NTU) data; however, this reach also exceeds the TSS standard and will be addressed by a TSS TMDL based on TSS monitoring data collected during the TMDL 10-year timeframe (2009-2018).
1.3 TMDL Study Area
The Upper Mississippi River begins at Lake Itasca in northern Minnesota. It flows first north, and then
easterly through Lake Winnibigoshish and Pokegama Lakes, before turning south and west through
Aitkin and Brainerd (Figure 2). The total drainage area to the most downstream segment of the impaired
portion of the Upper Mississippi River at the confluence with the Crow Wing River includes all of four
major watersheds (Upper Mississippi River-Headwaters, MR-GR, Pine River, and Leech Lake River) and a
portion of one major watershed (MR-B), for a total of 7,061 square miles in portions of Clearwater,
Becker, Hubbard, Beltrami, Itasca, Cass, St. Louis, Carlton, Aitkin, and Crow Wing counties.
The MPCA completes assessments and TMDLs for lakes and streams within each major watershed
separately from the large river mainstems. Therefore, only a portion of the total drainage area to the
impaired reaches of the Upper Mississippi River were included in this TMDL (the TMDL Study Area). Only
pollutant sources within the TMDL Study Area are addressed by this TMDL. The TMDL Study Area was
defined as the drainage area located downstream of any subwatershed with a monitoring station

Upper Mississippi River TSS TMDL Report Minnesota Pollution Control Agency
11
located near its outlet that has less than 10% of TSS samples exceeding the water quality standard of 15
mg/L based on all data collected between 2007 through 2016 (Table 2). TSS monitoring station locations
are depicted in Figure 5.
The TMDL Study Area and upstream subwatersheds are depicted for the Mississippi River, Swan River to
Willow River (07010103-708) in Figure 2, for the Mississippi River, Willow River to Pine River (07010104-
655) in Figure 3, and for the Mississippi River, Pine River to Crow Wing River (07010104-656) in Figure 4.
Table 2. TMDL Study Area (shaded red) and upstream subwatershed area TSS monitoring data.
Subwatershed Name
(HUC) Subwatershed Area (sq. mi.)
Monitoring Station
Number of Samples
Number of Exceedances
Percentage of Exceedances
Mississippi River Headwaters (07010101)
1,920 S003-656 320 0 0%
Leech Lake River (07010102)
1,341
Prairie River (0701010301 & 0701010302)
508 S003-667 12 0 0%
Swan River (0701010304)
328 S001-922 166 10 6%
Big Sandy River (0701010305 & 0701010306)
409 NA NA NA NA
Swan River to Willow River (07010103-708) TMDL Study Area 321
S000-153 28 12 43%
S003-663 56 44 79%
Willow River (2 HUC10s) (0701010307, 0701010308)
516 S008-442 20 0 0%
Rice River (HUC10) (0701010401)
297 S002-951 16 1 6%
Willow River to Pine River (07010104-655) TMDL Study Area
428 S002-010 370 296 80%
S000-152 36 32 89%
Pine River (HUC8) (07010105)
783 S000-181 184 2 1%
Pine River to Crow Wing River
(07010104-656) TMDL Study Area 210
S000-572 36 10 28%
S007-337 36 10 28%
S000-570 36 10 28%

Upper Mississippi River TSS TMDL Report Minnesota Pollution Control Agency
12
Figure 2. Mississippi River, Swan River to Willow River (7010103-708) TMDL Study Area and upstream subwatersheds.

Upper Mississippi River TSS TMDL Report Minnesota Pollution Control Agency
13
Figure 3. Mississippi River, Willow River to Pine River (7010104-655) TMDL Study Area and upstream subwatersheds.
Upper Mississippi River TSS TMDL Report Minnesota Pollution Control Agency
14
Figure 4. Mississippi River, Pine River to Crow Wing River (7010104-656) TMDL Study Area and upstream watersheds.

Upper Mississippi River TSS TMDL Report Minnesota Pollution Control Agency
15
Figure 5. TMDL Study Area and TSS monitoring station locations.
Upper Mississippi River TSS TMDL Report Minnesota Pollution Control Agency
16
2. Applicable water quality standards and numeric water quality targets
Water quality standards are the fundamental regulatory and policy foundation to preserve and restore
the quality of all waters of the state. They consist of three elements:
Classifying waters with designated beneficial uses;
Narrative and numeric standards to protect those uses; and
Antidegradation policies to maintain existing uses, protect high quality waters, and preserve
waters of outstanding value.
2.1 Designated uses
As part of Minnesota’s water quality standards, each stream in the state has a designated use
classification defined by the MPCA, which defines the optimal purpose for that waterbody (see Table 1).
The streams addressed by this TMDL fall into one designated use classification:
2Bg, 3C – Cool or warm water stream capable of supporting and maintaining a balanced,
integrated, adaptive community of warm or cool water aquatic organisms that meet or exceed
the General Use biological criteria; industrial cooling and materials transport without high level
of treatment
Class 2 waters are protected for aquatic life and aquatic recreation and class 3 waters are protected for
industrial consumption as defined by Minn. R. ch. 7050.0140. The most protective designated use class
in this study is 2Bg, for which water quality standards are provided below.
2.2 Priority ranking
The MPCA’s schedule for TMDL completions, as indicated on Minnesota’s Section 303(d) impaired
waters list, reflects Minnesota’s priority ranking of this TMDL. The MPCA has aligned our TMDL priorities
with the watershed approach and our Watershed Restoration and Protection Strategy (WRAPS) cycle. As
the TMDL Study Area crosses two watersheds, it was completed outside of, but concurrent with, the
MR-GR and MR-B WRAPS cycles. The schedule for TMDL completion corresponds to the WRAPS report
completion on the 10-year cycle. The MPCA developed a state plan Minnesota’s TMDL Priority
Framework Report to meet the needs of EPA’s national measure (WQ-27) under EPA’s Long-Term Vision
for Assessment, Restoration and Protection under the Clean Water Act Section 303(d) Program. As part
of these efforts, the MPCA identified water quality impaired segments that will be addressed by TMDLs
by 2022. The Upper Mississippi River waters addressed by this TMDL are part of that MPCA prioritization
plan to meet EPA’s national measure.
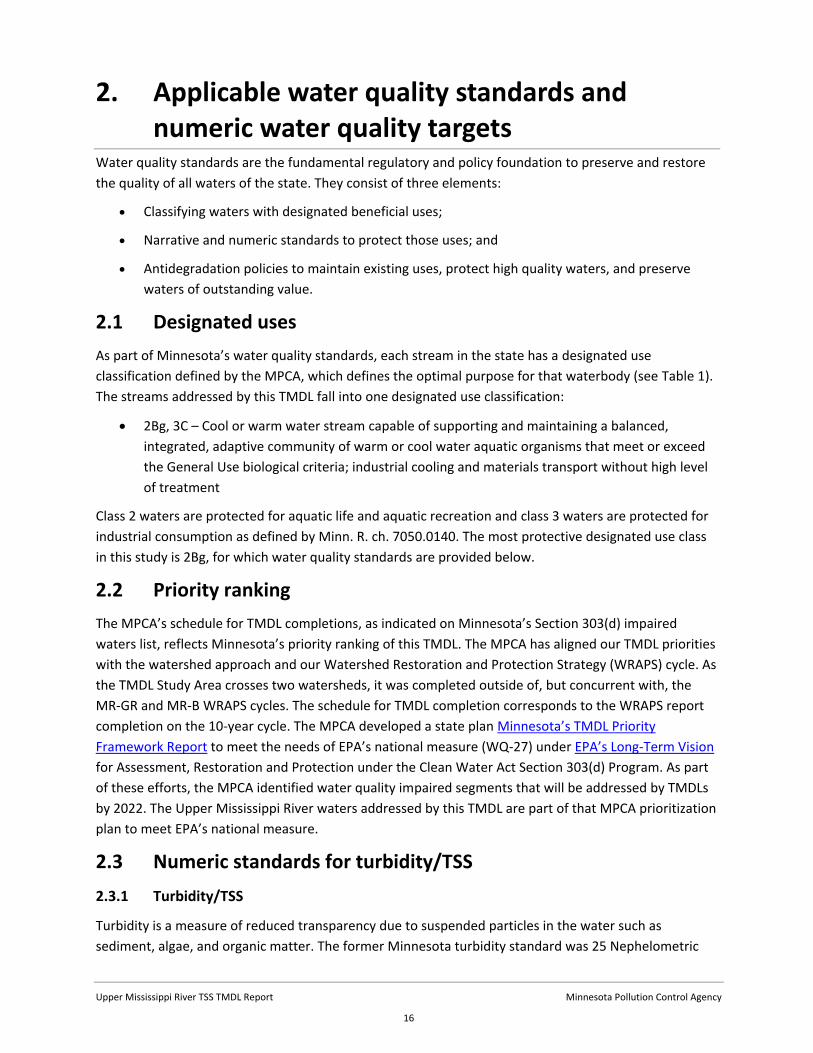
2.3 Numeric standards for turbidity/TSS
2.3.1 Turbidity/TSS
Turbidity is a measure of reduced transparency due to suspended particles in the water such as
sediment, algae, and organic matter. The former Minnesota turbidity standard was 25 Nephelometric

Upper Mississippi River TSS TMDL Report Minnesota Pollution Control Agency
17
Turbidity Unit (NTU) for class 2B waters (see Section 2.1 for a definition of the designated use classes).
One portion of the Upper Mississippi River Basin was assessed against the class 2B turbidity standard
first established in 1967 (25 NTU). A minimum of 20 independent observations was required for the
turbidity assessment, and a stream was listed as impaired by turbidity if 10% or more of the
observations were in violation of the turbidity standard.
The State of Minnesota, in 2014, amended state water quality standards and replaced stream water
quality standards for turbidity with standards for TSS. One component of the rationale for this change is
that the turbidity unit (NTUs) previously used is not concentration-based and therefore not well-suited
to load-based studies (Markus 2011). The turbidity impairment for the Mississippi River, Willow River to
Pine River, was originally listed in 1998 based on turbidity NTU data; however, this reach also exceeds
the TSS standard and will be addressed by a TSS TMDL based on TSS monitoring data collected during
the TMDL 10-year timeframe (2009 through 2018).
The TSS criteria for Minnesota are stratified by geographic region and stream class due to regional
differences in geology and biological sensitivity differences based on stream size. The assessment
window for these samples is April-September, so any TSS data collected outside of this period will not be
considered for assessment purposes. The TMDL Study Area is located in the Northern River Nutrient
Region with a TSS standard for streams of 15 milligrams per liter (mg/L). For assessment, this
concentration is not to be exceeded in more than 10% of samples within a 10-year data window. TSS
samples are analyzed by state-certified laboratories. TSS load duration curves and TMDLs were
developed for three stream impairments.
For more information, refer to the Aquatic Life Water Quality Standards Draft Technical Support
Document for Total Suspended Solids (Turbidity) (Markus 2011), and the Minnesota Nutrient Criteria
Development for Rivers report (Heiskary et al. 2013).
2.4 Antidegradation/Outstanding resource value waters
Antidegradation (formerly referred to as nondegradation) is the third element of water quality
standards. Antidegradation protections help maintain high quality waters (waters better than what is
necessary to protect aquatic life and recreation) from deterioration. Antidegradation protections were
established to provide future generations with the opportunity to enjoy high quality and highly valued
recreational and aesthetic resources that might suffer degradation without them. Preventing
degradation is almost always less costly and more effective than restoration, which cannot always be
fully achieved.
Three levels of protection are incorporated into antidegradation rules:
Existing uses of the water body must be maintained and protected.
Existing high water quality must be maintained unless a lowering of water quality is deemed
necessary to accommodate important economic and social development.
The exceptional characteristics of specific waters designated in Minnesota rules as outstanding,
very sensitive, or unique resources – called “outstanding resource value waters” or ORVWs
(Minn. R. 7050.0335) -- must be maintained and protected.

Upper Mississippi River TSS TMDL Report Minnesota Pollution Control Agency
18
The three impaired reaches of the Upper Mississippi River addressed by this TMDL are designated as
ORVW – Restricted as defined in Minn. R. 7050.0335, subp. 1B: “portions of the Mississippi River from
Lake Itasca to the southerly boundary of Morrison County that are included in the Mississippi River
Headwaters Board comprehensive plan dated February 12, 1981.” If there is an improvement (in
exceptional characteristics) of an ORVW as a result of changes to control conditions specified in a
permit/control document, or if a regulated activity ceases to discharge or adversely impact an ORVW,
then the ‘bar’ is reset at a higher level to prevent any degradation of the (improved) ORVW.
3. Watershed and waterbody characterization
The majority of the TMDL Study Area is located in either the Tamarack Lowlands subsection or the St.
Louis Moraines subsection of Minnesota’s ecological classification system. Much of the Tamarack
Lowlands subsection is occupied by glacial lacustrine sediments from the Glacial Lake Upham and Glacial
Lake Aitkin, including extensive areas of peat over both fine-textured silts and clays, and sandy
lacustrine deposits. These fine-grained soils are highly susceptible to erosion when disturbed, and bank
erosion is frequently observed along the Mississippi River where the channel cuts through these glacial
lake clays. The underlying geology of the TMDL Study Area is a contributor to high TSS levels in the
impaired reaches of the Upper Mississippi River; see Section 3.5.2.1 for more details.
Pre-European settlement vegetation consisted of conifer and hardwood forests with extensive sedge
meadows in the lowlands (https://www.dnr.state.mn.us/ecs/212Nd/index.html). The St. Louis Moraines
subsection is recognizable by the distinct end moraines of the St. Louis and Koochiching Sublobes.
Loamy calcareous soils make up the majority of the soils in this region. Pre-European settlement
vegetation was defined by large areas of white pine-red pine forests and northern hardwoods south of
Grand Rapids (https://www.dnr.state.mn.us/ecs/212Nb/index.html).
Natural conditions in this stretch of the Mississippi River were first modified in the late 1800s and early
1900s, with the construction of the Mississippi Headwater dams to improve navigation and support
logging activity. More information about the history of the Mississippi River Headwaters Reservoirs can
be found in the Mississippi River Headwaters Reservoirs Master Plan (U.S. Army Corps of Engineers
2016). During this time, riverboats were an important form of navigation with at times multiple
companies competing with each other. Many of these riverboats were built too long to maneuver along
the sinuous Mississippi River and therefore would occasionally rub up against the banks, destabilizing
them and causing erosion (Hart 1952).
There are two small areas of Mille Lacs Band of Ojibwe Off-Reservation Trust Land located within the
TMDL Study Area (see Figure 6). The Mille Lacs Band of Ojibwe was invited to participate in the WRAPS
process by MPCA in August of 2016.
3.1 River reaches
The three impaired reaches of the Upper Mississippi River are all located within the Northern Lakes and
Forest Ecoregion and the Northern River Nutrient Region. The United States Geological Survey
Hydrologic Unit Code (HUC) Level 8 (HUC-8) watershed and reach length for each impaired large river
reach are summarized in Table 3.
Upper Mississippi River TSS TMDL Report Minnesota Pollution Control Agency
19
Figure 6. Tribal Government Lands in the Upper Mississippi River TSS TMDL Study Area

Upper Mississippi River TSS TMDL Report Minnesota Pollution Control Agency
20
Table 3. Impaired Stream Reach HUC-8 watershed and reach length (miles)
Impaired AUID Impaired Reach Description HUC 8 Watershed Length (miles)
07010103-708 Mississippi River, Swan River to Willow River Mississippi River – Grand Rapids 60.13
07010104-655 Mississippi River, Willow River to Pine River Mississippi River – Brainerd 54.4
07010104-656 Mississippi River, Pine River to Crow Wing River
Mississippi River – Brainerd 33.21
3.2 Subwatersheds
The TMDL Study Area in acres for each impaired reach are listed in Table 4 and shown with flow
direction arrows in Figure 7. See Section 1.2 for the method for how the TMDL Study Area was
determined and the upstream subwatersheds of each impaired reach.
Table 4. Impaired Stream Reach Direct Drainage and Total Drainage Areas
Impaired AUID Impaired Reach Description TMDL Study
Area (sq. mi.)
Upstream Subwatershed Area (sq. mi.)
Total Drainage Area
(sq. mi.)
07010103-708 Mississippi River, Swan River to Willow River 321 4,506 4,827
07010104-655 Mississippi River, Willow River to Pine River 428 5,640 6,068
07010104-656 Mississippi River, Pine River to Crow Wing River 210 6,851 7,061
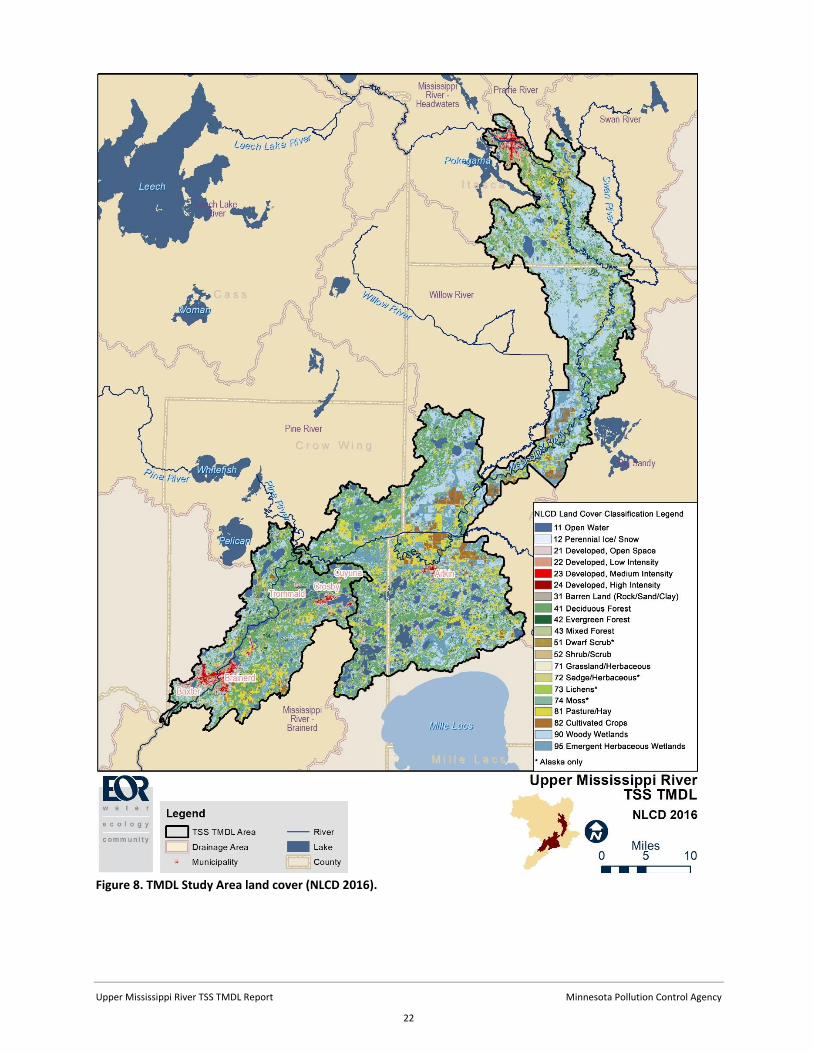
3.3 Land use
Land cover in the TMDL Study Area was assessed using the Multi-Resolution Land Characteristics
Consortium 2016 National Land Cover Database (NLCD) (https://www.mrlc.gov/national-land-cover-
database-nlcd-2016). Land cover is necessary to draw conclusions about pollutant sources and best
management practices (BMP) that may be applicable within each subwatershed. The land cover
distribution within the drainage area to each impaired stream reach is summarized in Table 5 and Figure
8. The land cover categories in Table 5 are simplified to reduce the overall number of categories.
Wetlands include woody wetlands and emergent herbaceous wetlands. Forest includes deciduous
forest, evergreen forest, and mixed forest. Agriculture includes hay pasture and cultivated crops.
Developed includes developed open space, developed low intensity, developed medium intensity and
developed high intensity. Wetlands and forest make up the majority of the land cover in the TMDL Study
Area with 40% and 33%, respectively.
Table 5. Land Cover Summary for the TMDL Study Area (NLCD 2016).
Impaired Large River AUID
TMDL Study Area
(sq. mi.) Open Water
Barren Land Wetlands Grasslands
Forest & Shrubs Agriculture Developed
07010103-708 321 4% 0.1% 50% 1% 33% 8% 4%
07010104-655 428 9% 0.1% 40% 1% 31% 15% 4%
07010104-656 210 11% 0.2% 26% 1% 40% 11% 10%

Upper Mississippi River TSS TMDL Report Minnesota Pollution Control Agency
21
Figure 7. TMDL Study Area subwatersheds and flow direction.
Upper Mississippi River TSS TMDL Report Minnesota Pollution Control Agency
22
Figure 8. TMDL Study Area land cover (NLCD 2016).

Upper Mississippi River TSS TMDL Report Minnesota Pollution Control Agency
23
3.4 Current/historical water quality
3.4.1 Total Suspended Solids
Sediment transport in a watershed is a naturally occurring process that shapes everything from the
shape of the uplands to the shape and characteristics of the riparian areas. Human activity such as
agriculture and urbanization can augment this natural process. In the TMDL Study Area, the sediment
transport process has been changed by land use change caused from logging, agriculture, and
urbanization, and from flow alteration caused by the Mississippi River Headwaters Reservoirs and legacy
peatland ditching.
TSS data in the TMDL Study Area for the period of 2009 through 2018 were compared to the water
quality standards described in Section 2. The percentage of TSS exceedances was greater than 10% at
every monitoring station along the impaired stream reaches of the TMDL Study Area (Table 6). The
distribution of TSS concentrations between April and September for each monitoring station in the
project study area is shown in Figure 9. TSS concentrations begin to increase above the water quality
standard before the impaired stream reach at monitoring station S007-332, 7.9 miles south of Warba.
The number of TSS exceedances continues to increase downstream until station S000-152, north of
Crosby, with a peak percentage of exceedances of 89%. Downstream of the Pine River confluence with
the Mississippi River mainstem, TSS concentrations begin to decrease. The locations of the water quality
monitoring stations are shown in Figure 5 in Section 1.3.
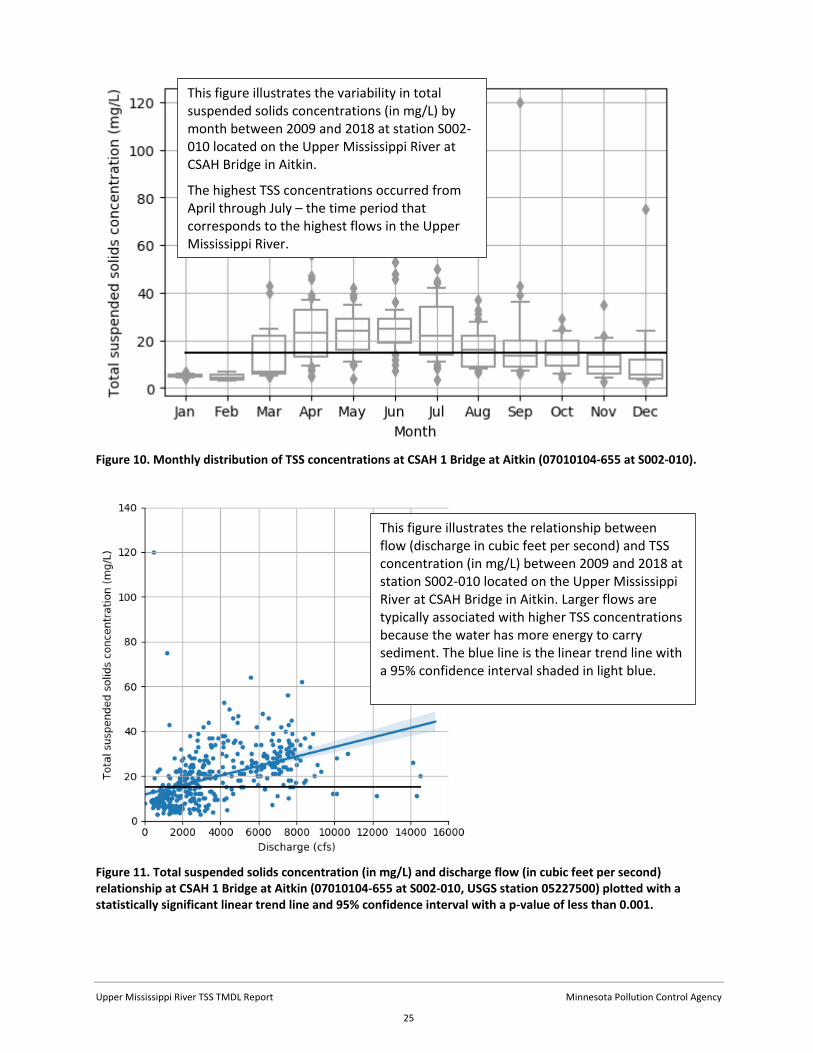
The monthly distribution of TSS concentrations in the TMDL Study Area was characterized using the full
dataset (808 measurements) at station S002-010, Mississippi River at CSAH Bridge in Aitkin (Figure 10).
The highest TSS concentrations occurred from March through July (Figure 10), which is the time period
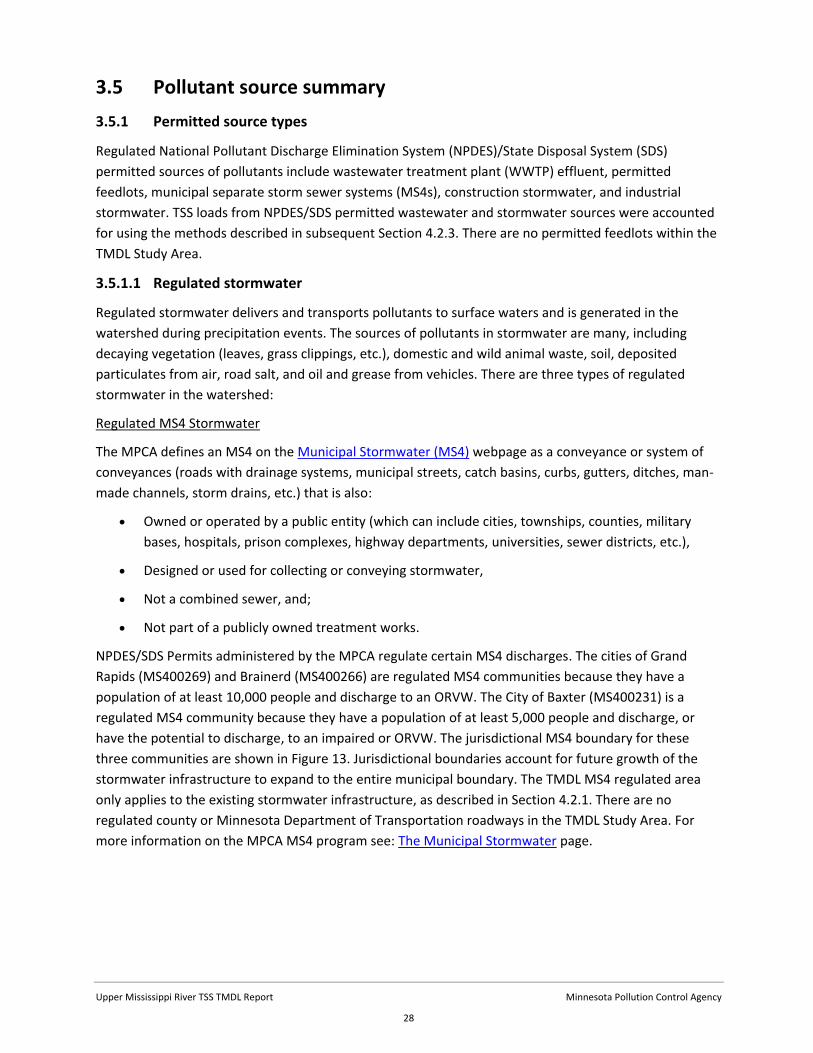
that corresponds to the highest flow in the Mississippi River. This relationship is also shown in Figure 11,
which shows larger flows being associated with higher TSS concentrations as the water has more energy
to carry sediment.
Table 6. Observed TSS Exceedances from April to September (2009-2018).
Impaired Reach (AUID)
Monitoring Station
(Upstream to Downstream)
Number of Samples
Number of Exceedances (> 15 mg/L)
Percentage of Exceedances
90th Percentile
Concentration (mg/L)
Mississippi River, Swan River to Willow River
(07010103-708)
S000-153 28 12 43% 18
S003-663 56 44 79% 39
Mississippi River, Willow River to Pine River
(07010104-655)
S002-010 370 296 80% 38
S000-152 36 32 89% 30.5
Mississippi River, Pine River to Crow Wing River
(07010104-656)
S000-572 36 10 28% 19
S007-337 36 10 28% 20.5
S000-570 36 10 28% 20.5

Upper Mississippi River TSS TMDL Report Minnesota Pollution Control Agency
24
Figure 9. Distribution of total suspended solids concentrations along the main stem of the Mississippi River from Cohasset Dam to Crow Wing River moving upstream to downstream (April-September, 2009-2018). Whiskers represent the 10th percentile and 90th percentile TSS concentrations. The sample size is displayed below the corresponding box plot.
This figure illustrates the distribution of TSS concentrations for each monitoring station along the Upper Mississippi River from Cohasset Dam to the confluence with the Crow Wing River, in order of most upstream station on the left to the most downstream station on the right. The blue shading represents the impaired large river reaches.
TSS concentrations begin to increase above the water quality standard before the impaired large river reaches at station S007-332, 7.9 miles south of Warba. The number of TSS exceedances continues to increase downstream until station S000-152, north of Crosby, with a peak percentage of exceedances of 89%. Downstream of the Pine River confluence TSS concentrations begin to decrease.
Upper Mississippi River TSS TMDL Report Minnesota Pollution Control Agency
25
Figure 10. Monthly distribution of TSS concentrations at CSAH 1 Bridge at Aitkin (07010104-655 at S002-010).
Figure 11. Total suspended solids concentration (in mg/L) and discharge flow (in cubic feet per second) relationship at CSAH 1 Bridge at Aitkin (07010104-655 at S002-010, USGS station 05227500) plotted with a statistically significant linear trend line and 95% confidence interval with a p-value of less than 0.001.
This figure illustrates the variability in total suspended solids concentrations (in mg/L) by month between 2009 and 2018 at station S002-010 located on the Upper Mississippi River at CSAH Bridge in Aitkin.
The highest TSS concentrations occurred from April through July – the time period that corresponds to the highest flows in the Upper Mississippi River.
This figure illustrates the relationship between flow (discharge in cubic feet per second) and TSS concentration (in mg/L) between 2009 and 2018 at station S002-010 located on the Upper Mississippi River at CSAH Bridge in Aitkin. Larger flows are typically associated with higher TSS concentrations because the water has more energy to carry sediment. The blue line is the linear trend line with a 95% confidence interval shaded in light blue.

Upper Mississippi River TSS TMDL Report Minnesota Pollution Control Agency
26
3.4.2 Fish bioassessments
The Fish Index of Biological Integrity (F-IBI) is a biological monitoring framework used to quantify
changes in the composition of biological communities. The presence of a diverse and reproducing
aquatic community is a good indication that the aquatic life beneficial use is being supported by a
stream. The aquatic community integrates the cumulative impacts of pollutants, habitat alteration, and
hydrologic modification on a waterbody over time. Degradation of surface waters can lead to changes in
biological communities as pollutant intolerant species are replaced by pollutant tolerant species.
Characterization of an aquatic community is accomplished using the IBI, which incorporates multiple
attributes of the aquatic community, called “metrics,” to evaluate complex biological systems. These
metric scores are summed within each class and rescaled to a 0-100 range, with 100 being the highest
score. For further information regarding the development of stream Index of Biological Integrity (IBIs),
refer to the Development of a F-IBI for Minnesota’s Rivers and Streams (MPCA 2014a).
F-IBI scores along the Upper Mississippi River mainstem reaches impaired by TSS all exhibited good fish
ratings, with F-IBI scores above the upper confidence interval (Table 7, Figure 12). The total number of
fish species observed at each monitoring station ranged from 11 to 24. The good F-IBI metric scores and
ratings indicate that the current biology is either not impacted by the existing TSS exceedances, or is
adapted to the existing TSS exceedances. F-IBI scores represent the cumulative impacts of pollutants,
habitat alteration, and hydrologic modification on a waterbody to the fish community over time.
Therefore, good F-IBI scores indicate that the fish community is not negatively impacted by pollutants
(in this case high TSS levels), habitat alteration, and hydrologic modifications to the impaired portions of
the Mississippi River.
Table 7. Fish bioassessment results for the TMDL Study Area (2013), in order from most upstream to most downstream monitoring station.
Impaired AUID
Monitoring Station
Location Description Sample Date Total Species F-IBI Rating
07010103-708
13UM019 Upstream of Pokegama Creek August 14, 2013 11 71 Good
13UM018 Upstream of Sandy River July 23, 2013 18 66 Good
07010104-655
13UM017 Upstream of Rice River July 22, 2013 19 69 Good
August 8, 2013 17 70 Good
13UM016 Upstream of Dean Brook July 29, 2013 19 67 Good
07010104-656
13UM015 Between Mission Creek and Ironton (Blackhoof) Creek
August 7, 2013 17 62 Good
13UM014 West of Brainerd Lakes Regional Airport
August 1, 2013 14 56 Good
13UM033 Near Washington Street in Brainerd, MN
August 1, 2013 24 59 Good
13UM013 Upstream of Crow Wing River July 29, 2013 21 75 Good
August 13, 2013 13 83 Good
Good = above upper confidence interval (Source: MPCA Surface Water Environmental Data Access website)

Upper Mississippi River TSS TMDL Report Minnesota Pollution Control Agency
27
Figure 12. TMDL Study Area 2013 biological monitoring sites.
Upper Mississippi River TSS TMDL Report Minnesota Pollution Control Agency
28
3.5 Pollutant source summary
3.5.1 Permitted source types
Regulated National Pollutant Discharge Elimination System (NPDES)/State Disposal System (SDS)
permitted sources of pollutants include wastewater treatment plant (WWTP) effluent, permitted
feedlots, municipal separate storm sewer systems (MS4s), construction stormwater, and industrial
stormwater. TSS loads from NPDES/SDS permitted wastewater and stormwater sources were accounted
for using the methods described in subsequent Section 4.2.3. There are no permitted feedlots within the
TMDL Study Area.
3.5.1.1 Regulated stormwater
Regulated stormwater delivers and transports pollutants to surface waters and is generated in the
watershed during precipitation events. The sources of pollutants in stormwater are many, including
decaying vegetation (leaves, grass clippings, etc.), domestic and wild animal waste, soil, deposited
particulates from air, road salt, and oil and grease from vehicles. There are three types of regulated
stormwater in the watershed:
Regulated MS4 Stormwater
The MPCA defines an MS4 on the Municipal Stormwater (MS4) webpage as a conveyance or system of
conveyances (roads with drainage systems, municipal streets, catch basins, curbs, gutters, ditches, man-
made channels, storm drains, etc.) that is also:
Owned or operated by a public entity (which can include cities, townships, counties, military
bases, hospitals, prison complexes, highway departments, universities, sewer districts, etc.),
Designed or used for collecting or conveying stormwater,
Not a combined sewer, and;
Not part of a publicly owned treatment works.
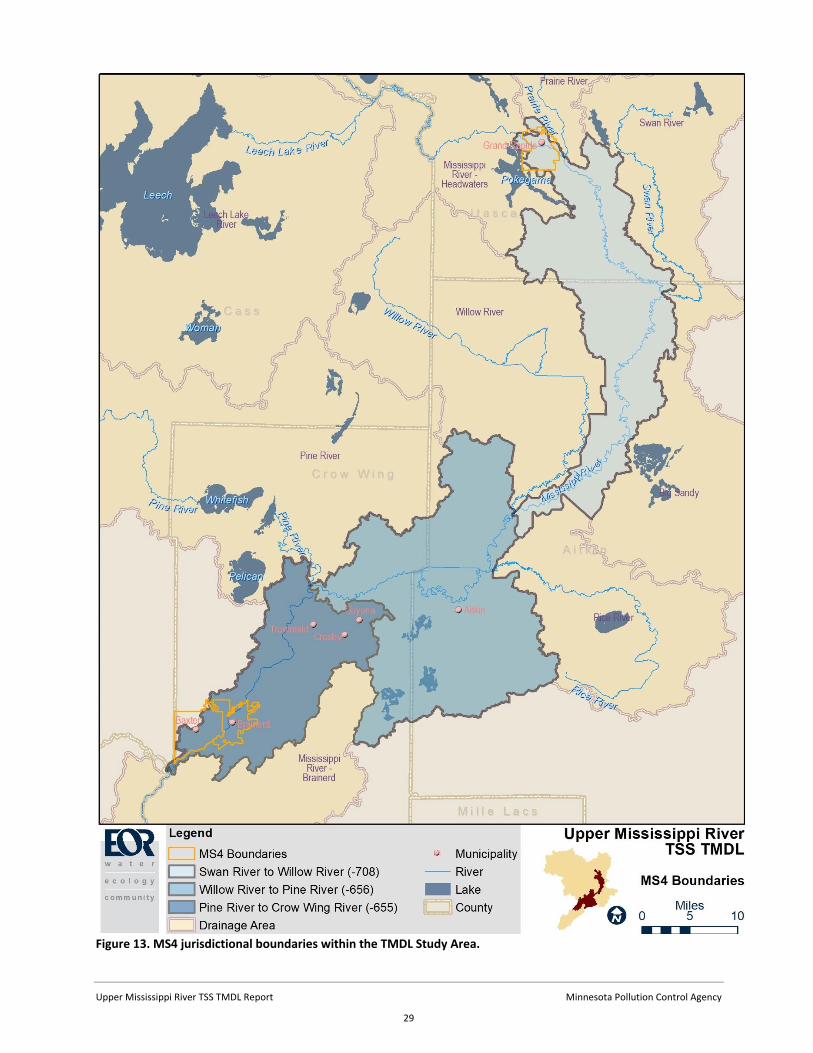
NPDES/SDS Permits administered by the MPCA regulate certain MS4 discharges. The cities of Grand
Rapids (MS400269) and Brainerd (MS400266) are regulated MS4 communities because they have a
population of at least 10,000 people and discharge to an ORVW. The City of Baxter (MS400231) is a
regulated MS4 community because they have a population of at least 5,000 people and discharge, or
have the potential to discharge, to an impaired or ORVW. The jurisdictional MS4 boundary for these
three communities are shown in Figure 13. Jurisdictional boundaries account for future growth of the
stormwater infrastructure to expand to the entire municipal boundary. The TMDL MS4 regulated area
only applies to the existing stormwater infrastructure, as described in Section 4.2.1. There are no
regulated county or Minnesota Department of Transportation roadways in the TMDL Study Area. For
more information on the MPCA MS4 program see: The Municipal Stormwater page.
Upper Mississippi River TSS TMDL Report Minnesota Pollution Control Agency
29
Figure 13. MS4 jurisdictional boundaries within the TMDL Study Area.

Upper Mississippi River TSS TMDL Report Minnesota Pollution Control Agency
30
Regulated Construction Stormwater
Construction stormwater is regulated by NPDES/SDS permits (MNR100001) for any construction activity
disturbing: (a) one acre or more of soil, (b) less than one acre of soil if that activity is part of a "larger
common plan of development or sale" that is greater than one acre, or (c) less than one acre of soil, but
the MPCA determines that the activity poses a risk to water resources. The WLA for stormwater
discharges, from sites where there are construction activities, reflects the number of construction sites
greater than one acre in size that are expected to be active in the impaired lake or stream subwatershed
at any one time. Less than one percent of the TMDL Study Area discharges regulated construction
stormwater.
Regulated Industrial Stormwater
Industrial stormwater is regulated by NPDES/SDS Industrial Stormwater Multi- Sector General Permit
(MNR050000) or NPDES/SDS Nonmetallic Mining/Associated Activities General Permit (MNG490000), if
the industrial activity has the potential for significant materials and activities to be exposed to
stormwater discharges. The WLA for stormwater discharges from sites where there is industrial activity
reflects the number of sites in an impaired lake or stream subwatershed for which NPDES/SDS industrial
stormwater permit coverage is required. Less than one percent of the TMDL Study Area discharges
regulated industrial stormwater.
3.5.1.2 Municipal wastewater
Municipal wastewater is the domestic sewage and wastewater collected and treated by municipalities
before being discharged to waterbodies as treated effluent. Seven WWTPs discharge to the impaired
reaches of the TMDL Study Area.
Table 8. Permitted Municipal Wastewater sources within TMDL Study Area.
Impaired Reach
AUID
Facility Name
Permit ID
Mississippi River, Swan River to Willow River
07010103-708
Grand Rapids WWTP
MN0022080
Palisade WWTP
MN0050997
Minnesota Power - Rapids Energy Center
MN0066559
Mississippi River, Willow River to Pine River
07010104-655
Aitkin WWTP
MN0020095
American Peat Technology LLC
MN0057533
Mississippi River, Pine River to Crow Wing River
07010104-656
Brainerd WWTP
MN0049328
Serpent Lake WWTP
MNG585215

Upper Mississippi River TSS TMDL Report Minnesota Pollution Control Agency
31
The discharge for Minnesota Power consists of once-through, noncontact cooling water sourced from
the Mississippi River, and therefore the TSS concentration of the discharge reflects the TSS water quality
of the Mississippi River at the location of the intake structure.
Minnesota’s TSS water quality standard is intended to protect aquatic life from the damaging effects of
inorganic nonvolatile suspended solids (NVSS) to the gills and filter feeding organs of fish and aquatic
invertebrates. TSS associated with municipal wastewater discharges are predominantly organic volatile
suspended solids (VSS) which do not tend to persist in the environment. As such, municipal wastewater
is not a significant source of TSS to the impaired reaches.
3.5.2 Nonpermitted sources
Nonpermitted sources of pollutants may include in-stream erosion, near stream disturbance,
unregulated watershed runoff, unpermitted feedlots, and unpermitted urban stormwater. Contributions
of sediment from in-stream erosion, near stream disturbance, and unregulated watershed runoff are
described in detail below. Contributions of sediment from unpermitted feedlots and unpermitted urban
stormwater are insignificant in this TMDL Study Area and therefore are not described below.
3.5.2.1 In-stream erosion
Glacial Lake Aitkin is a dominant surficial geological feature in the area. It is the remnants of a large
proglacial lake that was formed by ice and meltwater from the St. Louis Sublobe, the most recent glacial
advance in the area. Proglacial lakes form at the top of a retreating glacier and accumulate sediment
carried by meltwater running into the lake.
The soils associated with Glacial Lake Aitkin (and other proglacial lakes) are fine, interbedded layers of
sand, silt, and clay with very little coarse sand and gravel. Laminated beds of silt and clay are found in
areas where the lake was deepest. Sand and gravel can be found in areas where the lake was shallow
and along beach ridges (MGS 2004). As Glacial Lake Aitkin began to drain, peat deposits developed in
the bog areas that remained.
The flat topography associated with Glacial Lake Aitkin soils generally prevents erosion. However, these
fine-grained soils are highly susceptible to erosion when disturbed, particularly along stream banks
where the soil is on a slope or incline. Rotational and planar failures are frequently found along the
banks in areas where the channel cuts through glacial lake clays. A rotational failure occurs when a large
chunk of the stream bank soil slips into the stream along a curved surface, as if the soil was scooped out
of the stream bank. A planar failure occurs when a large chunk of the stream bank soil slips into the
stream along a flat surface, as if the soil was pushed down an incline.
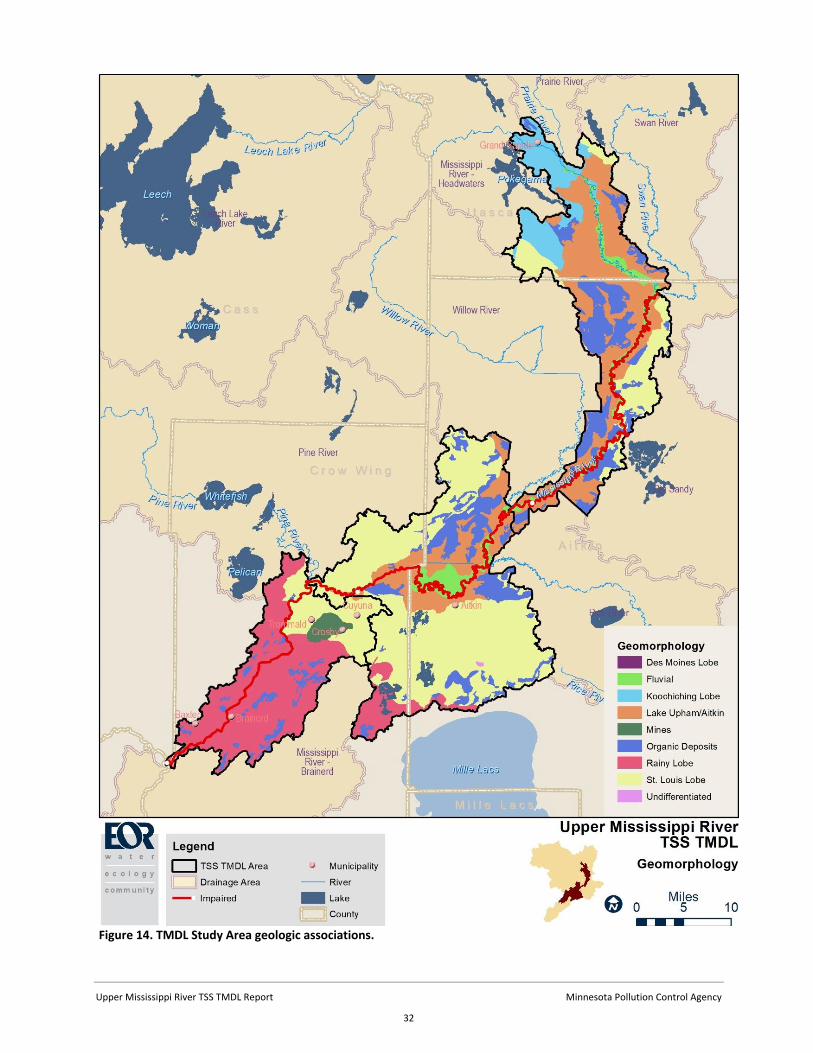
The location of Glacial Lake Aitkin with respect to the impaired reaches is shown in the TMDL Study Area
geomorphology (denoted by Lake Upham/Aitkin in Figure 14). The portion of the Upper Mississippi
River that flows through Glacial Lake Aitkin soils is the only portion of the Upper Mississippi River that
has high levels of TSS; TSS levels in the Mississippi River upstream of Grand Rapids and downstream of
Brainerd are below the TSS standard. This suggests that the high erodibility of Glacial Lake Aitkin soils
contributes TSS to the Mississippi River between Grand Rapids and Brainerd, Minnesota. In addition, the
F-IBI scores are good in this portion of the Mississippi River (see Table 7 in Section 3.4.2) suggesting that
high TSS levels are not a recent change and causing stress to the fish community.
Upper Mississippi River TSS TMDL Report Minnesota Pollution Control Agency
32
Figure 14. TMDL Study Area geologic associations.

Upper Mississippi River TSS TMDL Report Minnesota Pollution Control Agency
33
Flow alteration - Mississippi Headwaters Reservoirs
Within the TMDL Study Area, the U.S. Army Corps of Engineers operates six large dams (Winnibigoshish,
Leech, Pokegama, Sandy, Cross Lake, and Gull dams) to prevent flooding downstream. These dams alter
the flow in the TMDL Study Area throughout the year. Starting in October, all of the dams begin to
drawdown the lake levels to prepare for the large flows associated with spring snowmelt. Normal
drawdown elevations range between 0.9 ft and 3.0 ft below the summer level with the actual drawdown
being dictated by snow surveys in March. Lake level drawdowns are very gradual. For instance, Big
Sandy Lake aims for a drawdown rate of five inches per month with a goal of reaching the final
drawdown elevation by March 1. Because of the gradualness of the drawdown, winter flows are fairly
stable. The signature of the drawdowns are shown in the annual duration hydrograph for the USGS
station at Aitkin where median daily average discharge increases starting in September through early
November (Figure 15). This trend contradicts the natural flow expected from the monthly precipitation.
The normal monthly precipitation is highest during the summer and decreases throughout the fall and
winter (Figure 16).
Figure 15. USGS streamflow annual duration hydrograph for the Mississippi River at Aitkin, MN (USGS 05227500).
*Dotted line is the estimated bankfull discharge from the USGS rating curve.

Upper Mississippi River TSS TMDL Report Minnesota Pollution Control Agency
34
Figure 16. PRISM 1981-2010 normal monthly precipitation for the Upper Mississippi River Watershed (PRISM Climate Group).
During the spring, snowmelt and precipitation increase the lake levels as the lakes are used to prevent
high flows downstream. Typically, the high lake levels are discharged by the end of May. Then during the
summer months, the lakes are managed for flood control and for recreational purposes. Therefore, the
normal summer lake level band has a range of six inches for most of the dams. More significant rainfall
events in the summer result in more releases. These releases have lower peak flow, but are longer in
duration. Therefore, flows may stay at or close to bankfull conditions more frequently and for longer
time periods. Bankfull flow is generally considered to be the channel forming discharge because in a
stable alluvial channel it represents the breakpoint between the process of channel formation and the
process of floodplain formation. The historic stream development in the TMDL Study Area is depicted by
Light Detection and Ranging (LiDAR) imagery in Figure 17. The current channel is the darkest red band
and the old channels get lighter with age as the valley has developed over 10,000 years.
In addition to the altered streamflow downstream of the reservoirs, the lakes themselves alter the
sedimentation processes in the watershed. The slower flows associated with the ponding water allows
greater deposition to occur within the reservoirs. This has the potential to alter the natural sediment
transport in the Mississippi River. However, the lakes also can contribute to an increase in erosion with
wind created wave action and ice heaving eroding reservoir banks.

Upper Mississippi River TSS TMDL Report Minnesota Pollution Control Agency
35
Figure 17. Historic stream development of the Upper Mississippi River south of Warba, MN shown in LiDAR.
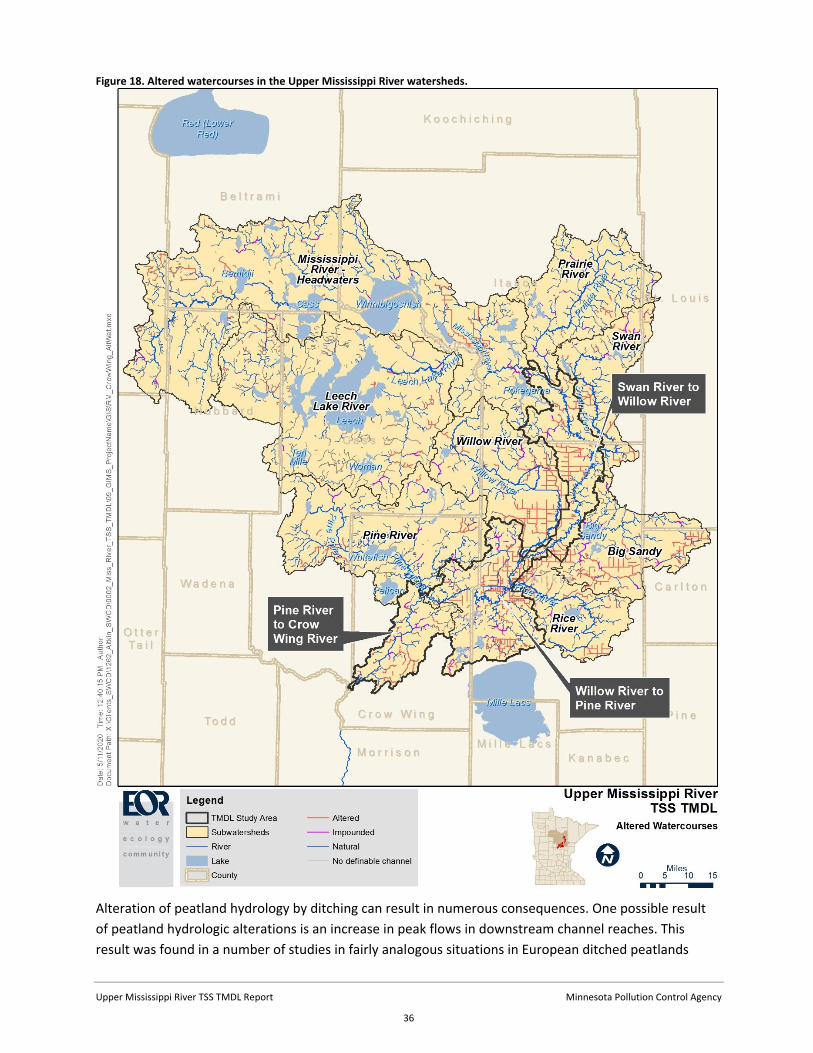
Flow alteration- altered watercourses
As part of the MR-GR WRAPS effort, the stressor identification process called out legacy ditching in
peatlands as impacting hydrology and water quality. In both the MR-GR and MR-B watersheds, a
significant amount of altered watercourses exist in the affected subwatersheds, as shown in Figure 18
and Table 9.
Table 9. Summary of types of watercourses in each subwatershed in the TMDL Study Area Altered Impounded Natural No definable
Channel
Subwatershed feet % total
feet % total
feet % total
feet % total
Big Sandy 707,209 34% 794,648 38% 241,334 12% 345,941 17%
Leech Lake River 541,607 11% 1,458,698 28% 90,014 2% 3,042,023 59%
Mississippi River - Headwaters
855,696 10% 3,992,855 47% 745,758 9% 2,852,840 34%
Pine River 301,788 10% 1,778,053 57% 153,230 5% 912,724 29%
Pine River to Crow Wing River
216,060 23% 386,672 42% 126,413 14% 199,158 21%
Prairie River 93,224 4% 1,417,453 60% 124,725 5% 708,604 30%
Rice River 545,046 35% 720,351 47% 28,254 2% 253,598 16%
Swan River 290,237 18% 826,127 52% 149,428 9% 330,173 21%
Swan River to Willow River
592,558 31% 950,464 50% 64,902 3% 307,836 16%
Willow River 923,007 38% 1,102,549 45% 106,099 4% 315,190 13%
Willow River to Crow Wing River
1,040,211 35% 1,290,220 43% 281,591 9% 393,474 13%
Upper Mississippi River TSS TMDL Report Minnesota Pollution Control Agency
36
Figure 18. Altered watercourses in the Upper Mississippi River watersheds.
Alteration of peatland hydrology by ditching can result in numerous consequences. One possible result
of peatland hydrologic alterations is an increase in peak flows in downstream channel reaches. This
result was found in a number of studies in fairly analogous situations in European ditched peatlands
Upper Mississippi River TSS TMDL Report Minnesota Pollution Control Agency
37
(Holden et al. 2004). In some cases, ditched peatlands seemed to reduce the peak flows due to a
lowered water table allowing for greater storage of rainwater. There are numerous variables that can
influence how downstream hydrology is affected by ditching, and these factors are still being studied
(Holden et al. 2004). Consequences of altered hydrology include channel instability characterized by
bank erosion and streambed material alteration, leading to poor biological habitat. Channel instability
was found at several streams with upstream peatland ditches in the MR-GR Watershed, and also in
WRAPS projects in several other north central Minnesota watersheds. Increasing the flow from
peatlands can also exacerbate flooding downstream. The ditched peatlands in the MR-GR Watershed
add flow to the Mississippi River, which increases flooding to downstream areas such as the city of Aitkin
(MPCA 2019a).
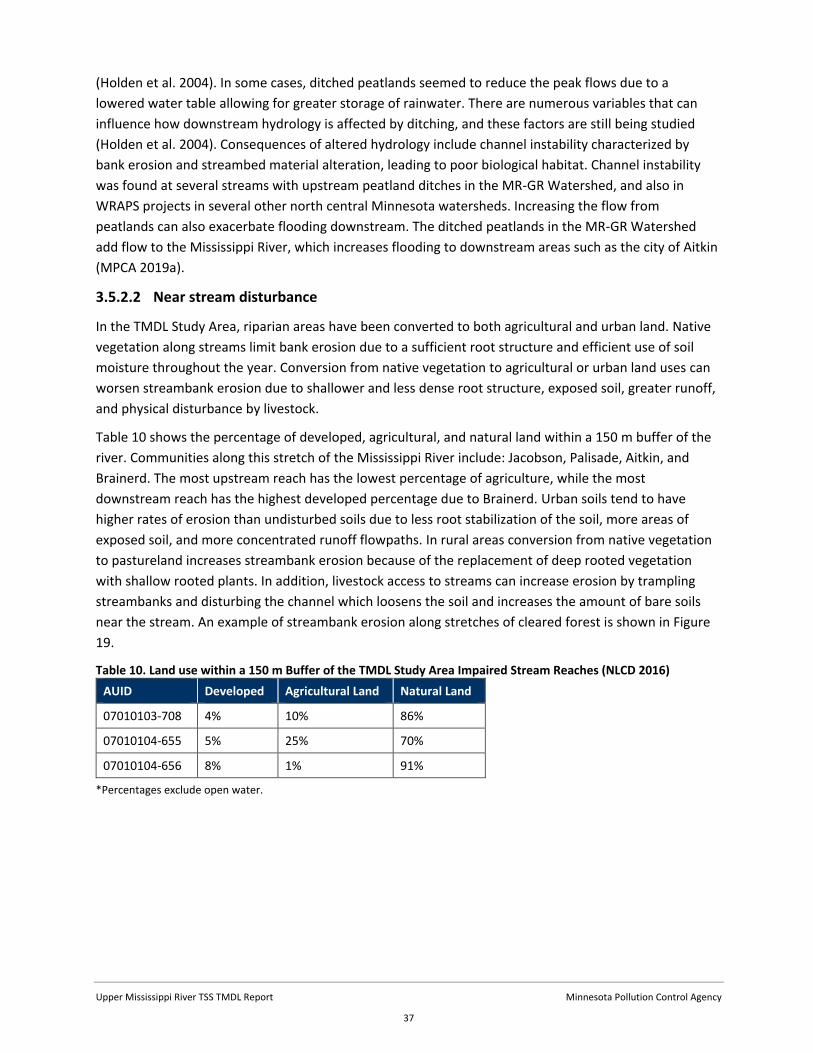
3.5.2.2 Near stream disturbance
In the TMDL Study Area, riparian areas have been converted to both agricultural and urban land. Native
vegetation along streams limit bank erosion due to a sufficient root structure and efficient use of soil
moisture throughout the year. Conversion from native vegetation to agricultural or urban land uses can
worsen streambank erosion due to shallower and less dense root structure, exposed soil, greater runoff,
and physical disturbance by livestock.
Table 10 shows the percentage of developed, agricultural, and natural land within a 150 m buffer of the
river. Communities along this stretch of the Mississippi River include: Jacobson, Palisade, Aitkin, and
Brainerd. The most upstream reach has the lowest percentage of agriculture, while the most
downstream reach has the highest developed percentage due to Brainerd. Urban soils tend to have
higher rates of erosion than undisturbed soils due to less root stabilization of the soil, more areas of
exposed soil, and more concentrated runoff flowpaths. In rural areas conversion from native vegetation
to pastureland increases streambank erosion because of the replacement of deep rooted vegetation
with shallow rooted plants. In addition, livestock access to streams can increase erosion by trampling
streambanks and disturbing the channel which loosens the soil and increases the amount of bare soils
near the stream. An example of streambank erosion along stretches of cleared forest is shown in Figure
19.
Table 10. Land use within a 150 m Buffer of the TMDL Study Area Impaired Stream Reaches (NLCD 2016)
AUID Developed Agricultural Land Natural Land
07010103-708 4% 10% 86%
07010104-655 5% 25% 70%
07010104-656 8% 1% 91%
*Percentages exclude open water.

Upper Mississippi River TSS TMDL Report Minnesota Pollution Control Agency
38
Figure 19. Example of streambank erosion in rural areas at biological monitoring station 13UM017. Photo taken by MPCA Staff August 8, 2013.
3.5.2.3 Watershed runoff
To assist the development of TMDLs and WRAPS in the TMDL Study Area, the MPCA facilitated the
development of a linked HSPF model for the eight HUC-8 watersheds of the Upper Mississippi River. The
original model was constructed in 2011-2012 to model flow, sediment, temperature, dissolved oxygen,
and nutrients, and was calibrated using data from 1996 through 2009 (RESPEC 2015). In 2018, the MR-
GR and MR-B models were recalibrated to incorporate new measurements through 2015 and improved
evapotranspiration, snow melt, and land use data (Tetra Tech 2018). HSPF is capable of identifying
sources of sediment (TSS) and the processes that drive sediment erosion, delivery, and transport in the
watershed as well as point sources.
An important component of modeling the flow and TSS in HSPF is the land use. The Upper Mississippi
River model depicts the change in land use from the Northern Lakes and Forest Ecoregion, dominated by
coniferous forests, to the North Central Hardwood Forest Ecoregion, dominated by crops and pasture.
The original models used land use from the 2006 NLCD, while the updated models use the University of
Minnesota’s Remote Sensing and Geospatial Analysis group’s 2013 Minnesota Land Cover Classification
and Impervious Surface Area by Landsat and LiDAR 2013 Update -Version 2 dataset. In addition, soils
information from the Gridded Soil Survey Geographic Database (gSSURGO) and Universal Soil Loss
Equations (USLE) were used to parameterize and calibrate the TSS concentrations in the model.
Agricultural practices affect the amount of sediment transported by overland flow. The RESPEC
calibration adjusted sediment erosion rates to account for this.
Other updates were made to the sediment simulation, including establishment of critical shear stress
parameters for in-stream deposition and scour, incorporation of clay load with active groundwater flow,

Upper Mississippi River TSS TMDL Report Minnesota Pollution Control Agency
39
and recalibration of instream sediment parameterization based on long-term net sediment bed balance
and instream suspended sediment data.
The results of recalibration predicted watershed-wide sediment loading rates of 31.5 lb/ac/yr in the MR-
GR Watershed, and 24 lb/ac/yr in the MR-B Watershed (Tetra Tech 2018). The modeled subwatershed
sediment yield for the study area is shown in Figure 20. Generally, subwatershed sediment yields
increase from upstream to downstream with the lowest yields in the upstream portion of the TMDL
Study Area and the highest sediment yields near Brainerd in the downstream portion of the TMDL Study
Area. The seeming inconsistency between the watershed-wide average loading rates and the
subwatershed rates can be attributed to geology, land use and other local factors.
Figure 20. HSPF Predicted subbasin TSS yield (lb/acre/year) for the TMDL Study Area (1996-2015).

Upper Mississippi River TSS TMDL Report Minnesota Pollution Control Agency
40
Figure 21 shows the sediment load contribution of each source in the MR-GR and MR-B watersheds. The
model predicts that the majority of the sediment load comes from in-stream processes (Bed/Bank), with
greater per acre yields of sediment derived from developed, cropland1 and pastureland, compared to
forests and wetlands. More information on the HSPF models are in the Hydrologic and Water Quality
Calibration for the Upper Mississippi River (RESPEC 2015) and the Mississippi River – Grand Rapids HSPF
Model Recalibration (Tetra Tech 2018).
Figure 21. HSPF modeled TSS loads by source and impaired reach.
AB and CD refer to USDA-NRCS Soil Survey Geographic Database Hydrologic Soil Groups.
A = high infiltration rates (sandy), B = moderate infiltration rates (silt loam or loam), C = low infiltration rates (sandy clay loam), D = clay (lowest infiltration rates) and or denotes an A,B,C soils with a permanent high water table (wetted).
1The extent of CAFOs and permitted AFOs in a watershed can provide information on the potential effects that feedlots have on water quality through application of manure to nearby agricultural fields. There are no CAFOs or NPDES/SDS permitted AFOs within the TMDL Study Area.

Upper Mississippi River TSS TMDL Report Minnesota Pollution Control Agency
41
3.5.3 Sediment Source Summary
The dominant source of sediment to the Upper Mississippi River within the TMDL Study Area is nonpoint
sources (Table 11). Key nonpoint sources include:
bed and bank (in-stream) erosion of the finely grained, easily erodible Glacial Lake Aitkin/Upham
clay deposits (see Section 3.5.2.1), and
near stream disturbance from land use conversions near the river channel that contribute
sediment through greater soil erosion from physical trampling of the banks from livestock, less
stabilization of the soil from shallow rooted plants, more areas of exposed soil, and more
concentrated runoff flowpaths.
Due to the geologic setting of the Upper Mississippi River between Swan River and Crow Wing River (see
Section 3.5.2.1), there are natural background sources of sediment to the impaired reaches. However,
there is not enough available data to determine the relative contribution of natural background sources
compared to other human influenced sources. There is no evidence at this time to suggest that the
impairments are solely due to natural background sources.
Table 11. HSPF modeled TSS loads by source and impaired reach.
Source
TSS loads to Upper Mississippi River impaired reaches:
Pine R. to Crow Wing R. Swan R. to Willow R. Willow R. to Pine R.
(ton/yr) (% total load) (ton/yr) (% total load) (ton/yr) (% total load)
Bed/Bank 6,840 56% 8,456 61% 4,295 51%
Cropland 689 6% 254 2% 420 5%
Developed 1,094 9% 678 5% 302 4%
Feedlot 5 0% 1 0% 5 0%
Forest 1,308 11% 2,232 16% 1,264 15%
Grassland 327 3% 538 4% 264 3%
Pasture 899 7% 422 3% 996 12%
Point Sources 250 2% 201 1% 111 1%
Wetland 814 7% 991 7% 768 9%
Grand Total 12,225 13,772 8,425
4. TMDL development This section presents the overall approach to estimating the components of the TMDL. The TSS sources
were first identified and estimated in the TSS source assessment. The loading capacity (TMDL) of each
impaired stream reach was then estimated using a load duration curve and divided among WLAs and
LAs. The TMDLs for the impaired streams can be described by the following equation:
TMDL = LC = ∑WLA + ∑LA + ∑BC + MOS

Upper Mississippi River TSS TMDL Report Minnesota Pollution Control Agency
42
Where:
Loading capacity (LC): the greatest TSS load the impaired stream reaches can receive without violating
water quality standards;
Wasteload allocation (WLA): the TSS load that is allocated to point sources, including wastewater
treatment facilities (WWTFs), regulated MS4 stormwater, regulated construction stormwater, and
regulated industrial stormwater, all covered under NPDES permits for a current or future permitted
pollutant source;
Load allocation (LA): the TSS load that is allocated to sources not requiring NPDES permit coverage,
including nonregulated stormwater runoff, and bed/bank erosion;
Boundary condition (BC): the TSS load that is allocated to sources located within upstream
subwatersheds;
Margin of Safety (MOS): an accounting of uncertainty about the relationship between TSS loads and
receiving water quality.
4.1 Loading capacity methodology
The loading capacities for impaired stream reaches receiving a TMDL, as a part of this study, were
determined using load duration curves. Flow and load duration curves are used to determine the flow
conditions (flow regimes) under which exceedances occur. Flow duration curves provide a visual display
of the variation in flow rate for the stream. The x-axis of the plot indicates the percentage of time that a
flow exceeds the corresponding flow rate as expressed by the y-axis. Load duration curves take the flow
distribution information, constructed for the stream, and factor in pollutant loading to the analysis. A
standard curve is developed by applying a particular pollutant standard or criteria to the stream flow
duration curve and is expressed as a load of pollutant per day. The standard curve represents the upper
limit of the allowable in-stream pollutant load (loading capacity) at a particular flow. Monitored loads of
a pollutant are plotted against this curve to display how they compare to the standard. Monitored
values that fall above the curve represent an exceedance of the standard.
For each load duration curve, continuous flow data was based on HSPF model simulations for 1996
through 2015. The existing TSS loads were based on TSS concentration data from April through
September during the TMDL 10-year time period of 2009 through 2018, paired with HSPF simulated
flows by date (Table 12). The TSS loading capacities presented in the allocation tables represent the
median TSS load (in kg/day) along the TSS standard curve within each flow regime. A TSS load duration
curve and a TMDL allocation table are provided for each stream segment in Section 4.2.5.
The load duration curve method is based on an analysis that encompasses the cumulative frequency of
historical flow data over a specified period. Because this method uses a long-term record of daily flow,
virtually the full spectrum of allowable loading capacities is represented by the resulting curve. In the
TMDL tables of this report, only five points on the entire loading capacity curve are depicted (the
midpoints of the designated flow zones). However, the entire curve represents the TMDL and is what is
ultimately approved by the EPA.
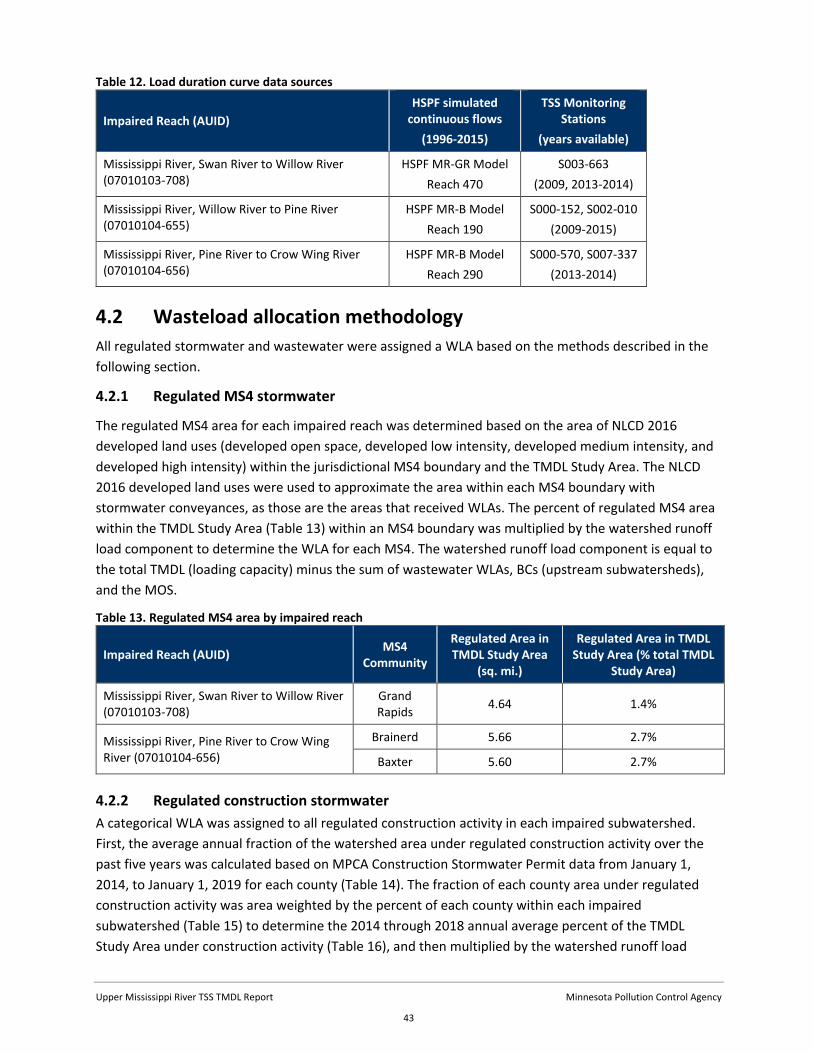
Upper Mississippi River TSS TMDL Report Minnesota Pollution Control Agency
43
Table 12. Load duration curve data sources
Impaired Reach (AUID)
HSPF simulated continuous flows
(1996-2015)
TSS Monitoring Stations
(years available)
Mississippi River, Swan River to Willow River (07010103-708)
HSPF MR-GR Model
Reach 470
S003-663
(2009, 2013-2014)
Mississippi River, Willow River to Pine River (07010104-655)
HSPF MR-B Model
Reach 190
S000-152, S002-010
(2009-2015)
Mississippi River, Pine River to Crow Wing River (07010104-656)
HSPF MR-B Model
Reach 290
S000-570, S007-337
(2013-2014)
4.2 Wasteload allocation methodology
All regulated stormwater and wastewater were assigned a WLA based on the methods described in the
following section.
4.2.1 Regulated MS4 stormwater
The regulated MS4 area for each impaired reach was determined based on the area of NLCD 2016
developed land uses (developed open space, developed low intensity, developed medium intensity, and
developed high intensity) within the jurisdictional MS4 boundary and the TMDL Study Area. The NLCD
2016 developed land uses were used to approximate the area within each MS4 boundary with
stormwater conveyances, as those are the areas that received WLAs. The percent of regulated MS4 area
within the TMDL Study Area (Table 13) within an MS4 boundary was multiplied by the watershed runoff
load component to determine the WLA for each MS4. The watershed runoff load component is equal to
the total TMDL (loading capacity) minus the sum of wastewater WLAs, BCs (upstream subwatersheds),
and the MOS.
Table 13. Regulated MS4 area by impaired reach
Impaired Reach (AUID) MS4
Community
Regulated Area in TMDL Study Area
(sq. mi.)
Regulated Area in TMDL Study Area (% total TMDL
Study Area)
Mississippi River, Swan River to Willow River (07010103-708)
Grand Rapids
4.64 1.4%
Mississippi River, Pine River to Crow Wing River (07010104-656)
Brainerd 5.66 2.7%
Baxter 5.60 2.7%
4.2.2 Regulated construction stormwater
A categorical WLA was assigned to all regulated construction activity in each impaired subwatershed.
First, the average annual fraction of the watershed area under regulated construction activity over the
past five years was calculated based on MPCA Construction Stormwater Permit data from January 1,
2014, to January 1, 2019 for each county (Table 14). The fraction of each county area under regulated
construction activity was area weighted by the percent of each county within each impaired
subwatershed (Table 15) to determine the 2014 through 2018 annual average percent of the TMDL
Study Area under construction activity (Table 16), and then multiplied by the watershed runoff load
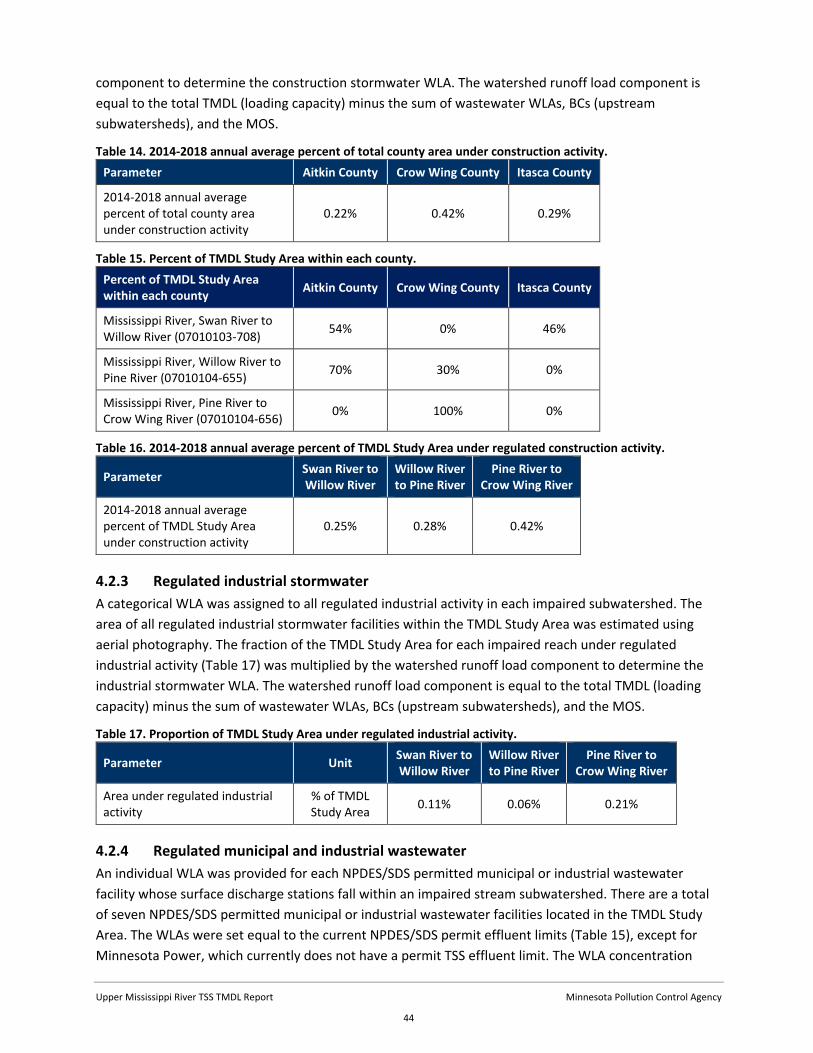
Upper Mississippi River TSS TMDL Report Minnesota Pollution Control Agency
44
component to determine the construction stormwater WLA. The watershed runoff load component is
equal to the total TMDL (loading capacity) minus the sum of wastewater WLAs, BCs (upstream
subwatersheds), and the MOS.
Table 14. 2014-2018 annual average percent of total county area under construction activity.
Parameter Aitkin County Crow Wing County Itasca County
2014-2018 annual average percent of total county area under construction activity
0.22% 0.42% 0.29%
Table 15. Percent of TMDL Study Area within each county.
Percent of TMDL Study Area within each county
Aitkin County Crow Wing County Itasca County
Mississippi River, Swan River to Willow River (07010103-708)
54% 0% 46%
Mississippi River, Willow River to Pine River (07010104-655)
70% 30% 0%
Mississippi River, Pine River to Crow Wing River (07010104-656)
0% 100% 0%
Table 16. 2014-2018 annual average percent of TMDL Study Area under regulated construction activity.
Parameter Swan River to Willow River
Willow River to Pine River
Pine River to Crow Wing River
2014-2018 annual average percent of TMDL Study Area under construction activity
0.25% 0.28% 0.42%
4.2.3 Regulated industrial stormwater
A categorical WLA was assigned to all regulated industrial activity in each impaired subwatershed. The
area of all regulated industrial stormwater facilities within the TMDL Study Area was estimated using
aerial photography. The fraction of the TMDL Study Area for each impaired reach under regulated
industrial activity (Table 17) was multiplied by the watershed runoff load component to determine the
industrial stormwater WLA. The watershed runoff load component is equal to the total TMDL (loading
capacity) minus the sum of wastewater WLAs, BCs (upstream subwatersheds), and the MOS.
Table 17. Proportion of TMDL Study Area under regulated industrial activity.
Parameter Unit Swan River to Willow River
Willow River to Pine River
Pine River to Crow Wing River
Area under regulated industrial activity
% of TMDL Study Area
0.11% 0.06% 0.21%
4.2.4 Regulated municipal and industrial wastewater
An individual WLA was provided for each NPDES/SDS permitted municipal or industrial wastewater
facility whose surface discharge stations fall within an impaired stream subwatershed. There are a total
of seven NPDES/SDS permitted municipal or industrial wastewater facilities located in the TMDL Study
Area. The WLAs were set equal to the current NPDES/SDS permit effluent limits (Table 15), except for
Minnesota Power, which currently does not have a permit TSS effluent limit. The WLA concentration
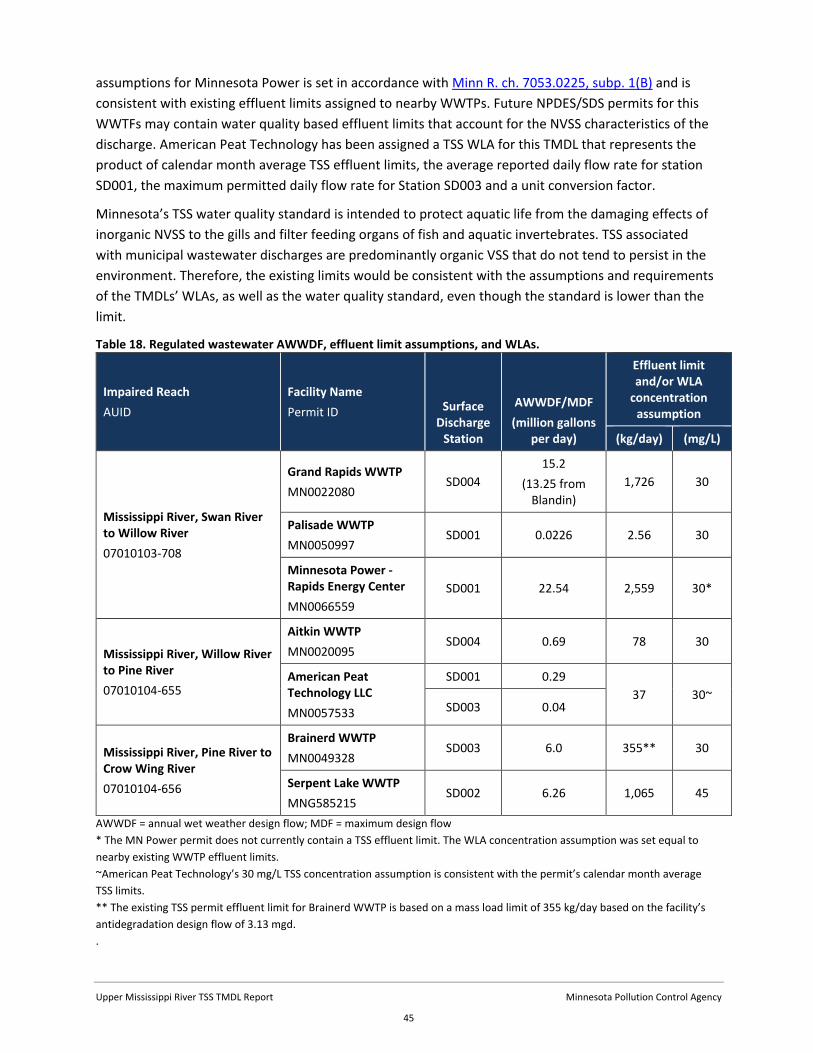
Upper Mississippi River TSS TMDL Report Minnesota Pollution Control Agency
45
assumptions for Minnesota Power is set in accordance with Minn R. ch. 7053.0225, subp. 1(B) and is
consistent with existing effluent limits assigned to nearby WWTPs. Future NPDES/SDS permits for this
WWTFs may contain water quality based effluent limits that account for the NVSS characteristics of the
discharge. American Peat Technology has been assigned a TSS WLA for this TMDL that represents the
product of calendar month average TSS effluent limits, the average reported daily flow rate for station
SD001, the maximum permitted daily flow rate for Station SD003 and a unit conversion factor.
Minnesota’s TSS water quality standard is intended to protect aquatic life from the damaging effects of
inorganic NVSS to the gills and filter feeding organs of fish and aquatic invertebrates. TSS associated
with municipal wastewater discharges are predominantly organic VSS that do not tend to persist in the
environment. Therefore, the existing limits would be consistent with the assumptions and requirements
of the TMDLs’ WLAs, as well as the water quality standard, even though the standard is lower than the
limit.
Table 18. Regulated wastewater AWWDF, effluent limit assumptions, and WLAs.
Impaired Reach
AUID
Facility Name
Permit ID Surface Discharge
Station
AWWDF/MDF
(million gallons per day)
Effluent limit and/or WLA
concentration assumption
(kg/day) (mg/L)
Mississippi River, Swan River to Willow River
07010103-708
Grand Rapids WWTP
MN0022080 SD004
15.2
(13.25 from Blandin)
1,726 30
Palisade WWTP
MN0050997 SD001 0.0226 2.56 30
Minnesota Power - Rapids Energy Center
MN0066559
SD001 22.54 2,559 30*
Mississippi River, Willow River to Pine River
07010104-655
Aitkin WWTP
MN0020095 SD004 0.69 78 30
American Peat Technology LLC
MN0057533
SD001 0.29
37 30~ SD003 0.04
Mississippi River, Pine River to Crow Wing River
07010104-656
Brainerd WWTP
MN0049328 SD003 6.0 355** 30
Serpent Lake WWTP
MNG585215 SD002 6.26 1,065 45
AWWDF = annual wet weather design flow; MDF = maximum design flow
* The MN Power permit does not currently contain a TSS effluent limit. The WLA concentration assumption was set equal to
nearby existing WWTP effluent limits.
~American Peat Technology’s 30 mg/L TSS concentration assumption is consistent with the permit’s calendar month average
TSS limits.
** The existing TSS permit effluent limit for Brainerd WWTP is based on a mass load limit of 355 kg/day based on the facility’s
antidegradation design flow of 3.13 mgd.
.
Upper Mississippi River TSS TMDL Report Minnesota Pollution Control Agency
46
4.3 Load allocation methodology
The remainder of the loading capacity (TMDL) after subtraction of the MOS, BCs (upstream
subwatersheds), and WLAs was allocated to the LA for each impaired stream. The LA includes nonpoint
pollution sources that are not subject to permit requirements, including near-channel sources and
watershed runoff (as described in Section 3.5.2). The LA also includes natural background sources of
sediment.
Natural background is defined in both Minnesota rule and statute:
Minn. R. 7050.0150, subp. 4:
“Natural causes” means the multiplicity of factors that determine the physical, chemical or
biological conditions that would exist in the absence of measurable impacts from human activity
or influence.
The Clean Water Legacy Act (Minn. Stat. § 114D.10, subd. 10) defines natural background as:
… characteristics of the water body resulting from the multiplicity of factors in nature, including
climate and ecosystem dynamics that affect the physical, chemical or biological conditions in a
water body, but does not include measurable and distinguishable pollution that is attributable
to human activity or influence.
Natural background sources are inputs that would be expected under natural, undisturbed conditions.
Natural background sources can include inputs from natural geologic processes such as: soil loss from
stream development and upland erosion of areas not disturbed by human activity; wildlife; and loading
from grassland, forests, and other natural land covers.
Minnesota TSS standards inherently address some amount of natural background TSS loading.
Minnesota’s regional TSS standards are based on reference or least-impacted streams and take into
account differing levels of sediment present in streams and rivers in the many ecoregions across the
state, depending on factors such as topography, soils, and climate (MPCA 2011). Natural background
conditions were evaluated, where possible, within the modeling and source assessment portion of this
study (see Section 3.5.2). Natural background sources are implicitly included in the LA portion of the
TMDL allocation tables, and TMDL reductions should focus on the major anthropogenic sources
identified in the source assessment.
4.4 Boundary condition (upstream subwatershed) allocation
methodology
TSS delivery along the Mississippi River mainstem is not conservative due to sedimentation and
resuspension processes within the river channel. Over timescales of decades to hundreds of years, the
Mississippi River mainstem is actively moving in its floodplain (see Figure 17 in Section 3.5.2.1). Over
timescales of years to decades, not all of the sediment loads from the upstream portions of each
modeled Misssissippi River mainstem HUC-8 reach are delivered to the model outlet. A small proportion
of the sediment load (<4%; see Figure 22 and Figure 23) is temporarily stored in the system through
aggradation processes (such as the build-up of a sand bar in the channel).
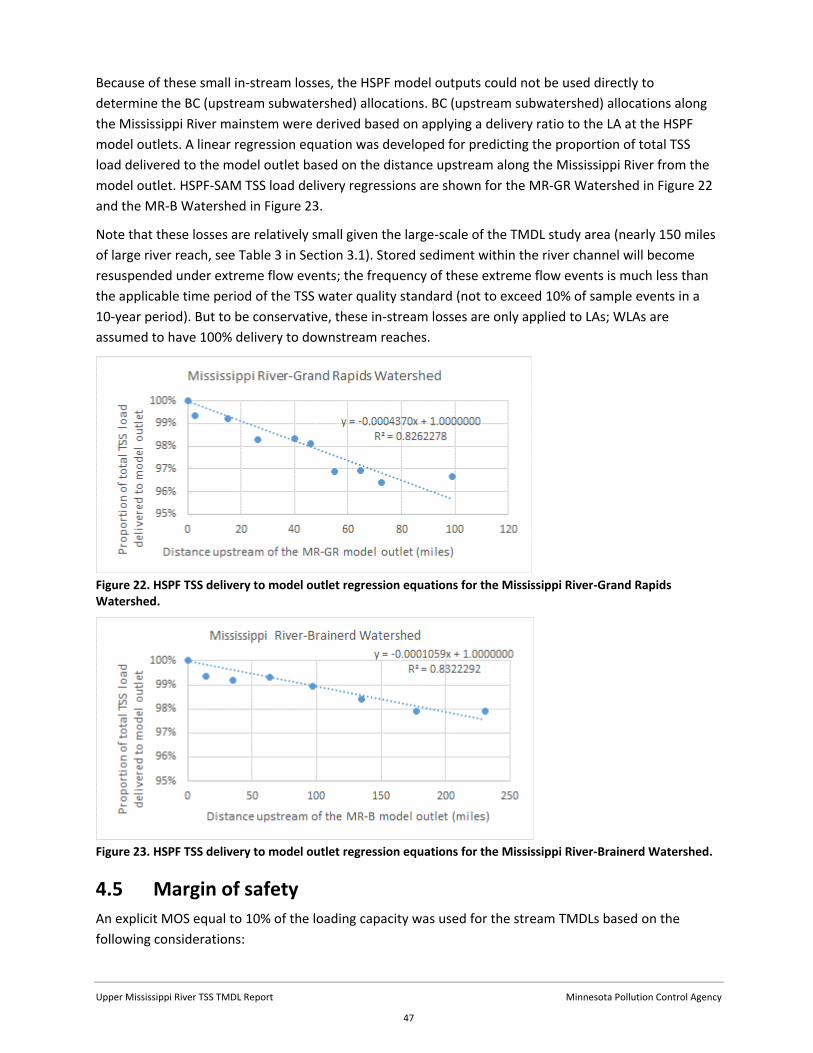
Upper Mississippi River TSS TMDL Report Minnesota Pollution Control Agency
47
Because of these small in-stream losses, the HSPF model outputs could not be used directly to
determine the BC (upstream subwatershed) allocations. BC (upstream subwatershed) allocations along
the Mississippi River mainstem were derived based on applying a delivery ratio to the LA at the HSPF
model outlets. A linear regression equation was developed for predicting the proportion of total TSS
load delivered to the model outlet based on the distance upstream along the Mississippi River from the
model outlet. HSPF-SAM TSS load delivery regressions are shown for the MR-GR Watershed in Figure 22
and the MR-B Watershed in Figure 23.
Note that these losses are relatively small given the large-scale of the TMDL study area (nearly 150 miles
of large river reach, see Table 3 in Section 3.1). Stored sediment within the river channel will become
resuspended under extreme flow events; the frequency of these extreme flow events is much less than
the applicable time period of the TSS water quality standard (not to exceed 10% of sample events in a
10-year period). But to be conservative, these in-stream losses are only applied to LAs; WLAs are
assumed to have 100% delivery to downstream reaches.
Figure 22. HSPF TSS delivery to model outlet regression equations for the Mississippi River-Grand Rapids Watershed.
Figure 23. HSPF TSS delivery to model outlet regression equations for the Mississippi River-Brainerd Watershed.
4.5 Margin of safety
An explicit MOS equal to 10% of the loading capacity was used for the stream TMDLs based on the
following considerations:

Upper Mississippi River TSS TMDL Report Minnesota Pollution Control Agency
48
There is some inherent uncertainty in flow estimates by HSPF models.
Only two years of monitoring data (2013 and 2014) collected during the TMDL 10-year time
period (2009 through 2018) overlapped with HSPF flow estimates (1996 through 2015) to
estimate existing TSS loads for the load duration curves, which may not capture the full range of
observed year to year variability in TSS.
Allocations are a function of flow, which varies from high to low flows. This variability is
accounted for through the development of a TMDL for each of five flow regimes.
4.6 Seasonal variation
The TSS water quality standard applies for the period April through September, which corresponds to
the open water season when aquatic organisms are most active and when high stream TSS
concentrations generally occur. TSS loading varies with the flow regime and season. Spring is associated
with large flows from snowmelt, the summer is associated with the growing season as well as periodic
storm events and receding streamflows, and the fall brings increasing precipitation and rapidly changing
agricultural landscapes.
Critical conditions and seasonal variation are addressed in this TMDL through several mechanisms. The
TSS standard applies during the open water months, and data was collected throughout this period. The
water quality analysis conducted on these data evaluated variability in flow through the use of five flow
regimes: from high flows, such as flood events, to low flows, such as baseflow. Through the use of load
duration curves and monthly summary figures, TSS loading was evaluated at actual flow conditions at
the time of sampling (and by month).
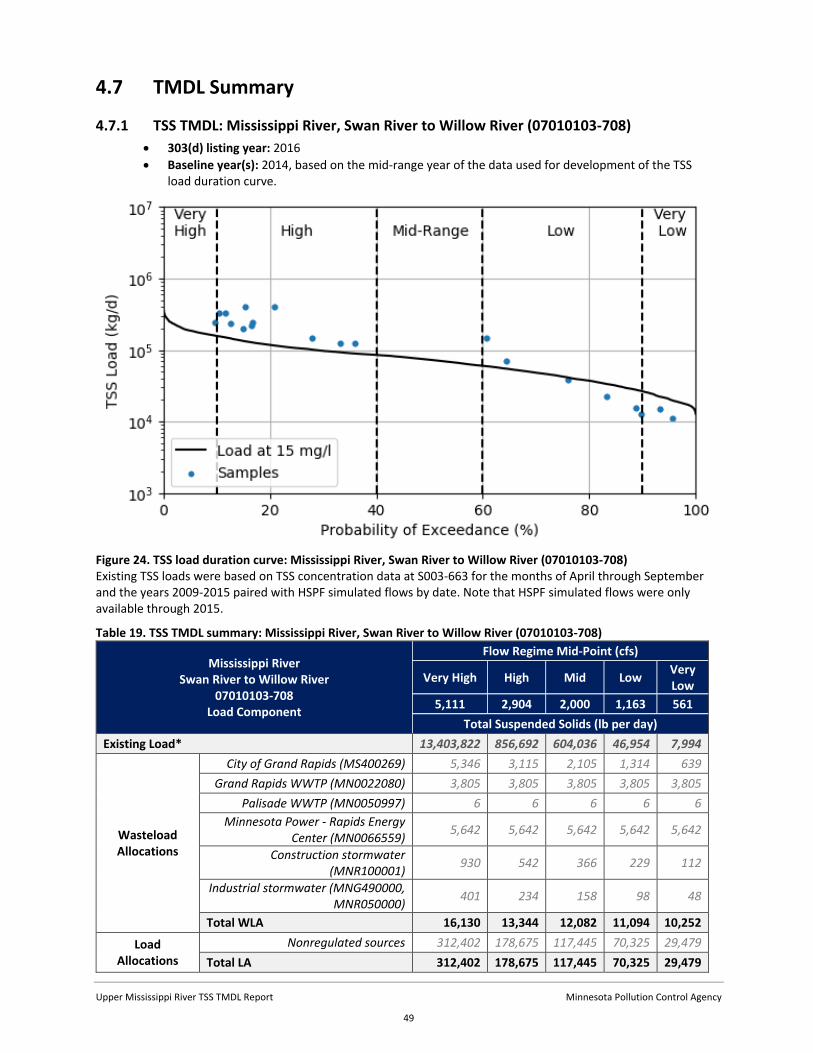
Upper Mississippi River TSS TMDL Report Minnesota Pollution Control Agency
49
4.7 TMDL Summary
4.7.1 TSS TMDL: Mississippi River, Swan River to Willow River (07010103-708)
303(d) listing year: 2016
Baseline year(s): 2014, based on the mid-range year of the data used for development of the TSS load duration curve.
Figure 24. TSS load duration curve: Mississippi River, Swan River to Willow River (07010103-708) Existing TSS loads were based on TSS concentration data at S003-663 for the months of April through September and the years 2009-2015 paired with HSPF simulated flows by date. Note that HSPF simulated flows were only available through 2015.
Table 19. TSS TMDL summary: Mississippi River, Swan River to Willow River (07010103-708)
Mississippi River Swan River to Willow River
07010103-708 Load Component
Flow Regime Mid-Point (cfs)
Very High High Mid Low Very Low
5,111 2,904 2,000 1,163 561
Total Suspended Solids (lb per day)
Existing Load* 13,403,822 856,692 604,036 46,954 7,994
Wasteload Allocations
City of Grand Rapids (MS400269) 5,346 3,115 2,105 1,314 639
Grand Rapids WWTP (MN0022080) 3,805 3,805 3,805 3,805 3,805
Palisade WWTP (MN0050997) 6 6 6 6 6
Minnesota Power - Rapids Energy Center (MN0066559)
5,642 5,642 5,642 5,642 5,642
Construction stormwater (MNR100001)
930 542 366 229 112
Industrial stormwater (MNG490000, MNR050000)
401 234 158 98 48
Total WLA 16,130 13,344 12,082 11,094 10,252
Load Allocations
Nonregulated sources 312,402 178,675 117,445 70,325 29,479
Total LA 312,402 178,675 117,445 70,325 29,479

Upper Mississippi River TSS TMDL Report Minnesota Pollution Control Agency
50
Mississippi River Swan River to Willow River
07010103-708 Load Component
Flow Regime Mid-Point (cfs)
Very High High Mid Low Very Low
5,111 2,904 2,000 1,163 561
Total Suspended Solids (lb per day)
Boundary Conditions (Upstream
Subwatersheds)
Headwaters of the Mississippi River 23,818 16,863 15,957 3,214 1,093
Prairie River 13,942 2,130 95 24 4
Swan River 3,322 298 53 11 2
Big Sandy River 2,529 117 20 0.9 0.2
Total BC 43,611 19,408 16,125 3,250 1,099
10% MOS 41,349 23,492 16,184 9,407 4,537
Total Loading Capacity 413,492 234,919 161,836 94,076 45,367
* Existing TSS loads were based on the 90th percentile TSS concentration from Table 22 of all samples collected at
S003-663 during the months of April-September and the years 2009-2015 multiplied by the HSPF simulated
median flow for each flow regime. Note that HSPF simulated flows were only available through 2015.

Upper Mississippi River TSS TMDL Report Minnesota Pollution Control Agency
51
4.7.2 TSS TMDL: Mississippi River, Willow River to Pine River (07010104-655)
303(d) listing year: 1998, based on the old turbidity standard but also currently exceeding the TSS standard
Baseline year(s): 2014, based on the mid-range year of the data used for development of the TSS load duration curve.
Figure 25. TSS load duration curve: Mississippi River, Willow River to Pine River (07010104-655) Existing TSS loads were based on TSS concentration data at S002-010 and S000-152 or the months of April through September and the years 2009-2015 paired with HSPF simulated flows by date. Note that HSPF simulated flows were only available through 2015.

Upper Mississippi River TSS TMDL Report Minnesota Pollution Control Agency
52
Table 20. TSS TMDL summary: Mississippi River, Willow River to Pine River (07010104-655)
Mississippi River Willow River to Pine River
07010104-655 Load Component
Flow Regime Mid-Point (cfs)
Very High High Mid Low Very Low
7,716 3,763 2,516 1,499 722
Total Suspended Solids (lb per day)
Existing Load* 4,844,053 354,416 220,321 24,449 5,002
Wasteload Allocations
American Peat Technology (MN0057533)
82 82 82 82 82
Aitkin WWTP (MN0020095) 172 172 172 172 172
Construction stormwater (MNR100001)
1,453 816 562 337 163
Industrial stormwater (MNG490000, MNR050000)
313 176 121 73 35
Total WLA 2,020 1,246 937 664 452
Load Allocations Nonregulated sources 44,685 26,415 18,951 14,191 6,692
Total LA 44,685 26,416 18,951 14,191 6,692
Boundary Conditions (Upstream
Subwatersheds)
Upstream impaired reach (07010103-708)
413,492 234,919 161,836 94,076 45,367
Willow River 32,910 9,826 1,307 203 51
Rice River 68,709 1,603 134 24 2
Total BC 515,111 246,348 163,277 94,303 45,420
10% MOS 62,424 30,445 20,352 12,129 5,840
Total Loading Capacity 624,240 304,454 203,517 121,287 58,404
* Existing TSS loads were based on 90th percentile TSS concentration from Table 22 of all samples collected at
S002-010 and S000-152 during the months of April-September and the years 2009-2015 multiplied by the HSPF
simulated median flow for each flow regime. Note that HSPF simulated flows were only available through 2015.

Upper Mississippi River TSS TMDL Report Minnesota Pollution Control Agency
53
4.7.3 TSS TMDL: Mississippi River, Pine River to Crow Wing River (07010104-656)
303(d) listing year or proposed year: 2016
Baseline year(s): 2014, based on the mid-range year of the data used for development of the TSS load duration curve.
Figure 26. TSS load duration curve: Mississippi River, Pine River to Crow Wing River (07010104-656) Existing TSS loads were based on TSS concentration data at S000-570 and S007-337 for the months of April through September and the years 2009-2015 paired with HSPF simulated flows by date. Note that HSPF simulated flows were only available through 2015. Most of the existing TSS exceedances were observed since 2015 and therefore are not represented on the load duration curve.

Upper Mississippi River TSS TMDL Report Minnesota Pollution Control Agency
54
Table 21. TSS TMDL summary: Mississippi River, Pine River to Crow Wing River (07010104-656)
Mississippi River Pine River to Crow Wing River
07010104-656 Load Component
Flow Regime Mid-Point (cfs)
Very High High Mid Low Very Low
13,825 6,356 4,265 2,781 1,505
Total Suspended Solids (lb per day)
Existing Load* 5,394,630 1,105,078 379,652 170,640 67,276
Wasteload Allocations
City of Brainerd (MS400266) 12,588 5,456 3,752 2,754 1,700
City of Baxter (MS400231) 12,454 5,399 3,713 2,723 1,682
Brainerd WWTP (MN0049328) 783 783 783 783 783
Serpent Lake WWTP (MNG585215) 2,347 2,347 2,347 2,347 2,347
Construction stormwater (MNR100001)
1,944 842 580 425 262
Industrial Stormwater (MNG490000, MNR050000)
960 416 286 210 130
Total WLA 31,076 15,243 11,461 9,242 6,904
Load Allocations Nonregulated sources 324,029 135,756 93,247 70,375 43,947
Total LA 324,029 135,756 93,247 70,375 43,947
Boundary Conditions (Upstream
Subwatersheds)
Upstream impaired reach (07010103-655)
624,240 304,454 203,517 121,287 58,404
Pine River 27,324 7,363 2,339 1,618 353
Total BC 651,564 311,817 205,856 122,905 58,757
10% MOS 111,852 51,424 34,507 22,502 12,179
Total Loading Capacity 1,118,521 514,240 345,071 225,024 121,787
* Existing TSS loads were based on the 90th percentile TSS concentration from Table 22 of all samples collected at
S000-570 and S007-337 during the months of April-September and the years 2009-2015 multiplied by the HSPF
simulated median flow for each flow regime. Note that HSPF simulated flows were only available through 2015.
4.8 TSS Reductions
The average annual TSS load reduction needed to meet the TMDL was estimated for each impaired
reach, based on achieving the TSS standard 90th percentile concentration of 15 mg/L from the existing
90th percentile concentration of samples collected between April and September in 2009 through 2018
for the existing load monitoring station(s) listed in Table 22. TSS reductions needed are highest for the
most upstream impaired reach of the Upper Mississippi River (62%, Swan River to Willow River), and
lowest for the most downstream reach of the Upper Mississippi River (25%, Pine River to Crow Wing
River).
The estimated percent reductions provide a rough approximation of the overall reduction needed for
the water body to meet the TMDL. The percent reduction is a means to capture the level of effort
needed to reduce TSS concentrations in the impaired reaches. The percent reductions should not be
construed to mean that each of the separate sources listed in the TMDL table needs to be reduced by
that amount.

Upper Mississippi River TSS TMDL Report Minnesota Pollution Control Agency
55
Table 22. TSS reductions needed by impaired reach
Impaired Reach (AUID) Existing Load Monitoring Station(s)
90th Percentile
Concentration (mg/L)
TSS Standard 90th
Percentile Concentration
(mg/L)
TSS Reductions needed to
meet TMDL (%)
Mississippi River, Swan River to Willow River
(07010103-708) S003-663 39 15 62%
Mississippi River, Willow River to Pine River
(07010104-655)
S002-010 & S000-152
37 15 59%
Mississippi River, Pine River to Crow Wing River
(07010104-656)
S000-570 & S007-337
20 15 25%
5. Future growth considerations According to the 2010 Census, over 2.8 million people reside in the Upper Mississippi Basin, mostly in
the Twin cities downstream of the Study Area. Population growth trends show increasing pressure on
the upper part of the basin, particularly along the river. How changing sources of pollutants may or may
not impact TMDL allocations are discussed below, in the event that population and land use in the TMDL
Study Area do change over time.
5.1 New or expanding permitted MS4 WLA transfer process
Future transfer of watershed runoff loads in this TMDL may be necessary if any of the following
scenarios occur within the TMDL Study Area:
1. New development occurs within a regulated MS4. Newly developed areas that are not already
included in the WLA must be transferred from the LA to the WLA to account for the growth.
2. One regulated MS4 acquires land from another regulated MS4. Examples include annexation or
highway expansions. In these cases, the transfer is WLA to WLA.
3. One or more nonregulated MS4s become regulated. If this has not been accounted for in the WLA,
then a transfer must occur from the LA.
4. Expansion of a U.S. Census Bureau Urban Area encompasses new regulated areas for existing
permittees. An example is existing state highways that were outside an urban area at the time the
TMDL was completed, but are now inside a newly expanded urban area. This will require either a
WLA to WLA transfer or a LA to WLA transfer.
5. A new MS4 or other stormwater-related point source is identified and is covered under a NPDES
Permit. In this situation, a transfer must occur from the LA.
Load transfers will be based on methods consistent with those used in setting the allocations in this
TMDL (see Sections 4.1 and 4.2.1). In cases where WLA is transferred from or to a regulated MS4, the
permittees will be notified of the transfer and have an opportunity to comment.

Upper Mississippi River TSS TMDL Report Minnesota Pollution Control Agency
56
5.2 New or expanding wastewater
The MPCA, in coordination with the EPA Region 5, has developed a streamlined process for setting or
revising WLAs for new or expanding wastewater discharges to waterbodies with an EPA approved TMDL
(MPCA 2012). This procedure will be used to update WLAs in approved TMDLs for new or expanding
wastewater dischargers whose permitted effluent limits are at or below the instream target and will
ensure that the effluent concentrations will not exceed applicable water quality standards or surrogate
measures. The process for modifying any and all WLAs will be handled by the MPCA, with input and
involvement by the EPA, once a permit request or reissuance is submitted. The overall process will use
the permitting public notice process to allow for the public and EPA to comment on the permit changes
based on the proposed WLA modification(s). Once any comments or concerns are addressed, and the
MPCA determines that the new or expanded wastewater discharge is consistent with the applicable
water quality standards, the permit will be issued and any updates to the TMDL WLA(s) will be made.
For more information on the overall process, visit the MPCA’s TMDL Policy and Guidance webpage.
6. Reasonable assurance A TMDL needs to provide reasonable assurance that water quality targets will be achieved through the
specified combination of point and nonpoint source reductions reflected in the LAs and WLAs,
respectively. According to EPA guidance (EPA 2002):
“When a TMDL is developed for waters impaired by both point and nonpoint sources, and the WLA
is based on an assumption that nonpoint-source load reductions will occur ... the TMDL should
provide reasonable assurances that nonpoint source control measures will achieve expected load
reductions in order for the TMDL to be approvable. This information is necessary for the EPA to
determine that the TMDL, including the LA and WLAs, has been established at a level necessary to
implement water quality standards.”
In order to address sediment load reductions in the TMDL Study Area, already required point source
controls will continue to be effective in improving water quality if accompanied by considerable
reductions in nonpoint source loading.
The following sections provide reasonable assurance that implementation will occur and result in
pollutant load reductions in the TMDL Study Area. These reasonable assurances are outlined in the
following areas:
Availability of reliable means of addressing pollutant loads (see Section 6.1);
A means of prioritizing and focusing management (see Section 6.2);
Development of a strategy for implementation (see Section 6.2 and Section 8);
Availability of funding to execute projects (see Section 6.3);
A system of tracking progress and monitoring water quality response (see Section 6.4, Section 7
Monitoring plan and Section 8.7 Adaptive management);
Nonpoint source pollution reduction examples at multiple scales (see Section 6.2)
Upper Mississippi River TSS TMDL Report Minnesota Pollution Control Agency
57
6.1 Reliable means of addressing pollutant loads
Elements are in place for both point sources and nonpoint sources to make progress toward needed
pollutant reductions in this TMDL. A range of local partners is involved in water resource management
and implementation, including counties and SWCDs from Aitkin and Itasca counties, and numerous cities
and townships. In addition, state agencies (MPCA, Board of Water and Soil Resources (BWSR), DNR and
Minnesota Department of Agriculture (MDA)) receive Clean Water Funds for various water resource
management duties, including technical assistance.
Management will be prioritized and focused on the dominant sources of sediment to the TMDL Study
Area; primarily conservation of land that has been converted to urban or agricultural uses within the
Upper Mississippi River corridor. Management will be focused on practices that reduce soil erosion from
physical trampling of the banks from livestock, increase stabilization of the soil from planting deep-
rooted vegetation, and water storage in the drainage area to reduce the number of concentrated runoff
flowpaths resulting in gullies or bank failures.
6.1.1 Regulatory approaches
Regulatory approaches help reduce the amount of pollutants entering the impaired reaches and reduce
the volume of water that can contribute to bank erosion, but address only the small fraction of sediment
sources in this TMDL Study Area that are regulated.
6.1.1.1 MS4 stormwater
The MPCA is responsible for applying federal and state regulations to protect and enhance water quality
in Minnesota. The MPCA oversees all regulated MS4 entities in stormwater management accounting
activities. All regulated MS4s in the watershed fall under the category of Phase II. The MS4 NPDES/SDS
Permits require regulated municipalities to implement BMPs to reduce pollutants in stormwater runoff
to the maximum extent practicable. All owners or operators of regulated MS4s (also referred to as
“permittees”) are required to satisfy the requirements of the MS4 general permit. The MS4 general
permit requires the permittee to develop a Stormwater Pollution Prevention Program (SWPPP) that
addresses all permit requirements, including the following six minimum control measures:
Public education and outreach;
Public participation;
Illicit Discharge Detection and Elimination (IDDE) Program;
Construction-site runoff controls;
Post-construction runoff controls; and
Pollution prevention and municipal good housekeeping measures.
A SWPPP is a management plan that describes the MS4 permittee’s activities for managing stormwater
within their jurisdiction or regulated area. In the event a TMDL study has been completed, approved by
EPA prior to the effective date of the general permit, and assigns a WLA to an MS4 permittee, that
permittee must document the WLA in their application and provide an outline of the BMPs to be
implemented in the current permit term to address any needed reduction in loading from the MS4.
Upper Mississippi River TSS TMDL Report Minnesota Pollution Control Agency
58
The MPCA requires applicants submit their application materials and SWPPP document to the MPCA for
review. Prior to extension of coverage under the general permit, all application materials are placed on
30-day public notice by the MPCA, to ensure adequate opportunity for the public to comment on each
permittee’s stormwater management program. Upon extension of coverage by the MPCA, the
permittees are to implement the activities described within their SWPPP, and submit annual reports to
the MPCA by June 30 of each year. These reports document the implementation activities which have
been completed within the previous year, analyze implementation activities already installed, and
outline any changes within the SWPPP from the previous year. For more information on the MPCA MS4
program see: The Municipal Stormwater page.
This TMDL assigns TSS WLAs to permitted MS4s in the TMDL Study Area (Section 4.7). The Small MS4
General Permit requires permittees to develop compliance schedules for EPA approved TMDL WLAs not
already being met at the time of permit application. A compliance schedule includes BMPs that will be
implemented over the permit term, a timeline for their implementation, and a long term strategy for
continuing progress towards assigned WLAs. For WLAs being met at the time of permit application, the
same level of treatment must be maintained in the future. Regardless of WLA attainment, all permitted
MS4s are still required to reduce pollutant loadings to the maximum extent practicable.
The MPCA’s stormwater program and its NPDES Permit program are regulatory activities providing
reasonable assurance that implementation activities are initiated, maintained, and consistent with WLAs
assigned in this study.
6.1.1.2 Construction stormwater
The WLA for stormwater discharges from sites where there is construction activity reflects the number
of construction sites greater than one acre expected to be active in the watershed at any one time, and
the BMPs and other stormwater control measures that should be implemented at the sites to limit the
discharge of pollutants of concern. The BMPs and other stormwater control measures that should be
implemented at construction sites are defined in the State's NPDES/SDS General Stormwater Permit for
Construction Activity (MNR100001). If a construction site owner/operator obtains coverage under the
NPDES/SDS General Stormwater Permit and properly selects, installs and maintains all BMPs required
under the permit, including those related to impaired waters discharges and any applicable additional
requirements found in Appendix A of the Construction General Permit, the stormwater discharges
would be expected to be consistent with the WLA in this TMDL. All local construction stormwater
requirements must also be met.
6.1.1.3 Industrial stormwater
The WLA for stormwater discharges from sites where there is industrial activity reflects the number of
sites in the watershed for which NPDES Industrial Stormwater Permit coverage is required, and the
BMPs and other stormwater control measures that should be implemented at the sites to limit the
discharge of pollutants of concern. The BMPs and other stormwater control measures that should be
implemented at the industrial sites are defined in the State's NPDES/SDS Industrial Stormwater Multi-
Sector General Permit (MNR050000), or NPDES/SDS Nonmetallic Mining/Associated Activities General
Permit (MNG490000). If a facility owner/operator obtains stormwater coverage under the appropriate
NPDES/SDS Permit and properly selects, installs and maintains all BMPs required under the permit, the
Upper Mississippi River TSS TMDL Report Minnesota Pollution Control Agency
59
stormwater discharges would be expected to be consistent with the WLA in this TMDL. All local
stormwater management requirements must also be met.
6.1.1.4 Wastewater
The MPCA issues NPDES/SDS permits for WWTFs that discharge into waters of the state. The permits
have site specific limits on pollutants that are based on water quality standards. Permits regulate
discharges with the goals of: (1) protecting public health and aquatic life, and (2) assuring that every
facility treats wastewater. Discharge monitoring is conducted by permittees and routinely submitted to
the MPCA for review.
6.1.1.5 Buffer program
The Buffer Law signed by Governor Dayton in June 2015 was amended on April 25, 2016, and further
amended by legislation signed by Governor Dayton on May 30, 2017. The Buffer Law requires the
following:
For all public waters, the more restrictive of:
– a 50-foot average width, 30-foot minimum width, continuous buffer of perennially rooted
vegetation, or
– the state shoreland standards and criteria.
For public drainage systems established under Minn. Stat. 103E, a 16.5-foot minimum width
continuous buffer.
Alternative practices are allowed in place of a perennial buffer in some cases. The amendments enacted
in 2017 clarify the application of the buffer requirement to public waters, provide additional statutory
authority for alternative practices, address concerns over the potential spread of invasive species
through buffer establishment, establish a riparian protection aid program to fund local government
buffer law enforcement and implementation, and allowed landowners to be granted a compliance
waiver until July 1, 2018, when they filed a compliance plan with the soil and water conservation district
(SWCD).
The BWSR provides oversight of the buffer program, which is primarily administered at the local level;
compliance with the Buffer Law in the state is displayed at the Buffer Program Update webpage. As of
January 2019, over 95% of all parcels in Aitkin, Crow Wing, and Itasca Counties are in compliance with
the buffer law.
6.1.2 Nonregulatory
Nonregulatory approaches are volunteer based and necessary to reduce the majority of sediment
entering the impaired reaches and the volume of water that can contribute to bank erosion. The
following examples describe large-scale programs that have proven to be effective and/or will reduce
pollutant loads going forward.
6.1.2.1 Mississippi River Headwaters Board implementation programs
At the local level, the Mississippi River Headwaters Board currently implements programs that target
improving water quality and have been actively involved in projects to improve water quality in the past.
The Mississippi River Headwaters Board has recently updated their Comprehensive Management Plan
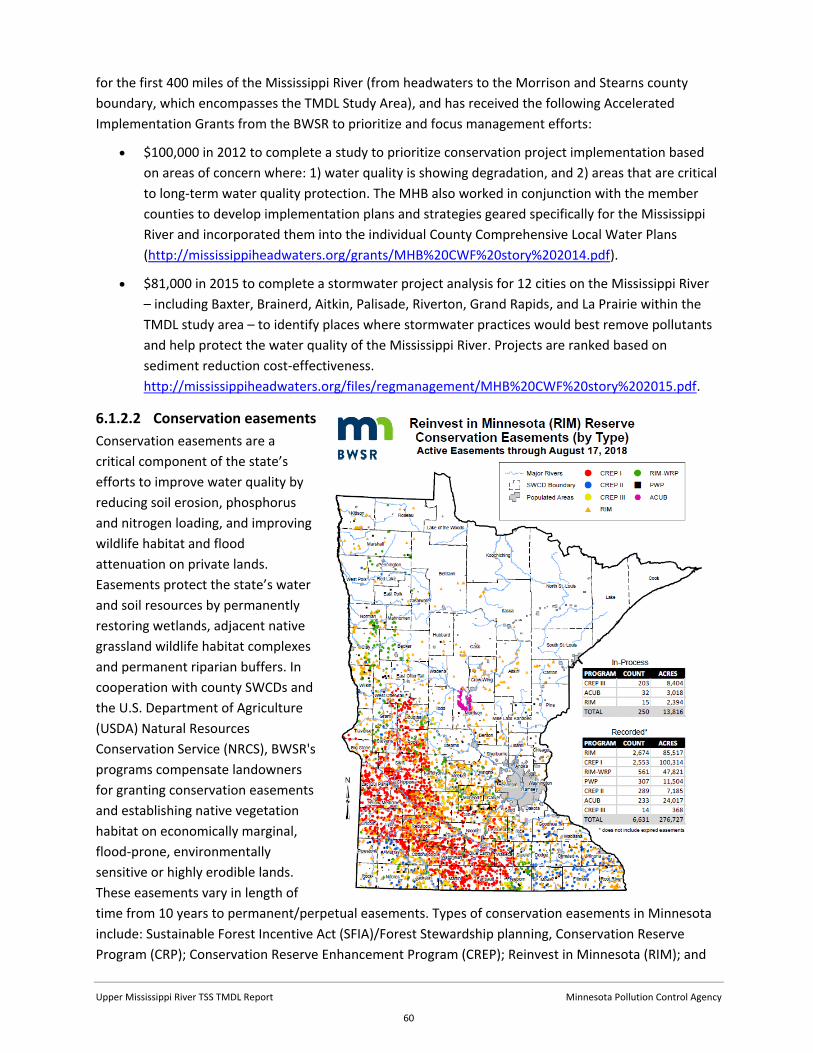
Upper Mississippi River TSS TMDL Report Minnesota Pollution Control Agency
60
for the first 400 miles of the Mississippi River (from headwaters to the Morrison and Stearns county
boundary, which encompasses the TMDL Study Area), and has received the following Accelerated
Implementation Grants from the BWSR to prioritize and focus management efforts:
$100,000 in 2012 to complete a study to prioritize conservation project implementation based
on areas of concern where: 1) water quality is showing degradation, and 2) areas that are critical
to long-term water quality protection. The MHB also worked in conjunction with the member
counties to develop implementation plans and strategies geared specifically for the Mississippi
River and incorporated them into the individual County Comprehensive Local Water Plans
(http://mississippiheadwaters.org/grants/MHB%20CWF%20story%202014.pdf).
$81,000 in 2015 to complete a stormwater project analysis for 12 cities on the Mississippi River
– including Baxter, Brainerd, Aitkin, Palisade, Riverton, Grand Rapids, and La Prairie within the
TMDL study area – to identify places where stormwater practices would best remove pollutants
and help protect the water quality of the Mississippi River. Projects are ranked based on
sediment reduction cost-effectiveness.
http://mississippiheadwaters.org/files/regmanagement/MHB%20CWF%20story%202015.pdf.
6.1.2.2 Conservation easements
Conservation easements are a
critical component of the state’s
efforts to improve water quality by
reducing soil erosion, phosphorus
and nitrogen loading, and improving
wildlife habitat and flood
attenuation on private lands.
Easements protect the state’s water
and soil resources by permanently
restoring wetlands, adjacent native
grassland wildlife habitat complexes
and permanent riparian buffers. In
cooperation with county SWCDs and
the U.S. Department of Agriculture
(USDA) Natural Resources
Conservation Service (NRCS), BWSR's
programs compensate landowners
for granting conservation easements
and establishing native vegetation
habitat on economically marginal,
flood-prone, environmentally
sensitive or highly erodible lands.
These easements vary in length of
time from 10 years to permanent/perpetual easements. Types of conservation easements in Minnesota
include: Sustainable Forest Incentive Act (SFIA)/Forest Stewardship planning, Conservation Reserve
Program (CRP); Conservation Reserve Enhancement Program (CREP); Reinvest in Minnesota (RIM); and
Upper Mississippi River TSS TMDL Report Minnesota Pollution Control Agency
61
the Wetland Reserve Program (WRP) or Permanent Wetland Preserve (PWP)
https://bwsr.state.mn.us/reinvest-minnesota-overview.
The following table shows easements in place in the counties included in the TMDL Study Area as of
August 2019.
Table 23. Current easements within TMDL Study Area.
County CRP Acres RIM Total Resource
Acres
Cropland
Acres
Percent
Enrolled
Aitkin 0 1,950 1,950 71,040 2.7%
Crow Wing 7 6,422 6,429 52,789 12.2%
Itasca 167 918 1,085 29,241 3.7%
6.2 Implementation strategy
Based on the findings from the sediment source summary for the TMDL Study Area (see Section 3.5), an
implementation strategy (see Section 8) was developed by EOR and MPCA based on input from LGUs
(cities, counties, and SWCDs), the Mississippi Headwaters Board, and state agencies (DNR, MPCA,
BWSR). These partners and other stakeholders were also able to provide input on the overall
implementation strategy as part of the public participation process for this TMDL (see Section 9).
The main implementation drivers will be the Mississippi Headwater Board and the MS4 Cities, in
coordination with the SWCDs.
6.3 Funding availability
At the local level, the Mississippi Headwaters Board has received over $6M for the Mississippi
Headwaters Habitat Corridor Easement and Acquisition Program and $181,000 for project prioritization
studies. At the state level, there are a variety of funding sources to help cover some of the cost to
implement practices that reduce pollutants from entering surface waters and groundwater. There are
several programs listed below that contain web links to the programs and contacts for each entity. The
contacts for each grant program can assist in the determination of eligibility for each program, as well as
funding requirements and amounts available.
Agriculture BMP Loan Program (MDA)
Agricultural Water Quality Certification Program (MDA)
Clean Water Fund Grants (BWSR)
Clean Water Partnership Loans (MPCA)
Environment and Natural Resources Trust Fund (Legislative-Citizen Commission on Minnesota
Resources)
Environmental Assistance Grants Program (MPCA)
Phosphorus Reduction Grant Program (Minnesota Public Facilities Authority)
Clean Water Act Section 319 Grant Program (MPCA)
Upper Mississippi River TSS TMDL Report Minnesota Pollution Control Agency
62
Small Community Wastewater Treatment Construction Loans & Grants (Minnesota Public
Facilities Authority)
Source Water Protection Grant Program (Minnesota Department of Health)
Surface Water Assessment Grants (MPCA)
Wastewater and storm water financial assistance (MPCA)
Conservation Partners Legacy Grant Program (DNR)
Environmental Quality Incentives Program (NRCS)
Conservation Reserve Program (USDA)
Clean Water State Revolving Fund (EPA)
6.4 Tracking progress and monitoring water quality response
Tracking progress towards achieving the TMDL sediment load reduction goals and monitoring the water
quality response of the Upper Mississippi River will be based on water quality monitoring (see Section 7)
and tracking progress of implementing the key strategies outlined in Section 8: Implementation strategy
summary.
6.5 Nonpoint source pollution reduction trends
Analysis of water quality data from 80 monitoring locations across Minnesota has shown over a 30 year
period that five pollutants, TSS, total phosphorus (TP), ammonia, biochemical oxygen demand (BOD),
and bacteria have significantly decreased, while nitrate and chloride concentrations have increased
(MPCA 2014b). These trends are a result of the state’s efforts to control municipal and industrial
discharges and a continuing effort by state, county and local groups to reduce nonpoint source
pollution. At a local level, the Mississippi Headwaters Board and SWCDs promote soil and water
conservation through technical, educational and financial assistance.
In summary, significant time and resources have been devoted to identifying the most effective BMPs,
providing means of focusing them in the TMDL Study Area, and supporting their implementation via
state initiatives and dedicated funding. The Upper Mississippi River TSS TMDL process engaged partners
to arrive at reasonable examples of BMP combinations that attain pollutant reduction goals. Minnesota
is a leader in watershed planning as well as monitoring and tracking progress toward water quality goals
and pollutant load reductions. Finally, examples cited herein confirm that BMPs and restoration projects
have proven to be effective over time, and as stated by the State of Minnesota Court of Appeals in A15-
1622 MCEA vs MPCA and MCES:
We conclude that substantial evidence exists to conclude that voluntary reductions from nonpoint
sources have occurred in the past and can be reasonably expected to occur in the future. The
Nutrient Reduction Strategy (NRS) […] provides substantial evidence of existing state programs
designed to achieve reductions in nonpoint source pollution as evidence that reductions in nonpoint
pollution have been achieved and can reasonably be expected to continue to occur.

Upper Mississippi River TSS TMDL Report Minnesota Pollution Control Agency
63
7. Monitoring plan
Several types of monitoring will be important to measuring success. These efforts will be conducted
contingent on resources available and priorities. The six basic types of monitoring listed below are based
on the EPA’s Protocol for Developing Sediment TMDLs (EPA 1999).
1. Baseline monitoring—identifies the environmental condition of the water body to determine if
water quality standards are being met, and identify temporal trends in water quality. Every five
years, the MPCA will complete intensive monitoring of the major rivers, including the TMDL Study
Area (chemistry three times per month in the first year, chemistry and biology two times per month
in the fifth year). More information about MPCA’s Large River Monitoring is available online:
https://www.pca.state.mn.us/water/large-river-monitoring.
2. Implementation monitoring—tracks implementation of sediment reduction practices using BWSR’s
eLINK or other tracking mechanisms. BMP implementation monitoring is conducted by both BWSR
(i.e., eLINK) and USDA. Both agencies track the locations of BMP installations. The Healthier
Watersheds webpage displays both implementation funding and practices:
https://www.pca.state.mn.us/water/healthier-watersheds.
Discharges from permitted municipal and industrial wastewater sources are reported through
discharge monitoring records; these records are used to evaluate compliance with NPDES permits.
Summaries of discharge monitoring records are available through the MPCA’s Wastewater Data
Browser: https://www.pca.state.mn.us/data/wastewater-data-browser.
3. Flow monitoring—is combined with water quality monitoring at the site to allow for the calculation
of pollutant loads. Long-term flow monitoring within the TMDL Study Area is at three locations on
the Mississippi River mainstem: Mississippi River at Grand Rapids (USGS 05211000), Mississippi River
at Aitkin (USGS 05227500), and Mississippi River at Brainerd (USGS 05242300). Flow data is available
from USGS: https://waterdata.usgs.gov/mn/nwis/rt.
4. Effectiveness monitoring—determines whether a practice or combination of practices are effective
in improving water quality. Effectiveness monitoring would be completed by the Mississippi
Headwaters Board, SWCDs, or cities on a project specific basis.
5. Trend monitoring—allows the statistical determination of whether water quality conditions are
improving. The MPCA’s Watershed Pollutant Load Monitoring Network (WPLMN) measures and
compares data on pollutant loads from Minnesota’s rivers and streams and tracks water quality
trends. WPLMN data will be used to assist with assessing impaired waters, watershed modeling,
determining pollutant source contributions, developing watershed and water quality reports, and
measuring the effectiveness of water quality restoration efforts. Data are collected along major river
mainstems, at major watershed (i.e., HUC-8) outlets to major rivers, and in several subwatersheds.
This long-term monitoring program began in 2007. Long-term trend records are available from
MPCA’s WPLMN: https://www.pca.state.mn.us/water/watershed-pollutant-load-monitoring.
6. Validation monitoring—validates the source analysis and linkage methods in sediment source
tracking to provide additional certainty regarding study findings. One of the implementation
strategy recommendations is a sediment fingerprinting analysis to verify the contribution of
Upper Mississippi River TSS TMDL Report Minnesota Pollution Control Agency
64
sediment bed and bank erosion in the TMDL Study Area, particularly erosion of Glacial Lake Aitkin
clay deposits within the stream channel versus watershed runoff. Sediment fingerprinting is an
analytical method used to determine different sources of sediment from various erosion processes,
both natural and management-related. The underlying principle is that different sediment sources
(i.e., stream banks, in-stream channel stream beds, floodplains, and uplands) can be characterized
using a number of chemical and physical properties. Each source of sediment has a unique set of
properties, referred to as a “fingerprint.” The source sampling can be used to: a) better define the
concentrations of the tracers derived from different sources of sediment within the watershed; b)
characterize floodplain deposition rates and floodplain/bank tracer concentrations; and c)
determine the extent to which groundwater seeps may influence fingerprinting estimates. An
example of a completed sediment fingerprinting study completed in Minnesota is MDA’s Root River
Integrated Sediment Budget: https://www.mda.state.mn.us/integrated-sediment-budget-root-river-
southeastern-minnesota.
8. Implementation strategy summary
8.1 Permitted sources
8.1.1 MS4 stormwater
MS4 stormwater represents a small contribution of the total TSS load to the impaired reaches of the
Upper Mississippi River mainstem, with the dominant source of TSS from bed/bank erosion due to the
underlying erodibility of glacial lake soils. Implementation of the stormwater retrofit projects identified
by the cities of Baxter, Brainerd, and Grand Rapids (as described below) will provide TSS reduction
benefits to the impaired reaches of the Mississippi River through direct TSS load reductions and
indirectly through rate and volume reductions that reduce in-stream erosion.
The NPDES/SDS permit requirements must be consistent with the assumptions and requirements of an
approved TMDL and associated WLAs. For the purposes of this TMDL, the baseline year for
implementation will be the mid-range year of the data years used for development of the TSS load
duration curve, or 2014.
Stormwater retrofit projects:
In 2014 and 2015, MHB received funding to complete a stormwater project analysis for 12 cities on the
Mississippi River – including Baxter, Brainerd Aitkin, Palisade, Riverton, Grand Rapids, and La Prairie
within the TMDL Study Area – to identify places where stormwater practices would best remove
pollutants and help protect the water quality of the Mississippi River. Projects included extended
detention ponds, stormwater reuse, boulevard bioretention cells, porous asphalt, iron-enhanced sand
filters, and iron-chloride treatment systems. Projects are ranked based on sediment reduction cost-
effectiveness. Implementation of these ranked practices from the completed stormwater project
analyses in the major communities within the TMDL Study Area (Baxter, Brainerd, and Grand Rapids) will
reduce urban runoff sediment loads to the Upper Mississippi River. The stormwater reports are available
from the Mississippi Headwaters Board Natural Protection Grants webpage.

Upper Mississippi River TSS TMDL Report Minnesota Pollution Control Agency
65
8.2 Nonpermitted sources
This section provides an overview of example BMPs that may be used for implementation to address
nonpermitted sources of TSS. Key implementation strategies by sediment source are described below:
Land conservation through easement and acquisition:
The Mississippi Headwaters Board in collaboration with the Trust for Public Land, BWSR, The
Nature Conservancy, 7 SWCDs in the Headwaters region and DNR has developed the Mississippi
Headwaters Habitat Corridor Easement and Acquisition Program to protect and preserve the
natural qualities of the Mississippi River. The goal of the program is to create and expand
contiguous complexes of permanently protected shoreland and upland for the benefit of fish
and wildlife habitat, migratory waterfowl, reduction of forest fragmentation, enhanced
recreational opportunities and protection of water quality. Land protection is achieved via fee-
title acquisition of land or enrolling land in The RIM conservation easement program. Since the
project began in 2016 it, has received $12 million in four appropriations for permanent
protection of fish and wildlife habitat in the minor watershed of the first 400 miles of the
Mississippi River. To date, over $6 million has been spent achieving permanent protection of
3,441 acres and 31 miles shoreland. Projects in process or committed will protect another 1,000
acres and 8 miles of shoreland.
Riparian buffers:
Establishing or enhancing long-rooted, native vegetation buffers along the river banks will
stabilize the banks and reduce erosion. Riparian buffers and filter strips that include perennial
vegetation and trees can filter runoff from adjacent cropland, provide shade and habitat for
wildlife, and reinforce streambanks to minimize erosion. The root structure of the vegetation
uses enhanced infiltration of runoff and subsequent trapping of pollutants. Both, however, are
only effective in this manner when the runoff enters the BMP as a slow moving, shallow “sheet”;
concentrated flow in a ditch or gully will quickly pass through the vegetation offering minimal
opportunity for retention and uptake of pollutants. In addition, deep rooted vegetation can
protect the streambanks from gouging by ice chunks in the river during spring snowmelt.
Livestock exclusion:
In some parts of the Upper Mississippi River corridor, livestock grazing along the river banks is
resulting in streambank erosion due to physical trampling of the banks from livestock. Working
with farmers to exclude livestock from direct access to the river banks will reduce bank erosion.
Performance standards:
The Minnesota Legislature has empowered the Mississippi Headwaters Board to protect the
Mississippi Headwaters Corridor through regulation of land use above the ordinary high water
mark (OHWM). Some activities on the shoreland are permitted by the DNR and other agencies
with review by the MHB to promote consistent administration of minimum standards.
Performance Standards are listed in Appendix 1 of the September 2019 Mississippi Headwaters
Board Comprehensive Plan. In addition, there are local ordinances within city boundaries.
Continued implementation of these standards and coordination between MHB and LGUs will

Upper Mississippi River TSS TMDL Report Minnesota Pollution Control Agency
66
protect the riparian area of the Upper Mississippi River from development and land use changes
with the goal of reducing bank erosion.
8.3 Education and outreach
A crucial part in the success of the Implementation Strategy that will restore the impaired river reaches
will be participation from local citizens. In order to gain support from these citizens, education and civic
engagement opportunities will be necessary. A variety of educational avenues have been and will
continue to be used throughout the TMDL Study Area. These include (but are not limited to): press
releases, meetings, workshops, focus groups, trainings, websites, etc. Local staff (conservation district,
county, etc.) and board members work to educate the residents of the watersheds about ways to
improve their waters on a regular basis.
Websites:
o Mississippi River Headwaters Board: http://mississippiheadwaters.org/
o Aitkin SWCD: https://aitkincountyswcd.org/
o Crow Wing SWCD: https://crowwingswcd.org/
o Itasca SWCD: https://itascaswcd.org/
o MPCA’s Upper Mississippi River Basin: https://www.pca.state.mn.us/featured/upper-
mississippi-river-what-protect-what-fix
8.4 Technical assistance
The SWCDs, NRCS, and county staff within the watersheds provide assistance to landowners for a
variety of projects that benefit water quality. Assistance provided to landowners varies based on
whether they are implementing urban, agricultural or shoreline BMPs. This technical assistance includes
education and one-on-one training. Many opportunities for technical assistance result from educational
workshops or trainings. It is important that these outreach opportunities for watershed residents
continue. Marketing is necessary to motivate landowners to participate in voluntary cost-share
assistance programs.
Programs such as state cost share, CREP, and RIM are administered through the county. In addition,
assistance is available from state and federal sources, including: Clean Water Legacy funding,
Environmental Quality Incentives Program (EQIP), CRP, State Buffer Law Implementation, Minnesota
Agricultural Water Quality Certification Program (MAWQCP), and Conservation Stewardship Program
(CSP). All of these programs are available to help implement the best conservation practices that each
parcel of land is eligible for to target the best conservation practices per site. Conservation practices
may include, but are not limited to: stormwater bioretention and other BMPs, septic system upgrades,
feedlot improvements, invasive species control, wastewater treatment practices, agricultural BMPs,
forest stewardship planning, and shoreline restorations.
8.5 Partnerships
Partnerships with counties, cities, townships, citizens, and co-ops are one mechanism through which the
MHB, along with Aitkin, Crow Wing, and Itasca SWCDs, will protect and improve water quality. Strong
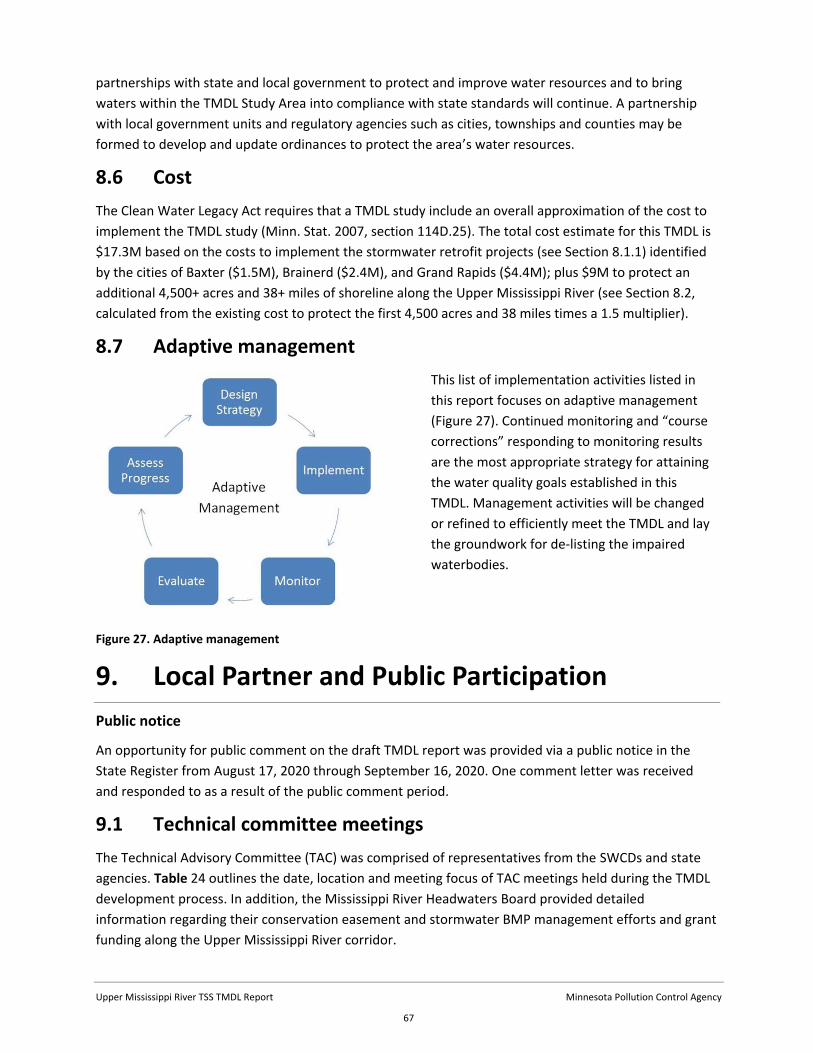
Upper Mississippi River TSS TMDL Report Minnesota Pollution Control Agency
67
partnerships with state and local government to protect and improve water resources and to bring
waters within the TMDL Study Area into compliance with state standards will continue. A partnership
with local government units and regulatory agencies such as cities, townships and counties may be
formed to develop and update ordinances to protect the area’s water resources.
8.6 Cost
The Clean Water Legacy Act requires that a TMDL study include an overall approximation of the cost to
implement the TMDL study (Minn. Stat. 2007, section 114D.25). The total cost estimate for this TMDL is
$17.3M based on the costs to implement the stormwater retrofit projects (see Section 8.1.1) identified
by the cities of Baxter ($1.5M), Brainerd ($2.4M), and Grand Rapids ($4.4M); plus $9M to protect an
additional 4,500+ acres and 38+ miles of shoreline along the Upper Mississippi River (see Section 8.2,
calculated from the existing cost to protect the first 4,500 acres and 38 miles times a 1.5 multiplier).
8.7 Adaptive management
This list of implementation activities listed in
this report focuses on adaptive management
(Figure 27). Continued monitoring and “course
corrections” responding to monitoring results
are the most appropriate strategy for attaining
the water quality goals established in this
TMDL. Management activities will be changed
or refined to efficiently meet the TMDL and lay
the groundwork for de-listing the impaired
waterbodies.
Figure 27. Adaptive management
9. Local Partner and Public Participation
Public notice
An opportunity for public comment on the draft TMDL report was provided via a public notice in the
State Register from August 17, 2020 through September 16, 2020. One comment letter was received
and responded to as a result of the public comment period.
9.1 Technical committee meetings
The Technical Advisory Committee (TAC) was comprised of representatives from the SWCDs and state
agencies. Table 24 outlines the date, location and meeting focus of TAC meetings held during the TMDL
development process. In addition, the Mississippi River Headwaters Board provided detailed
information regarding their conservation easement and stormwater BMP management efforts and grant
funding along the Upper Mississippi River corridor.

Upper Mississippi River TSS TMDL Report Minnesota Pollution Control Agency
68
Table 24. Upper Mississippi River TSS TMDL Technical Advisory Committee Meetings.
Date Location Meeting Focus
5/7/2019 Webex Planning meeting for project
5/15/2019 Skype Near stream erosion sources
5/15/2019 Skype Point sources
5/16/2019 Skype Chemical and Biological Monitoring
5/29/2019 Skype Hydrology and HSPF
6/10/2019 Webex USACE
8/21/2019 Phone Draft Report Check-in
9/12/2019 Skype Draft Report Check-in
12/3/2019 Brainerd MPCA Discuss Draft Comments
9.2 Public Participation
The MPCA along with the local partners and agencies recognize the importance of public involvement in
the watershed process. The opportunities used to engage the public and targeted stakeholders in the
watershed are outlined below:
A meeting with affected MS4s and SWCDs within the TMDL Study Area was held with Agency
staff on December 3, 2019, to discuss the TSS impairment and TMDL MS4 Permit Requirements,
Stormwater BMPs, and Resources.
A public meeting was held via Webex on August 18, 2020 to present the draft TMDL report and
allocations and receive public comments and concerns at the start of public notice.
10. Literature cited Hart, Irving, 1952. “Steamboating on Mississippi Headwaters.” Minnesota History Magazine, Spring
1952.
Heiskary, Steven; Bouchard, W.R.; Markus, H., 2013. Minnesota Nutrient Criteria Development for Rivers.
Draft, January 2013. Minnesota Pollution Control Agency , wq-s6-08.
Holden, J., P.J. Chapman, and J.C. Labadz. 2004. Artificial drainage of peatlands: hydrological and
hydrochemical process and wetland restoration. Progress in Physical Geography 28(1): 95-123.
Markus, Howard D., 2011. Aquatic Life Water Quality Standards Draft Technical Support Document for
Total Suspended Solids (Turbidity), Triennial Water Quality Standard Amendments to Minn R.
chs. 7050 and 7052., Minnesota Pollution Control Agency (MPCA).
https://www.pca.state.mn.us/sites/default/files/wq-s6-11.pdf
Minnesota Geological Survey (MGS), 2004. Crow Wing County Geologic Atlas, PART A Plate 3—Surficial Geology: https://conservancy.umn.edu/bitstream/handle/11299/58716/plate3%5b1%5d.pdf?sequence=6&isAllowed=y.

Upper Mississippi River TSS TMDL Report Minnesota Pollution Control Agency
69
Minnesota Pollution Control Agency (MPCA), 2011. Big Sandy Lake and Lake Minnewawa Total Maximum Daily Report: https://www.pca.state.mn.us/sites/default/files/wq-iw8-24e.pdf
Minnesota Pollution Control Agency (MPCA), 2014a. Development of a Fish-Based Index of Biological
Integrity for Minnesota’s Rivers and Streams. Wq-bsm2-03.
https://www.pca.state.mn.us/sites/default/files/wq-bsm2-03.pdf
Minnesota Pollution Control Agency (MPCA), 2014b. Water Quality Trends for Minnesota Rivers and
Streams at Milestone Sites. Wq-s1-71. https://www.pca.state.mn.us/sites/default/files/wq-s1-
71.pdf
Minnesota Pollution Control Agency (MPCA). 2017. Upper Mississippi River: Monitoring and Assessment
Study Summary. wq-iw8-08ab. https://www.pca.state.mn.us/sites/default/files/wq-iw8-
08ab.pdf.
Minnesota Pollution Control Agency (MPCA), 2019a. Mississippi River – Grand Rapids Stressor
Identification Report. wq-ws5-07010103a. https://www.pca.state.mn.us/sites/default/files/wq-
ws5-07010103a.pdf
Minnesota Pollution Control Agency (MPCA), 2019b. Mississippi River – Grand Rapids Watershed Total
Maximum Daily Load (TMDL) Study. wq-iw8-58e.
https://www.pca.state.mn.us/sites/default/files/wq-iw8-58e.pdf
Minnesota Pollution Control Agency (MPCA). Under Review a. Mississippi River – Brainerd Watershed
Total Maximum Daily Load (TMDL) Study.
PRISM Climate Group, Oregon State University, http://prism.oregonstate.edu, created 4 Feb 2004.
RESPEC, 2015. Hydrologic and Water Quality Calibration for the Pine River, Leech Lake River, Mississippi
River Headwaters, Mississippi River-Grand Rapids, Mississippi River-Brainerd, Mississippi River-
Sartell Watersheds, Mississippi River-St. Cloud and Rum River HSPF Models. Prepared for
Minnesota Pollution Control Agency by RESPEC, St. Paul, Minnesota.
https://www.pca.state.mn.us/sites/default/files/wq-ws1-18.pdf
Tetra Tech, 2018. Mississippi River – Grand Rapids HSPF Model Recalibration. Prepared for Minnesota
Pollution Control Agency by Tetra Tech, Research Triangle Park, NC.
https://www.pca.state.mn.us/sites/default/files/wq-iw8-58n.pdf
Tetra Tech, 2018. Mississippi River – Brainerd HSPF Model Recalibration. Prepared for Minnesota Pollution Control Agency by Tetra Tech, Research Triangle Park, NC. Project Number 100-IWM-T36278.13
U.S. Army Corps of Engineers, 2016. Mississippi River Headwaters Reservoirs Master Plan Aitkin, Cass, Crow Wing, and Itasca Counties, Minnesota Main Report. 2016. Saint Paul, Minnesota: U.S. Army Corps of Engineers. https://www.mvp.usace.army.mil/Portals/57/docs/Environmental/EA/Mississippi%20River%20Headwaters%20Master%20Plan.pdf?ver=2016-10-11-163650-150