Characterization of Turbidity and Total Suspended Solids...
61
Characterization of Turbidity and Total Suspended Solids in the Upper Carson River, Nevada Richard B. Susfalk Brian Fitzgerald Anna M. Knust January 2008 DHS Publication No. 41242 prepared by Desert Research Institute, Nevada System of Higher Education prepared for Nevada Division of Environmental Protection in fulfillment of Contract Award #DEP 04-039
Transcript of Characterization of Turbidity and Total Suspended Solids...

Characterization of Turbidity and Total Suspended Solids in the Upper Carson River, Nevada Richard B. Susfalk Brian Fitzgerald Anna M. Knust
January 2008
DHS Publication No. 41242
prepared by
Desert Research Institute, Nevada System of Higher Education
prepared for
Nevada Division of Environmental Protection in fulfillment of Contract Award #DEP 04-039

THIS PAGE INTENTIONALLY LEFT BLANK
Characterization of Turbidity and Total Suspended Solids in the Upper Carson River, Nevada Richard B. Susfalk Brian Fitzgerald Anna M. Knust
January 2008
DHS Publication No. 41242
prepared by Desert Research Institute, Nevada System of Higher Education
prepared for
Nevada Division of Environmental Protection in fulfillment of Contract Award #DEP 04-039

THIS PAGE INTENTIONALLY LEFT BLANK

iii
ABSTRACT The Upper Carson River in Nevada has been listed as an impaired water body for
turbidity and total suspended solids (TSS). Existing data have been useful in identifying turbidity levels and TSS concentrations that exceed Nevada state standards, but additional data are needed to adequately characterize changes in TSS and turbidity that occur seasonally and in response to specific hydrologic events. A greater understanding of suspended solids processes can benefit basin managers in the creation of science-based standards, as well as researchers and managers concerned with the impact that elevated suspended solids may have on water quality and the aquatic ecosystem.
The level of suspended solids in rivers changes rapidly and unpredictably with changing water depths and velocities, requiring a large number of water quality samples to adequately characterize the inherent temporal variability. An alternative approach is the use of turbidity measurements as a surrogate for TSS concentrations. Both techniques provide a measure of suspended solids levels in the river, but turbidity measurements having the benefit of automated sampling. Once turbidity levels have been calibrated with manually collected TSS measurements, TSS concentrations and loads can be estimated on a near-continuous basis.
Turbidity was measured at 15-minute intervals from March 2004 through October 2006 at four sites along the Upper Carson River: Diamond Valley on the west fork, Riverview on the east fork, Genoa Lakes on the main stem, and downstream of the New Empire Bridge in the Carson Canyon. Site-specific relationships were developed between in-stream turbidity and discrete water samples collected for TSS analysis, achieving correlation coefficients of greater than 0.86 at all sites except for Diamond Valley. Additional relationships were developed using water discharge as a TSS surrogate to estimate historic turbidity levels and TSS concentrations from water year (WY) 1995 through WY2006. Using turbidity as a surrogate is preferred, as discharge-based estimates had lower correlation coefficients, and typically under-predicted turbidity-based estimates during the period of observation. This was due to the inability of discharge-based surrogates to account for the highly dynamic changes and hysteresis observed in TSS and turbidity during hydrologic events.
Nevada’s current turbidity and TSS thresholds are not linked: the turbidity thresholds were found to be more restrictive at all sites. Turbidity thresholds were exceeded from 14 to 68 percent of the time, compared to TSS thresholds that were exceeded from 7 to 13 percent of the time during the period of observation. When the Nevada TSS standard was exceeded during the period of observation, the maximum duration of the event ranged from 12 days at Diamond Valley up to 30 days at Brunswick Canyon Road in the Carson Canyon. In comparison, the maximum duration of historic exceedance events was about 80 days at both sites, but there were fewer exceedance events per year during the historic period.
Estimated historical TSS loads were highly variable. The highest loads were estimated for WY1997 due to the 1997 New Year’s Flood, ranging from 1,137 ± 987 x 105 kg/yr at Riverview to 1,617 ± 499 x105 kg/yr at Brunswick Canyon Road. The lowest estimated loads were during the drought year of 2001, ranging from 61 ± 207 x105 kg/yr to 60 ± 75 x105 kg/yr at Riverview and Brunswick Canyon, respectively.

THIS PAGE INTENTIONALLY LEFT BLANK
v
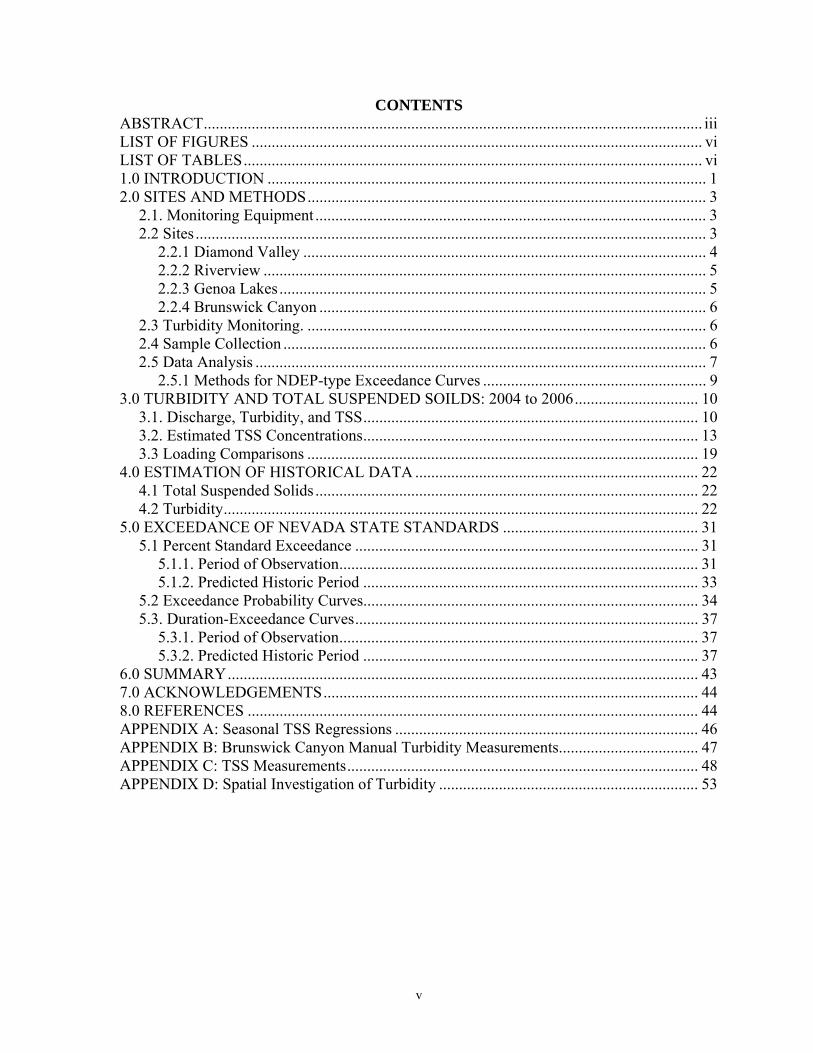
CONTENTS ABSTRACT............................................................................................................................. iii LIST OF FIGURES ................................................................................................................. vi LIST OF TABLES................................................................................................................... vi 1.0 INTRODUCTION .............................................................................................................. 1 2.0 SITES AND METHODS.................................................................................................... 3
2.1. Monitoring Equipment .................................................................................................. 3 2.2 Sites ................................................................................................................................ 3
2.2.1 Diamond Valley ..................................................................................................... 4 2.2.2 Riverview ............................................................................................................... 5 2.2.3 Genoa Lakes........................................................................................................... 5 2.2.4 Brunswick Canyon ................................................................................................. 6
2.3 Turbidity Monitoring. .................................................................................................... 6 2.4 Sample Collection .......................................................................................................... 6 2.5 Data Analysis ................................................................................................................. 7
2.5.1 Methods for NDEP-type Exceedance Curves ........................................................ 9 3.0 TURBIDITY AND TOTAL SUSPENDED SOILDS: 2004 to 2006............................... 10
3.1. Discharge, Turbidity, and TSS.................................................................................... 10 3.2. Estimated TSS Concentrations.................................................................................... 13 3.3 Loading Comparisons .................................................................................................. 19
4.0 ESTIMATION OF HISTORICAL DATA ....................................................................... 22 4.1 Total Suspended Solids ................................................................................................ 22 4.2 Turbidity....................................................................................................................... 22
5.0 EXCEEDANCE OF NEVADA STATE STANDARDS ................................................. 31 5.1 Percent Standard Exceedance ...................................................................................... 31
5.1.1. Period of Observation.......................................................................................... 31 5.1.2. Predicted Historic Period .................................................................................... 33
5.2 Exceedance Probability Curves.................................................................................... 34 5.3. Duration-Exceedance Curves...................................................................................... 37
5.3.1. Period of Observation.......................................................................................... 37 5.3.2. Predicted Historic Period .................................................................................... 37
6.0 SUMMARY...................................................................................................................... 43 7.0 ACKNOWLEDGEMENTS.............................................................................................. 44 8.0 REFERENCES ................................................................................................................. 44 APPENDIX A: Seasonal TSS Regressions ............................................................................ 46 APPENDIX B: Brunswick Canyon Manual Turbidity Measurements................................... 47 APPENDIX C: TSS Measurements........................................................................................ 48 APPENDIX D: Spatial Investigation of Turbidity ................................................................. 53
vi
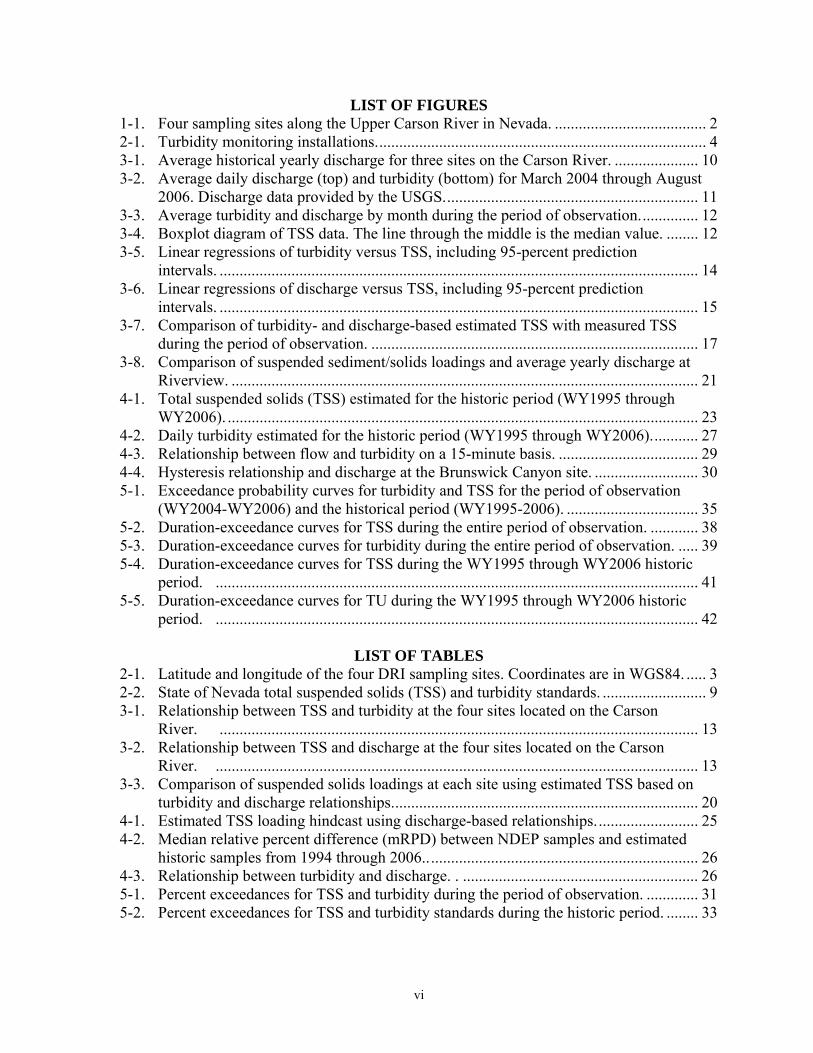
LIST OF FIGURES 1-1. Four sampling sites along the Upper Carson River in Nevada. ...................................... 2 2-1. Turbidity monitoring installations................................................................................... 4 3-1. Average historical yearly discharge for three sites on the Carson River. ..................... 10 3-2. Average daily discharge (top) and turbidity (bottom) for March 2004 through August
2006. Discharge data provided by the USGS................................................................ 11 3-3. Average turbidity and discharge by month during the period of observation............... 12 3-4. Boxplot diagram of TSS data. The line through the middle is the median value. ........ 12 3-5. Linear regressions of turbidity versus TSS, including 95-percent prediction
intervals. ........................................................................................................................ 14 3-6. Linear regressions of discharge versus TSS, including 95-percent prediction
intervals. ........................................................................................................................ 15 3-7. Comparison of turbidity- and discharge-based estimated TSS with measured TSS
during the period of observation. .................................................................................. 17 3-8. Comparison of suspended sediment/solids loadings and average yearly discharge at
Riverview. ..................................................................................................................... 21 4-1. Total suspended solids (TSS) estimated for the historic period (WY1995 through
WY2006). ...................................................................................................................... 23 4-2. Daily turbidity estimated for the historic period (WY1995 through WY2006)............ 27 4-3. Relationship between flow and turbidity on a 15-minute basis. ................................... 29 4-4. Hysteresis relationship and discharge at the Brunswick Canyon site. .......................... 30 5-1. Exceedance probability curves for turbidity and TSS for the period of observation
(WY2004-WY2006) and the historical period (WY1995-2006). ................................. 35 5-2. Duration-exceedance curves for TSS during the entire period of observation. ............ 38 5-3. Duration-exceedance curves for turbidity during the entire period of observation. ..... 39 5-4. Duration-exceedance curves for TSS during the WY1995 through WY2006 historic
period. ......................................................................................................................... 41 5-5. Duration-exceedance curves for TU during the WY1995 through WY2006 historic
period. ......................................................................................................................... 42
LIST OF TABLES 2-1. Latitude and longitude of the four DRI sampling sites. Coordinates are in WGS84. ..... 3 2-2. State of Nevada total suspended solids (TSS) and turbidity standards. .......................... 9 3-1. Relationship between TSS and turbidity at the four sites located on the Carson
River. ........................................................................................................................ 13 3-2. Relationship between TSS and discharge at the four sites located on the Carson
River. ......................................................................................................................... 13 3-3. Comparison of suspended solids loadings at each site using estimated TSS based on
turbidity and discharge relationships............................................................................. 20 4-1. Estimated TSS loading hindcast using discharge-based relationships.......................... 25 4-2. Median relative percent difference (mRPD) between NDEP samples and estimated
historic samples from 1994 through 2006..................................................................... 26 4-3. Relationship between turbidity and discharge. . ........................................................... 26 5-1. Percent exceedances for TSS and turbidity during the period of observation. ............. 31 5-2. Percent exceedances for TSS and turbidity standards during the historic period. ........ 33
1
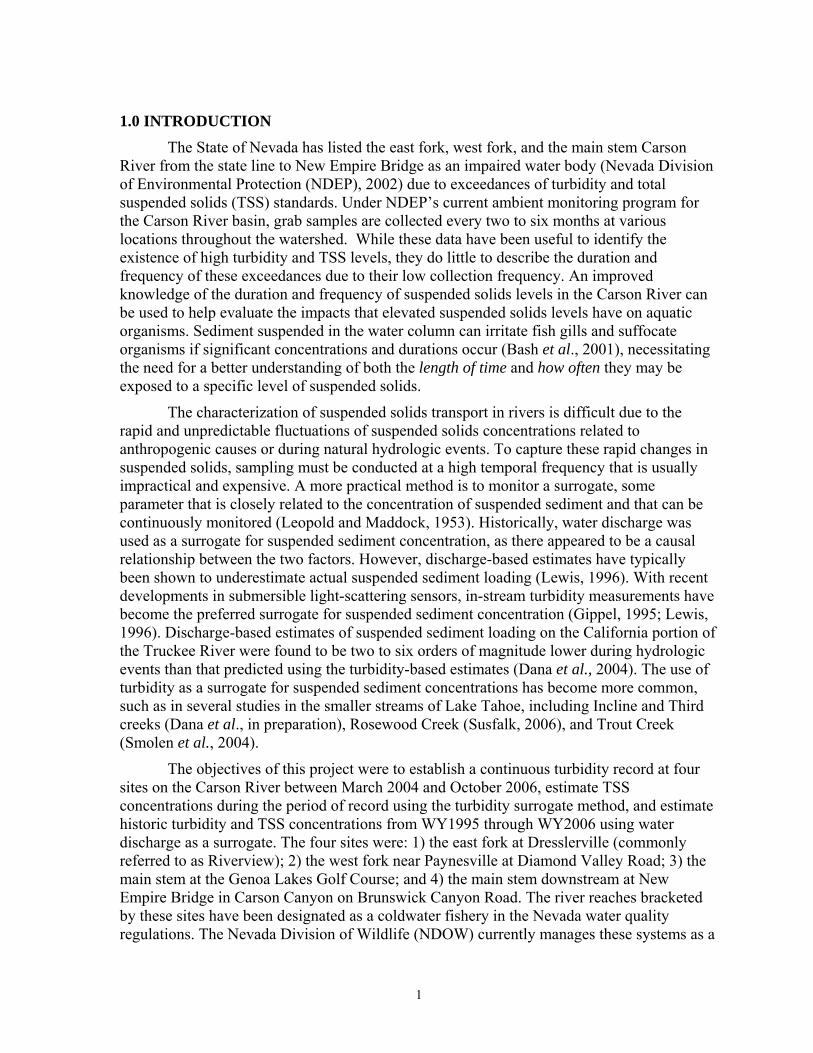
1.0 INTRODUCTION The State of Nevada has listed the east fork, west fork, and the main stem Carson
River from the state line to New Empire Bridge as an impaired water body (Nevada Division of Environmental Protection (NDEP), 2002) due to exceedances of turbidity and total suspended solids (TSS) standards. Under NDEP’s current ambient monitoring program for the Carson River basin, grab samples are collected every two to six months at various locations throughout the watershed. While these data have been useful to identify the existence of high turbidity and TSS levels, they do little to describe the duration and frequency of these exceedances due to their low collection frequency. An improved knowledge of the duration and frequency of suspended solids levels in the Carson River can be used to help evaluate the impacts that elevated suspended solids levels have on aquatic organisms. Sediment suspended in the water column can irritate fish gills and suffocate organisms if significant concentrations and durations occur (Bash et al., 2001), necessitating the need for a better understanding of both the length of time and how often they may be exposed to a specific level of suspended solids.
The characterization of suspended solids transport in rivers is difficult due to the rapid and unpredictable fluctuations of suspended solids concentrations related to anthropogenic causes or during natural hydrologic events. To capture these rapid changes in suspended solids, sampling must be conducted at a high temporal frequency that is usually impractical and expensive. A more practical method is to monitor a surrogate, some parameter that is closely related to the concentration of suspended sediment and that can be continuously monitored (Leopold and Maddock, 1953). Historically, water discharge was used as a surrogate for suspended sediment concentration, as there appeared to be a causal relationship between the two factors. However, discharge-based estimates have typically been shown to underestimate actual suspended sediment loading (Lewis, 1996). With recent developments in submersible light-scattering sensors, in-stream turbidity measurements have become the preferred surrogate for suspended sediment concentration (Gippel, 1995; Lewis, 1996). Discharge-based estimates of suspended sediment loading on the California portion of the Truckee River were found to be two to six orders of magnitude lower during hydrologic events than that predicted using the turbidity-based estimates (Dana et al., 2004). The use of turbidity as a surrogate for suspended sediment concentrations has become more common, such as in several studies in the smaller streams of Lake Tahoe, including Incline and Third creeks (Dana et al., in preparation), Rosewood Creek (Susfalk, 2006), and Trout Creek (Smolen et al., 2004).
The objectives of this project were to establish a continuous turbidity record at four sites on the Carson River between March 2004 and October 2006, estimate TSS concentrations during the period of record using the turbidity surrogate method, and estimate historic turbidity and TSS concentrations from WY1995 through WY2006 using water discharge as a surrogate. The four sites were: 1) the east fork at Dresslerville (commonly referred to as Riverview); 2) the west fork near Paynesville at Diamond Valley Road; 3) the main stem at the Genoa Lakes Golf Course; and 4) the main stem downstream at New Empire Bridge in Carson Canyon on Brunswick Canyon Road. The river reaches bracketed by these sites have been designated as a coldwater fishery in the Nevada water quality regulations. The Nevada Division of Wildlife (NDOW) currently manages these systems as a

2
coldwater, put-and-take fishery; however, this management concept was adopted when there was less natural opportunity for fish to reproduce. High turbidity may be one of the environmental conditions negatively influencing trout survival and the historically poor populations of wild salmonid.
Figure 1-1. Four sampling sites along the Upper Carson River in Nevada.

3
2.0 SITES AND METHODS
2.1. Monitoring Equipment To estimate continuous TSS levels in the Carson River, turbidimeters were installed
at four sites. Turbidity is a specific class of scattering measurements expressed in nephelometric turbidity units (NTU). The NTU is based on an empirical relationship to standard concentrations of formazin in water. These formazin standards are homogeneous and repeatable for a given concentration. However, natural water samples are typically comprised of particles having many different shapes and sizes, particles of both organic and inorganic composition, and contain other compounds that may absorb light. Turbidity sensors can employ a variety of different techniques, each with a different sensitivity to the aforementioned factors, resulting in the same water sample having two different turbidities on two different instruments that have been correctly calibrated with formazin. For these reasons, relationships between turbidity and TSS are both site and sensor specific. A further discussion of turbidity and other measurements of optical properties can be found in Taylor et al. (2004).
Each of the four sites was equipped with an in-stream turbidimeter (DTS-12, FTS Inc., Victoria, BC, Canada) and a conductivity/water temperature sensor (CS547A, Campbell Scientific, Logan, UT). Data from these sensors were collected every 15-minutes by a datalogger (CR10X, Campbell Scientific) that was powered by a 10-watt solar panel.
Sensors were suspended within a four-inch-diameter PVC tube with staggered holes cut in it to allow water to pass. This PVC housing boom was secured to the bridge with a two-dimensional gimble mount. The mount allowed the sensor end of the PVC boom to “swim” in the river currents. The design also allowed the boom to float up and out of the way, or self-clean, in the case of large river debris. Smaller river debris that was caught in the openings of the PVC required manual cleaning either by wading into the water, or raising the lower end of the boom up to the bridge so it can be accessed.
2.2 Sites The two upstream sites were located near the California-Nevada border, at Diamond
Valley on the west fork and at Riverview on the east fork (Table 2-1, Figure 2-1). The Genoa Lakes site was on the main stem of the river just below the confluence of the two forks. The fourth site was near the lower end of the Upper Carson River, on Brunswick Canyon Road near the entrance to Carson Canyon.
Table 2-1. Latitude and longitude of the four DRI sampling sites. Coordinates are in WGS84.
DRI Sampling Sites Sampling
Start Sampling
End Latitude Longitude Diamond Valley (DV) 3/5/2004 9/30/2006 38.80869000 -119.77719600 Riverview (RV) 5/6/2004 9/30/2006 38.87601900 -119.68985000 Genoa Lakes (GL) 3/25/2004 9/30/2006 39.01108000 -119.82860300 Brunswick Canyon (BC) 3/8/2004 9/30/2006 39.17574200 -119.68899800

4
Figure 2-1. Turbidity monitoring installations.
2.2.1 Diamond Valley
The Diamond Valley site was located on the Alpine County Bridge at Diamond Valley Road, 0.45 miles downstream of U.S. Geological Survey (USGS) gaging station number 10310000. The bridge railing was approximately 15 feet above seasonal water levels,
Riverview
Brunswick
Genoa Lakes
Diamond Valley
5
on average. The width of the west fork at this location was approximately 40 feet. The bridge stanchions constrict the river at higher flows.
Due to obstructions on the downstream side of the bridge, the monitoring boom was installed on the upstream side of the bridge. The ability of the boom to move upward was constricted by the bridge deck during flows close to flood stage. This resulted in the sensors being submerged deeper in the water column and prevented the boom from self-cleaning under these conditions. Turbidity readings we not affected as the turbidity sensor remained in the top 20% of the water column.
The higher water velocities characteristic of this site tended to produce turbulence and cavitation that introduced noise into the turbidity measurements. This noise produced high, random turbidity values that were filtered out during the data workup process. The excessive turbulence also loosened the detachable vacuum-sealed connector socket on the turbidity sensor that occasionally broke the electrical communication to the datalogger and resulted in the intermittent failure of the turbidimeter under high water conditions. After several attempts to address the issue spanning multiple years, the issue was finally resolved by immobilizing the cable above the socket within a small, protective tube.
2.2.2 Riverview
The Riverview site was located on the Dresslerville Bridge that spanned the east fork of the Carson River. The bridge was approximately 3.3 miles downstream of USGS gaging station number 10309000. Strong water velocities at this wide and shallow river section caused the lower end of the boom to float further downstream than at the other sites, resulting in the sensor being too near the water surface to take consistent measurements. The high water velocities also caused turbulence within the boom to a greater extent than at Diamond Valley. Both issues were somewhat mitigated by the addition of a 15-pound brass weight that was added to the lower end of the boom. As with Diamond Valley, the vibration and turbulence of the water caused the socket part of the electrical connection to enlarge and loosen the electrical contact between the cable and sensor. The other downstream sites were not susceptible to this due to their considerably lower water velocities.
2.2.3 Genoa Lakes
The Genoa Lakes site was located on the main stem of the Carson River just below the confluence of the east and west forks on the Genoa Lakes golf course. This site was approximately 23 miles downstream of Diamond Valley and 14 miles downstream of Riverview. It was co-located with the USGS gaging station number 10310407. The river was as little as 20 feet wide and several inches deep during the summer agriculture season or as much as 100 feet wide and a few feet deep at high flow. Flows were generally too low in the late summer to support measurements, requiring the removal of the sensors to prevent damage. The height from the water surface to the top of the bridge railing, where the cable and reel sampler were placed, ranged from 25 to 40 feet. As discharge data were available at this site beginning in 2002, data from a downstream USGS gaging station (10311000) were used for historical estimates prior to 2002.

6
2.2.4 Brunswick Canyon
The lower-most site was approximately 20 river miles downstream of Genoa Lakes and was the lower endpoint of the Upper Carson River in Nevada. The USGS gaging station number 10311400 was located at Deer Run Road, while the DRI sampling site was 0.83 miles further downstream off of Brunswick Canyon Road. The width of the river here was approximately 120 feet, with consistently laminar flow with low water velocities. The height of the bridge ranged from 20 to 26 feet above the water surface. Uniform depth-width sampling across the river could not be safely done off this decrepit bridge, requiring the establishment of only four sampling sites across approximately 65 percent of the river. Due to potential vandalism at this site, a stainless steel shroud was placed at the top of the monitoring boom to prevent access to the boom. The datalogger was hidden below the bridge and covered by a 1/4-inch-thick steel plate. During the project, the boom was commonly hit by paintballs and was also shot by a rifle that cleanly broke off the bottom 6 feet of the boom. The sensors were not damaged, and the missing section of boom was replaced within 10 days of being broken off. The solar panel was stolen once, and the four custom-built bridge board/safety railings were destroyed, requiring that water quality sampling was conducted from the bridge surface thereafter.
2.3 Turbidity Monitoring. Continuous turbidity measurements were taken in situ every 15 minutes by the
turbidity meter and stored on the datalogger. These data were collected on regular trips to each site for maintenance and sample collection. Despite having wipers that cleaned the face of the sensor before each measurement, the turbidimeters also required routine, manual cleaning. This was accomplished by pulling the instrument cluster out the top of the boom and by raising the boom to the bridge to remove debris stuck to the boom.
Turbidity sensors were calibrated prior to their installation, and checked for calibration drift several times while deployed and when they were removed from the field either for maintenance or at the end of the project. The DTS-12 turbidity sensors were chosen for this project due to their history of producing low-noise measurements that are not susceptible to sensor drift, which was confirmed by our calibration checks. At the outset of the project, a smaller, portable boom termed the ‘mini-boom’ was constructed and placed next to the sensor boom sequentially at each site. This method of quality assurance was abandoned after several months as the mini-boom was difficult to control and did not exactly reproduce the interior conditions within the sensor booms due to the higher water velocities at Diamond Valley and Riverview. In higher water velocities, the presence of the mini-boom immediately adjacent to the main sensor boom affected the readings of both sensors. In addition, the mini-boom tended to swim around and have greater water turbulence within the boom as it was not moored directly to the bridge as the standard booms were. As a result, composite samples were collected and analyzed for turbidity in the laboratory with a Hach 2100 turbidimeter to check for the possibility for sensor drift or biofouling.
2.4 Sample Collection Water samples for TSS analysis were collected at each site following equal-width
integrated sampling techniques (Edwards and Glysson, 1998, Shelton, 1994). Water samples were collected using a US D-76 sampler (Rickly Hydrological Co.) and a bridgeboard outfitted with a hand winch (Model 4200 bridgeboard and A-55 winch, Rickly Hydrological

7
Co.). Depth-integrated samples were taken at between 4 and 12 stations across the channel depending on the width of the river. All samples for a given site were combined in a churn splitter to produce a single representative sample.
During the first year of sampling, TSS samples were collected during every visit to each site, resulting in an average of 35 samples per site. Sites were visited approximately every two to three weeks, with more frequent visits during the snowmelt season. As the hydrograph and seasonal suspended solids loads were thought to be dominated by snowmelt-derived flows, resources were not consistently devoted to sampling during rain events. Following the first year of monitoring, the data were evaluated to determine the appropriate number and turbidity range of samples needed to establish adequate TSS versus turbidity relationships. This was done to minimize costs, and reduce the number of samples collected that were below the TSS reporting limit. After collection, samples were delivered to the Nevada State Health Laboratory for TSS analysis (EPA Method 160.2), generally within 24 hours. The Nevada State Health Laboratory had a TSS reporting limit of 10 mg/L.
2.5 Data Analysis Fifteen-minute turbidity and specific conductance (SC) data were assessed utilizing
the Turbidity Threshold Sampling Adjuster (TTS Adjuster) program (Redwood Sciences Laboratory, U.S. Forest Service, Arcata, CA). The TTS Adjuster provided an efficient means to compile and manipulate raw data files. The program created yearly files of corrected stage, discharge, turbidity, and SC data, and allowed the user to graphically view and adjust obvious problems in the data. Obvious problems included the fouling of the turbidity sensor optics by debris caught in the monitoring boom, and excessive noise in the turbidity readings due to higher water velocities that caused turbulence and air bubbles in the boom and/or the boom “surfing” near the water surface. A feature of the DTS-12 turbidity sensor was a variance number reported alongside the turbidity to help determine if a reading was valid. Record adjustment methods provided by the TTS Adjuster included interpolation, variable and constant shifts, and reconstruction of data from nearby reference gaging stations. Reconstruction of data was needed when there was a period of sustained data loss, particularly at Riverview and Diamond Valley. For example, correlations between turbidity and discharge at both the Riverview and Genoa Lakes sites would be made on both sides of any missing data. These correlations would then be used to reconstruct data at Riverview based on data collected at Genoa Lakes. As the stage and turbidity data were accepted or corrected, the TTS Adjuster tagged the data to reflect the type of changes that were made.
The majority of the turbidity data was of good quality, as turbidity readings generally had a low variability (not reported). The DTS-12 reported both the Best Easy Systematic (BES) turbidity estimate and the variance of 100 measurements taken in 10 seconds. The BES estimate was determined by sorting the 100 readings by value and averaging the 24th, 50th, 51st, and 76th readings. This produced a turbidity estimate that was influenced by the range of readings, but was not affected by unusual readings at either end of the data range. The accuracy of the DTS-12 sensor was 2 percent at less than 500 NTU and 4 percent at equal to or greater than 500 NTU. The quality of the data was lower when debris blocked the sensor face, or when air bubbles were present due to the combination of high water velocities traveling through the boom and the placement of the turbidity sensor near the surface.
Relationships between TSS and turbidity, TSS and discharge, and turbidity and discharge were determined from the data collected between 2004 and 2006. Unique

8
relationships and prediction intervals were developed for each of the four sampling sites using the linear model (lm) command of the statistical language R (http://www.r-project.org). The predict.lm command was used to compute the response variable values based on a previously developed linear model and to calculate prediction or confidence intervals.
Only values of TSS greater than zero were included for the TSS-to-turbidity and TSS-to-discharge relationships. For the TSS-to-discharge relationship, data were separated into rising (March through May), falling (June through July), and baseflow (August through February) groups based on the annual hydrograph. Turbidity-to-discharge relationships were developed using all data where turbidity was greater than zero. Linear, exponential, and log-log relationships were developed, but were not used, as they did not improve the regression coefficient enough to account for their increased complexity.
Errors introduced when deriving the estimated TSS regression models from turbidity or discharge were likely to be of a greater magnitude than that introduced by the measurement process, discussed above. Resources during this project were primarily devoted to sample collection related to seasonal snowmelt, as that was the typical defining feature of the Upper Carson River hydrograph. As a result, less confidence should be placed in TSS estimates during rain events, unless those events were specifically sampled. The error in predicting TSS from these methods can be reduced by: 1) increasing the number of TSS samples collected; 2) collecting a greater number of samples from both the rising and falling limbs of rain event hydrographs (e.g. “storm-chasing”), and; 3) utilizing seasonal or event-specific regressions rather than relationships developed from multi-year datasets. However, even with the significant added cost of implementing these suggestions, error will still be present due to the natural, variable dynamics (including hysteresis) in these environments.
Suspended solids loadings were calculated using both the TSS-to-turbidity and the TSS-to-discharge relationships. The suspended solid load (SSL) was calculated as the product of the TSS (mg L-1) and discharge Q (ft3 s-1) with a conversion factor, such that the resultant load was in kilograms
SSL = TSS(t)Q(t)dt0
T
∫
where concentration and discharge are continuous over time t. This equation can be approximated by the discrete sum
SSL = TSSii=1
T /δt
∑ Qiδt
with a fixed sampling interval that is shorter than the minimum time over which discharge or concentration can significantly change. Historical average daily discharge was obtained by the USGS NIWR website, accessed on July 17, 2007.
Duration-exceedance relationships were determined for measured turbidity and turbidity-based estimated TSS during the sampling period, and for discharge-based TSS and TSS-based turbidity estimated for the historic period. The duration of exceedance was determined by evaluating the TSS or TU value at each measurement. If the value was above the standard, one time unit was added to the exceedance duration. If the value was below the standard, the current duration was ended, and no new information was added to the dataset

9
until the standard was again exceeded. This dataset was then subdivided into seasonal datasets based on the month number. Durations during the period of observation that were calculated at 15-minute intervals were converted to days to facilitate comparison with the historic data.
The cumulative distribution function (CDF), F(x), describes the probability that X was less than a given value, P(X<x). In R, the empirical CDF was computed using the command ecdf. The inverse CDF, 1-F(x), describes the probability that X was greater than a given value. The ecdf function was modified to produce the inverse empirical CDF, to determine the probability of exceedance. The inverse CDF was calculated and plotted for the dataset describing exceedance duration for each site.
Table 2-2. State of Nevada total suspended solids (TSS) and turbidity standards.
(http://ndep.nv.gov/bwqp/standards.htm#NAC445a, Nevada Administrative Code, Chapter 445 - Water Controls, Standards for Water Quality, Legislative Council, State of Nevada, Carson City, Nevada, accessed 6-29-2007).
DRI Sampling Site NDEP Water Quality Site TSS Standard (mg/L)
Turbidity Standard (NTU)
Diamond Valley C8 West Fork at Paynesville 25 10 Riverview C9 East Fork at Riverview 80 10 Genoa C2 Main Stem at Cradlebaugh Bridge 80 10 Brunswick Canyon C1 Main Stem at New Empire Bridge 80 10
2.5.1 Methods for NDEP-type Exceedance Curves
To establish turbidity and TSS exceedance probability curves, all zero or negative values were converted to 0.001. This removed errors introduced by negative or zero values with the log scale, but retained these low values for analysis, such that the probability of exceedance of the lowest value is equal to 100 percent. The values were sorted and ranked, with equal values receiving the same rank. The percent rank (probability a given value will not be exceeded) was then calculated as
Prank =100 * mn
where m was the rank and n was the total number of data points. The probability that a given value was exceeded (exceedance probability) was subsequently calculated as 1-Prank.

10
3.0 TURBIDITY AND TOTAL SUSPENDED SOILDS: 2004 to 2006
3.1. Discharge, Turbidity, and TSS
Average yearly discharge during the three years studied ranged from below average in WY2004 to above average in WY2006 (Figure 3-1). Flows from the east fork (Riverview) contribute substantially to that of the main stem and were 74 percent of that observed downstream at Brunswick Canyon in 2004 and 2005. Flows from the west fork (Diamond Valley) were smaller, and were 43 percent of those at Brunswick Canyon. The contribution of both forks were lower in 2006, 26 percent at Diamond Valley and 43 percent at Riverveiw, indicating that other sources of water within the Carson Valley increased in importance during the higher water year of WY2006. The primary event that caused this shift was the 2006 New Year’s Flood, when total flows between 12/31/05 and 1/11/06 were 86 percent greater at Genoa Lakes on the main stem than the sum of total flows on the east and west forks measured at Riverview and Diamond Valley, respectively.
Average Yearly Discharge
0
200
400
600
800
1000
1200
1400
1891
1893
1902
1904
1906
1910
1927
1936
1940
1942
1944
1946
1948
1950
1952
1954
1956
1958
1960
1962
1964
1966
1968
1970
1972
1974
1976
1978
1980
1982
1984
1986
1988
1990
1992
1994
1996
1998
2000
2002
2004
2006
Date
Diamond ValleyRiverviewBrunswick CanyonDiamond Valley (1980-2006 Average)Riverview (1980-2006 Average)Brunswick Canyon (1980-2006 Average)
Figure 3-1. Average historical yearly discharge for three sites on the Carson River. Square points
represent the three years of data included in this study. The dashed lines represent the 1980 to 2006 average of yearly discharge. Data provided by the USGS.
Water year 2006 had the greatest average flows due to both the flood and an extended snowmelt season (Figure 3-2). These elevated flows caused significant elevations in turbidity. The highest turbidity levels observed were during the flood, with peak average daily turbidities exceeding 750 NTU at Riverview, Genoa Lakes, and Brunswick Canyon, and exceeding 190 NTU at Diamond Valley. Lower turbidities were observed during seasonal snowmelt at Riverview, peaking at 250 NTU in 2006 and at 715 NTU in 2005. Peak turbidity during the 2006 snowmelt season was lower than that observed during the 2005 season, despite similar peak flows. This was likely due to the prior transport of mobile suspended solids during the 2006 New Year’s Flood earlier in the year. In addition, the

11
source of easily transportable suspended solids from the upper watershed appeared to be quickly depleted in 2006, as turbidity levels dropped rapidly after the first surge of snowmelt.
Figure 3-2. Average daily discharge (top) and turbidity (bottom) for March 2004 through August
2006. Discharge data provided by the USGS.
On a monthly basis between 2004 to 2006, turbidity and discharge were most highly elevated in May, during the rising limb of the snowmelt hydrograph (Figure 3-3). The Riverview site was more productive, characterized by higher monthly turbidity levels at relatively lower discharges compared to Genoa Lakes and Brunswick Canyon. Turbidity was not as highly elevated in June during the falling limb of the snowmelt season. Both turbidity and discharge were somewhat elevated between December and April and neither were elevated during the lower flow months of August through November. December events were the most productive suspended solids producing events, generating higher turbidity values
12
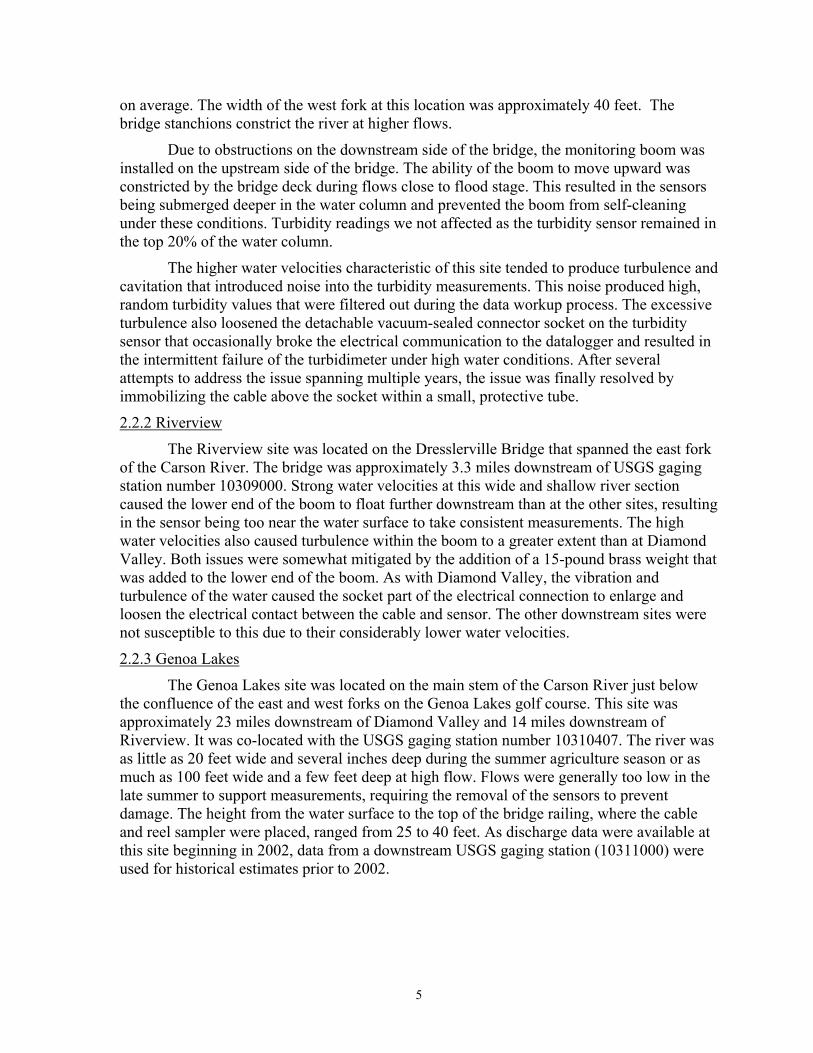
with lower average discharge. This is due to the fact that the 2006 New Year’s Flood actually started in December 2005.
Figure 3-3. Average turbidity and discharge by month during the period of observation.
Nearly 200 TSS samples were collected during the project (Figure 3-4 and Appendix C). Samples from Diamond Valley had consistently lower TSS than that observed at the other sites.
Figure 3-4. Boxplot diagram of TSS data. The line through the middle is the median value. The top
and bottom lines correspond to the 75th and 25th, respectively. The whiskers extend to the 10th percentile on the bottom and the 90th percentile on top. The box represent the arithmetic mean of the sample.

13
3.2. Estimated TSS Concentrations
Total suspended solids concentrations were estimated using either turbidity or discharge as a surrogate. Site-specific relationships were developed using linear regressions (Table 3-1 and Figure 3-5). The regression coefficients at all sites except that at Diamond Valley were high. The poor predictive ability at Diamond Valley was due to the high degree of variability in TSS samples collected in 2006, as well as a greater variability observed in the turbidity data throughout the study. One cause of this variability was the excessive noise in the turbidity readings due to the formation of air bubbles under high water velocity conditions.
Table 3-1. Relationship between TSS and turbidity at the four sites located on the Carson River.
Median relative percent difference (mRPD) and root mean square deviation (RMSD) are presented for each relationship utilizing data collected by DRI during the period of observation.
Site Relationship R2 mRPD RMSD Diamond Valley TSS = 0.6507⋅TU + 9.8241 0.49 42.4% 64.5 Riverview TSS = 1.5454⋅TU - 17.1623 0.99 35.3% 22.2 Genoa Lakes TSS = 1.5382⋅TU - 0.8424 0.96 13.6% 14.2 Brunswick Canyon TSS = 1.2853⋅TU + 12.8469 0.86 24.9% 27.2
As continuous turbidity data were not available prior to this study, relationships between TSS and discharge were also developed to “hind-cast” (estimate) historical TSS concentrations (Table 3-2 and Figure 3-6; see Section 4).
Table 3-2. Relationship between TSS and discharge at the four sites located on the Carson River.
Median relative percent difference (mRPD) and root mean square deviation (RMSD) are presented for each relationship utilizing data collected by DRI during the period of observation.
Site Relationship R2 mRPD RMSD Diamond Valley TSS = 0.0387⋅Q + 8.5338 0.40 53.3% 96.9 Riverview (Q <750 cfs) Ln(TSS) = 0.0012⋅Q + 2.3547 0.65 Riverview (Q ≥ 750 cfs) TSS = 0.13482⋅Q – 75.89554 0.50 72.6 93.5
Genoa Lakes TSS = 0.0663⋅Q - 1.5306 0.59 39.8% 44.6 Brunswick Canyon TSS = 0.0632⋅Q 0.89 23.1% 31.2

14
Figure 3-5. Linear regressions of turbidity versus TSS, including 95-percent prediction intervals.
Samples below the TSS reporting limit of 10 mg/L were omitted, including 11 samples at Diamond Valley, 7 samples at Riverview, 5 samples at Genoa Lakes, and 5 samples at Brunswick Canyon.

15
Figure 3-6. Linear regressions of discharge versus TSS, including 95-percent prediction intervals.
Samples below the TSS reporting limit of 10 mg/L were omitted, as discussed in Figure 3-5.
Common transformations and relationships were investigated in an attempt to improve each relationship. Quadratic relationships resulted in slightly higher regression coefficients at most sites. Seasonal regressions were also developed (Appendix A), and found to improve the regression coefficients in some cases. However, linear relationships are presented here, as the benefit from higher regression coefficients was not offset by the increased complexity introduced by the use of multiple and quadratic equations. Not all seasonal regression coefficients had improved correlation coefficients and the use of non-linear regression prevented the calculation of confidence intervals. At Riverview, both a linear and a natural log transformation are presented. Both regressions were developed using the entire data set. However, use of the linear form greatly overestimated TSS at low discharge, and the log transformed regression greatly overestimated TSS at high Q. A mixed model was developed utilizing the log transformation at discharge less than 750 cfs and the linear relationship at discharge equal to and greater than 750 cfs. The transition value of 750 cfs was chosen, as both forms estimated TSS to within 3 percent at this discharge. This mixed model produced estimates of yearly suspended solids loadings (see Section 3.3) that

16
were consistent with estimates generated by turbidity-based regressions in Table 3.1. Neither individual model produced acceptable loading estimates. At Brunswick Canyon, the linear relationship was forced through zero to prevent the consistent overprediction of TSS at low turbidity values.
Both the mRPD and RMSD indicated that turbidity-based surrogate regressions were a better model than discharge-based regressions. Between the two estimation methods, the discharge-surrogate method consistently underpredicted TSS concentrations during short-term events, such as thunderstorms, at all sites (Figure 3-7). This underprediction is typical of discharge-based surrogates, as they have difficulty accounting for dynamic changes in the production and mobilization of suspended solids (Lewis, 1996). For example, TSS concentrations will typically be lower in response to a slower increase in discharge due to snowmelt compared to a faster increase such as during a thunderstorm, given the same TSS loading. This is because the slower snowmelt event has a lower intensity and transports the suspended solids over a longer time period. In addition, the sampling of TSS was biased towards collections of more samples during snowmelt events, as that was the dominant feature of the hydrologic cycle in the Upper Carson Watershed. This resulted in the discharge-based surrogate regression to under predict TSS loads during rain and short-term events compared to the turbidity-based surrogate regressions.
Predictions at Genoa Lakes were characterized by having the lowest error of all four sites, a reflection of our better ability to measure turbidity at this site due to the lower water velocities. Turbidity sensors at both upstream sites were susceptible to poorer quality of readings due to high water velocities that created turbulence and air bubbles around the sensor.
The regression model for Diamond Valley produced the highest errors, with the turbidity surrogate producing slightly better mRPDs than the discharge surrogate. Both methods consistently overestimated baseflow TSS concentrations throughout the observed period (Figure 3-7). This baseline value of 9.7 mg/L observed in Figure 2-7A was actually just below the analytical laboratory's TSS reporting limit of 10 mg/L. For loading estimates, this overprediction of TSS was not important due to the water discharges during these time periods. Both methods underpredicted TSS concentrations during the 2005 snowmelt season, when compared with real samples. Neither turbidity nor discharge reflected an elevated TSS concentration measured on 3/14/05, while both methods only partially estimated peak TSS concentrations measured between 5/18/05 to 5/19/05. Excessively noisy turbidity data during parts of this time period resulted in the need to reconstruct turbidity data at Diamond Valley using both discharge at Diamond Valley and turbidity measured downstream at Genoa Lakes. This reconstructed data underestimated observed TSS data and increased the overall error of TSS estimates at Diamond Valley.

Figure 3-7. Comparison of turbidity- and discharge-based estimated TSS with measured TSS during the period of observation. Concentrations reported below the reporting limit are plotted here at half the 10 mg/L reporting limit.
17
Diamond Valley
0
20
40
60
80
100
120
140TS
S (m
g/L)
measured TSS (DRI)Turbidity SurrogateDischarge Surrogate
Riverview
0
100
200
300
400
500
600
Date
measured TSS (DRI)Turbidity SurrogateDischarge Surrogate
(6029 mg/L)(1090 mg/L)

Figure 3-7. Comparison of turbidity- and discharge-based estimated TSS with measured TSS during the period of observation. Concentrations reported below the reporting limit are plotted here at half the 10 mg/L reporting limit (continued).
18
Genoa Lakes
0
100
200
300
400
500
600
TSS
(mg/
L)
measured TSS (DRI)Turbidity SurrogateDischarge Surrogate
Brunswick Canyon
0
100
200
300
400
500
600
Mar-04 Jun-04 Sep-04 Dec-04 Apr-05 Jul-05 Oct-05 Jan-06 May-06 Aug-06Date
measured TSS (DRI)Turbidity SurrogateDischarge Surrogate
(1147 mg/L)
(723 mg/L) (1162 mg/L)

19
Predictions for Riverview and Brunswick Canyon had moderate error, with mRPDs of 35 percent and 23 percent, respectively. Baseline estimates of TSS at Riverview were elevated for the discharge-surrogate but not for the turbidity-surrogate. At Brunswick Canyon, both estimation techniques had similar errors and regression coefficients, suggesting that the underlying cause of suspended solids mobilization (e.g., thunderstorm or snowmelt) was not as important at this site. This was due to two factors. The most important factor was that the majority of the flow in the Carson River was derived from the Carson Valley and the Upper Carson River in California, so the upstream sites at Diamond Valley, Riverview, and Genoa Lakes would be more reflective of how the suspended solids were mobilized. The Brunswick Canyon site was another 20 miles downstream, allowing in-river processes to mask the signature of suspended solids mobilization. To a lesser degree, anthropogenic influences may also have played a role. The presence of Mexican Dam above Brunswick Canyon will attenuate the loading of suspended solids at Brunswick Canyon to some extent. The source of suspended solids can also be masked by the contribution of urban runoff starting from the Clear Creek drainage downstream to Brunswick Canyon, including that from the Carson City storm water system.
3.3 Loading Comparisons
Yearly suspended solids loading estimates were calculated at all sites using both turbidity- and discharge-based TSS estimates (Table 3-3). Estimated loads followed the trend in average yearly discharge, with the lowest loads in WY2004 and the highest loads observed in WY2006. The east fork was the source of the majority of the suspended solids load entering the main stem of the river, as turbidity-based loadings at Riverview ranged from 4 to 22 times greater than that observed at Diamond Valley. As a result, loadings estimated for Genoa Lakes were similar to that at Riverview. Suspended solids loading from the west fork was less susceptible to the weather patterns that increased east fork loading 18-fold between WY2004 and WY2006. As a result, loading from the west fork became increasingly unimportant to the loads observed at Genoa Lakes as average yearly discharge increased. At Brunswick Canyon, suspended solids loads were 48 percent to 61 percent greater than those at Genoa Lakes, reflective of the greater source area lower in the watershed.
Discharge-based loads were, on average, lower than the corresponding turbidity-based loads. Loadings estimated for Riverview and Brunswick Canyon using both methods were within 20 percent for all three years, but agreement between the two methods was much lower at Genoa Lakes and Diamond Valley. At Genoa Lakes, the discharge-based loadings were up to 34 percent lower, indicative of poor load estimations under high discharge conditions. At Diamond Valley, the discharge-based loadings were 4 to 17 times greater than the corresponding turbidity-based estimate, indicating that the model was significantly over- predicting suspended solids delivery. The discharge-based estimates were also characterized by greater prediction intervals (Figures 3-5 and 3-6), resulting in greater uncertainty than that estimated by turbidity-based models. Errors were greater in years characterized by intense events that generated higher TSS compared to years that had lower peak TSS but for a greater duration.

20
Table 3-3. Comparison of suspended solids loadings at each site using estimated TSS based on turbidity and discharge relationships. For 2004, the “Partial” load estimate only includes data that were observed. The “Estimated” load includes load estimates during the first part of the water year prior to the initiation of monitoring. The periods of missing data were between 10/1/04 and: 1) 3/8/05 for Brunswick Canyon (BC); 2) 3/5/05 for Diamond Valley (DV); 3) 3/25/05 for Genoa Lakes (GL); and 4) 5/6/05 for Riverview (RV). For the turbidity-based estimate, missing data were estimated by substituting daily average WY2005 data for missing WY2004 data. For the discharge-based estimate, estimated TSS was calculated using the regressions in Table 3-2. Loads were calculated using fifteen-minute interval USGS discharge data.
WY2004 WY2005 WY2006 Partial Estimated Site Suspend Solids Load (1x10⁵ kg)
Turbidity-based DV 10 ± 11 11 ± 13 22 ± 21 35 ± 30 RV 26 ± 96 41 ± 156 468 ± 150 759 ± 637 GL 34 ± 32 50 ± 53 479 ± 131 722 ± 194 BC 67 ± 9 81 ± 29 443 ± 229 1072 ± 37
Discharge-based DV 8 ± 20 42 ± 32 27 ± 50 36 ± 68 RV 27 ± 77 49 ± 79 421 ± 233 766 ± 146 GL 36 ± 97 48 ± 113 317 ± 392 532 ± 530 BC 67 ± 71 85 ± 76 428 ± 221 884 ± 381
Overall, the similarity of loading estimates derived by both methods indicated that the use of a discharge-based surrogate was an acceptable approach, at least under the conditions observed at three of the four sites between WY2004 and WY2006. Total suspended solids estimates presented for Riverview in Table 3-3 are similar to historical estimates that ranged from 7.5x10⁶ to 1.7x10⁸ kg/year (Figure 3-8). Both the Pahl (2001) and 50-day Katzer and Bennett (1980) estimates were lower than estimated by this project. Pahl used instantaneous TSS concentrations to estimate an average daily loading of 1.2x10⁵ kg/day using data collected between 1980 and 1984 and 1994 and 1998. Katzer and Bennett estimated loads using suspended sediment concentrations (SSC) over a 50-day period in 1978 at a site downstream of Riverview. Pahl’s loading estimate was likely biased low due to his use of TSS data collected by NDEP. Research has indicated that the TSS method typically underreports that measured by the suspended sediment concentration (SSC) method used by the other investigators discussed here (Gray et al., 2000). This bias is thought to be greater in samples that contained a significant proportion of sand-sized sediment, such as those collected during storm events. For the Carson River Basin, Alvarez and Seiler (2004) report that TSS can underreport SSC by 30 to 40 percent. Caution should be used in interpreting Figure 3-8, as neither Pahl nor Katzer and Bennett scaled their results to a yearly timeframe, as they did not have a high enough sampling density to adequately reflect loadings from different types of hydrologic events.

21
Katzer and Bennett (1980) also estimated suspended sediment loading downstream of Riverview during a discontinuous 15-year period between 1926 and 1949. Expressed on a yearly basis, they estimated a loading of 4.6x10⁷ kg/year during a time period that had an average yearly discharge of 335 cfs. Garcia and Carman (1986) estimated loading at multiple sites along the Carson River in 1980 using the sediment rating curve approach based on SSC measurements. Their estimates included 1.7x10⁸ kg/year at Riverview, 8.1x10⁶ kg/year at Diamond Valley, and 1.5x10⁸ kg/year at Brunswick Canyon, with average yearly discharges of 525, 168, and 635 cfs, respectively. Both the 15-year Katzer and Bennett and the Garcia and Carman estimates were greater than estimated by this project. Direct comparison of these results is difficult due to the highly variable management of the Carson River over the last 120 years that has resulted in significant channel modifications including both diversions and structural modifications (Katzer and Bennett, 1980).
Figure 3-8. Comparison of suspended sediment/solids loadings and average yearly discharge at
Riverview. DRI estimates are the turbidity-based estimates for 2004 through 2006. See text for description of other estimates. Partial-year estimates from Pahl (2001) and Katzer and Bennett (1980) were linearly scaled to a yearly basis for comparison. Pahl’s analysis was based on TSS data collected by NDEP, whereas the other datasets utilized suspended sediment concentration data collected by the USGS.

22
4.0 ESTIMATION OF HISTORICAL DATA
4.1 Total Suspended Solids
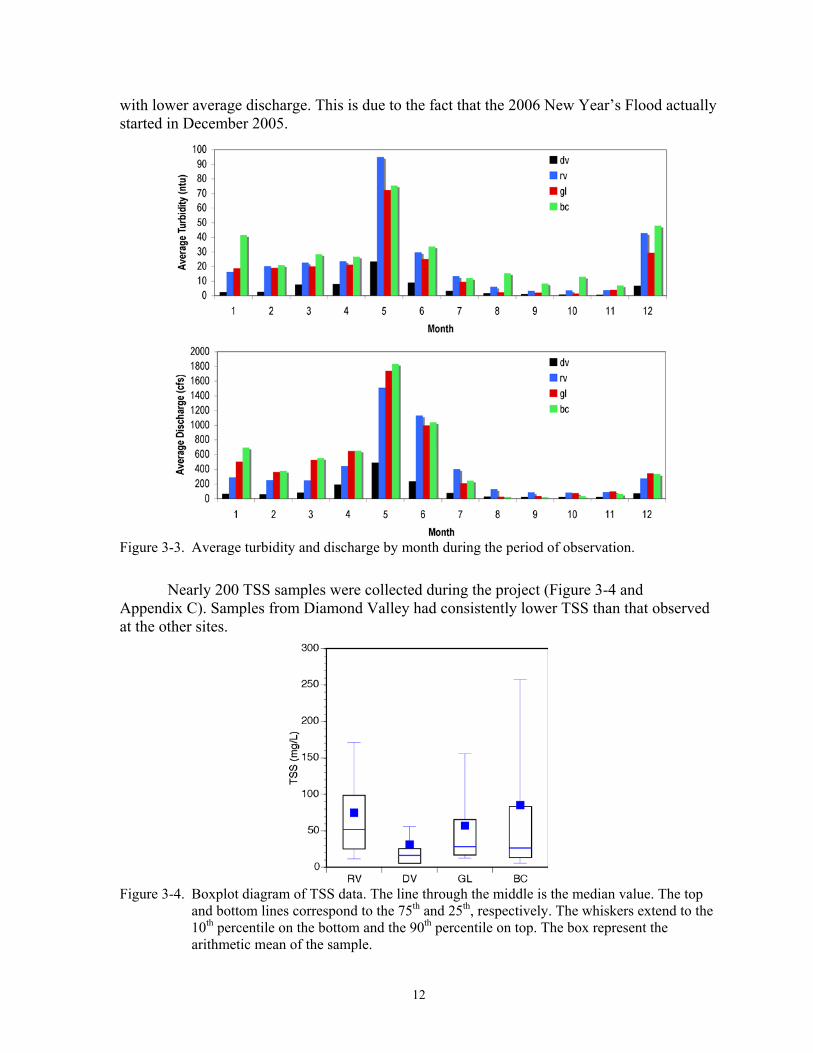
The only historical record of near-continuous data was discharge; thus, the discharge-based relationships (Table 3-2) were used to estimate historical average daily TSS concentrations (Figure 4-1) and TSS loading (Table 4-1). The ability of the regressions to hindcast TSS samples can be compared to the approximately 50 samples per site that NDEP collected during WY1995 to WY2006. A rigorous comparison of historical NDEP data with hindcast TSS concentrations was not attempted, as nearly 60 percent of all NDEP-collected TSS samples were below the detection limit, with the remaining samples characterized by relatively low TSS concentrations. This was a direct result of NDEPs routine sampling schedule that resulted in the collection of samples primarily during lower flow periods. Yearly suspended solids loads are dominated by events having high TSS concentrations, so an effective assessment of the hindcast TSS predictions requires a greater number of samples collected during moderate and high TSS concentrations events. Mean relative percent differences (mRPDs) were calculated between historic predictions and the NDEP dataset, and ranged between 41 and 64 percent for TSS (Table 4-2). The exclusion of samples that were below the detection limit increased mRPDs between 22 and 42 percent, with the greatest improvements observed at Diamond Valley and Riverview, sites whose TSS dataset contained a greater proportion of TSS samples that were less than 10 mg/L. Caution must be exercised when interpreting other reports that are based solely on the historical NDEP data, as interpretations regarding TSS concentrations and turbidity are likely to be biased low due to the low number of NDEP-collected samples taken during high flow and high TSS concentration periods.
4.2 Turbidity Historic turbidity levels (Figure 4-2) were estimated by developing a relationship
between turbidity and discharge measured at 15-minute intervals during the period of observation (Table 4-3). Correlation coefficients for all sites were between 0.50 and 0.53, and improved slightly with the use of common transformations, but the linear relationships were used for simplicity. Predicted values appeared to be similar to historic NDEP samples, however, the lack of high turbidity samples in the NDEP dataset precludes a more thorough assessment. The relationships developed between turbidity and discharge, especially during higher flows, were complicated by hysteresis. Hysteresis occurs when a given parameter, such as turbidity, is observed to have a different relationship with discharge during the rising limb of an event hydrograph compared to the falling limb. The degree to which hysteresis occurs is dependent on a number of site-specific, event-specific, spatially complex but inter-dependent factors. For example, the source of particles entrained in the water column will vary as stage increases (variable source area), and particle sizes will increase as the water velocity increases. As water velocities decrease and/or particle sources are depleted, suspended solids will decline.
Figure 4-1. Total suspended solids (TSS) estimated for the historic period (WY1995 through WY2006). At Genoa Lakes, data prior to 2002 were based on discharge from a downstream USGS gaging station (10311000). NDEP TSS data prior to 2004 that was below the reporting limit was reported by NDEP as an estimated value.
23
Diamond Valley
0
10
20
30
40
50
60
70
80
TSS
(mg/L
)
NDEP valueNAC StandardHind-cast valueTSS Reporting Limit
1997 Flood
Riverview
0
50
100
150
200
250
300
350
400
450
500
Oct-94 Oct-98 Oct-02 Oct-06
TSS
(mg/L
)
NDEP valueNAC StandardHind-cast value
1997 Flood
( 221 mg/L)
( 1609 mg/L)
( 775 mg/L)
( 598 mg/L)

Figure 4-1. Total suspended solids (TSS) estimated for the historic period (WY1995 through WY2006). At Genoa Lakes, data prior to 2002 were
based on discharge from a downstream USGS gaging station (10311000). NDEP TSS data prior to 2004 that was below the reporting limit was reported by NDEP as an estimated value. (continued).
24
Genoa Lakes
0
50
100
150
200
250
300
350
TSS
(mg/L
)
NDEP valueNAC StandardHind-cast value
1997 Flood
Brunswick Canyon
0
50
100
150
200
250
300
Oct-94 Oct-98 Oct-02 Oct-06
TSS
(mg/L
)
NDEP valueNAC StandardHind-cast value
1997 Flood
( 1728 mg/L)
( 1429 mg/L)
( 557 mg/L)

25
Table 4-1. Estimated TSS loading hindcast using discharge-based relationships. At Genoa Lakes, data prior to 2002 were based on discharge from a downstream USGS gaging station (10311000). Loads were calculated using USGS daily mean discharge values.
Rising Falling Baseflow Total Year Suspended Solids Loading (1x10⁵ kg) Diamond 1995 27 ± 20 30 ± 20 3 ± 6 60 ± 46 Valley 1996 21 ± 17 5 ± 6 3 ± 6 29 ± 29 1997 16 ± 15 4 ± 5 62 ± 33 81 ± 53 1998 14 ± 13 17 ± 14 2 ± 5 33 ± 31 1999 17 ± 14 7 ± 7 2 ± 5 26 ± 26 2000 9 ± 11 2 ± 3 1 ± 3 13 ± 17 2001 5 ± 6 0.5 ± 1 1 ± 2 6 ± 10 2002 8 ± 10 2 ± 3 1 ± 3 11 ± 15 2003 10 ± 10 5 ± 5 1 ± 3 16 ± 18 2004 7 ± 9 1 ± 2 1 ± 3 9 ± 14 2005 19 ± 14 5 ± 6 1 ± 3 26 ± 23 2006 23 ± 17 7 ± 7 7 ± 8 36 ± 32 Riverview 1995 313 ± 452 828 ± 742 15 ± 55 1,156 ± 1,249 1996 428 ± 484 134 ± 230 21 ± 60 583 ± 775 1997 186 ± 394 48 ± 147 904 ± 445 1,137 ± 987 1998 68 ± 217 258 ± 439 8 ± 28 335 ± 683 1999 238 ± 328 167 ± 295 9 ± 33 415 ± 656 2000 108 ± 263 16 ± 64 7 ± 24 131 ± 351 2001 55 ± 186 3 ± 11 3 ± 10 61 ± 207 2002 59 ± 195 19 ± 64 4 ± 14 82 ± 273 2003 124 ± 185 97 ± 169 6 ± 20 227 ± 375 2004 44 ± 162 7 ± 21 4 ± 12 55 ± 196 2005 395 ± 394 159 ± 310 6 ± 18 560 ± 723 2006 503 ± 503 247 ± 340 112 ± 133 861 ± 976 Genoa 1995 498 ± 346 643 ± 362 21 ± 97 1,162 ± 804 Lakes 1996 372 ± 307 87 ± 111 67 ± 146 527 ± 564 1997 237 ± 258 59 ± 85 1,869 ± 650 2,165 ± 992 1998 190 ± 214 326 ± 245 15 ± 100 531 ± 559 1999 258 ± 229 130 ± 134 38 ± 132 426 ± 494 2000 83 ± 145 11 ± 36 14 ± 79 108 ± 259 2001 36 ± 91 0.3 ± 6 3 ± 43 39 ± 140 2002 41 ± 103 10 ± 28 3 ± 38 54 ± 169 2003 96 ± 116 56 ± 63 6 ± 50 158 ± 229 2004 45 ± 115 2 ± 15 4 ± 39 51 ± 169 2005 377 ± 248 113 ± 125 4 ± 49 494 ± 422 2006 402 ± 309 117 ± 123 190 ± 172 708 ± 604 Brunswick 1995 403 ± 175 555 ± 195 40 ± 56 998 ± 426 Canyon 1996 350 ± 170 95 ± 63 91 ± 84 537 ± 317 1997 245 ± 146 56 ± 43 1,316 ± 310 1,617 ± 499 1998 205 ± 122 293 ± 133 36 ± 56 534 ± 311 1999 245 ± 124 127 ± 72 60 ± 74 433 ± 269 2000 89 ± 76 15 ± 19 30 ± 44 134 ± 139 2001 47 ± 49 1 ± 3 11 ± 22 60 ± 75 2002 59 ± 60 15 ± 16 13 ± 24 88 ± 101 2003 96 ± 64 65 ± 40 20 ± 33 180 ± 137 2004 63 ± 65 6 ± 9 12 ± 22 81 ± 96 2005 315 ± 131 98 ± 65 17 ± 31 430 ± 226 2006 445 ± 184 161 ± 83 272 ± 113 878 ± 380

26
Table 4-2. Median relative percent difference (mRPD) between NDEP samples and estimated historic samples from 1994 through 2006. For turbidity, estimated historic samples below zero were set to zero. The maximum possible mRPD is 200 percent.
TSS TU Count Site mRPD (%) mRPD (%)
Full NDEP Dataset Diamond Valley 64 200 50 Riverview 68 137 48 Genoa Lakes 52 52% 47 Brunswick Canyon 41 200 45
NDEP Dataset where TSS ≥ 10 mg/L Diamond Valley 22 115 19 Riverview 38 104 24 Genoa Lakes 42 45 34 Brunswick Canyon 41 126 34
Table 4-3. Relationship between turbidity and discharge. The dataset included 15-minute turbidity
data measured at each site by DRI and 15-minute discharge data provided by the USGS . Site Relationship R2 Diamond Valley TU = 0.05148⋅Q – 0.34667 0.53 Riverview TU = 0.07410⋅Q – 9.87608 0.50 Genoa Lakes TU = 0.04955⋅Q – 5.88498 0.52 Brunswick Canyon TU = 0.05041⋅Q + 2.15195 0.50
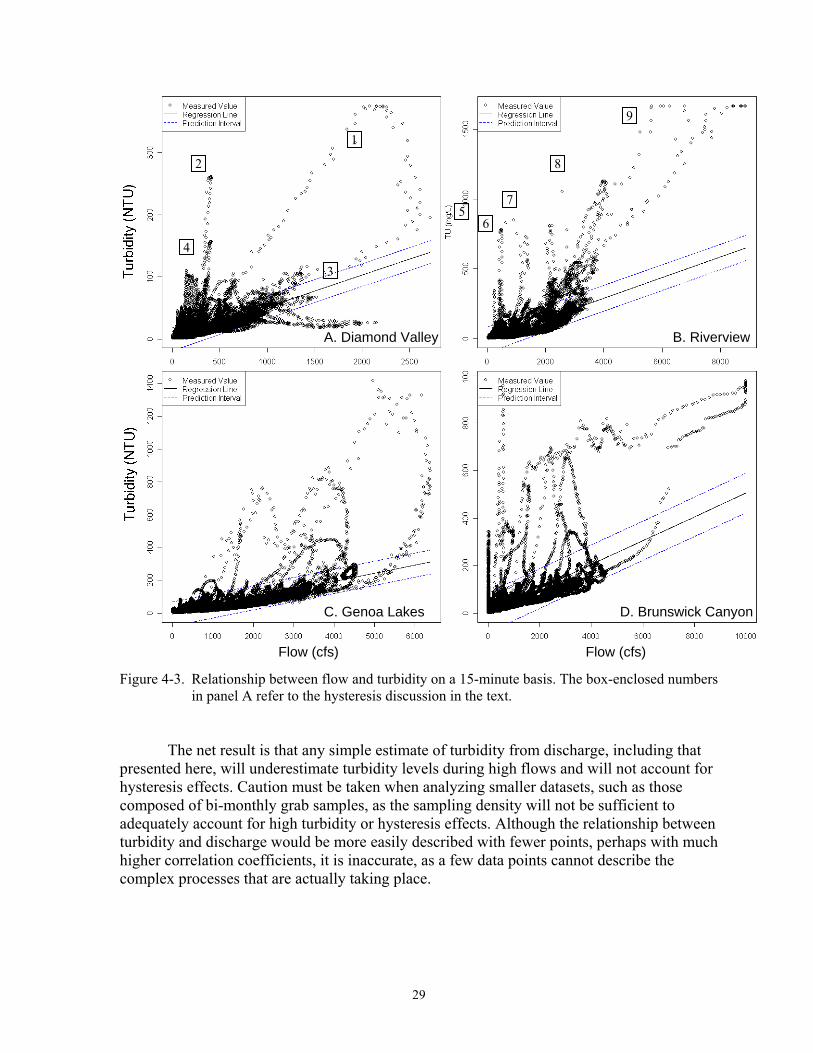
Hysteresis is observed in Figure 4.3 by following the circular path of individual 15-minute data points during a hydrologic event. For example, four sets of hysteresis curves (denoted by the box-enclosed numbers) are easily discernible at Diamond Valley (Figure 4.3A). Curve 1 represented the 2006 New Year’s Flood that resulted in the greatest flows at all four sites. Hysteresis was evident, as turbidity per unit flow was over three times greater in the rising limb than in the falling limb of this event. For some events (Curves 2 and 3), turbidity was elevated despite low flows. Curve 2 resulted from a rainstorm on 5/28/04, while the series of peaks that comprised Curve 3 resulted from the first flush phase of the 2004 snowmelt season. Other events, such as the peak flows of the 2005 snowmelt season that comprise Curve 4, had low turbidity despite higher flows.
At Riverview (Figure 4.3B), several rain events exhibited high turbidity per unit flow (Curves 5-7), while the peak snowmelt from 2005 (Curve 8) was similar to the lower portion of the 2006 New Year’s Flood (Curve 9). Figure 4.4 shows how complex hysteresis can be in this system. In a low snowfall year such as 2004 (yellow line), turbidity levels remained low. For a season with greater snowmelt, such as 2005, the rising limb (red) of the seasonal hydrograph delivered greater turbidity levels and was more susceptible to hysteresis than the falling limb (dark blue). For 2006, turbidity per unit flows were lower during the rising limb (orange), despite greater peak flows than 2005. This occurred as both the 2006 New Year’s flood (green) and a rain event (blue) previously flushed the easily mobile suspended solids out of the system.

Figure 4-2. Daily turbidity estimated for the historic period (WY1995 through WY2006). At Genoa Lakes, data prior to 2002 were based on
discharge from a downstream USGS gaging station (10311000).
27
Diamond Valley
0
10
20
30
40
50
60
70
80
90
100
Turb
idity
(NTU
)
NDEP valueNAC StandardHind-cast value
1997 Flood
Riverview
0
50
100
150
200
250
300
Oct-94 Oct-98 Oct-02 Oct-06
Turb
idity
(NTU
)
NDEP valueNAC StandardHind-cast value
1997 Flood
(282 NTU)
( 1052 NTU)( 360 NTU)

Figure 4-2. Daily turbidity estimated for the historic period (WY1995 through WY2006). At Genoa Lakes, data prior to 2002 were based on
discharge from a downstream USGS gaging station (10311000) (continued).
28
Genoa Lakes
0
50
100
150
200
250
300
Turb
idity
(NTU
)
NDEP valueNAC StandardHind-cast value
1997 Flood
Brunswick Canyon
0
50
100
150
200
250
Oct-94 Oct-98 Oct-02 Oct-06
Turb
idity
(NTU
)
NDEP valueNAC StandardHind-cast value
1997 Flood
( 1287 NTU)
( 1141 NTU)( 423 NTU)
29
Flow (cfs) Flow (cfs)
A. Diamond Valley B. Riverview
C. Genoa Lakes D. Brunswick Canyon
Figure 4-3. Relationship between flow and turbidity on a 15-minute basis. The box-enclosed numbers
in panel A refer to the hysteresis discussion in the text. The net result is that any simple estimate of turbidity from discharge, including that
presented here, will underestimate turbidity levels during high flows and will not account for hysteresis effects. Caution must be taken when analyzing smaller datasets, such as those composed of bi-monthly grab samples, as the sampling density will not be sufficient to adequately account for high turbidity or hysteresis effects. Although the relationship between turbidity and discharge would be more easily described with fewer points, perhaps with much higher correlation coefficients, it is inaccurate, as a few data points cannot describe the complex processes that are actually taking place.
1
2
4
3
56
7
8
9

30
Figure 4-4. Hysteresis relationship and discharge at the Brunswick Canyon site. The colored areas are: yellow=2004 snowmelt season, red=rising limb of 2005 snowmelt season, blue=falling limb of 2005 snowmelt season, green=2006 New Year’s Flood, light blue= rain event, orange= rising limb of 2006 snowmelt season, pink=falling limb of 2006 snowmelt season.

31
5.0 EXCEEDANCE OF NEVADA STATE STANDARDS
The frequency and duration with which the Nevada state TSS and turbidity standards were exceeded were investigated utilizing the observed data collected during WY2004 through WY2006 and the predicted historical data from WY1995 through WY2006. Three approaches were utilized, including percent standard exceedance, exceedance probability curves, and duration-exceedance curves. Percent standard exceedance provides the percent of time that the Nevada standard was exceeded within a given time period. Exceedance probability curves provide a graphical way to show the likelihood that a given TSS or turbidity level was exceeded. Finally, duration-exceedance curves show how long an exceedance event may last once the standard has been exceeded.
5.1 Percent Standard Exceedance
5.1.1. Period of Observation
From March 2004 through September 2006, TSS concentrations were observed to exceed the Nevada standards (Table 2-2) between 7 percent and 13 percent of the time (Table 5-1). Seasonally, the bulk of these exceedances began during the rising limb of the seasonal snowmelt hydrograph, where the TSS standards were exceeded between 18 percent and 27 percent of the time.
Table 5-1. Percent exceedances for TSS and turbidity during the period of observation. The TSS
standard is 25 mg/L at Diamond Valley and 80 mg/L at the other three sites. TSS was estimated using turbidity-based relationships in Table 3-1. The Nevada turbidity standard is 10 NTU at all sites. Turbidity data were based on in situ turbidimeter readings. The period of observation was defined in Table 2-1. Rising refers to the rising limb of seasonal snowmelt in April and May, falling to the falling limb in June and July, with baseflow representing the rest of the water year.
Sample Diamond Valley Riverview Genoa Brunswick Canyon TSS – Period of Observation
All Data 7 9 11 13 Rising 18 27 22 25 Falling 3 6 8 10 Baseflow 1 2 3 7
Turbidity – Period of Observation All Data 14 43 60 68 Rising 37 77 86 71 Falling 12 59 70 60 Baseflow 2 23 33 52
Turbidity standards were exceeded more often than TSS standards, and the percent exceedance was much more variable between different sites and during different seasons. At the low end, Diamond Valley exceeded State standards 14 percent of the time during the period of observation, and 37 percent of the time during the rising limb of the snowmelt hydrograph. On the high end, Brunswick Canyon exceeded State standards 68 percent of the
32
time, with a marginally higher exceedance percentage (71%) during the rising limb. The frequency of turbidity exceedances increased moving downstream from Riverview to Brunswick Canyon, primarily a response to a higher frequency of exceedances during baseflow conditions. Baseflow conditions had a controlling influence on the entire dataset, as the baseflow period represented seven months out of the water year. Baseflow exceedances at Genoa Lakes were less frequent than at Brunswick Canyon, but were offset by the highest percent exceedance observed in both the rising and falling limbs.
Differences between the frequency of TSS and turbidity exceedances were attributed to two factors. First, the Nevada state standards for TSS and turbidity appear to have been determined independently from each other despite the fact that these two parameters are inter-related (Section 3). The linear equations between TSS and turbidity presented in Table 3-1 can be used to convert the existing Nevada TSS standards to their equivalent turbidity:
1) 22 ± 22 NTU at Diamond Valley with a TSS threshold of 25 mg/L. 2) 63 ± 32 NTU at Riverview with a TSS threshold of 80 mg/L. 3) 52 ± 20 NTU at Genoa Lakes with a TSS threshold of 80 mg/L. 4) 51 ± 31 NTU at Brunswick Canyon with a TSS threshold of 80 mg/L.
Likewise, the existing Nevada turbidity standards can be converted to their TSS equivalent:
5) 16 ± 20 mg/L of TSS at Diamond Valley with a turbidity threshold of 10 NTU. 6) <5 ± 50 mg/L of TSS at Riverview with a turbidity threshold of 10 NTU. 7) 15 ± 31 mg/L of TSS at Genoa Lakes with a turbidity threshold of 10 NTU. 8) 26 ± 43 mg/L of TSS at Brunswick Canyon with a turbidity threshold of 10 NTU.
The equivalent turbidity levels based on current Nevada TSS thresholds (1 through 4) are a factor of two higher at Diamond Valley, and a factor of five to six higher at the other three sites compared to current Nevada turbidity thresholds. Conversely, the equivalent TSS concentrations based on current Nevada turbidity thresholds (5 through 8) are 1.5, 32, 5, and 3 times lower than current Nevada TSS thresholds at Diamond Valley, Riverview, Genoa Lakes, and Brunswick Canyon, respectively. The net result is that Nevada’s current turbidity threshold is much more restrictive than the current TSS threshold at all four sites. This creates an ambiguity, as the same physical processes control turbidity levels and TSS concentrations in the river. This ambiguity can be resolved by linking turbidity and TSS thresholds with relationships like that presented in Table 3-1 when the thresholds are next revised.
A second factor contributing to the greater turbidity exceedances, especially during baseflow, was the sensitivity of turbidity readings to factors other than suspended solids. Turbidity is an optical measurement that is affected by a variety of factors, including the color of the water, the presence of organic materials, and the shape and size of particles contributing to suspended solids. Variations in any of these factors can cause apparent changes in turbidity readings despite a consistent suspended solids concentration. Although specific information is not available on how these factors affect the DTS-12 sensors used in this study, data from a similar sensor (OBS-3) shows that the sensitivity of the sensor can easily change four-fold as particles increase from 10 um to 100 um in diameter, with 200-fold changes observed over the broader particle size scale (D&A Analytical, Sediment

33
Size Effects. http://www.d-a-instruments.com/sand_mud.html. Accessed on July 23, 2007; Conner and Visser, 1992; Ludwig and Hanes, 1990). As a result, the apparent turbidity reported by the sensor will decrease with increasing particle size for a given concentration of suspended solids. The inherent degree of susceptibility of a turbidity sensor to each of the aforementioned factors is manufacturer and sensor specific, as there is a wide range of optical techniques that can be employed to measure turbidity. The greater number of exceedances of the turbidity standard, especially during baseflow conditions, may be partly due to these factors affecting turbidity readings. Water samples collected during the summer and fall were more highly colored and likely had greater levels of organic matter and finer suspended solids than the upstream sites, factors that would result in higher apparent turbidity. These factors are an important reason why turbidity/TSS relationships must be developed specifically for each site.
5.1.2. Predicted Historic Period
Historic period exceedances differed from the period of observation exceedances in two important ways. First, historic TSS was estimated from discharge-based (Table 3-2) rather than from turbidity-based (Table 3-1) data. Secondly, the historic data included 12 years of predicted data from WY1995 through WY2006, rather than the 30 months of observed data during the period of observation. The latter dataset is not subject to predictive error because it was observed directly, whereas the former dataset was subject to predictive error, but encompassed a much wider variety of hydrologic and climatic conditions.
Overall, the frequency at which the TSS and turbidity standards were exceeded was similar for both the historic (Table 5-2) and observed (Table 5-1) datasets, with a few exceptions. First, the TSS standard was violated three to four times more often in the historic data, indicating that historic snowmelt events occurred later in the year, and thus did not fit into the June 1 delineation between the rising and falling limbs based on observed data. Second, baseflow exceedances during the historic period occurred less often than during the observed period. Third, the percent of turbidity exceedances was much more variable for the historic dataset than for the observed dataset. Table 5-2. Percent exceedances for TSS and turbidity standards during the historic period. The TSS
standard at Diamond Valley is 25 mg/L and 80 mg/L at the other three sites. The Nevada turbidity standard is 10 NTU at all sites. Results are based on estimates from discharge-based relationships.
Sample Diamond Valley Riverview Genoa Brunswick Canyon
TSS – Historic All Data 7 10 11 12 Rising 17 17 20 22 Falling 13 28 26 28 Baseflow <1 1 2 2
TU – Historic All Data 18 37 34 49 Rising 45 76 70 77 Falling 34 71 66 67 Baseflow 1 83 6 20
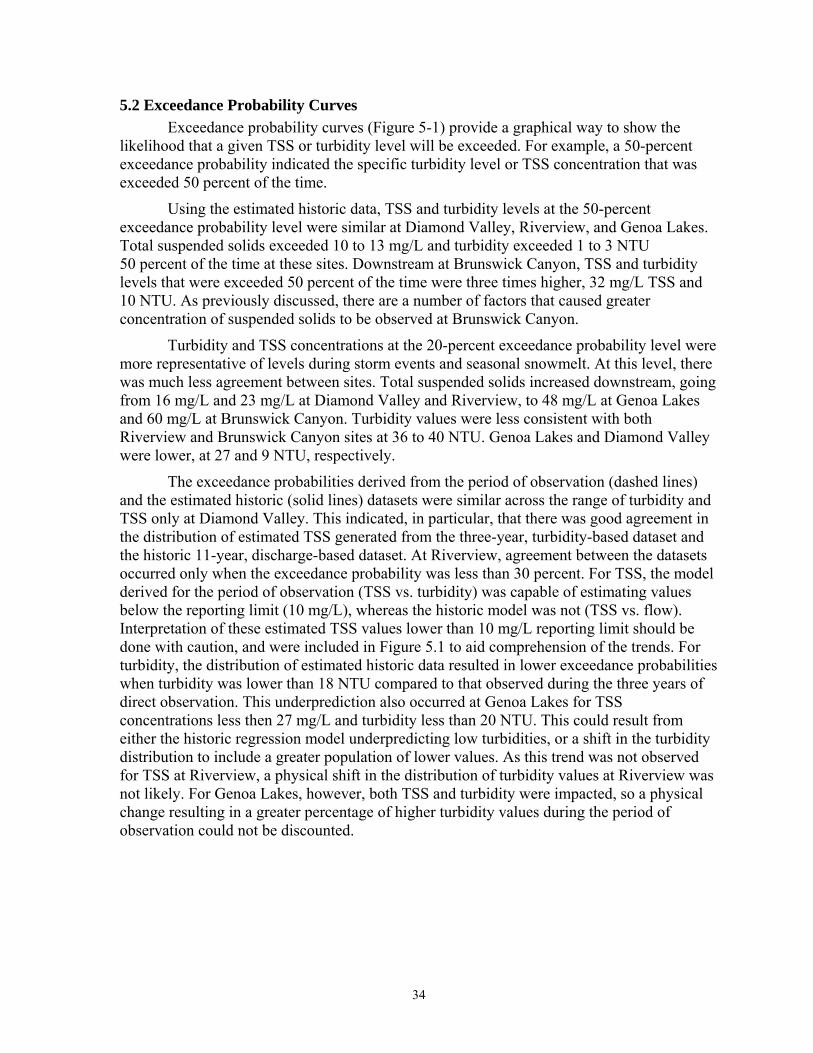
34
5.2 Exceedance Probability Curves Exceedance probability curves (Figure 5-1) provide a graphical way to show the
likelihood that a given TSS or turbidity level will be exceeded. For example, a 50-percent exceedance probability indicated the specific turbidity level or TSS concentration that was exceeded 50 percent of the time.
Using the estimated historic data, TSS and turbidity levels at the 50-percent exceedance probability level were similar at Diamond Valley, Riverview, and Genoa Lakes. Total suspended solids exceeded 10 to 13 mg/L and turbidity exceeded 1 to 3 NTU 50 percent of the time at these sites. Downstream at Brunswick Canyon, TSS and turbidity levels that were exceeded 50 percent of the time were three times higher, 32 mg/L TSS and 10 NTU. As previously discussed, there are a number of factors that caused greater concentration of suspended solids to be observed at Brunswick Canyon.
Turbidity and TSS concentrations at the 20-percent exceedance probability level were more representative of levels during storm events and seasonal snowmelt. At this level, there was much less agreement between sites. Total suspended solids increased downstream, going from 16 mg/L and 23 mg/L at Diamond Valley and Riverview, to 48 mg/L at Genoa Lakes and 60 mg/L at Brunswick Canyon. Turbidity values were less consistent with both Riverview and Brunswick Canyon sites at 36 to 40 NTU. Genoa Lakes and Diamond Valley were lower, at 27 and 9 NTU, respectively.
The exceedance probabilities derived from the period of observation (dashed lines) and the estimated historic (solid lines) datasets were similar across the range of turbidity and TSS only at Diamond Valley. This indicated, in particular, that there was good agreement in the distribution of estimated TSS generated from the three-year, turbidity-based dataset and the historic 11-year, discharge-based dataset. At Riverview, agreement between the datasets occurred only when the exceedance probability was less than 30 percent. For TSS, the model derived for the period of observation (TSS vs. turbidity) was capable of estimating values below the reporting limit (10 mg/L), whereas the historic model was not (TSS vs. flow). Interpretation of these estimated TSS values lower than 10 mg/L reporting limit should be done with caution, and were included in Figure 5.1 to aid comprehension of the trends. For turbidity, the distribution of estimated historic data resulted in lower exceedance probabilities when turbidity was lower than 18 NTU compared to that observed during the three years of direct observation. This underprediction also occurred at Genoa Lakes for TSS concentrations less then 27 mg/L and turbidity less than 20 NTU. This could result from either the historic regression model underpredicting low turbidities, or a shift in the turbidity distribution to include a greater population of lower values. As this trend was not observed for TSS at Riverview, a physical shift in the distribution of turbidity values at Riverview was not likely. For Genoa Lakes, however, both TSS and turbidity were impacted, so a physical change resulting in a greater percentage of higher turbidity values during the period of observation could not be discounted.

35
Figure 5-1. Exceedance probability curves for turbidity and TSS for the period of observation (WY2004-WY2006) and the historical period (WY1995-2006).

36
Figure 5-1. Exceedance probability curves for turbidity and TSS for the period of observation (WY2004-WY2006) and the historical period (WY1995-2006) (continued).
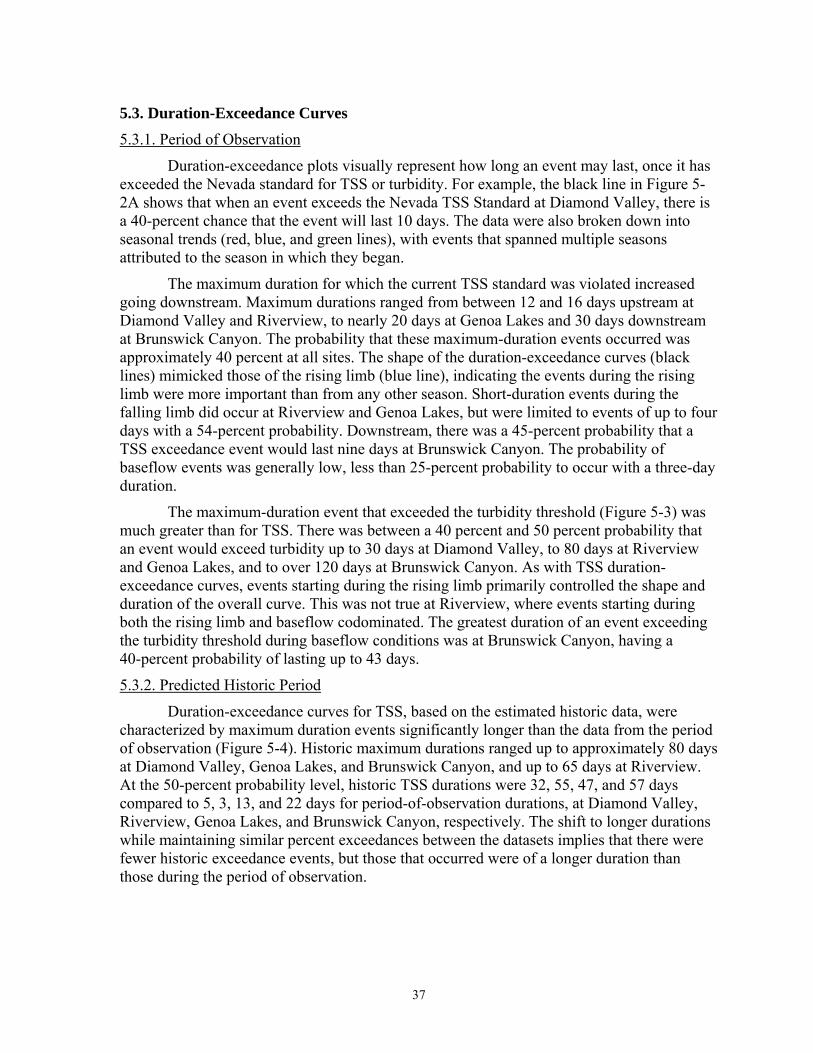
37
5.3. Duration-Exceedance Curves
5.3.1. Period of Observation
Duration-exceedance plots visually represent how long an event may last, once it has exceeded the Nevada standard for TSS or turbidity. For example, the black line in Figure 5-2A shows that when an event exceeds the Nevada TSS Standard at Diamond Valley, there is a 40-percent chance that the event will last 10 days. The data were also broken down into seasonal trends (red, blue, and green lines), with events that spanned multiple seasons attributed to the season in which they began.
The maximum duration for which the current TSS standard was violated increased going downstream. Maximum durations ranged from between 12 and 16 days upstream at Diamond Valley and Riverview, to nearly 20 days at Genoa Lakes and 30 days downstream at Brunswick Canyon. The probability that these maximum-duration events occurred was approximately 40 percent at all sites. The shape of the duration-exceedance curves (black lines) mimicked those of the rising limb (blue line), indicating the events during the rising limb were more important than from any other season. Short-duration events during the falling limb did occur at Riverview and Genoa Lakes, but were limited to events of up to four days with a 54-percent probability. Downstream, there was a 45-percent probability that a TSS exceedance event would last nine days at Brunswick Canyon. The probability of baseflow events was generally low, less than 25-percent probability to occur with a three-day duration.
The maximum-duration event that exceeded the turbidity threshold (Figure 5-3) was much greater than for TSS. There was between a 40 percent and 50 percent probability that an event would exceed turbidity up to 30 days at Diamond Valley, to 80 days at Riverview and Genoa Lakes, and to over 120 days at Brunswick Canyon. As with TSS duration-exceedance curves, events starting during the rising limb primarily controlled the shape and duration of the overall curve. This was not true at Riverview, where events starting during both the rising limb and baseflow codominated. The greatest duration of an event exceeding the turbidity threshold during baseflow conditions was at Brunswick Canyon, having a 40-percent probability of lasting up to 43 days.
5.3.2. Predicted Historic Period
Duration-exceedance curves for TSS, based on the estimated historic data, were characterized by maximum duration events significantly longer than the data from the period of observation (Figure 5-4). Historic maximum durations ranged up to approximately 80 days at Diamond Valley, Genoa Lakes, and Brunswick Canyon, and up to 65 days at Riverview. At the 50-percent probability level, historic TSS durations were 32, 55, 47, and 57 days compared to 5, 3, 13, and 22 days for period-of-observation durations, at Diamond Valley, Riverview, Genoa Lakes, and Brunswick Canyon, respectively. The shift to longer durations while maintaining similar percent exceedances between the datasets implies that there were fewer historic exceedance events, but those that occurred were of a longer duration than those during the period of observation.

38
Figure 5-2. Duration-exceedance curves for TSS during the entire period of observation. The period
of observation was 939 days at Diamond Valley, 877 days at Riverview, 919 days at Genoa Lakes, and 936 days at Brunswick Canyon.

39
Figure 5-3. Duration-exceedance curves for turbidity during the entire period of observation. The
period of observation was 939 days at Diamond Valley, 877 days at Riverview, 919 days at Genoa Lakes, and 936 days at Brunswick Canyon.

40
There were several significant differences in the duration-exceedance curves. First, the overall shape of the historic curve at Riverview was convex rather than concave as at the other sites. As a result, the probability of an exceedance event lasting 50 days at Riverview was 20 percent more probable than at Diamond Valley or Genoa Lakes. Second, the duration of exceedance events during the falling limb with a 50-percent probability increased from 1, 3, 4, and 7 days in the observed data to 22, 5, 18, and 18 days in the historic data at Diamond Valley, Riverview, Genoa Lakes, and Brunswick Canyon, respectively. Finally, of the three different seasons, baseflow trends were the most similar between the two datasets. The maximum duration of baseflow exceedance events increased from 2 to 8 days in the observed data to 4 to 18 days in the historic dataset. The small relative impact difference in baseflow exceedances coincides with the assumption that the Upper Carson River hydrograph is strongly controlled by seasonal snowmelt.
Historic turbidity duration-exceedance curves were also characterized by events of greater duration (Figure 5-5). The maximum duration of an exceedance event ranged from just over 100 days at Diamond Valley and 170 days at Riverview, to nearly 170 days at Genoa Lakes and over 240 days at Brunswick Canyon. At the 50-percent probability level, the exceedance event durations increased from 27, 75, 75 and 120 days in the period of observation to 55, 150, 120, and 240 days at Diamond Valley, Riverview, Genoa Lakes, and Brunswick Canyon, respectively. As with the TSS, Brunswick Canyon was a convex curve, causing at least a 20-percent greater probability than at the other sites

41
Figure 5-4. Duration-exceedance curves for TSS during the WY1995 through WY2006 historic
period.
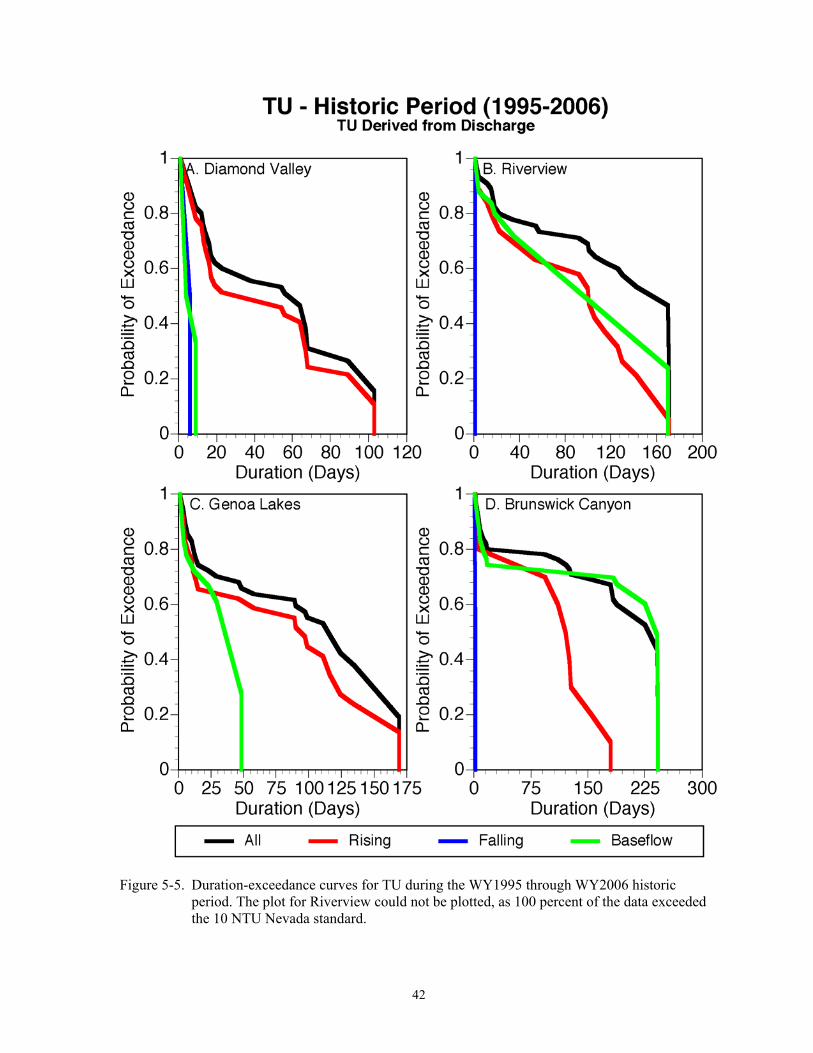
42
Figure 5-5. Duration-exceedance curves for TU during the WY1995 through WY2006 historic
period. The plot for Riverview could not be plotted, as 100 percent of the data exceeded the 10 NTU Nevada standard.

43
6.0 SUMMARY
The objectives of this research were to improve the knowledge of the duration and frequency of suspended solids levels in the Upper Carson River in Nevada. This was accomplished through the establishment of a continuous turbidity record at four sites on the Carson River between March and May 2004 through October 2006. This time period included annual average discharges that were below, equivalent to, and exceeded the 26-year average between 1980 and 2006.
Continuous turbidity was used as a surrogate for TSS concentrations by developing site-specific relationships between discrete TSS samples and turbidity. Average TSS concentrations were estimated on a daily basis, while TSS loadings were estimated on a yearly basis. Continuous turbidity data were not available prior to this study, thus relationships were also developed between discharge and turbidity, and discharge and TSS to predict historical levels of TSS and turbidity from WY1995 through WY2006. Turbidity-based surrogate relationships produced better estimates of TSS concentrations and turbidity than discharge-based relationships, however, both methods produced similar yearly TSS loadings during the period of observation. For the historical predictions, the highest TSS loads were observed in 1997 at 1,137 ± 987 x105 kg at Riverview and 1,617 ± 499 x105 kg at Brunswick Canyon. The smallest loads were observed in 2001at 61 ± 207 x105 kg at Riverview and 60 ± 75 x105 kg at Brunswick Canyon.
Total suspended solids were found to exceed the Nevada State standard between 7 and 13 percent of the time at all sites during the period of observation. Turbidity was more variable across the basin, exceeding the Nevada standard 14 percent of the time at Diamond Valley, 43 percent at Riverview, 60 percent at Genoa Lakes, and 68 percent at Brunswick Canyon. Exceedance events were most likely to occur during the rising limb of seasonal snowmelt, from March through May. The same trends were observed in the predicted historical dataset.
The large discrepancy between the percent exceedance values of TSS and turbidity indicated that the current Nevada thresholds for TSS and turbidity were developed independently, despite the same physical process controlling both parameters. Current Nevada turbidity thresholds were found to be more restrictive than TSS thresholds at all four sites. The relationships developed during this project can be used to mitigate this discrepancy by explicitly linking turbidity levels to TSS concentrations.
During low-flow conditions, turbidity and TSS concentrations were similar between the four sites. However, during higher flows, turbidity levels and TSS concentrations increased downstream. At the 20-percent exceedance probability level, TSS levels were 16 mg/L and 23 mg/L at Diamond Valley and Riverview, 48 mg/L at Genoa Lakes, and 60 mg/L at Brunswick Canyon. When the standard was exceeded during the period of observation, the maximum duration of the event ranged from 12 and 16 days upstream at Diamond Valley and Riverview, to nearly 20 days at Genoa Lakes, and up to 30 days downstream at Brunswick Canyon. For most sites, the events initiated during the rising limb of seasonal snowmelt exerted a controlling influence on the shape and extent of the duration-exceedance curves. Maximum-duration events derived from the estimated historical data were significantly longer, ranging from 65 days at Riverview to about 80 days at Diamond Valley, Genoa Lakes, and Brunswick Canyon. Results indicate that there were a fewer
44
number of historic exceedance events per year during the historic period, but those that occurred had a greater probability of having a longer duration than those during the period of observation.
7.0 ACKNOWLEDGEMENTS
This work was funded under Contract Award # DEP 04-039 by the Nevada Division of Environmental Protection. The authors would like to thank Paul Pugsley (USDA), Todd Mihevc (DRI), and Jim Brock (DRI) for invaluable assistance with site selection and equipment installation. We would also like to thank the Washoe Tribe for providing us access to the Riverview Site on the east fork of the Carson River and to the Genoa Lakes Golf Course for access to the Genoa Lakes sampling site. Last, we thank Paula Adkins, Jeramie Memmott, and Ryan Sharrer for their assistance with fieldwork, and Randy Pahl and Jean Stone at NDEP for their insightful comments throughout the course of this project.
8.0 REFERENCES
Alvarez, N.L. and R.L. Seiler. 2004. Sources of Phosphorus to the Carson River Upstream from Lahontan Reservoir, Nevada and California, Water Years 2001-02. U.S. Geological Survey Scientific Investigations Report 2004-5186.
Bash, J., C. Berman, and S. Bolton. 2001. Effects of Turbidity and Suspended Solids on Salmonids. http://depts.washington.edu/cwws/Outreach/Publications/Salmon%20and%20Turbidity.pdf. Accessed on December 14, 2007.
Conner, C.S. and A.M. De Visser. 1992. A laboratory investigation of particle size effects on an optical backscatterance sensor. Marine Geology 108:151-159.
Dana, G.L., R.B. Susfalk, and P. Verburg. In preparation. Impacts of Land Use on Water Quality in Lake Tahoe Watersheds.
Dana, G.L., A.K. Panorska, R.B. Susfalk, D. McGraw, W.A. McKay, and M. Dornoo. 2004. Suspended Sediment and Tubidity Patterns in the Middle Truckee River, California for the Period 2002-2003. Desert Research Institute Publication No. 41196.
Edwards, T.K. and G.D. Glysson. 1998. Guidance for Collecting Discharge-Weighted Samples in Surface Water Using an Isokinetic Sampler, U.S. Geological Survey Office of Water Quality 99.02/Office of Surface Water 99.01.
Garcia, K.T. and R.L. Carman. 1986. Water-Quality Characteristics and Nutrient and Suspended-Sediment Loads, Carson River and Truckee Canal, Western Nevada, Water Year 1980. U.S. Geological Survey Water-Resources Investigations Report 85-4147.
Gippel, CJ. 1995. Potential of turbidity monitoring for measuring the transport of suspended solids in streams. Hydrological Processes (9):83-97.
Gray, J.R., G.D. Glysson, L.M. Turcios, and G.E. Schwarz. 2000. Comparability of suspended-sediment concentration and total suspended solids data. U.S. Geological Survey Water-Resources Investigations Report 00-4191.
Katzer, T. and J.P. Bennett. 1980. Sediment Transport Model for the east fork of the Carson River, Carson Valley, Nevada. U.S. Geological Survey Open-File Report 80-160.

45
Lewis, J. 1996. Turbidity-controlled suspended sediment sampling for runoff-event load estimation. Water Resources Research 26:2069-2077.
Leoplod L. and T. Maddock. 1953 The hydraulic geometry of stream channels and some physiographic implications U.S. Geological Survey Professional Paper, 57 pp.
Ludwig, K.A. and D. Hanes. 1990. A Laboratory Evaluation of Optical Backscatterance Suspended Solids Sensors Exposed to Sand-mud Mixtures. Marine Geology 94:173-179.
Nevada Division of Environmental Protection. 2002. Nevada’s 2002 303(d) Impaired Waters List. http://ndep.nv.gov/BWQP/303list.pdf. Accessed on August 3, 2007.
Pahl, R. 2001. East Fork Carson River TSS and Turbidity TMDL Evaluation of Available Chemistry and Flow Data for TMDL Development. Nevada Division of Environmental Protection – Bureau of Water Quality Planning.
Shelton, L.R. 1994. Field guide for collecting and processing stream-water samples for the National Water-Quality Assessment Program: U.S. Geological Survey Open-File Report 94-455, 42 p.
Smolen, K.D. 2004. Trout Creek Stream Restoration and Wildlife Enhancement Project: Water Quality Monitoring. M.S. Thesis, Graduate Program of Hydrologic Sciences, University of Nevada, Reno, 134 pp.
Susfalk, R. 2006. Impact of the Rosewood Creek Restoration Project on Suspended Sediment Loading to Lake Tahoe: Pre-Monitoring and Year 1. 2006 Federal Interagency Sedimentation Conference, Reno NV.
Taylor, K., R. Susfalk, M. Shanafield, and G. Schladow. 2004. Near-shore Clarity at Lake Tahoe: Status and Causes of Reduction. Desert Research Institute Publication No. 41193.

46
APPENDIX A: Seasonal TSS Regressions
Regression equations of TSS and discharge by season. Rising limb refers to April and May, falling limb refers to June and July, and baseflow refers to October through March and August through September. DV = Diamond Valley, RV = Riverview, GL = Genoa Lakes, BC = Brunswick Canyon.
Site Season Relationship R2 DV Rising Limb TSS = 0.0420⋅Q + 7.4509 0.5112 DV Falling Limb TSS = 0.0213⋅Q + 8.1645 0.2828 DV Baseflow TSS = 0.0897⋅Q + 14.4588 1.0* RV Rising Limb Exponential Log(TSS) = 0.0013⋅Q + 2.2569 0.8117 RV Falling Limb TSS = 0.0566⋅Q - 34.2760 0.7409 RV Baseflow TSS = 0.0221⋅Q + 73.4229 -0.4963 GL Rising Limb Exponential Log(TSS) = 0.0008⋅Q + 2.8536 0.6716 GL Falling Limb TSS = 0.0545⋅Q - 7.9749 0.907 GL Baseflow TSS = 0.0804⋅Q + 5.3037 0.5225 BC Rising Limb TSS = 0.0517⋅Q + 23.5612 0.7578 BC Falling Limb TSS = 0.0655⋅Q - 2.9567 0.8906 BC Baseflow TSS = 0.0330⋅Q + 29.9459 0.2583 *Only two points included in analysis.
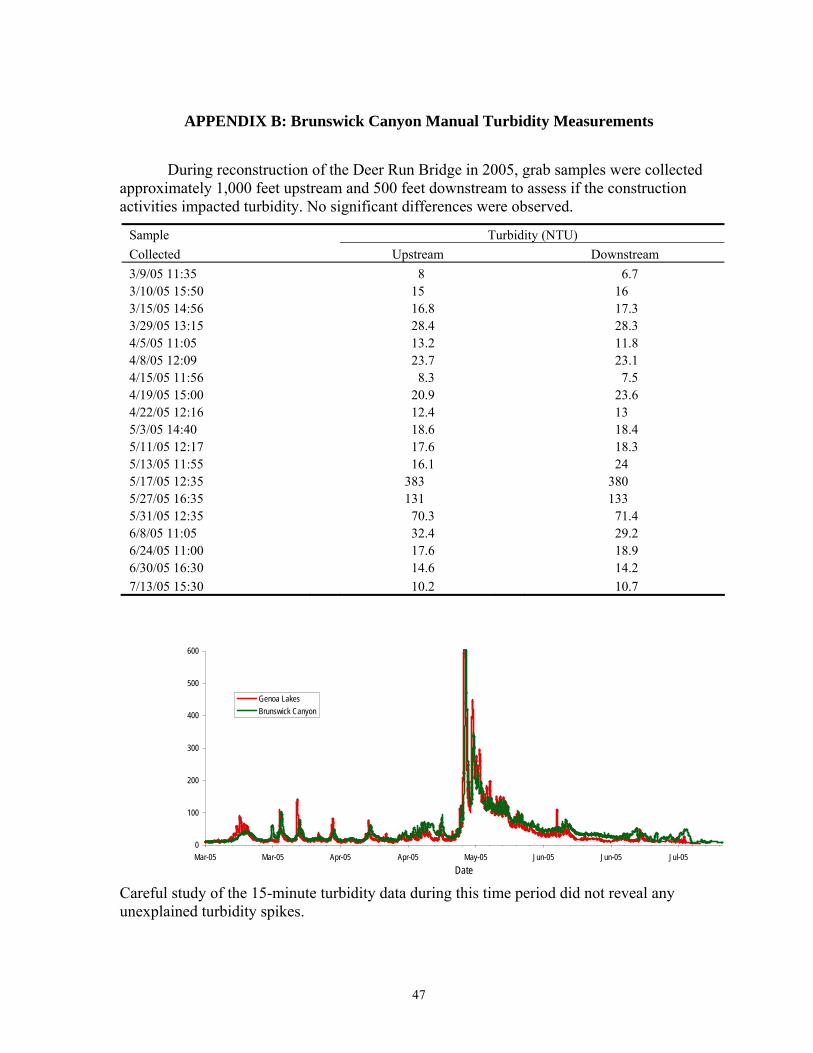
47
APPENDIX B: Brunswick Canyon Manual Turbidity Measurements
During reconstruction of the Deer Run Bridge in 2005, grab samples were collected approximately 1,000 feet upstream and 500 feet downstream to assess if the construction activities impacted turbidity. No significant differences were observed.
Sample Turbidity (NTU) Collected Upstream Downstream 3/9/05 11:35 8 6.7 3/10/05 15:50 15 16 3/15/05 14:56 16.8 17.3 3/29/05 13:15 28.4 28.3 4/5/05 11:05 13.2 11.8 4/8/05 12:09 23.7 23.1 4/15/05 11:56 8.3 7.5 4/19/05 15:00 20.9 23.6 4/22/05 12:16 12.4 13 5/3/05 14:40 18.6 18.4 5/11/05 12:17 17.6 18.3 5/13/05 11:55 16.1 24 5/17/05 12:35 383 380 5/27/05 16:35 131 133 5/31/05 12:35 70.3 71.4 6/8/05 11:05 32.4 29.2 6/24/05 11:00 17.6 18.9 6/30/05 16:30 14.6 14.2 7/13/05 15:30 10.2 10.7
0
100
200
300
400
500
600
Mar-05 Mar-05 Apr-05 Apr-05 May-05 Jun-05 Jun-05 Jul-05Date
Genoa LakesBrunswick Canyon
Careful study of the 15-minute turbidity data during this time period did not reveal any unexplained turbidity spikes.

48
APPENDIX C: TSS Measurements
TSS measured by Nevada State Health Laboratory with a reporting limit of 10 mg/L. Turbidity was measured by the turbidimeter located in the monitoring boom at time water sample for TSS was collected.
TSS Turbidity Sample Collected Site (mg/L) (NTU)
3/25/04 19:00 Brunswick Canyon 74 43.0 4/15/04 16:30 Brunswick Canyon 28 16.9 4/27/04 14:45 Brunswick Canyon 39 19.8 5/5/04 13:45 Brunswick Canyon 140 74.0 5/13/04 15:00 Brunswick Canyon 36 21.5 5/21/04 10:30 Brunswick Canyon 24 16.9 5/27/04 15:00 Brunswick Canyon 14 9.5 6/3/04 14:00 Brunswick Canyon 23 16.8 6/11/04 14:45 Brunswick Canyon 17 9.5 6/24/04 13:15 Brunswick Canyon <10 1.9 7/8/04 17:00 Brunswick Canyon <10 0.8 7/22/04 14:00 Brunswick Canyon <10 1.1 8/10/04 12:45 Brunswick Canyon <10 0.0 10/21/04 15:45 Brunswick Canyon 52 75.0 10/29/04 12:00 Brunswick Canyon <10 5.1 11/4/04 14:30 Brunswick Canyon 13 8.8 1/27/05 13:15 Brunswick Canyon 25 19.8 1/31/05 15:30 Brunswick Canyon 11 9.2 2/15/05 14:45 Brunswick Canyon 14 10.0 2/23/05 11:00 Brunswick Canyon 52 38.4 3/3/05 15:15 Brunswick Canyon 16 9.9 3/10/05 15:30 Brunswick Canyon 37 21.8 3/14/05 15:00 Brunswick Canyon 58 0.0 3/23/05 14:00 Brunswick Canyon 154 62.2 3/29/05 14:00 Brunswick Canyon 54 35.9 4/7/05 10:30 Brunswick Canyon 30 25.6 4/13/05 15:30 Brunswick Canyon 26 20.9 4/19/05 14:15 Brunswick Canyon 54 32.9 4/21/05 9:30 Brunswick Canyon 40 24.5 4/25/05 13:30 Brunswick Canyon 27 16.5 4/29/05 10:15 Brunswick Canyon 60 35.0 5/6/05 10:45 Brunswick Canyon 116 87.8 5/10/05 11:45 Brunswick Canyon 94 51.6 5/16/05 10:15 Brunswick Canyon 190 88.1 5/18/05 8:45 Brunswick Canyon 180 134.0 5/24/05 14:15 Brunswick Canyon 172 144.0 6/1/05 15:15 Brunswick Canyon 192 101.7 6/8/05 10:15 Brunswick Canyon 76 44.9 6/24/05 10:15 Brunswick Canyon 55 30.4

49
TSS Turbidity Sample Collected Site (mg/L) (NTU) 6/29/05 15:45 Brunswick Canyon 49 24.1 7/13/05 14:30 Brunswick Canyon 30 24.5 10/6/05 14:00 Brunswick Canyon 71 35.3 10/6/05 14:15 Brunswick Canyon 14 15.7 10/27/05 15:30 Brunswick Canyon 50 25.4 12/2/05 15:30 Brunswick Canyon 606 345.1 12/28/05 16:15 Brunswick Canyon 71 41.5 1/4/06 17:30 Brunswick Canyon 78 71.7 2/27/06 15:45 Brunswick Canyon 42 19.3 3/28/06 10:45 Brunswick Canyon 28 25.0 5/5/06 10:30 Brunswick Canyon 113 70.8 5/12/06 17:30 Brunswick Canyon 168 116.7 5/19/06 16:00 Brunswick Canyon 218 185.0 5/24/06 17:00 Brunswick Canyon 123 76.7 6/1/06 13:45 Brunswick Canyon 122 63.8 6/6/06 15:45 Brunswick Canyon 152 107.6 6/16/06 12:45 Brunswick Canyon 71 35.1 6/22/06 15:15 Brunswick Canyon 62 35.1 3/25/04 12:45 Diamond Valley 17 9.7 4/1/04 12:30 Diamond Valley 13 8.5 4/15/04 11:00 Diamond Valley <10 0.0 4/27/04 10:00 Diamond Valley 18 11.8 5/5/04 10:00 Diamond Valley 43 25.0 5/13/04 11:30 Diamond Valley 10 5.7 5/20/04 13:00 Diamond Valley <10 0.0 5/27/04 10:45 Diamond Valley 16 8.1 6/3/04 10:30 Diamond Valley <10 0.0 6/11/04 11:00 Diamond Valley 13 3.1 6/24/04 10:00 Diamond Valley <10 3.0 7/8/04 12:45 Diamond Valley <10 2.5 7/22/04 11:00 Diamond Valley <10 2.6 8/10/04 10:00 Diamond Valley <10 0.0 3/14/05 11:45 Diamond Valley 101 4.0 4/7/05 13:30 Diamond Valley 25 9.4 4/13/05 11:30 Diamond Valley <10 3.5 4/19/05 11:15 Diamond Valley 14 9.9 4/21/05 12:30 Diamond Valley <10 4.2 4/25/05 10:45 Diamond Valley <10 0.0 4/29/05 13:00 Diamond Valley 10 16.1 5/3/05 7:00 Diamond Valley 34 23.3 5/6/05 7:00 Diamond Valley 22 19.5 5/10/05 6:30 Diamond Valley 12 11.0 5/16/05 7:15 Diamond Valley 418 154.2 5/18/05 12:45 Diamond Valley 100 43.6 5/19/05 15:00 Diamond Valley 70 40.9 5/24/05 11:00 Diamond Valley 32 26.3 5/26/05 12:45 Diamond Valley 34 24.6
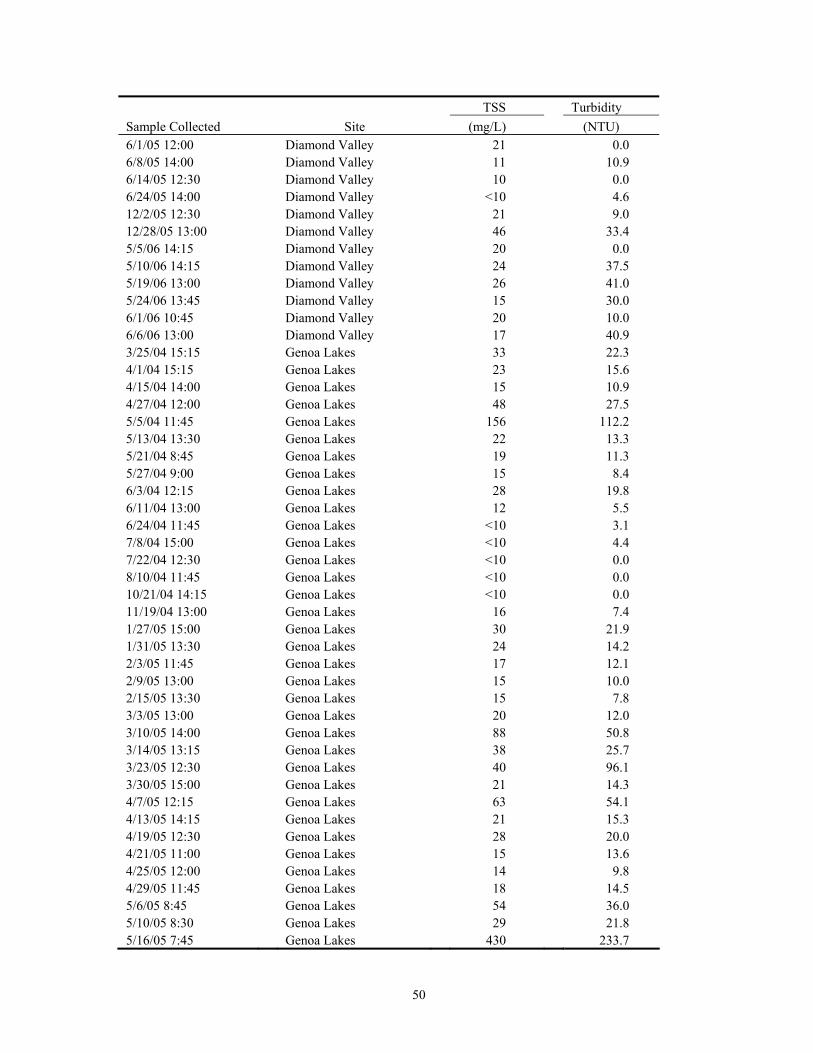
50
TSS Turbidity Sample Collected Site (mg/L) (NTU) 6/1/05 12:00 Diamond Valley 21 0.0 6/8/05 14:00 Diamond Valley 11 10.9 6/14/05 12:30 Diamond Valley 10 0.0 6/24/05 14:00 Diamond Valley <10 4.6 12/2/05 12:30 Diamond Valley 21 9.0 12/28/05 13:00 Diamond Valley 46 33.4 5/5/06 14:15 Diamond Valley 20 0.0 5/10/06 14:15 Diamond Valley 24 37.5 5/19/06 13:00 Diamond Valley 26 41.0 5/24/06 13:45 Diamond Valley 15 30.0 6/1/06 10:45 Diamond Valley 20 10.0 6/6/06 13:00 Diamond Valley 17 40.9 3/25/04 15:15 Genoa Lakes 33 22.3 4/1/04 15:15 Genoa Lakes 23 15.6 4/15/04 14:00 Genoa Lakes 15 10.9 4/27/04 12:00 Genoa Lakes 48 27.5 5/5/04 11:45 Genoa Lakes 156 112.2 5/13/04 13:30 Genoa Lakes 22 13.3 5/21/04 8:45 Genoa Lakes 19 11.3 5/27/04 9:00 Genoa Lakes 15 8.4 6/3/04 12:15 Genoa Lakes 28 19.8 6/11/04 13:00 Genoa Lakes 12 5.5 6/24/04 11:45 Genoa Lakes <10 3.1 7/8/04 15:00 Genoa Lakes <10 4.4 7/22/04 12:30 Genoa Lakes <10 0.0 8/10/04 11:45 Genoa Lakes <10 0.0 10/21/04 14:15 Genoa Lakes <10 0.0 11/19/04 13:00 Genoa Lakes 16 7.4 1/27/05 15:00 Genoa Lakes 30 21.9 1/31/05 13:30 Genoa Lakes 24 14.2 2/3/05 11:45 Genoa Lakes 17 12.1 2/9/05 13:00 Genoa Lakes 15 10.0 2/15/05 13:30 Genoa Lakes 15 7.8 3/3/05 13:00 Genoa Lakes 20 12.0 3/10/05 14:00 Genoa Lakes 88 50.8 3/14/05 13:15 Genoa Lakes 38 25.7 3/23/05 12:30 Genoa Lakes 40 96.1 3/30/05 15:00 Genoa Lakes 21 14.3 4/7/05 12:15 Genoa Lakes 63 54.1 4/13/05 14:15 Genoa Lakes 21 15.3 4/19/05 12:30 Genoa Lakes 28 20.0 4/21/05 11:00 Genoa Lakes 15 13.6 4/25/05 12:00 Genoa Lakes 14 9.8 4/29/05 11:45 Genoa Lakes 18 14.5 5/6/05 8:45 Genoa Lakes 54 36.0 5/10/05 8:30 Genoa Lakes 29 21.8 5/16/05 7:45 Genoa Lakes 430 233.7

51
TSS Turbidity Sample Collected Site (mg/L) (NTU)
5/18/05 11:00 Genoa Lakes 154 118.6 5/24/05 12:30 Genoa Lakes 176 133.2 5/26/05 10:15 Genoa Lakes 164 154.1 6/1/05 13:15 Genoa Lakes 135 72.5 6/8/05 12:45 Genoa Lakes 53 37.5 6/24/05 12:45 Genoa Lakes 51 21.0 6/29/05 14:00 Genoa Lakes 26 13.9 7/13/05 10:00 Genoa Lakes 24 0.0 10/27/05 12:45 Genoa Lakes 18 19.0 12/2/05 13:45 Genoa Lakes 163 83.1 12/28/05 14:30 Genoa Lakes 67 56.9 1/4/06 15:45 Genoa Lakes 65 35.4 2/27/06 13:30 Genoa Lakes 20 12.0 3/28/06 12:45 Genoa Lakes 16 11.6 5/5/06 12:45 Genoa Lakes 88 57.0 5/19/06 14:30 Genoa Lakes 214 155.7 5/24/06 15:15 Genoa Lakes 110 82.0 6/1/06 12:00 Genoa Lakes 69 46.7 6/6/06 14:30 Genoa Lakes 129 74.2 6/16/06 11:15 Genoa Lakes 32 19.3 6/22/06 13:45 Genoa Lakes 37 20.4 5/13/04 9:45 Riverview 15 10.2 5/20/04 10:00 Riverview 13 8.4 5/27/04 12:00 Riverview 11 8.2 6/3/04 17:00 Riverview 27 0.0 6/11/04 9:15 Riverview <10 7.5 6/24/04 8:45 Riverview <10 7.5 7/8/04 10:15 Riverview <10 0.0 7/22/04 9:00 Riverview <10 2.8 8/10/04 9:00 Riverview <10 0.0 1/27/05 17:00 Riverview 12 9.9 3/10/05 11:15 Riverview 64 47.8 3/14/05 10:30 Riverview 20 16.8 3/23/05 10:30 Riverview 13 19.5 4/7/05 14:30 Riverview 38 38.6 4/13/05 10:30 Riverview 12 12.5 4/19/05 10:15 Riverview 23 20.3 4/29/05 13:45 Riverview 15 41.1 5/3/05 5:15 Riverview 96 126.5 5/6/05 5:45 Riverview 43 62.7 5/10/05 5:30 Riverview 26 41.5 5/16/05 5:00 Riverview 550 385.3 5/18/05 14:00 Riverview 696 438.2 5/19/05 13:15 Riverview 416 323.1 5/24/05 9:30 Riverview 220 419.3 5/26/05 12:30 Riverview 148 116.9 6/1/05 10:45 Riverview 117 107.9

52
TSS Turbidity Sample Collected Site (mg/L) (NTU)
6/8/05 15:00 Riverview 30 36.3 6/14/05 14:30 Riverview 40 52.4 6/24/05 15:15 Riverview 23 16.1 6/29/05 10:30 Riverview 18 15.0 7/13/05 12:45 Riverview 13 10.7 12/2/05 11:30 Riverview 257 201.5 12/28/05 11:45 Riverview 56 63.5 1/4/06 12:45 Riverview 16 39.9 2/27/06 10:15 Riverview <10 23.4 3/28/06 15:00 Riverview <10 101.7 5/4/06 15:45 Riverview 81 61.0 5/10/06 11:45 Riverview 77 60.4 5/12/06 15:15 Riverview 92 65.9 5/19/06 10:15 Riverview 280 221.3 5/24/06 12:30 Riverview 57 56.3 6/1/06 9:15 Riverview 48 52.5 6/6/06 11:45 Riverview 98 87.9 6/16/06 8:45 Riverview 24 26.5 6/22/06 11:45 Riverview 26 29.2

53
APPENDIX D: Spatial Investigation of Turbidity
To assess the spatial heterogeneity of turbidity across the river, samples were collected at Brunswick Canyon between March and July 2005. Brunswick Canyon was chosen because it had the slowest water velocities of the four sites studied. Turbidity was measured from each depth-integrated sample prior to placing the sample into the churn splitter. Left, left center, right center, and right refer to the bridge position where the sample was collected. Lab TU refers to the turbidity measured in the final composite sample retrieved from the churn splitter.
Results from a semi-qualitative analysis of variance did not reveal any significant difference between turbidity measured at each position and the composite lab measured turbidity.
Sample Left Left Right Right Lab TU Collected Center Center
3/10/05 15:27 14 13.6 13.6 14.5 13.6 3/29/05 13:40 26 24.9 24.6 25.9 26.4 4/8/05 12:38 22.7 26.6 24.3 23 21.6 4/15/05 12:33 7.21 6.4 6.65 6.4 7 4/19/05 15:05 22.7 22.4 24.4 23.6 25 4/22/05 13:03 13 13.1 13.1 14 12.9 5/3/05 15:40 19.4 19.3 19.6 19 18.8 5/11/05 10:56 18.6 17.9 19 17.4 18 5/13/05 12:41 15.8 16.6 17.9 17.5 18.8 5/17/05 13:42 341 344 372 375 337 5/27/05 15:30 132 135 131 135 127 5/31/05 13:27 76.3 70.8 73.4 71 72.1 6/8/05 10:10 27.3 28.1 31.5 28.4 27.9 6/24/05 10:05 19.5 19.8 18.2 19.7 18.3 6/30/05 15:35 14.6 14.9 14.2 15.4 14 7/13/05 14:20 9.67 10.7 9.85 11.8 11.2